BEHAVIORAL AND NEUROBEHAVIORAL FEATURES OF “SOCIALITY”
by
EVGENIYA LUKINOVA
A DISSERTATION
Presented to the Department of Political Scienceand the Graduate School of the University of Oregon
in partial fulfillment of the requirementsfor the degree of
Doctor of Philosophy
March 2013
ii
DISSERTATION APPROVAL PAGE
Student: Evgeniya Lukinova
Title: Behavioral and Neurobehavioral Features of “Sociality”
This dissertation has been accepted and approved in partial fulfillment of therequirements for the Doctor of Philosophy degree in the Department of Political Scienceby:
Mikhail Myagkov ChairpersonElliot Berkman MemberDavid Steinberg MemberWilliam Terry MemberWesley Wilson Outside Member
and
Kimberly Andrews Espy Vice President for Research and InnovationDean of the Graduate School
Original approval signatures are on file with the University of Oregon Graduate School.
Degree awarded March 2013

iii
©2013 Evgeniya Lukinova
iv
DISSERTATION ABSTRACT
Evgeniya Lukinova
Doctor of Philosophy
Department of Political Science
March 2013
Title: Behavioral and Neurobehavioral Features of “Sociality”
Standard models of decision making fail to explain the nature of the various
important observed patterns of human behavior, e.g. “economic irrationality,” demand for
“sociality,” risk tolerance and the preference of egalitarian outcomes. Moreover, the
majority of models does not account for the change in the strategies of the human beings
playing with other human beings as opposed to playing against a machine.
This dissertation analyzes decision making and its peculiar characteristics in the
social environment under conditions of risk and uncertainty. My main goal is to
investigate why human beings behave differently in a social setting and how the social
domain affects their decision-making process. I develop the theory of “sociality” and
exploit experimental and brain-imaging methodologies to test and refine the competing
theories of individual decision making in the context of the social setting. To explain my
theory I propose an economic utility function for a risk facing decision-maker that
accounts for existing theories of utility defined on the outcomes and simply adds another
term to account for the decision-making process in the social environment. For the
purposes of my dissertation I define “sociality” as the economic component of the utility
function that accounts for social environment, a function of a process rather than of an
v
outcome. I follow on the breakthrough work by evolutionary psychologists in
emphasizing the importance of the substantive context of the social decisions.
The model I propose allows one to think about situations in which individuals
may care for more than their narrowly-defined material interest and their decision may be
driven by “sociality” and other non-monetary considerations. The “sociality” component
of the economic utility function demonstrates the fact that individuals do not only care
about outcomes but also about the processes which lead to these outcomes. In my
empirical chapters I put the theory to the test in a series of laboratory experiments carried
out in the United States, New Zealand and Russia and a series of fMRI and computer
experiments executed at the University of Oregon.
vi
CURRICULUM VITAE
NAME OF AUTHOR: Evgeniya Lukinova
GRADUATE AND UNDERGRADUATE SCHOOLS ATTENDED:
University of Oregon, EugeneMoscow Institute of Physics and Technology, Moscow, Russia
DEGREES AWARDED:
Doctor of Philosophy, Political Science, 2013, University of OregonMaster of Arts, Political Science, 2011, University of OregonMaster of Arts, Economics, 2011, University of OregonMaster of Science, Applied Mathematics and Physics, 2008, Moscow Institute of
Physics and TechnologyBachelor of Science, Applied Mathematics and Physics, 2006, Moscow Institute
of Physics and Technology
AREAS OF SPECIAL INTEREST:
Formal ModelingBehavioral EconomicsNeuroimagingInternational RelationsRussian Politics
PROFESSIONAL EXPERIENCE:
Teaching and Research Assistant, Department of Political Science, University ofOregon, Eugene, 2008-2013
Instructor, Introduction to International Relations, Department of PoliticalScience, University of Oregon, Winter 2013
Co-Instructor, Mafia and Corruption in Russia, Department of Political Science,University of Oregon, Summer 2012
Co-Instructor, Games in Politics, Department of Political Science, University ofOregon, Summer 2012
vii
GRANTS, AWARDS, AND HONORS:
Conference Travel Award, 2012, Department of Political Science, University ofOregon
Gary E. Smith Summer Professional Award, 2012, Graduate School, Universityof Oregon
Graduate School Research Award, 2012, Graduate School, University of Oregon
Interuniversity Consortium for Political and Social Research Award, 2010,Department of Political Science, University of Oregon
Conference Travel Award, 2010, Department of Political Science, University ofOregon
PUBLICATIONS:
Lukinova, E., Myagkov, M., & Ordeshook, P. (2011). Metastasised Fraud inRussia’s 2008 Presidential election in S. White (Ed.), Russia’s Authoritarian Election.Abingdon, Oxfordshire, UK: Routledge, Taylor & Francis Group.
Lukinova, E., Myagkov, M., & Ordeshook, P. (2011). Metastasised Fraud inRussia’s 2008 Presidential election. Europe-Asia Studies, 63(4), 603-621.
Lukinova, E., Myagkov, M., & Ordeshook, P. (2011). Ukraine 2010: WereTymoshenko’s Cries of Fraud Anything More Than Smoke? Post-Soviet Affairs, 27(1),37-63.
Lukinova, E. & Menshikova, O. (2008). Effectiveness of the laboratory marketsparticipants according to his psychological type. Proceedings of the 50th AnnualConference of MIPT. Moscow, Russia.
Lukinova, E. (2006). The use of the real options in management: A shortsummary of “Evaluation of investment projects with the Real Options method”(Bachelor’s thesis). Proceedings of the Institute of System Analysis RAS. Moscow,Russia.
viii
ACKNOWLEDGMENTS
I thank Professor Mikhail Myagkov for a great five years. Misha’s guidance
during the research phase of the dissertation was invaluable. He helped me to identify
fundamental questions to the research. Much of my professional experiences would not
have occurred without his wonderful encouragement and support. I thank Professor
Wesley Wilson for his guidance in econometric modeling and bringing humor at all the
right times. I thank Professor William Terry for his excellent research guidance and
patience with my English skills. I thank Professor David Steinberg for his valuable input.
His challenging questions and insights greatly improved the overall clarity of the
research. I thank Professor Elliot Berkman for his remarkable assistance and, especially,
high marginal value suggestions at the late stages of the dissertation and fMRI chapter.
I received constructive comments and additional help from many other people. I
thank Scott Watrous, Diana Alderette, Chuck Theobald and Jolinda Smith from Lewis
Center for NeuroImaging; Meian Chen, my colleague, who provided incredible assistance
with the experiments; Ron Mitchell and the Department of Political Science; and
discussants and participants at Midwest Political Science Association Conference. Also I
would like to express my greatest appreciation to my roommate, Sandra Mefoude, my
friends and my family for moral support and reassurance for all these five long years.
This research has been supported in part by Mikhail’s Myagkov personal research
fund. IRB Protocol Number 09232011.094 was approved by Research Compliance
Services University of Oregon Institutional Review Board on 21st December 2011.
ix
TABLE OF CONTENTS
Chapter Page
I. INTRODUCTION.................................................................................................... 1
II. THE VALUE OF “SOCIALITY”........................................................................... 5
2.1. Introduction..................................................................................................... 5
2.2. Theory............................................................................................................. 9
2.2.1. Predictions of the Expected Utility Theory ........................................... 9
2.2.2. Alternative Theories............................................................................... 10
2.2.3. Prospect Theory ..................................................................................... 11
2.2.4. Domain of “Sociality” ........................................................................... 13
2.3. Methodology ................................................................................................... 16
2.3.1. Hypotheses............................................................................................. 22
2.4. Data ................................................................................................................. 23
2.4.1. Cross-Cultural Experiments and Replications ....................................... 24
2.4.2. Experimental Design.............................................................................. 24
2.4.3. Summary Statistics................................................................................. 27
2.5. Results............................................................................................................. 27
2.5.1. Second Stage Estimation Results........................................................... 32
2.6. Conclusion ...................................................................................................... 34
III. COOPERATION IN THE SOCIAL DOMAIN .................................................... 37
3.1. Introduction..................................................................................................... 37
3.2. Theory............................................................................................................. 39

x
Chapter Page
3.2.1. Social Domain and Collective Action.................................................... 39
3.2.2. Prisoner’s Dilemma ............................................................................... 40
3.2.3. PD: Experience, Repetition and Learning ............................................. 42
3.2.4. PD: Cultural Aspects ............................................................................. 44
3.2.5. Formal Solution ..................................................................................... 46
3.2.6. Discrete Choice Model .......................................................................... 48
3.3. Methodology ................................................................................................... 49
3.3.1. Hypotheses............................................................................................. 50
3.4. Data ................................................................................................................. 52
3.4.1. Summary Statistics................................................................................. 52
3.5. Results ............................................................................................................ 55
3.6. Conclusion ..................................................................................................... 62
IV. NEUROBEHAVIORAL FEATURES OF “SOCIALITY”................................... 65
4.1. Introduction..................................................................................................... 65
4.2. Theory............................................................................................................. 67
4.2.1. Inequity Aversion................................................................................... 70
4.2.2. Hypotheses ............................................................................................ 71
4.3. Methodology ................................................................................................... 74
4.3.1. Computer Experiment............................................................................ 74
4.3.2. fMRI Experiment ................................................................................... 77
4.4. Data ................................................................................................................. 81
xi
Chapter Page
4.4.1. Computer Laboratory Data .................................................................... 81
4.4.2. fMRI Data .............................................................................................. 81
4.5. Results............................................................................................................. 85
4.5.1. Behavioral Results ................................................................................. 85
4.5.2. fMRI Results .......................................................................................... 87
4.5.3. Discussion.............................................................................................. 99
4.6. Conclusion ...................................................................................................... 101
V. CONCLUSION....................................................................................................... 104
REFERENCES CITED................................................................................................ 109
xii
LIST OF FIGURES
Figure Page
2.1. The Value of “Sociality ........................................................................................ 29
2.2. Percentages of Guessed Decisions for All Experiments....................................... 30
2.3. Value of “Sociality” for Russia............................................................................. 31
2.4. Conditions for Deviating from “Sociality” ........................................................... 32
3.1. Experiment Game Tree ........................................................................................ 46
3.2. Learning Model .................................................................................................... 61
4.1. Game Condition Schedule ................................................................................... 80
4.2. Cooperation (Human vs. Computer) Contrast (BA 8) .......................................... 90
4.3. Cooperation (Human vs. Computer) Contrast (BA 40) ........................................ 91
4.4. Inequity Aversion (Human vs. Computer) Contrast (Caudate) ........................... 92
4.5. Inequity Aversion (Human vs. Computer) Contrast (Putamen) .......................... 93
4.6. Inequity Tolerance (Human vs. Computer) Contrast (BA 13) ............................ 94
4.7. Inequity Tolerance (Human vs. Computer) Contrast (BA 40) ............................. 95
4.8. Welfare vs. Prisoner’s Dilemma Contrast (BA 30) ............................................. 96
4.9. Welfare vs. Prisoner’s Dilemma Contrast (BA 39) ............................................. 97

xiii
LIST OF TABLES
Table Page
2.1. Differences in Predicted Risk Attitudes................................................................ 14
2.2. Process Variables .................................................................................................. 20
2.3. PD Payoffs in the Domain of Gains...................................................................... 26
2.4. PD Payoffs in the Domain of Losses .................................................................... 26
2.5. Summary Statistics................................................................................................ 27
2.6. Ratio of Mean Expected Utilities to Mean Bids ................................................... 28
2.7. Second-Stage Regression with the Process Variables at Time t and αsociality atTime t ..................................................................................................................... 33
2.8. Second-Stage Regression with the Process Variables at Time t-1 and αsociality atTime t ..................................................................................................................... 33
3.1. The Cooperation Rate by Country ........................................................................ 53
3.2. The Cooperation Rate by Framework................................................................... 53
3.3. Independent Variables Summary Statistics .......................................................... 55
3.4. Estimation Results ................................................................................................ 56
3.5. Estimation Results by Country ............................................................................. 57
3.6. Estimation Results by Framework ....................................................................... 58
4.1. PD Payoffs ............................................................................................................ 75
4.2. Welfare Game Payoffs.......................................................................................... 76
4.3. Results of Computer Experiment.......................................................................... 86
4.4. Results of fMRI Experiment................................................................................. 87

xiv
Table Page
4.5. Average Response Times (ms) ............................................................................. 87
1
CHAPTER I
INTRODUCTION
How do people make decisions? Do people like making decisions when they are
surrounded by other people? Do people make decisions with other people using different
processes of decision making that result in different outcomes than when they make these
decisions individually? What brain regions experience increased brain activation when
people make decisions with other people as opposed to playing computer?
As is widely noticed, individuals do not always behave in accordance with rational
choice theory. However, standard models of decision-making fail to explain the nature of
the various peculiar patterns of human behavior, e.g. “economic irrationality,” demand
for “sociality,” risk tolerance and the preference of egalitarian outcomes. Moreover, the
majority of the models does not account for the change in the strategies that human
beings use when they play other human beings as opposed to when they play a machine.
With the abundance of theories and models of decision-making, experiments have an
additional value. Researchers can test which theory fits better due to the control of the
economic environment they possess (Binmore, 2001; J. N. Druckman, Green, Kuklinski,
& Lupia, 2006, 2011).
This dissertation analyzes decision making and its peculiar characteristics in the
social environment under risk and uncertainty. My main goal is to investigate why human
beings behave differently in a social domain and how this domain affects their decision-
making process. I follow on the breakthrough work by evolutionary psychologists
(McDermott, Fowler, & Smirnov, 2008) and emphasize the importance of the substantive
2
context of the social decisions. I develop the theory of “sociality,” and exploit
experimental and brain-imaging methodologies to test and refine the competing theories
of individual decision-making in the context of social setting. To explain my theory I
propose an economic utility function for risk facing decision-maker that accounts for
existing theories of utility defined on the outcomes and add another term to account for
the value that decision-maker assigns toward the decision-making process while
surrounded with his peers. For the purposes of my dissertation I define “sociality” as the
economic component of utility function that accounts for the fact that individuals do not
only care about outcomes, but also about the processes which lead to these outcomes.
The idea that humans may care for more than their narrowly-defined material interest
and that their decisions may be driven by “sociality” and other non-monetary
consideration is not new to behavioral and experimental economists (Frey & Stutzer,
2005). However, economists rarely consider utility functions that include social aspects
(Brock & Durlauf, 2001). On the other hand, social psychologists study social
interactions for nearly 50 years and suggest that decision-making under risk changes in
the social environment. People serve as means for how gains can be obtained or losses
prevented (Tajfel, 1981) and, therefore, risk attitudes do not change between gains and
losses, unlike suggested by Kahneman and Tversky (1979). Nevertheless, social
psychologists rarely formalize their finding of peculiar behavioral patterns or assign a
value to importance of “sociality.”
Furthermore, neuroimaging is seen as the key tool to understand the nature of the
various aspects of human behavior. Use of this methodology has the potential to advance
the knowledge of the existing theoretical accounts of how people make decisions by
3
informing and constraining these models based on the underlying neuroscience. Similar
to my research, neuroscience scholars suggest that many behaviors are aimed at
maximizing social, not personal material outcomes (Zaki & Mitchell, 2011). In contrast
they suggest that social ideals have value in itself, rather than due to the processes in the
domain of “sociality.” I am not able to distinguish between the value in itself and the
value of the processes involved using current experiments, however, this creates an
ambitious goal for future research.
In the chapters below I explore decision making under risk and uncertainty in the
presence of “sociality.” In Chapter II I consider how social domain makes individuals
overcome the risks of social interactions in laboratory experiments and propose a theory
of “sociality” to account for the domain specificity. I define “sociality” as an additional
component of individual’s economic utility function that is a function of a process and
not of an outcome and estimate the value of “sociality” for different cultures and
frameworks. I also examine behavioral properties of the social domain.
In Chapter III I focus not on how individuals overcome risks to enter social
relationships, but on the social interaction itself. I expand on the behavioral features of
the domain of “sociality” by investigating cooperation in Prisoner’s Dilemma games. I
find significant markers of social behavior and how they change with experience, time,
and cultural aspects.
Chapter IV explores the neurobehavioral features of “sociality.” I create and test an
fMRI design that explores the neural correlates for social domain. I also use a similar set
of experiments in the computer laboratory in order assist fMRI experiments and add
statistical power for the behavioral results. All participants complete a political attitudes
4
questionnaire, so that I can correlate decisions made in the experiments to participants’
political affiliation.
In Chapter V I conclude by summarizing the findings of my dissertation project and
discussing applications for political science and avenues for future research. My main
results and conclusions suggest that the notion of “sociality” holds promise for
understanding a wide variety of individual behaviors that cannot be explained by standard
utility theory and alternative theories.
5
CHAPTER II
THE VALUE OF “SOCIALITY”
2.1. Introduction
Do people make purely rational decisions, guided by their economic utility? Or is
human “sociality” a factor in decision making? Do people enjoy making decisions? Do
people make decisions with other people using different processes of decision making
that result in different outcomes than when they make these decisions individually? If
there is a difference in perceived value between decision making that involves similar
social environments then could there be an economic value that can be placed on such
environment and if so, how does it affect decision making and, especially, the decision
making under risk and uncertainty.
Understanding how individuals arrive at decisions and what strategies they use in
social interactions has been a subject of intense interest among a variety of social
scientists, including economists, political scientists, and psychologists. The classical
economic theory of individual decision making, i.e., expected utility theory (Arrow,
1971; Friedman & Savage, 1948), fails to explain a variety of commonly observed human
behaviors such as “economic irrationality” (Becker, 1978), altruism and “altruistic
punishment” (Fehr & Gachter, 2002), demand for “sociality” (T Johnson, Myagkov, &
Orbell, 2004), risk tolerance (Kahneman & Tversky, 1979), and preferences for
egalitarian outcomes (C. F. Camerer & Fehr, 2006). In contrast to classical economic
decision theory as well as to alternative theories, such as prospect theory (Kahneman &
Tversky, 1979), evolutionary psychology (McDermott et al., 2008) emphasizes the
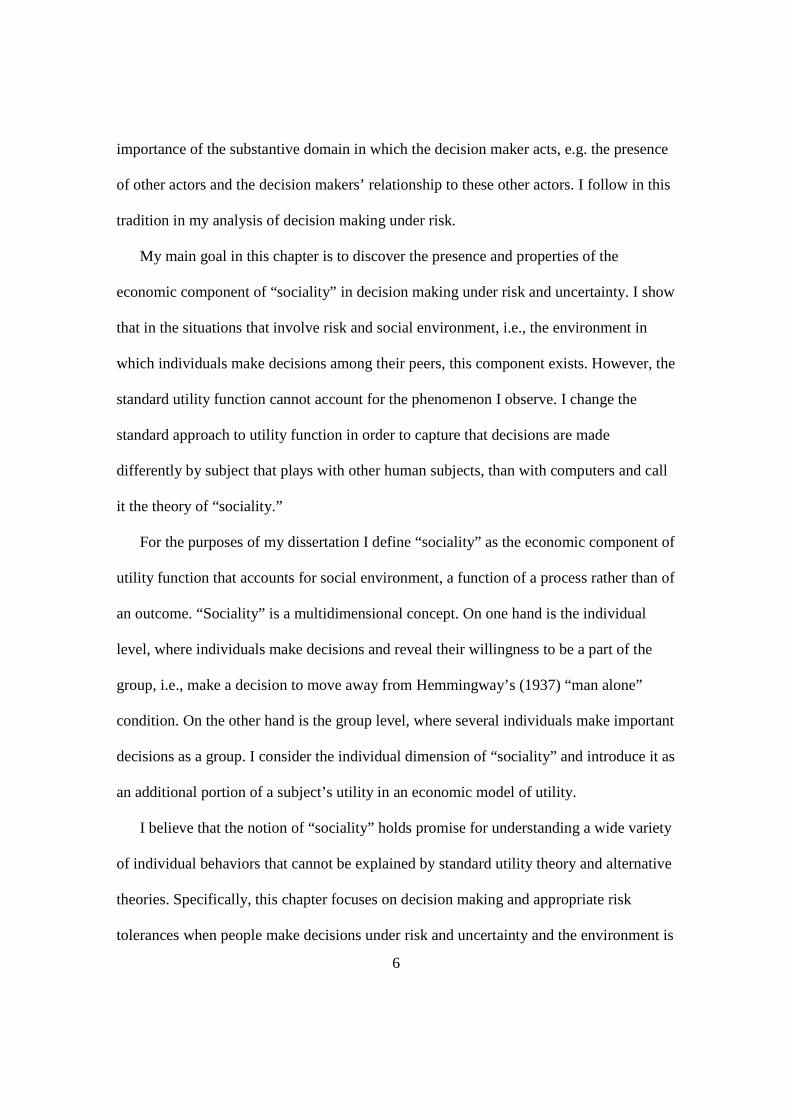
6
importance of the substantive domain in which the decision maker acts, e.g. the presence
of other actors and the decision makers’ relationship to these other actors. I follow in this
tradition in my analysis of decision making under risk.
My main goal in this chapter is to discover the presence and properties of the
economic component of “sociality” in decision making under risk and uncertainty. I show
that in the situations that involve risk and social environment, i.e., the environment in
which individuals make decisions among their peers, this component exists. However, the
standard utility function cannot account for the phenomenon I observe. I change the
standard approach to utility function in order to capture that decisions are made
differently by subject that plays with other human subjects, than with computers and call
it the theory of “sociality.”
For the purposes of my dissertation I define “sociality” as the economic component of
utility function that accounts for social environment, a function of a process rather than of
an outcome. “Sociality” is a multidimensional concept. On one hand is the individual
level, where individuals make decisions and reveal their willingness to be a part of the
group, i.e., make a decision to move away from Hemmingway’s (1937) “man alone”
condition. On the other hand is the group level, where several individuals make important
decisions as a group. I consider the individual dimension of “sociality” and introduce it as
an additional portion of a subject’s utility in an economic model of utility.
I believe that the notion of “sociality” holds promise for understanding a wide variety
of individual behaviors that cannot be explained by standard utility theory and alternative
theories. Specifically, this chapter focuses on decision making and appropriate risk
tolerances when people make decisions under risk and uncertainty and the environment is
7
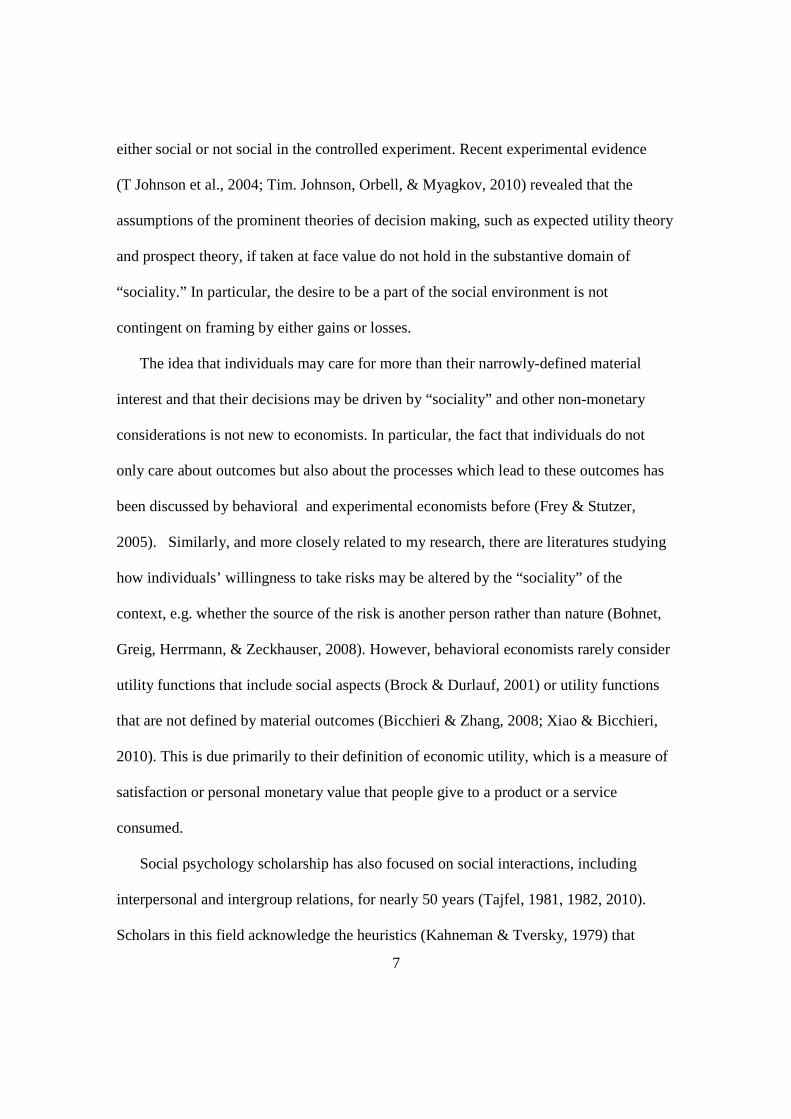
either social or not social in the controlled experiment. Recent experimental evidence
(T Johnson et al., 2004; Tim. Johnson, Orbell, & Myagkov, 2010) revealed that the
assumptions of the prominent theories of decision making, such as expected utility theory
and prospect theory, if taken at face value do not hold in the substantive domain of
“sociality.” In particular, the desire to be a part of the social environment is not
contingent on framing by either gains or losses.
The idea that individuals may care for more than their narrowly-defined material
interest and that their decisions may be driven by “sociality” and other non-monetary
considerations is not new to economists. In particular, the fact that individuals do not
only care about outcomes but also about the processes which lead to these outcomes has
been discussed by behavioral and experimental economists before (Frey & Stutzer,
2005). Similarly, and more closely related to my research, there are literatures studying
how individuals’ willingness to take risks may be altered by the “sociality” of the
context, e.g. whether the source of the risk is another person rather than nature (Bohnet,
Greig, Herrmann, & Zeckhauser, 2008). However, behavioral economists rarely consider
utility functions that include social aspects (Brock & Durlauf, 2001) or utility functions
that are not defined by material outcomes (Bicchieri & Zhang, 2008; Xiao & Bicchieri,
2010). This is due primarily to their definition of economic utility, which is a measure of
satisfaction or personal monetary value that people give to a product or a service
consumed.
Social psychology scholarship has also focused on social interactions, including
interpersonal and intergroup relations, for nearly 50 years (Tajfel, 1981, 1982, 2010).
Scholars in this field acknowledge the heuristics (Kahneman & Tversky, 1979) that
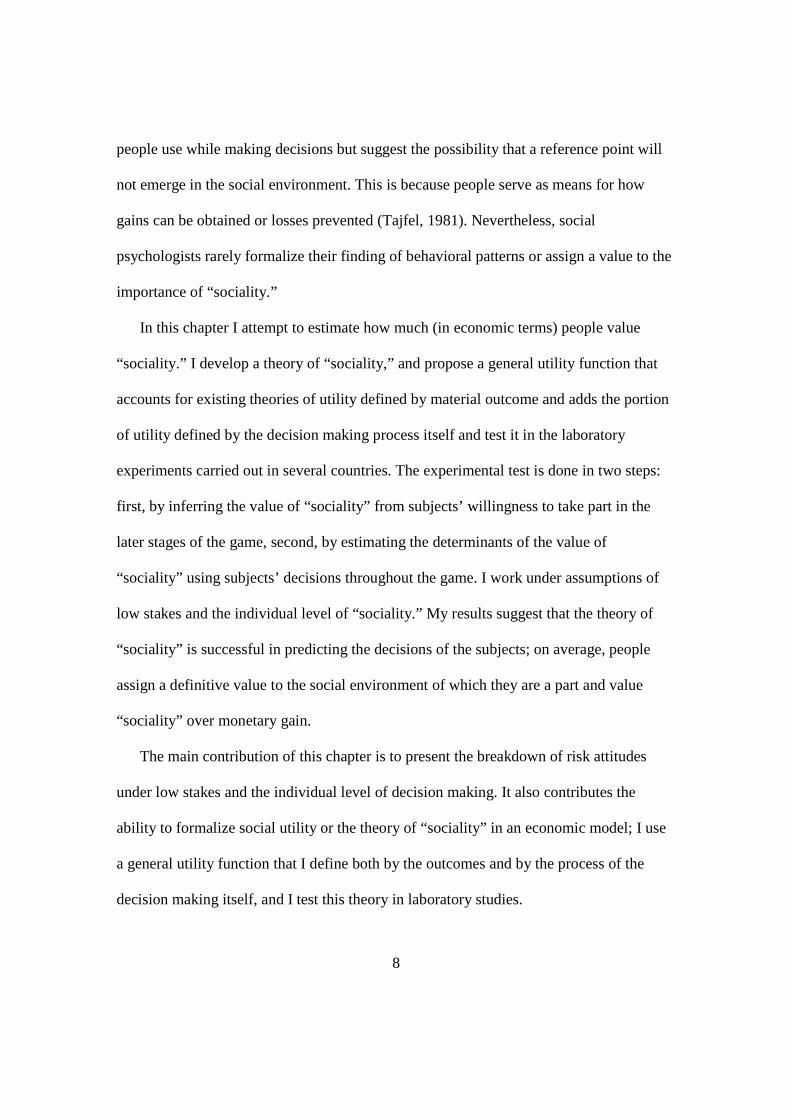
8
people use while making decisions but suggest the possibility that a reference point will
not emerge in the social environment. This is because people serve as means for how
gains can be obtained or losses prevented (Tajfel, 1981). Nevertheless, social
psychologists rarely formalize their finding of behavioral patterns or assign a value to the
importance of “sociality.”
In this chapter I attempt to estimate how much (in economic terms) people value
“sociality.” I develop a theory of “sociality,” and propose a general utility function that
accounts for existing theories of utility defined by material outcome and adds the portion
of utility defined by the decision making process itself and test it in the laboratory
experiments carried out in several countries. The experimental test is done in two steps:
first, by inferring the value of “sociality” from subjects’ willingness to take part in the
later stages of the game, second, by estimating the determinants of the value of
“sociality” using subjects’ decisions throughout the game. I work under assumptions of
low stakes and the individual level of “sociality.” My results suggest that the theory of
“sociality” is successful in predicting the decisions of the subjects; on average, people
assign a definitive value to the social environment of which they are a part and value
“sociality” over monetary gain.
The main contribution of this chapter is to present the breakdown of risk attitudes
under low stakes and the individual level of decision making. It also contributes the
ability to formalize social utility or the theory of “sociality” in an economic model; I use
a general utility function that I define both by the outcomes and by the process of the
decision making itself, and I test this theory in laboratory studies.
9
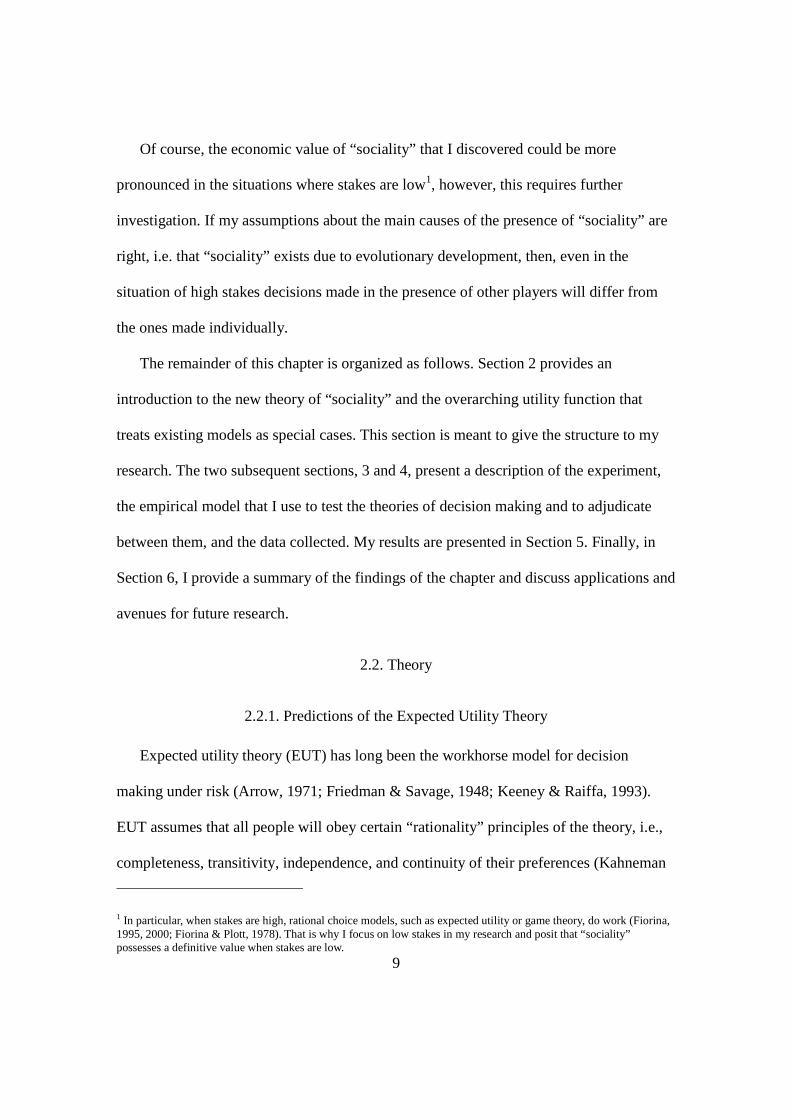
Of course, the economic value of “sociality” that I discovered could be more
pronounced in the situations where stakes are low1, however, this requires further
investigation. If my assumptions about the main causes of the presence of “sociality” are
right, i.e. that “sociality” exists due to evolutionary development, then, even in the
situation of high stakes decisions made in the presence of other players will differ from
the ones made individually.
The remainder of this chapter is organized as follows. Section 2 provides an
introduction to the new theory of “sociality” and the overarching utility function that
treats existing models as special cases. This section is meant to give the structure to my
research. The two subsequent sections, 3 and 4, present a description of the experiment,
the empirical model that I use to test the theories of decision making and to adjudicate
between them, and the data collected. My results are presented in Section 5. Finally, in
Section 6, I provide a summary of the findings of the chapter and discuss applications and
avenues for future research.
2.2. Theory
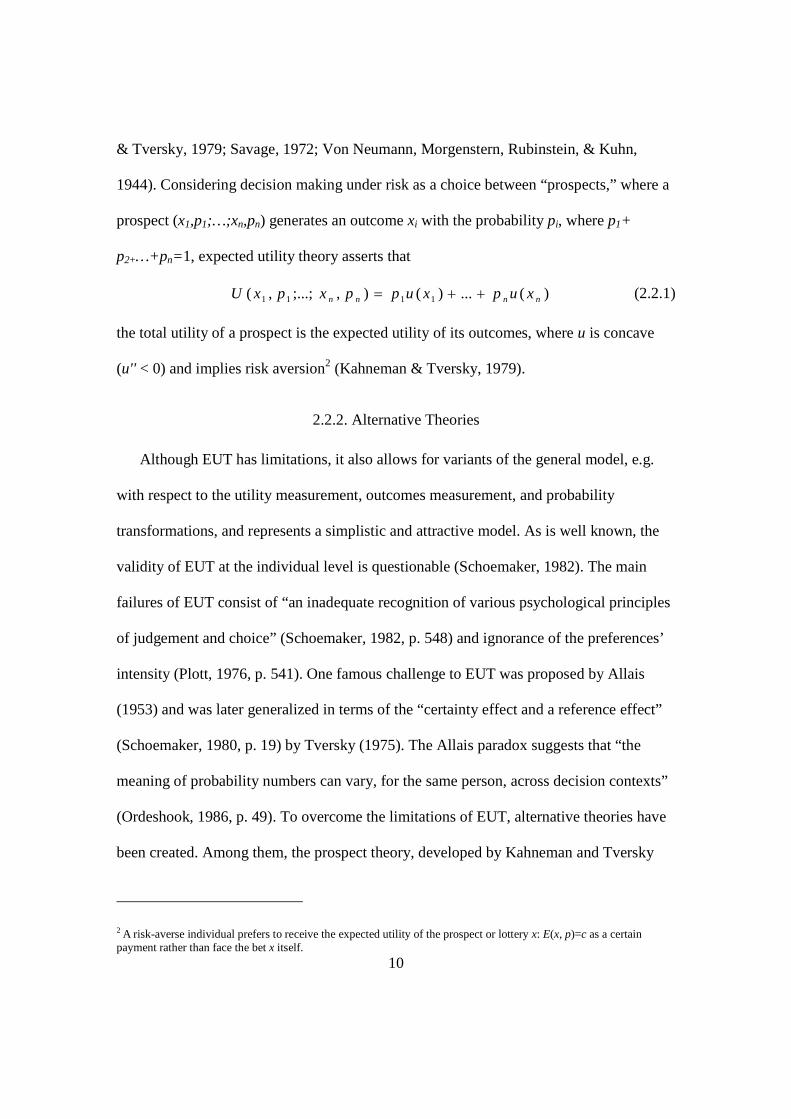
2.2.1. Predictions of the Expected Utility Theory
Expected utility theory (EUT) has long been the workhorse model for decision
making under risk (Arrow, 1971; Friedman & Savage, 1948; Keeney & Raiffa, 1993).
EUT assumes that all people will obey certain “rationality” principles of the theory, i.e.,
completeness, transitivity, independence, and continuity of their preferences (Kahneman
1 In particular, when stakes are high, rational choice models, such as expected utility or game theory, do work (Fiorina,1995, 2000; Fiorina & Plott, 1978). That is why I focus on low stakes in my research and posit that “sociality”possesses a definitive value when stakes are low.
10
& Tversky, 1979; Savage, 1972; Von Neumann, Morgenstern, Rubinstein, & Kuhn,
1944). Considering decision making under risk as a choice between “prospects,” where a
prospect (x1,p1;…;xn,pn) generates an outcome xi with the probability pi, where p1+
p2+…+pn=1, expected utility theory asserts that
)(...)(),;...;,( 1111 nnnn xupxuppxpxU (2.2.1)
the total utility of a prospect is the expected utility of its outcomes, where u is concave
(u'' < 0) and implies risk aversion2 (Kahneman & Tversky, 1979).
2.2.2. Alternative Theories
Although EUT has limitations, it also allows for variants of the general model, e.g.
with respect to the utility measurement, outcomes measurement, and probability
transformations, and represents a simplistic and attractive model. As is well known, the
validity of EUT at the individual level is questionable (Schoemaker, 1982). The main
failures of EUT consist of “an inadequate recognition of various psychological principles
of judgement and choice” (Schoemaker, 1982, p. 548) and ignorance of the preferences’
intensity (Plott, 1976, p. 541). One famous challenge to EUT was proposed by Allais
(1953) and was later generalized in terms of the “certainty effect and a reference effect”
(Schoemaker, 1980, p. 19) by Tversky (1975). The Allais paradox suggests that “the
meaning of probability numbers can vary, for the same person, across decision contexts”
(Ordeshook, 1986, p. 49). To overcome the limitations of EUT, alternative theories have
been created. Among them, the prospect theory, developed by Kahneman and Tversky
2 A risk-averse individual prefers to receive the expected utility of the prospect or lottery x: E(x, p)=c as a certainpayment rather than face the bet x itself.
11
(1979), appears to be the most important and influential theory for decision making under
uncertainty.
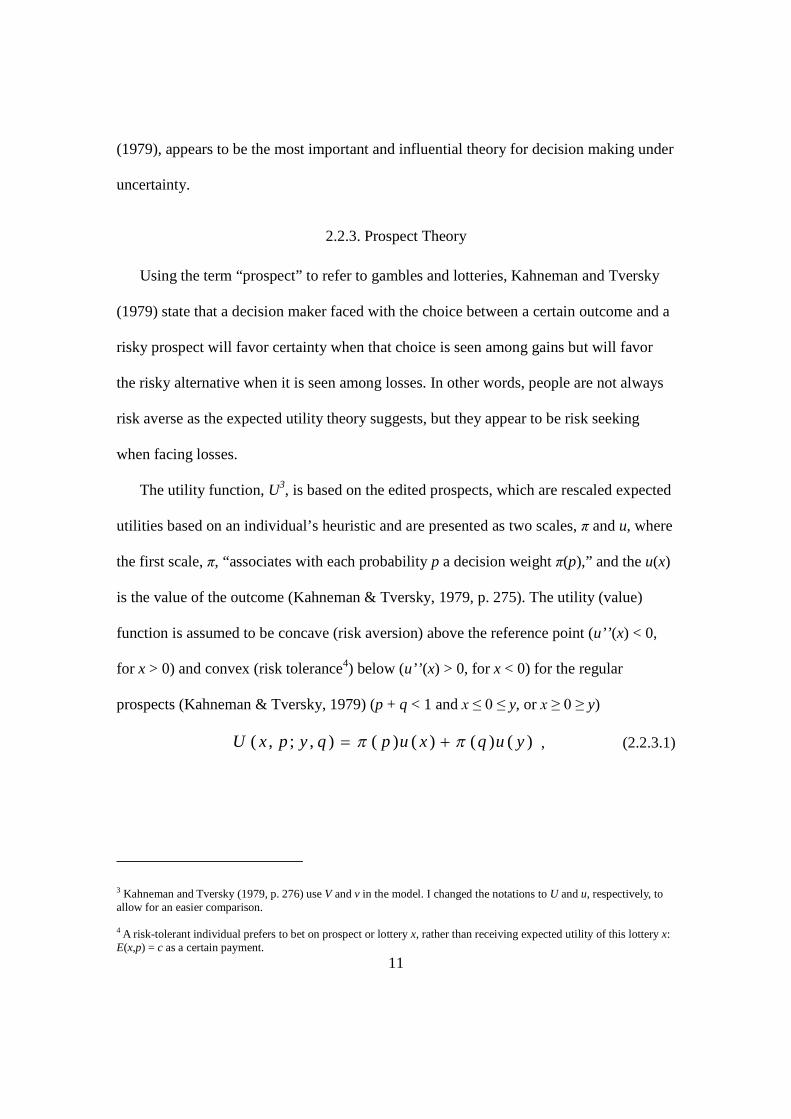
2.2.3. Prospect Theory
Using the term “prospect” to refer to gambles and lotteries, Kahneman and Tversky
(1979) state that a decision maker faced with the choice between a certain outcome and a
risky prospect will favor certainty when that choice is seen among gains but will favor
the risky alternative when it is seen among losses. In other words, people are not always
risk averse as the expected utility theory suggests, but they appear to be risk seeking
when facing losses.
The utility function, U3, is based on the edited prospects, which are rescaled expected
utilities based on an individual’s heuristic and are presented as two scales, π and u, where
the first scale, π, “associates with each probability p a decision weight π(p),” and the u(x)
is the value of the outcome (Kahneman & Tversky, 1979, p. 275). The utility (value)
function is assumed to be concave (risk aversion) above the reference point (u’’(x) < 0,
for x > 0) and convex (risk tolerance4) below (u’’(x) > 0, for x < 0) for the regular
prospects (Kahneman & Tversky, 1979) (p + q < 1 and x ≤ 0 ≤ y, or x ≥ 0 ≥ y)
)()()()(),;,( yuqxupqypxU , (2.2.3.1)
3 Kahneman and Tversky (1979, p. 276) use V and v in the model. I changed the notations to U and u, respectively, toallow for an easier comparison.
4 A risk-tolerant individual prefers to bet on prospect or lottery x, rather than receiving expected utility of this lottery x:E(x,p) = c as a certain payment.
12
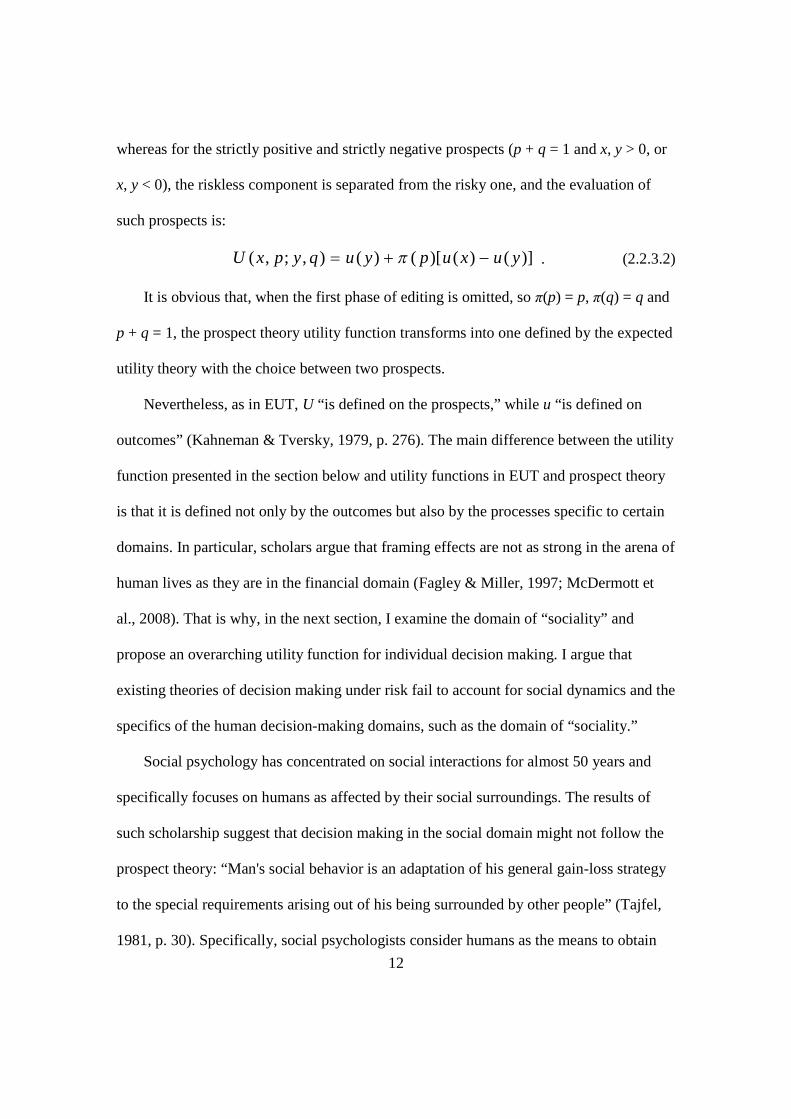
whereas for the strictly positive and strictly negative prospects (p + q = 1 and x, y > 0, or
x, y < 0), the riskless component is separated from the risky one, and the evaluation of
such prospects is:
)]()()[()(),;,( yuxupyuqypxU . (2.2.3.2)
It is obvious that, when the first phase of editing is omitted, so π(p) = p, π(q) = q and
p + q = 1, the prospect theory utility function transforms into one defined by the expected
utility theory with the choice between two prospects.
Nevertheless, as in EUT, U “is defined on the prospects,” while u “is defined on
outcomes” (Kahneman & Tversky, 1979, p. 276). The main difference between the utility
function presented in the section below and utility functions in EUT and prospect theory
is that it is defined not only by the outcomes but also by the processes specific to certain
domains. In particular, scholars argue that framing effects are not as strong in the arena of
human lives as they are in the financial domain (Fagley & Miller, 1997; McDermott et
al., 2008). That is why, in the next section, I examine the domain of “sociality” and
propose an overarching utility function for individual decision making. I argue that
existing theories of decision making under risk fail to account for social dynamics and the
specifics of the human decision-making domains, such as the domain of “sociality.”
Social psychology has concentrated on social interactions for almost 50 years and
specifically focuses on humans as affected by their social surroundings. The results of
such scholarship suggest that decision making in the social domain might not follow the
prospect theory: “Man's social behavior is an adaptation of his general gain-loss strategy
to the special requirements arising out of his being surrounded by other people” (Tajfel,
1981, p. 30). Specifically, social psychologists consider humans as the means to obtain
13
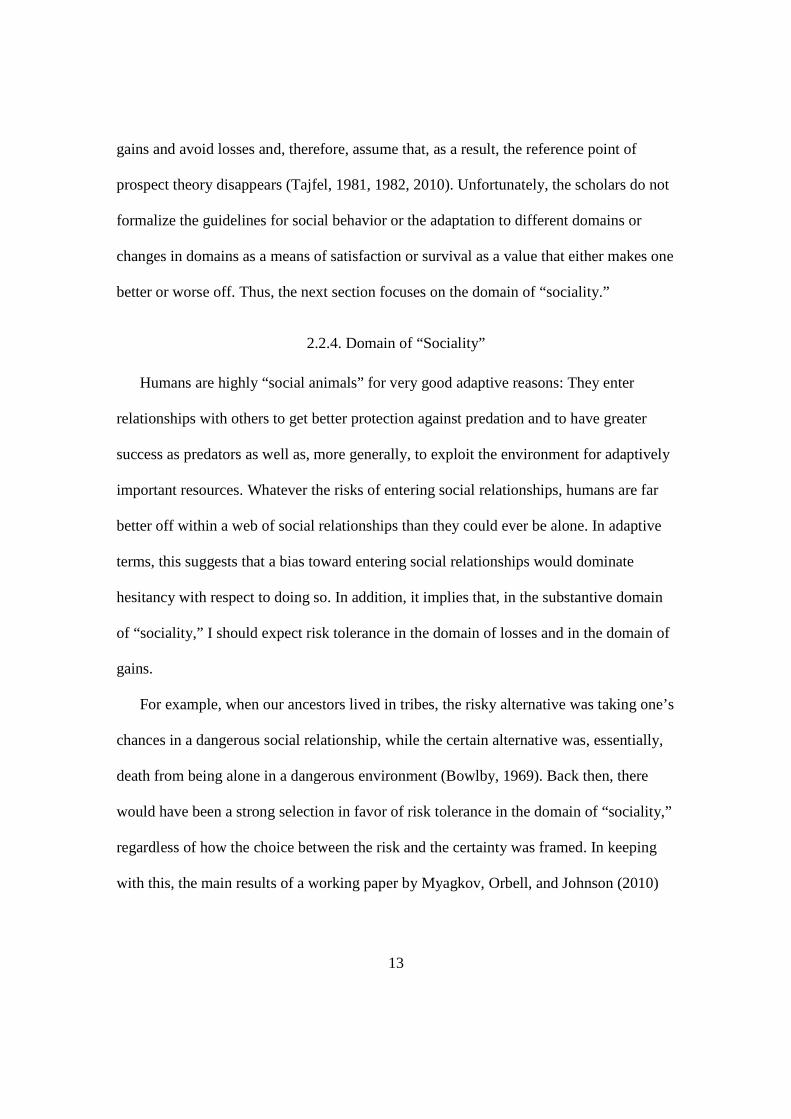
gains and avoid losses and, therefore, assume that, as a result, the reference point of
prospect theory disappears (Tajfel, 1981, 1982, 2010). Unfortunately, the scholars do not
formalize the guidelines for social behavior or the adaptation to different domains or
changes in domains as a means of satisfaction or survival as a value that either makes one
better or worse off. Thus, the next section focuses on the domain of “sociality.”
2.2.4. Domain of “Sociality”
Humans are highly “social animals” for very good adaptive reasons: They enter
relationships with others to get better protection against predation and to have greater
success as predators as well as, more generally, to exploit the environment for adaptively
important resources. Whatever the risks of entering social relationships, humans are far
better off within a web of social relationships than they could ever be alone. In adaptive
terms, this suggests that a bias toward entering social relationships would dominate
hesitancy with respect to doing so. In addition, it implies that, in the substantive domain
of “sociality,” I should expect risk tolerance in the domain of losses and in the domain of
gains.
For example, when our ancestors lived in tribes, the risky alternative was taking one’s
chances in a dangerous social relationship, while the certain alternative was, essentially,
death from being alone in a dangerous environment (Bowlby, 1969). Back then, there
would have been a strong selection in favor of risk tolerance in the domain of “sociality,”
regardless of how the choice between the risk and the certainty was framed. In keeping
with this, the main results of a working paper by Myagkov, Orbell, and Johnson (2010)
14
show that subjects take more risk than is rational across both a gains and a losses
framework in the social domain, i.e. when subjects make decisions among their peers.
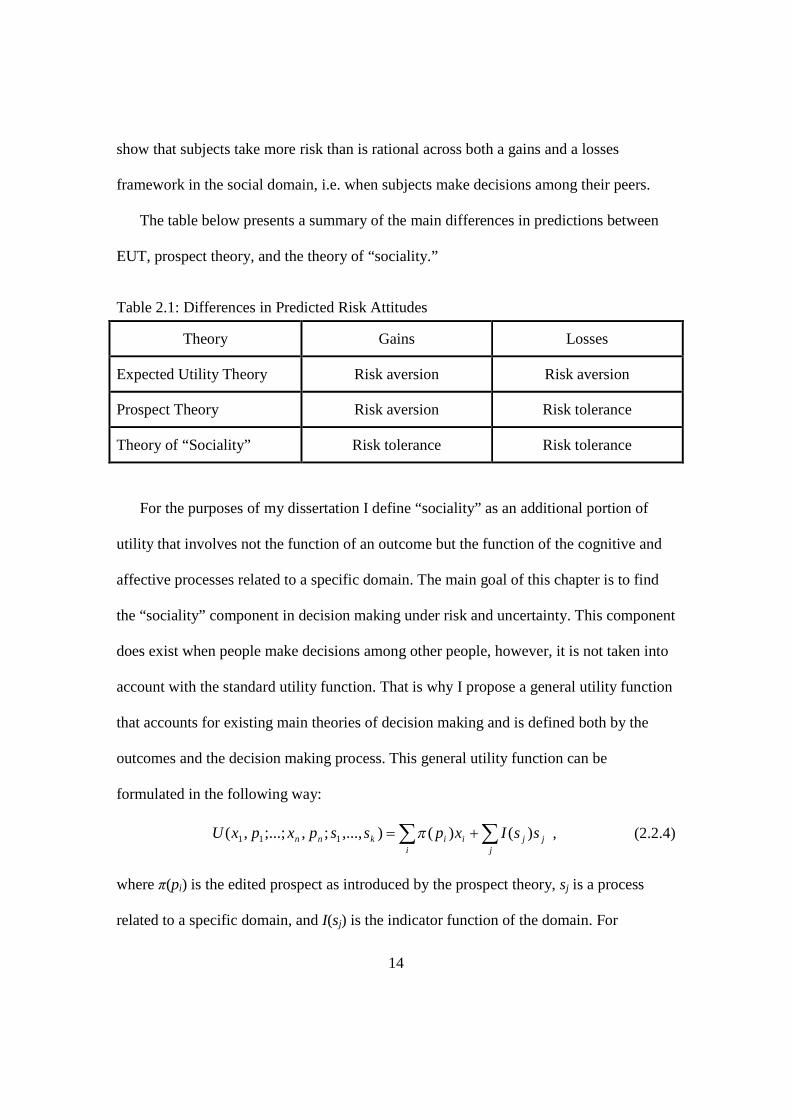
The table below presents a summary of the main differences in predictions between
EUT, prospect theory, and the theory of “sociality.”
Table 2.1: Differences in Predicted Risk Attitudes
Theory Gains Losses
Expected Utility Theory Risk aversion Risk aversion
Prospect Theory Risk aversion Risk tolerance
Theory of “Sociality” Risk tolerance Risk tolerance
For the purposes of my dissertation I define “sociality” as an additional portion of
utility that involves not the function of an outcome but the function of the cognitive and
affective processes related to a specific domain. The main goal of this chapter is to find
the “sociality” component in decision making under risk and uncertainty. This component
does exist when people make decisions among other people, however, it is not taken into
account with the standard utility function. That is why I propose a general utility function
that accounts for existing main theories of decision making and is defined both by the
outcomes and the decision making process. This general utility function can be
formulated in the following way:
j
jji
iiknn ssIxpsspxpxU )()(),...,;,;...;,( 111 , (2.2.4)
where π(pi) is the edited prospect as introduced by the prospect theory, sj is a process
related to a specific domain, and I(sj) is the indicator function of the domain. For
15
example, for the domain of “sociality,” I(s) = 1, if the individual is playing in the social
context, i.e., with other human beings, and I(s) = 0 otherwise.
In general economists recognize that people not only care about the outcomes, but
also they value the procedure which leads to the outcomes. Procedural utility concept was
introduced by Frey et al. (2002) and is seen as potentially important source of human
well-being. “Procedural utility means that people value not only actual outcomes, i.e. the
‘what’, but also the conditions and processes which lead to these outcomes, i.e. the
‘how’” (Benz et al., 2002, p. 2).
In the domain of “sociality” people have preferences, for instance about how they are
perceived by their peers, what is their standing among their peers, who they want to pair
up with to play a game, establish friendship or manipulate. The decision making
processes and contexts (sj), especially those that include many steps before the actual
outcomes are revealed, may affect people’s well-being even more so than the bad
material outcomes. Judgments expressed by other people may seriously influence
individual’s self-worth. For example, in the experiment under consideration it can be
deeply embarrassing for a person to be ostracized and being denied entrance into last
stage of the game, where main interaction in the social environment happens. Thus, the
additional component of utility function, “sociality” is a crucial determinant of human
well-being that should not be neglected in social sciences and empirical research.
The next section concerns the development of a rigorous test of the proposed general
utility function.
16
2.3. Methodology
In this section, I argue that, for certain conditions, neither EUT nor prospect theory
works and that a new theory, the theory of “sociality,” described in the previous section,
should be implemented. These necessary conditions are the basis for the design of the
experiments and include:
(1) Participants should have the option to enter or not enter a risky game. This way,
the choices are presented as between a certain and a risky prospect as a means to
compare the results with the prospect theory.
(2) Interaction between participants in ways that could modify or eliminate the risks
should be prevented.
(3) The condition in which “sociality” can be extracted (game with computers) should
be incorporated.
(4) The experiments should be carried out across cultures.
Test of the theory of “sociality” is based on a set of experiments that were carried out
in US, New Zealand, and Russia.5 The experimental design is presented in the Data
section. In brief, Myagkov et al. (2010) attempted to reconstruct a 2-person Prisoner’s
Dilemma (PD) in a laboratory setting. Each period of the experiment includes three
consecutive steps. First, participants are confronted with a choice between entering and
not entering a risky but possibly productive social relationship. The participants bid to
5 This research was supported by NSF grant no. 0618265 from the National Science Foundation.
17
enter such a relationship. The second step reveals the most popular players. In this step,
participants choose others with whom they would like to begin this social relationship.
Finally, the participants who survived the first two steps enter a social relationship and
make a decision in the PD. They play the game (PD) in pairs, determined by a random
draw. It is important to note that entering the game does not guarantee the highest profit.
This design allows me to test the risk preferences of individuals, to estimate the value
that they assign to “sociality” as well as to compare game with people to a game with
computers6. The experiments were framed in losses and gains as a means to relate them
to prospect theory results. By providing the participants with data about the mean past
choices in the PD, expectations of participants are made as endogenous as possible.
Therefore, assuming that participants used this information in making their decisions, it is
possible to calculate their expected value from actually playing a PD game and to do so
separately for those who subsequently choose cooperation versus defection.7 It is then
possible to estimate participants' risk attitudes by computing the ratio of their expected
values to the observed bids in each experiment. Risk neutrality would be implied by a
mean ratio of exactly one, risk tolerance by a mean ratio of less than one, and risk
aversion by a mean ratio greater than one.
Using the expected value of participating in the PD game, calculated based on
outcomes in previous periods, I construct a test of theory of “sociality.” I use a two-stage
6 The game with computers was supported by the same NSF grant and included the same steps as the game withhumans. Robots appeared in the last stage of the game with computers, PD game and were cooperating with probabilityof .42.
7 Thus, for example, for an individual who intended cooperation and for whom such information indicated a .4probability of a (randomly selected) partner’s also cooperating, the expected value of participating in the gainscondition would be .4*700 + .6*0 = 280, where 700 and 0 are payoffs in the PD game (Table 3).
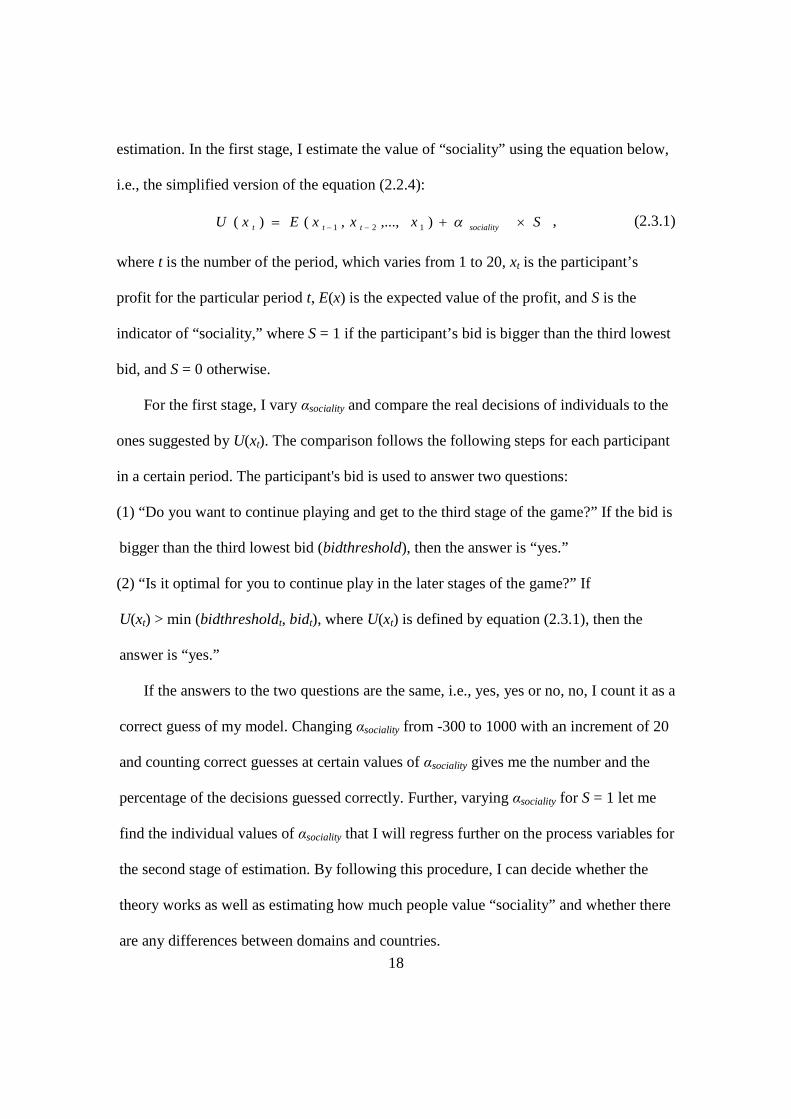
18
estimation. In the first stage, I estimate the value of “sociality” using the equation below,
i.e., the simplified version of the equation (2.2.4):
SxxxExU socialityttt ),...,,()( 121, (2.3.1)
where t is the number of the period, which varies from 1 to 20, xt is the participant’s
profit for the particular period t, E(x) is the expected value of the profit, and S is the
indicator of “sociality,” where S = 1 if the participant’s bid is bigger than the third lowest
bid, and S = 0 otherwise.
For the first stage, I vary αsociality and compare the real decisions of individuals to the
ones suggested by U(xt). The comparison follows the following steps for each participant
in a certain period. The participant's bid is used to answer two questions:
(1) “Do you want to continue playing and get to the third stage of the game?” If the bid is
bigger than the third lowest bid (bidthreshold), then the answer is “yes.”
(2) “Is it optimal for you to continue play in the later stages of the game?” If
U(xt) > min (bidthresholdt, bidt), where U(xt) is defined by equation (2.3.1), then the
answer is “yes.”
If the answers to the two questions are the same, i.e., yes, yes or no, no, I count it as a
correct guess of my model. Changing αsociality from -300 to 1000 with an increment of 20
and counting correct guesses at certain values of αsociality gives me the number and the
percentage of the decisions guessed correctly. Further, varying αsociality for S = 1 let me
find the individual values of αsociality that I will regress further on the process variables for
the second stage of estimation. By following this procedure, I can decide whether the
theory works as well as estimating how much people value “sociality” and whether there
are any differences between domains and countries.
19
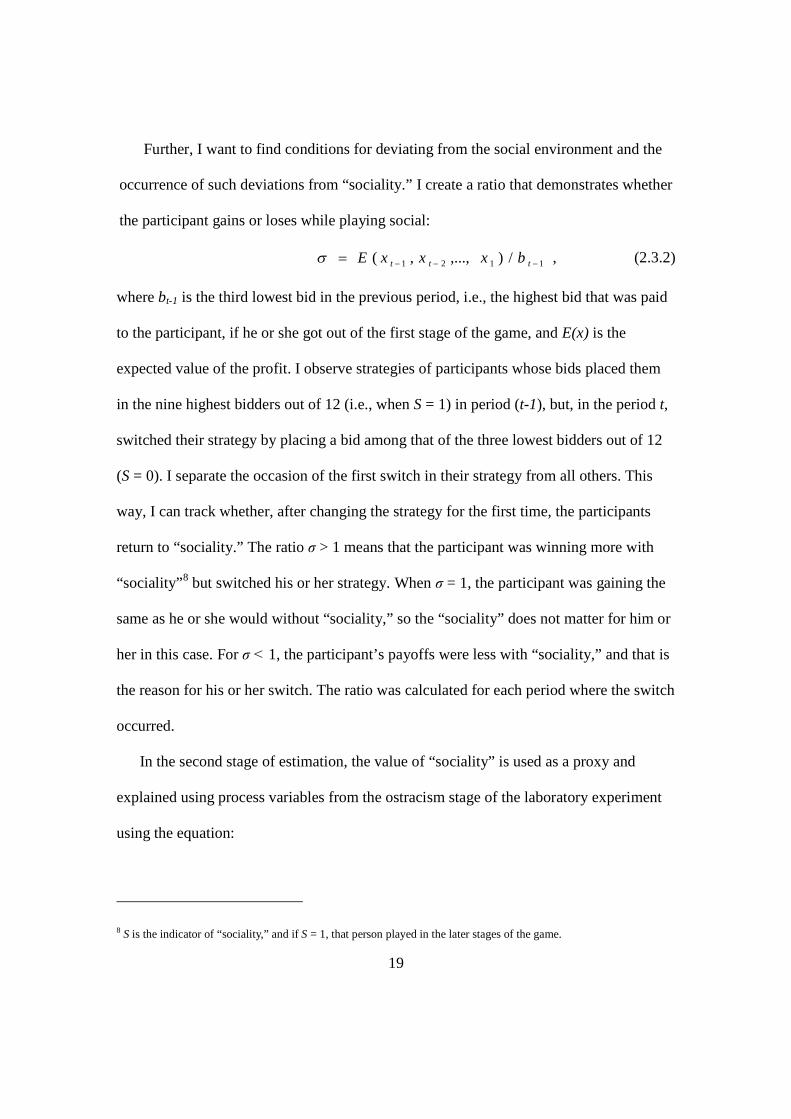
Further, I want to find conditions for deviating from the social environment and the
occurrence of such deviations from “sociality.” I create a ratio that demonstrates whether
the participant gains or loses while playing social:
1121 /),...,,( ttt bxxxE , (2.3.2)
where bt-1 is the third lowest bid in the previous period, i.e., the highest bid that was paid
to the participant, if he or she got out of the first stage of the game, and E(x) is the
expected value of the profit. I observe strategies of participants whose bids placed them
in the nine highest bidders out of 12 (i.e., when S = 1) in period (t-1), but, in the period t,
switched their strategy by placing a bid among that of the three lowest bidders out of 12
(S = 0). I separate the occasion of the first switch in their strategy from all others. This
way, I can track whether, after changing the strategy for the first time, the participants
return to “sociality.” The ratio σ > 1 means that the participant was winning more with
“sociality”8 but switched his or her strategy. When σ = 1, the participant was gaining the
same as he or she would without “sociality,” so the “sociality” does not matter for him or
her in this case. For σ < 1, the participant’s payoffs were less with “sociality,” and that is
the reason for his or her switch. The ratio was calculated for each period where the switch
occurred.
In the second stage of estimation, the value of “sociality” is used as a proxy and
explained using process variables from the ostracism stage of the laboratory experiment
using the equation:
8 S is the indicator of “sociality,” and if S = 1, that person played in the later stages of the game.
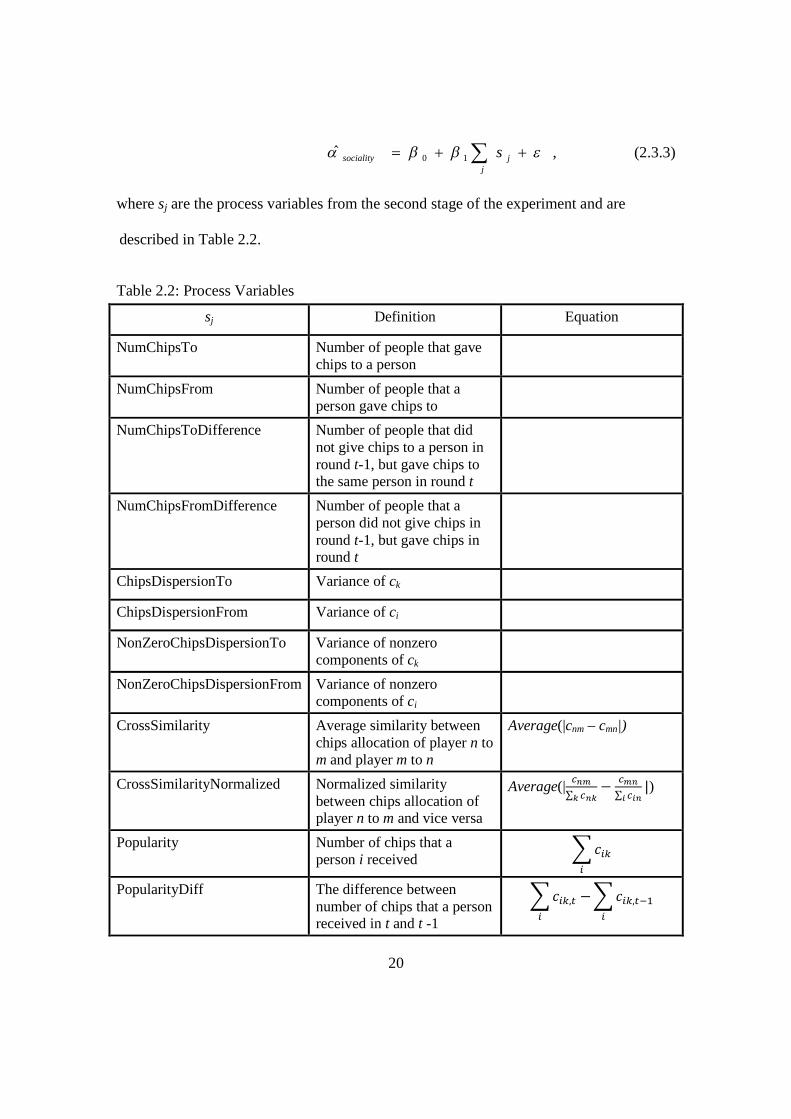
20
j
jsociality s10ˆ , (2.3.3)
where sj are the process variables from the second stage of the experiment and are
described in Table 2.2.
Table 2.2: Process Variables
sj Definition Equation
NumChipsTo Number of people that gavechips to a person
NumChipsFrom Number of people that aperson gave chips to
NumChipsToDifference Number of people that didnot give chips to a person inround t-1, but gave chips tothe same person in round t
NumChipsFromDifference Number of people that aperson did not give chips inround t-1, but gave chips inround t
ChipsDispersionTo Variance of ck
ChipsDispersionFrom Variance of ci
NonZeroChipsDispersionTo Variance of nonzerocomponents of ck
NonZeroChipsDispersionFrom Variance of nonzerocomponents of ci
CrossSimilarity Average similarity betweenchips allocation of player n tom and player m to n
Average(|cnm – cmn|)
CrossSimilarityNormalized Normalized similaritybetween chips allocation ofplayer n to m and vice versa
Average(|
∑ ೖೖ−
∑ |)
Popularity Number of chips that aperson i received
PopularityDiff The difference betweennumber of chips that a personreceived in t and t -1
,௧−
,௧ ଵ
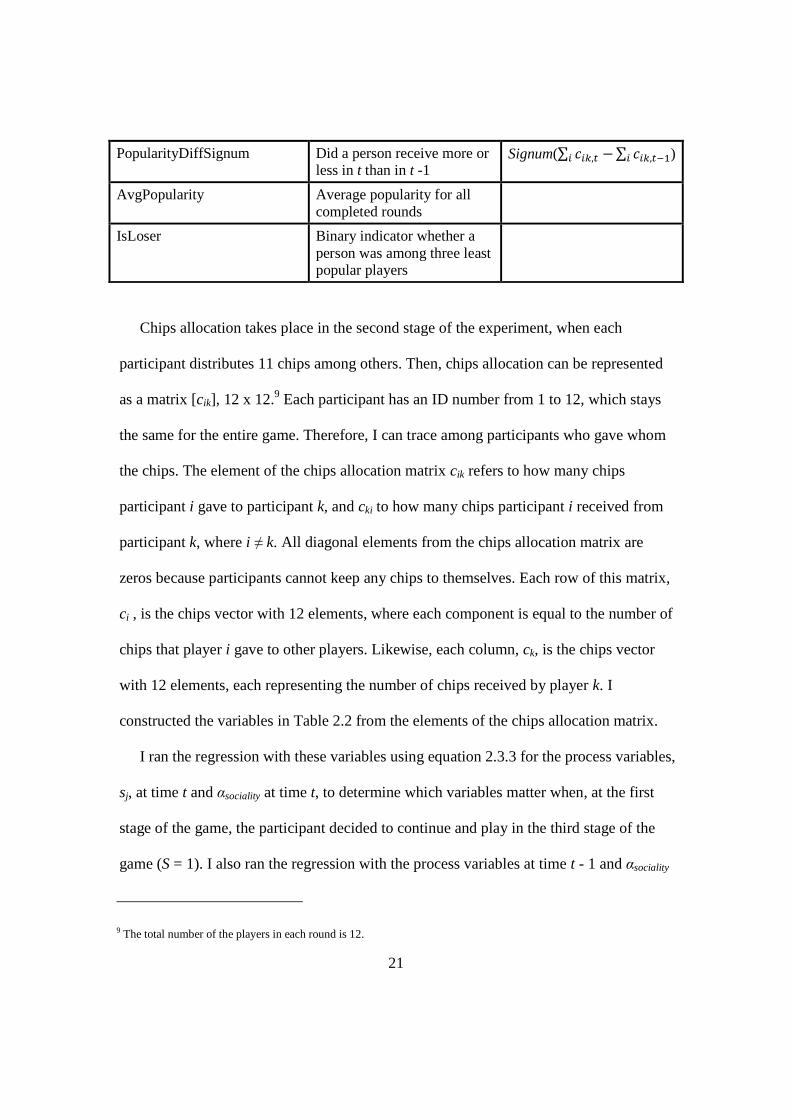
21
PopularityDiffSignum Did a person receive more orless in t than in t -1
Signum(∑ ,௧− ∑ ,௧ ଵ )
AvgPopularity Average popularity for allcompleted rounds
IsLoser Binary indicator whether aperson was among three leastpopular players
Chips allocation takes place in the second stage of the experiment, when each
participant distributes 11 chips among others. Then, chips allocation can be represented
as a matrix [cik], 12 x 12.9 Each participant has an ID number from 1 to 12, which stays
the same for the entire game. Therefore, I can trace among participants who gave whom
the chips. The element of the chips allocation matrix cik refers to how many chips
participant i gave to participant k, and cki to how many chips participant i received from
participant k, where i ≠ k. All diagonal elements from the chips allocation matrix are
zeros because participants cannot keep any chips to themselves. Each row of this matrix,
ci , is the chips vector with 12 elements, where each component is equal to the number of
chips that player i gave to other players. Likewise, each column, ck, is the chips vector
with 12 elements, each representing the number of chips received by player k. I
constructed the variables in Table 2.2 from the elements of the chips allocation matrix.
I ran the regression with these variables using equation 2.3.3 for the process variables,
sj, at time t and αsociality at time t, to determine which variables matter when, at the first
stage of the game, the participant decided to continue and play in the third stage of the
game (S = 1). I also ran the regression with the process variables at time t - 1 and αsociality
9 The total number of the players in each round is 12.
22
at time t to determine which process variable might contribute to the decision to play in
the third stage of the game. I use the rank-sum test proposed by Wilcoxon (1945) to
decide whether the coefficients of regressions are significantly different from 0. I
identify the significant coefficients and discuss their meaning in the Results section.
2.3.1. Hypotheses
Following Johnson et al. (2010), I test risk attitudes in the presence of “sociality.”
Therefore, the first hypothesis is:
H1: Participants are substantially disposed to take the risky alternative in a social domain,
regardless of whether the risk is framed as gains or losses.
Next, I estimate the value of “sociality” and hypothesize that:
H2: Although the participants demand “sociality,” regardless of the framework or
country, they value “sociality” differently.
Based on the ratio in equation (2.3.2), calculated for each period across all the games,
I hypothesize:
H3: The value of “sociality” is high enough to allow for subsequent monetary losses.
23
For the second stage of regression (2.3.3) I hypothesize that:
H4: Participants enter the social environment to share and cooperate.
2.4. Data
Original data were collected with the help of the z-Tree10 (Zurich Toolbox for
Readymade Economic Experiments) software package. The same program code was used
for experiments in the United States, Russia, and New Zealand. The data reflect
observations of each stage of the game, including the PD game over time. Observations
reflect the choices of different sets of 12 participants over 18 experiments. Each
experiment contained up to 20 periods. The participants were not informed of the total
number of experimental rounds.
It is important to note that the losses framework involved the same sequence of
events. The only difference was that all payoffs were either zero or negative. However,
participants’ actual prospects in the gains and losses conditions were identical. This is the
case because, unlike in the gains framework, 1000 points were distributed to each
participant before the beginning of each period.11 For example, a participant who played
and defected with another defector would earn 200 points in the gains frame, but, in the
frame of losses, the participants would lose 800 from the starting 1000 points that were
10 http://www.iew.uzh.ch/ztree/index.php
11 All participants started with 0 points in the gains framework and with 1000 points in the losses framework.
24
assigned. Thus, to be comparable with the gains framework, the original bids were
subtracted from 1000 in the losses framework.
2.4.1. Cross-Cultural Experiments and Replications
To address the possibility that any finding was (or was not) a function of the peculiar
culture in which the experiment was conducted, the experiments were ran in Moscow,
Russia, and Auckland, New Zealand, as well as in Eugene and Bend, Oregon, U.S.A.
Specifically, I analyzed five replications of the experiments in Eugene, Oregon (three in
gains and two in losses); two in Bend, Oregon (one in each of gains and losses); seven in
Moscow, Russia (four in gains and three in losses); and four in Auckland, New Zealand
(two in each of gains and losses).
To ensure the equivalence of experimental sessions across countries, the experimental
team followed Roth et al. (1991) on appropriate designs. The currency, language and
experimenter effects were controlled for in each of the experiments. The instructions
were translated (and back-translated) from English to Russian. All experiments were
conducted by or under supervision of my chair member of committee, Professor Mikhail
Myagkov.
2.4.2. Experimental Design
The participants for the experiment were recruited by advertisements on campus. All
participants were required to sign the necessary informed consent forms. Before the
experiment began, the players were asked to take a pop quiz on experimental design.
Additionally, the first round was not counted in their total score, and they could resolve
25
all the questions remaining after playing this round. This way, I could determine that
participants understood their tasks. Players (mostly students) could earn $5 just for
showing up and up to $20 more, depending on their decisions throughout the game. Each
experiment included 12 participants. Each player was identified by a number visible to all
that was valid until the end of the experiment. No names were used. Each period of the
experiment consisted of three consecutive steps.
In the first stage, all 12 players participated. Participants made an initial competitive
bid for the game in the last stage, i.e., the PD. The rules of the auction were as follows:
(1) Three players with the lowest bids would not play the PD game.
(2) For those 3 players, the amount of their bid would be their profit for a period
under consideration.
In the second stage, each of the 12 participants was made to allocate 11 chips among
others. In this way, participants determined who continued to play, i.e., made an
“ostracism” choice. A participant could use any method to distribute the 11 chips but had
to give away all their chips. For example, a player could give each opponent only 1 chip
or give 11 chips just to one person. The 3 least popular players selected in the second
stage did not play PD. These players were chosen out of 9 participants, not including the
3 lowest bidders excluded in the first stage of the experiment. The selected participants
from the first and second stages and the third lowest bid at that round were revealed only
26
at this point12. Those who were chosen in the first stage got their bid as a profit, whereas
participants excluded in the second round received zero profit.
In the third stage of the experiment, the remaining 6 participants played the 2-person
PD game in randomly created pairs. The experimenter explained the PD payoff structure
to the participants. The “cooperate” alternative was specified as A and the “defect”
alternative as B. Payoffs represent the points that the participants knew would be
translated into dollars at the end of the experiment by the exchange rate of 1000 points =
$1.00. Tables 2.3.1 and 2.3.2 displays the PD payoff structure in the domain of gains and
the domain of losses.
Table 2.3: PD Payoffs in the Domain of Gains
A B
A 700, 700 0, 1000
B 1000, 0 200, 200
Table 2.4: PD Payoffs in the Domain of Losses
A B
A -300, -300 -1000, 0
B 0, -1000 -800, -8s00
Participants repeated this process through a sequence of up to 20 replications. The
exact number of repetitions depended on the speed at which successive replications were
12 If a tie happened for the third lowest bid or the third lowest number of chips received, the winner was defined by arandom draw.
27
completed. Notice that these were not iterated games. Any participant might (or might
not) have been included among the 6 players that played PD in any given round, and,
even when included, the opponent with whom he or she played was determined by a
random draw.
2.4.3. Summary Statistics
The summary statistics for the variables used in equations (2.3.1) and (2.3.2), i.e., for
the profit and bid variables, are presented in Table 2.4. The summary statistics for the
process variables constructed from the matrix [cik] are not shown. This is because the
matrix, as well as each of the process variables, was normalized, which means that all
process variables have a mean of 0 and a standard deviation of 1. This allows me to make
the absolute value of the coefficients of the second stage regression meaningful.
Table 2.5: Summary Statistics
Variable Observations Mean Std. Dev. Min Max
Profit 3012 290.492 320.6913 0 1000
bid 3012 566.219 244.9888 0 1000
2.5. Results
The Results are presented in the order of the hypotheses. Based on the analysis, I do
not reject any of the hypotheses. There is clearly an economic value derived from being
around other people. How does this economic value vary across domains and countries?
28
Result 1
Subjects exhibit risk tolerant behavior in both gains and losses, if evaluated using
standard expected utility function.
Support
Since the ratio of average expected utilities to average bids is overwhelmingly smaller
than one in both gains and losses I can conclude that risk tolerant behavior is present in
both conditions. Table 2.513 presents the ratios of average expected utilities to average
bids by conditions of gains and losses and for participants whose bids placed them in the
bottom 3 of 12 and the top 9 of 12 (those who proceeded to the ostracism phase and, for
those who survived there, to a PD game). In both frames, the mean expected value of
playing the game was less than the mean value of the points that participants were
bidding to enter the game, which implies risk tolerance14 in both conditions.
Table 2.6: Ratio of Mean Expected Utilities to Mean Bids
NZ(G) NZ(L) RU(G) RU(L) US(G) US(L)
C – top 9 0.32*** 0.29*** 0.31*** 0.42*** 0.37*** 0.39***
D – top 9 0.49*** 0.51*** 0.5*** 0.66** 0.56*** 0.61**
C – bottom 3 0.62** 0.59*** 0.48*** 0.6*** 0.53*** 0.5***
D – bottom 3 0.95 1 0.84* 1.03 0.85* 0.89
Significantly less than one with probabilities (t-test) .9 (*); .95 (**); and .99 (***).
13 C - top 9: Players with the highest 9 bids that cooperated; D - top 9: Players with the highest 9 bids that defected; C -bottom 3: Players who had the 3 lowest bids and cooperated; D - bottom 3: Players who had the 3 lowest bids anddefected; NZ-New Zealand, RU-Russia, US-United States; G-gains framework, L-losses framework.
14 Risk neutrality is implied by a mean ratio of exactly one, risk tolerance by a mean ratio less than one, and riskaversion by a mean ratio greater than one. The calculation is examined in the Methods section.
29
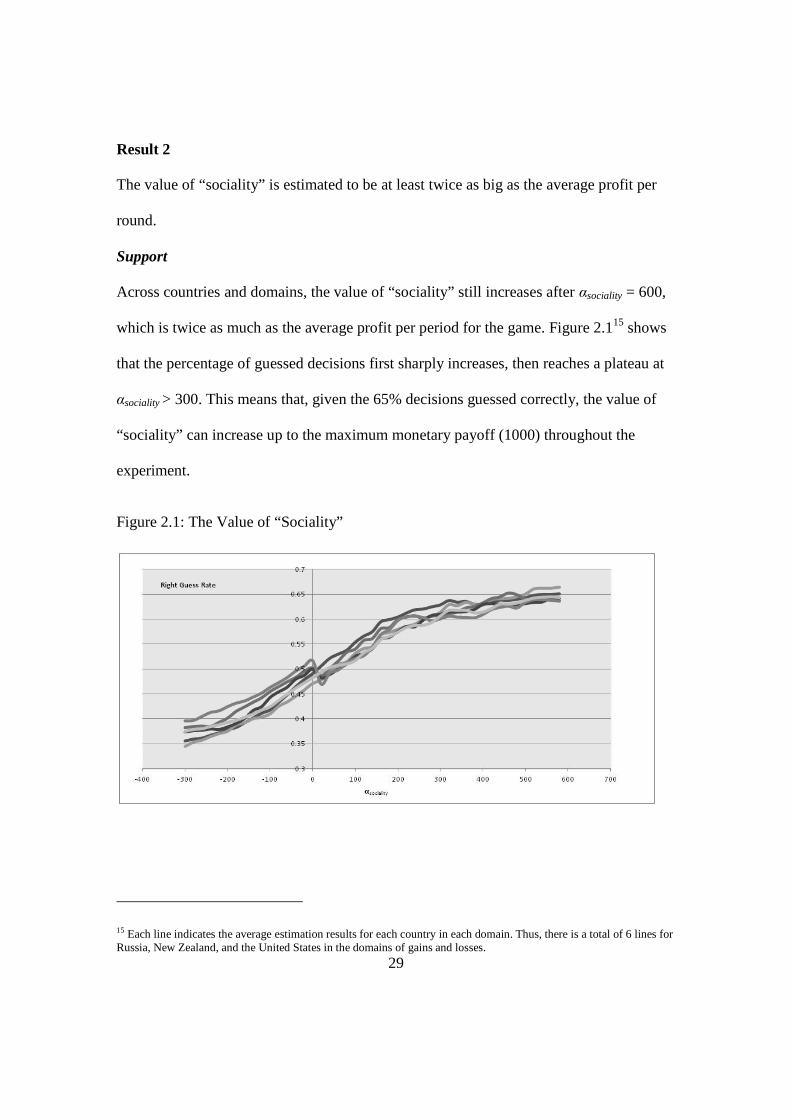
Result 2
The value of “sociality” is estimated to be at least twice as big as the average profit per
round.
Support
Across countries and domains, the value of “sociality” still increases after αsociality = 600,
which is twice as much as the average profit per period for the game. Figure 2.115 shows
that the percentage of guessed decisions first sharply increases, then reaches a plateau at
αsociality > 300. This means that, given the 65% decisions guessed correctly, the value of
“sociality” can increase up to the maximum monetary payoff (1000) throughout the
experiment.
Figure 2.1: The Value of “Sociality”
15 Each line indicates the average estimation results for each country in each domain. Thus, there is a total of 6 lines forRussia, New Zealand, and the United States in the domains of gains and losses.
30
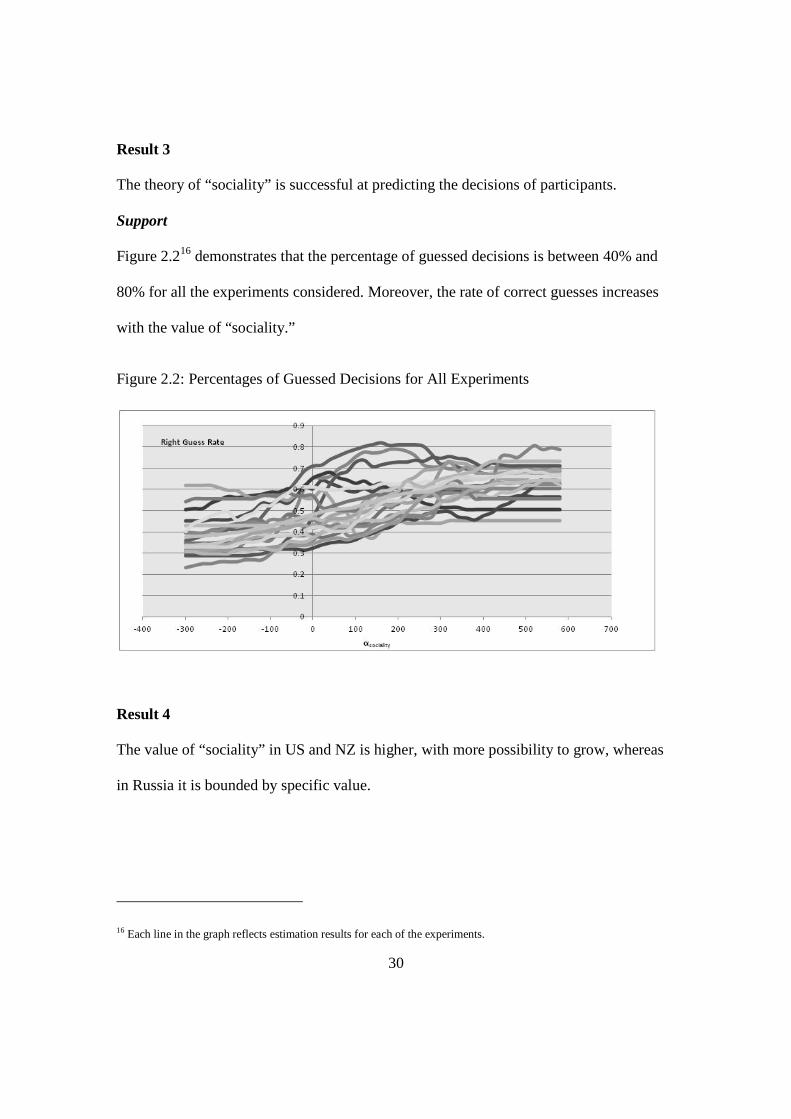
Result 3
The theory of “sociality” is successful at predicting the decisions of participants.
Support
Figure 2.216 demonstrates that the percentage of guessed decisions is between 40% and
80% for all the experiments considered. Moreover, the rate of correct guesses increases
with the value of “sociality.”
Figure 2.2: Percentages of Guessed Decisions for All Experiments
Result 4
The value of “sociality” in US and NZ is higher, with more possibility to grow, whereas
in Russia it is bounded by specific value.
16 Each line in the graph reflects estimation results for each of the experiments.

31
Support
Figure 2.3.117 presents the experiments in Russia in gains, and Figure 2.3.218
demonstrates the experiments in the US19, also in the gains framework. There is a global
maximum, where αsociality ≈ 100 for the graph in Figure 2.3.1, whereas there is none for
the US graph. The rate of guessed decisions keeps increasing with the increase in αsociality.
I ran experiments in different cultural settings to test whether there are differences, but I
were not expecting this intriguing result, which I plan to resolve in future research.
Figure 2.3: Value of “Sociality” for Russia (2.3.1-left) and US (2.3.2-right)
Result 5
“Sociality” persists even after subsequent monetary losses.
17 Each line represents the four experimental trials in Russia in the gains framework.
18 Each line represents the four experimental trials in the United States in the gains framework.
19 The graph for NZ in gains framework looks similar to the graph for US and, therefore, not included in the paper.
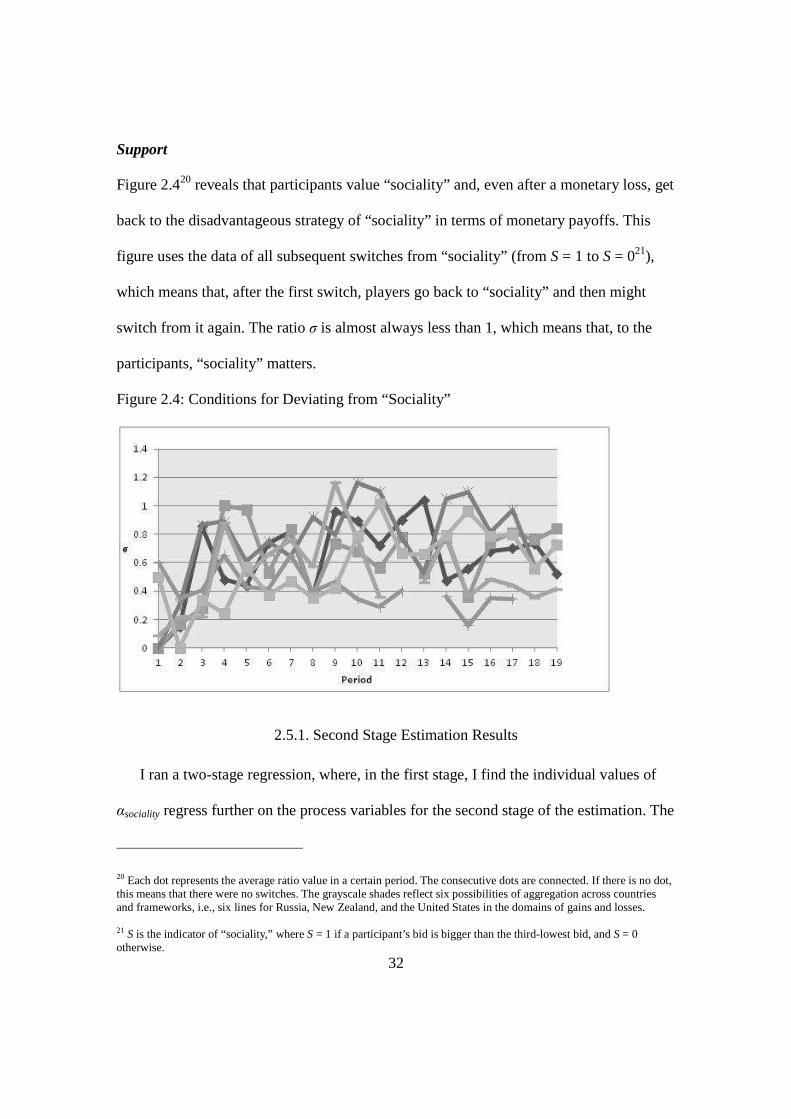
32
Support
Figure 2.420 reveals that participants value “sociality” and, even after a monetary loss, get
back to the disadvantageous strategy of “sociality” in terms of monetary payoffs. This
figure uses the data of all subsequent switches from “sociality” (from S = 1 to S = 021),
which means that, after the first switch, players go back to “sociality” and then might
switch from it again. The ratio σ is almost always less than 1, which means that, to the
participants, “sociality” matters.
Figure 2.4: Conditions for Deviating from “Sociality”
2.5.1. Second Stage Estimation Results
I ran a two-stage regression, where, in the first stage, I find the individual values of
αsociality regress further on the process variables for the second stage of the estimation. The
20 Each dot represents the average ratio value in a certain period. The consecutive dots are connected. If there is no dot,this means that there were no switches. The grayscale shades reflect six possibilities of aggregation across countriesand frameworks, i.e., six lines for Russia, New Zealand, and the United States in the domains of gains and losses.
21 S is the indicator of “sociality,” where S = 1 if a participant’s bid is bigger than the third-lowest bid, and S = 0otherwise.
33
significant coefficients of the second stage of regression, using process variables at time t
and regression with process variables at time t-1, are presented in Tables 2.6 and 2.7,
respectively.
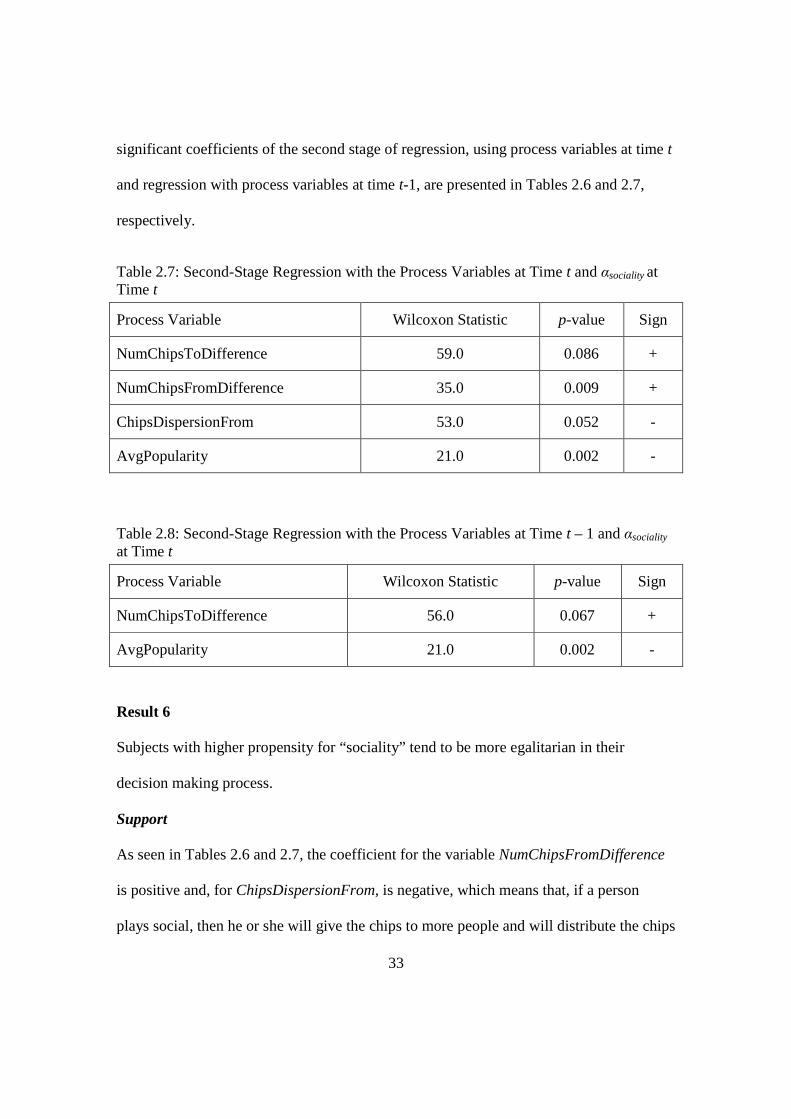
Table 2.7: Second-Stage Regression with the Process Variables at Time t and αsociality atTime t
Process Variable Wilcoxon Statistic p-value Sign
NumChipsToDifference 59.0 0.086 +
NumChipsFromDifference 35.0 0.009 +
ChipsDispersionFrom 53.0 0.052 -
AvgPopularity 21.0 0.002 -
Table 2.8: Second-Stage Regression with the Process Variables at Time t – 1 and αsociality
at Time t
Process Variable Wilcoxon Statistic p-value Sign
NumChipsToDifference 56.0 0.067 +
AvgPopularity 21.0 0.002 -
Result 6
Subjects with higher propensity for “sociality” tend to be more egalitarian in their
decision making process.
Support
As seen in Tables 2.6 and 2.7, the coefficient for the variable NumChipsFromDifference
is positive and, for ChipsDispersionFrom, is negative, which means that, if a person
plays social, then he or she will give the chips to more people and will distribute the chips
34
more equally (less dispersion). In contrast, if a person gives chips to more people, he or
she will play social. These results are robust across countries and domains.
Result 7
Unpopular participants value “sociality,” or being in the social environment, more than
do popular ones.
Support
There is an intriguing correlation between being unpopular and playing social. The
coefficient for the variable AvgPopularity is negative in both Tables 2.6 and 2.7, which
means that, if an individual played social, he or she will be, on average, less popular.
From the other direction, if he or she was, on average, less popular, he or she will play
social. If I reinterpret Result 5 for “sociality” as being how much money a person is ready
to lose to be in the social environment (would like to continue playing in the second and
third stage of the round), then, if one is popular, one is not losing money (total utility is
high, with the material part dominating), and, thus, one’s “sociality” is low. However,
when one is unpopular and loses money,22 one’s “sociality” is high (social utility), and
one demands that the social environment compensate for the total utility staying the
same. This result is robust across countries and domains.
2.6. Conclusion
This chapter has developed a framework for studying the individual decisions of
participants that are made in the social context under the assumption of low stakes. In
22 There is a higher chance for one to be in the three least popular players and to get 0 for the entire round of the game.
35
general, the results of the experiments were consistent with predictions derived from the
theory of “sociality” and the economic model of general utility proposed. First, the
proposed risk attitudes were confirmed. Unlike EUT and prospect theory advocate, I
found risk tolerance in the presence of “sociality,” regardless of framing the experiment
as losses or gains. Second, the value of “sociality” was estimated. This result confirms
that “sociality” has a definitive value for some countries and definitive minimum value
for others when stakes are low. This finding also suggests that the utility function is mis-
specified and that there is a need to define and formalize social utility. Moreover, when
stakes are low, “sociality” is able to compensate for monetary loss. In particular, the
participants equilibrate their twofold profit to “sociality.” Therefore, in the social context,
when stakes are low, human beings value social interaction more than the monetary
outcomes (losses) of such interaction.
The theory of “sociality” was tested in laboratory experiments carried out in New
Zealand, Russia, and the United States, and the results point to striking differences among
cultures. In New Zealand and the United States, the participants value “sociality” to the
highest degree possible in terms of the game payoffs, whereas, in Russia, they tend to
calculate the maximum value for “sociality.” This is another reason why I assert that the
concept of “sociality” is vital for the everyday decisions that human beings make. Many
social scientists are critical of the use of student samples in laboratory experiments.
However, a recent article by Druckman and Kam (2011) argues that, if there are any
constraints in student samples in regard to inferences, they are limited and do not
represent “an inherent problem to experimental research” (J. Druckman & Kam, 2011, p.
41). Nevertheless, the next step is to search for the same patterns in the field. Once
36
similar results are found in the field, the “political implications are profound” (Mercer,
2005, p. 2).
This chapter has applications for the social sciences, business, and any discipline that
considers decision making under risk. As an example, the main results of this chapter
apply to policymaking. For the domain of gains, prospect theory predicts risk averseness,
but the theory of “sociality” anticipates risk tolerance. A policy is viewed as an
instrument to improve procedures, decision-making rules, and well-being and, therefore,
exists in the domain of gains. Depending on the area in which policymakers are working,
they might be interested in implementing risky or riskless policies. The theory of
“sociality” then implies that, if a risky policy (for example, in the environment) needs to
be implemented, the policymaker should make an individual decision (vote) on that
policy while being surrounded by his or her peers, whereas the riskless policy (for
example, in legislature) will be chosen once the policymaker makes an individual
decision while alone or in conversation by phone or computer.
Future work should start with the manipulation of the notions of in-group and out-
group. In particular, given my experimental design, I are able to estimate the value of
“sociality” for the ostracized participants, why they demand “sociality” more than
popular players, and how they behave when interacting with out-group members. Equally
important to this endeavor will be examining how cultural variance may mediate the
relationship between the in-group and the out-group members.
37
CHAPTER III
COOPERATION IN THE SOCIAL DOMAIN
3.1. Introduction
Game theoretic models are often used to identify how cooperation could arise and
what conditions or behavioral traits are necessary for it to evolve. In such models,
cooperation is typically characterized as a public goods game, such as a Prisoner’s
Dilemma (PD) game or ultimatum game, in which two or more “rational” players are
given a choice of cooperating or defecting. The puzzle is why cooperation occurs when
the dominant strategy for any rational actor is to never cooperate, even when the
collective outcome is not a Pareto optimum. Indeed, the experimental findings contradict
the predictions of the deductive models: across a large number of countries, consistent
majorities of college-aged subjects exhibit cooperative and altruistic behavior, even in
single-shot game. Over the last 40 years, a large scholarship has modeled numerous
processes in which a cooperative equilibrium can be achieved. Some scholars explain
cooperation through individual dispositions and iterated dyadic relationships. Others
bring forward the importance of shared norms, beliefs and standards of behavior to
cooperation within much larger social units.
This chapter explores the prospects of cooperation in the PD game; it identifies the
significant markers of cooperative behavior in the experimental setting that includes
social domain and tracks how this behavior changes with time and experience. The recent
38
laboratory experiments23 in three countries and five different cities allow participants to
enter or not enter inherently risky social relationships and, if they entered, play a PD
game. This experimental setup gives an opportunity to identify behavioral features of the
domain of “sociality.” In particular, Myagkov, Orbell and Johnson (2010) successfully
revealed and results of Chapter II confirmed that subjects take more risk than it is rational
across both gains and losses. This chapter uses the same set of laboratory experiments
described in detail in Chapter II, Section 2.4.2. However, it focuses not on how
participants overcome risks of social interactions, but on the changed risk attitudes and
how they influence the decision-making process within those interactions. Instead of the
aggregate data that were used by Myagkov, Orbell and Johnson, I use the individual-level
data. The dataset unfolds the laboratory experiments in United States, New Zealand and
Russia. I develop a discrete choice model in order to trace significant conditions for
cooperation and find that in social domain cooperation rates are significant, they grow
with the increase in demand for social interactions and decrease with experience.
The remainder of this chapter is organized as follows. Section 2 provides an overview
of previous findings in relation to PD game, presents PD game, its payoffs and
equilibrium, and introduces a probabilistic model of cooperation. This section is meant to
prepare for an empirical model given in the next section. The two subsequent sections, 3
and 4, present a brief description of the experiment, the empirical model that I use,
hypotheses that I intend to test, and the data collected. My results are presented in Section
23 These are the same experiment described in full detail in chapter II, Section 2.4.2.
39
5. Finally, in Section 6, I provide a summary of the findings of the chapter and discuss
applications and avenues for future research.
3.2. Theory
3.2.1. Social Domain and Collective Action
Why do people cooperate? How do people choose partners for cooperation? How
does “sociality” affect their decision making? In Chapter II I find that “sociality” makes
humans overcome the risks to enter social interactions. How do these interactions change
in the presence of “sociality?”
The social domain itself has long been argued to be instrumental for the success of
collective action. Marwell, Oliver and Prahl (1988) argued that overall density and
centralization of social ties always has a positive effect on collective action. One of the
key factors that turns social networks into an efficient facilitator of cooperation is its
ability for information revelation about potential cooperators and defectors (Carr &
Landa, 1983; Landa, 1981) as well as the ability to mobilize coercion against those who
cheat (Gambetta, 1988). On the other hand, social environments do not fully eliminate
cheating (defection). Instead, as evolutionary psychologists would argue (Dawkins &
Krebs, 1978; Krebs & Dawkins, 1984), social interactions are often a combination of
individuals attempts to reveal information about others intentions as well as attempts to
manipulate other players into believing in their own good intentions (regardless of it
being true or false). I assert that the social ties are building up on the second step of the
experiment and, thus, include the process of choosing social circle in the study of the
40
cooperative behavior. The main goal of this chapter is to find out what drives cooperation
in the social domain and what makes it change over time.
3.2.2. Prisoner’s Dilemma
The original Prisoner’s Dilemma shows two suspects being interviewed by the police
in relation to a major crime. It is important that they are interviewed in separate cells, so
neither can get any info about the other’s answer. Therefore, it is appropriate to model
this situation with a simultaneous game (Carmichael, 2005). The suspects can either
confess to the crime (defect) or deny any involvement in it (cooperate). A game is a
Prisoner’s Dilemma if it is represented with payoffs a, b, c, d, where c>a>d>b.24 For the
payoff structure25 in the experiments under consideration regardless of what the second
player does the first player is better off defecting, because 1000>700 and 200>0. In other
words defecting is the dominant strategy of the first player. The same logic is true for the
second player. That is why (defect, defect) is the Nash equilibrium of the game, where
Nash equilibrium is defined as a combination of players’ strategies that are best responses
to each other.
The classic Prisoner’s Dilemma (PD) provides a core framework for the choice
between self-interest and common good. It is a dilemma because each player would be
better if neither had defected (700=a > d=200). Making a prior agreement to cooperate is
in common interest of both of the players. Such a decision can be called a jointly rational
behavior, because the players increase their total rather individual payoffs. But unless the
24 For example, for the gains framework a=700, b=0, c=1000, d=200. So, indeed, c>a>d>b.
25 The payoff structure for the experiment in gains and losses frameworks is presented in Chapter II, Tables 2.3.1 and2.3.2
41
agreement to cooperate is enforced in some way the incentive for both prisoners to defect
is so strong that it is unlikely that such an agreement is kept.
As I discussed before the single PD game has a dominant equilibrium strategy: the
players should defect. However, even for single-shot games experimental findings
contradict the game theoretical predictions, i.e. there is cooperation. Only in the infinitely
repeated (iterated) PD game the equilibrium can change to (cooperate, cooperate). Robert
Axelrod’s computer-simulated public goods tournament show that certain behavioral
strategies, such as TIT-FOR-TAT can outplay (defect, defect) strategy over time
(Axelrod, 1987). Although the outcome is often contingent on a number of factors, such
as starting conditions and changes in environment, the important and consistent finding
from these tournaments is that cooperative strategies tend to outperform strategies based
on narrow self-interest.
Generally speaking, the strategy when both players cooperate is beneficial, but risky,
because one needs to find the enforcement mechanism that prevents cheating. The key to
a common good is the case of the reciprocated trust. Cooperation can also flourish, if the
cooperators are able to distinguish between cooperators and cheaters. But in reality it is
almost impossible to identify cooperators, because “cheaters have a strong incentive to
mimic cooperators” (Scharlemann, Eckel, Kacelnik, & Wilson, 2001). Still some studies
provide evidence that people can be successful in detecting cooperators. Frank et al.
(1993) show that 30 minutes for observations before decision-making are almost always
enough to predict actions of subjects.
On the other hand, Wilson and Eckel (2010) showed that both trust and reciprocation
increases when you can choose your partners. Luckily, the choice of partners is
42
implemented in experiments under consideration in the second stage of the round, when
participants distribute chips among others. In laboratory experiments, subjects appear
particularly sensitive to issues of reciprocity and cheater detection, demonstrating
differential cognitive capacities when analytic tests are characterized in terms of social
exchange (Cosmides & Tooby, 1994a). In fact, several neuro-imagining studies report
consistent brain activation patterns, particularly in the stimulation of pleasure centers in
the striatum, among subjects cooperating and punishing cheaters in public goods games
(De Quervain et al., 2004; Sanfey, Rilling, Aronson, Nystrom, & Cohen, 2003). It is these
findings that make evolutionary psychologists assert that just as humans evolved
eyebrows, prehensile thumbs, etc. to help with certain functions, they also evolved
numerous domain-specific cognitive and affective processes to help sustain and enforce
cooperation. Punishing and revealing cheaters, however, is not employed in experiments
that I use. Therefore, for the purposes of this chapter cooperation will be determined
through the types of interaction as well as the ways participants choose partners to enter
social interactions.
3.2.3. PD: Experience, Repetition and Learning
A natural explanation for a significant rate of cooperation in the first rounds of the
game can be found in the inexperience of the subjects (Kagel & Roth, 1995; Ledyard,
1994). Clearly it is necessary to find out whether cooperation rates changes over time and
why do they change. Does experience in playing PD game increases or decreases
cooperation? If everybody learns, i.e. learns a rational selfish strategy, then one should
observe the convergence to the equilibrium in defection after enough rounds.
43
The finite repeated PD game has a definite solution that prescribes non-cooperative
behavior (Kahn & Murnighan, 1993; Mailath & Samuelson, 2006; Osborne &
Rubinstein, 1994). However, even in this condition experimental results do not conform
to this theoretical prediction of defection, although the rates of cooperation do decrease
(Selten & Stoecker, 1986). The experiment under consideration uses repetitions of a PD
game, but it is not an iterated game. Here subjects play PD each time against different
opponent determined by a random draw.
An experiment suggested by Andreoni (1988) displays a comparison between two
types of games: iterated, a treatment that Andreoni calls Partners and non-iterated,
Strangers treatment. Partners are found to cooperate less than Strangers and the
difference increases over time (Ledyard, 1994). As Andreoni points out Strangers may
indeed learn slower, but learning alone cannot explain the difference between the
treatments. It is expected that as soon as one of the players deviates from cooperation the
other should react with non-cooperative choices and cooperation is not established any
more (Selten, 1991; Selten & Stoecker, 1986). Obviously it might take more rounds to
converge in the Strangers scenario, because players might play quite a few rounds until
they meet first defector. However, players’ return to cooperation still remains
unexplained. Playing against another learner might also delay the convergence to the
defection equilibrium, because the adaptation of the other learner might create a non-
stationary environment, where a learner randomly picks between strategies, imitates his
opponent and only after a sufficient number of rounds decides upon a single strategy
(Sandholm & Crites, 1996).
44
A lot is known about the logical structure of PD (Axelrod & Hamilton, 1981) and
what strategies will maximize the outcome. But the dynamics of learning in such
situations, how experience affects individual behavior and how people decide to adopt
certain strategies remain largely unexplored (Silverstein, Cross, Brown, & Rachlin,
1998). This chapter attempts to find some of the answers.
3.2.4. PD: Cultural Aspects
People of different cultural backgrounds possess different values, attitudes and norms
that reflect their heritage. They approach tasks differently. One explanation to the
difference in behavior between cultures lies in the extensive research on distinction
between individualism and collectivism (Hofstede, 1980; Triandis, 1989).
Collectivist cultures, if compared to individualist cultures place greater emphasis on
social norms, shared responsibility and cooperation (Bond & Forgas, 1984; Cox, Lobel,
& McLeod, 1991; P. B. Smith & Bond, 1993). As cross-cultural studies have shown
“northern and western Europeans and North Americans tend to be individualists and
Chinese people, other Asians, Latins and most east and west Africans tend to be
collectivists” (Cox et al., 1991, p. 828). That is why many studies expect American
subjects to be more competitive (Hemesath & Pomponio, 1998; Liebrand & Van Run,
1985; Wong & Hong, 2005) and, thus, less cooperative than, for example, Chinese
subjects, when playing within their cultural group. Furthermore, since the fall of the
Soviet Union Russians are expected to be on the extreme for competitiveness due to the

45
“hvatat” (grab) property of their behavior26 (Menshikov, Menshikova, Myagkov, &
Plott).
Although there is empirical evidence that cultural difference affects at least some
aspects of human behavior the simplistic division between collectivists and individualists
does not explain all variance in behavior. Yamagishi’s findings (Yamagishi, 1988;
Yamagishi & Yamagishi, 1994) challenge collectivist vs. individualist hypothesis. He
finds that Japanese are less cooperative than Americans and explains it through
“institutional view of culture” (Yamagishi, 2003), which states that Japanese cooperate
not because of intrinsic tendency, but because of a system of sanctions and monitoring
(Chen & Li, 2005). That is why when this system is absent, for example in experimental
conditions that do not control for it, predictions of cultural hypotheses are not confirmed.
Recent studies more often report that Chinese are less cooperative than Americans
(Chen & Li, 2005; Weber & Hsee, 1999). Can culture change due to the change of
individual motives within it? Liebrand and Van Rus (1985), prior to the PD game
assessed subject’s social motive (Griesinger & Livingston Jr, 1973; Kuhlman &
Marshello, 1975; McClintock, 1972). Subjects with competitive motives regardless of
their culture were behaving according to their motive and not cultural expectations.
Culture is not the only determinant of human behavior, personal characteristics matter
a big deal (Liebrand & Van Run, 1985). Scholars suggest that gender also plays a great
role, women are generally found to be more cooperative than men (C.C. Eckel &
Grossman, 1998; Stockard, Van De Kragt, & Dodge, 1988), especially in the earlier
26 After the collapse of the Soviet Union most of the national assets were grabbed by force or through privatization on afirst come first serve basis. Russians constantly display the ‘hvatat’ property in their ordinary lives until today.
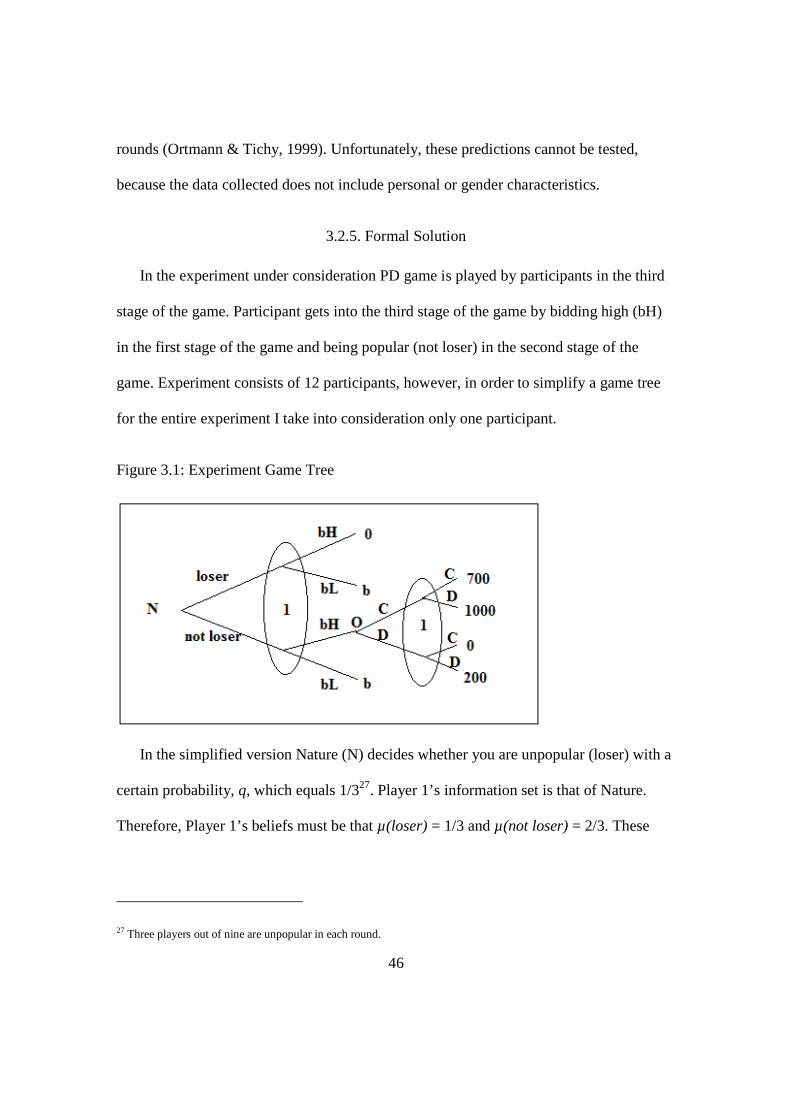
46
rounds (Ortmann & Tichy, 1999). Unfortunately, these predictions cannot be tested,
because the data collected does not include personal or gender characteristics.
3.2.5. Formal Solution
In the experiment under consideration PD game is played by participants in the third
stage of the game. Participant gets into the third stage of the game by bidding high (bH)
in the first stage of the game and being popular (not loser) in the second stage of the
game. Experiment consists of 12 participants, however, in order to simplify a game tree
for the entire experiment I take into consideration only one participant.
Figure 3.1: Experiment Game Tree
In the simplified version Nature (N) decides whether you are unpopular (loser) with a
certain probability, q, which equals 1/327. Player 1’s information set is that of Nature.
Therefore, Player 1’s beliefs must be that µ(loser) = 1/3 and µ(not loser) = 2/3. These
27 Three players out of nine are unpopular in each round.
47
beliefs will be consistent with any strategy, since whatever strategy is being played will
not affect the probability that Player 1 is at either node in the information set.
This experiment has two subgames: PD game and another one represented by the full
game tree. I already mentioned that Nash equilibrium of PD game is defection (D). Thus,
this is the optimal strategy of the subgame PD regardless what strategy the Opponent (O)
chooses. It is also a subgame perfect equilibrium of the entire experiment game because it
forms a Nash equilibrium for each proper subgame. Another Nash equilibrium for the
entire experiment, though not subgame perfect is for Player 1 to bid low.
Although Player 1’s optimal strategy to defect (D) is obvious, what is the condition
for Player 1 to bid high (bH)? In other words, when expected utility to bid high exceeds
the expected utility to bid low? Let me denote the probability of Opponent’s defection as
p, then the expected utility of bidding high is:
)ܧ (ܪ = ∗ݍ 0 + (1 − (ݍ ∗ ∗) 200 + (1 − ( ∗ 1000)
=2
3∗ (1000 − (800
(3.2.1)
)ܧ (ܮ = ∗ݍ + (1 − (ݍ ∗ = (3.2.2)
The necessary condition for Player 1 to bid high is:
2
3∗ (1000 − (800 >
(3.2.3)
or
>2000 − 3
1600
(3.2.4)
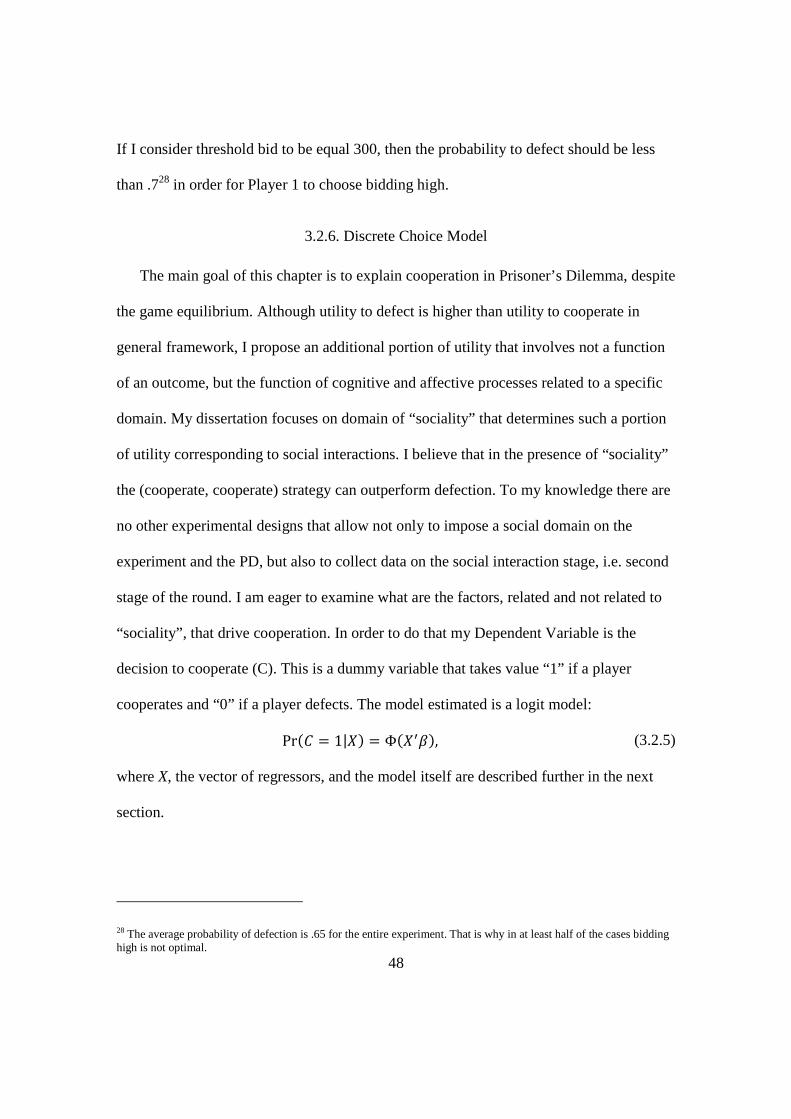
48
If I consider threshold bid to be equal 300, then the probability to defect should be less
than .728 in order for Player 1 to choose bidding high.
3.2.6. Discrete Choice Model
The main goal of this chapter is to explain cooperation in Prisoner’s Dilemma, despite
the game equilibrium. Although utility to defect is higher than utility to cooperate in
general framework, I propose an additional portion of utility that involves not a function
of an outcome, but the function of cognitive and affective processes related to a specific
domain. My dissertation focuses on domain of “sociality” that determines such a portion
of utility corresponding to social interactions. I believe that in the presence of “sociality”
the (cooperate, cooperate) strategy can outperform defection. To my knowledge there are
no other experimental designs that allow not only to impose a social domain on the
experiment and the PD, but also to collect data on the social interaction stage, i.e. second
stage of the round. I am eager to examine what are the factors, related and not related to
“sociality”, that drive cooperation. In order to do that my Dependent Variable is the
decision to cooperate (C). This is a dummy variable that takes value “1” if a player
cooperates and “0” if a player defects. The model estimated is a logit model:
Pr(ܥ = 1|) = Φ(ᇱߚ), (3.2.5)
where X, the vector of regressors, and the model itself are described further in the next
section.
28 The average probability of defection is .65 for the entire experiment. That is why in at least half of the cases biddinghigh is not optimal.
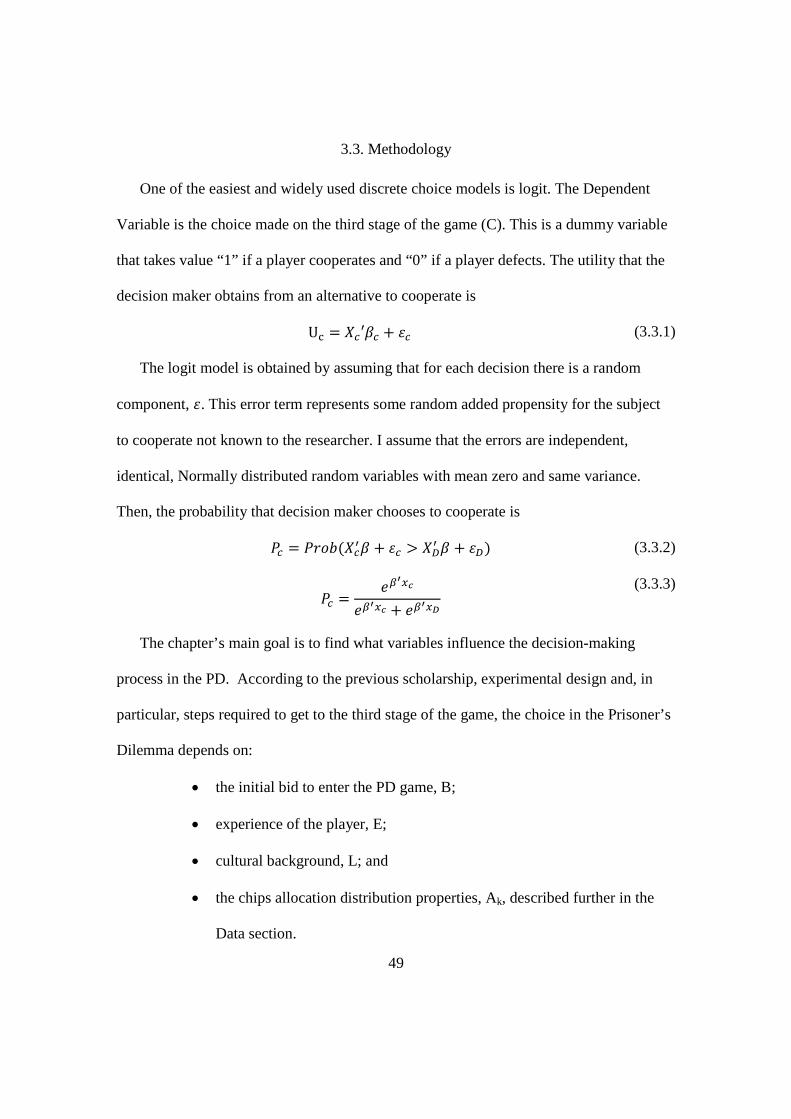
49
3.3. Methodology
One of the easiest and widely used discrete choice models is logit. The Dependent
Variable is the choice made on the third stage of the game (C). This is a dummy variable
that takes value “1” if a player cooperates and “0” if a player defects. The utility that the
decision maker obtains from an alternative to cooperate is
Uୡ = ′ߚ + ߝ (3.3.1)
The logit model is obtained by assuming that for each decision there is a random
component, .ߝ This error term represents some random added propensity for the subject
to cooperate not known to the researcher. I assume that the errors are independent,
identical, Normally distributed random variables with mean zero and same variance.
Then, the probability that decision maker chooses to cooperate is
= ݎ (ᇱߚ+ ߝ >
ᇱߚ+ (ߝ (3.3.2)
=ఉ
ᇲ௫
ఉᇲ௫ + ఉᇲ௫ವ
(3.3.3)
The chapter’s main goal is to find what variables influence the decision-making
process in the PD. According to the previous scholarship, experimental design and, in
particular, steps required to get to the third stage of the game, the choice in the Prisoner’s
Dilemma depends on:
the initial bid to enter the PD game, B;
experience of the player, E;
cultural background, L; and
the chips allocation distribution properties, Ak, described further in the
Data section.
50
I assume that the observed part of utility is a linear function, thus I can write the
utility of choice to cooperate as:
= ߚ + ܤଵߚ + ܧଶߚ + +ܮଷߚ ܣସߚ∑ + ߝ , (3.3.4)
From this baseline model significant markers of social behavior can be identified. I
assume that all independent variables are truly exogenous. An observation for this model
is a PD decision in a single period.29
In addition, I include other variables to the baseline model that were controlled in the
experiment and test for their exclusion. In particular, for each round of the game I
consider profit (P), total profit (TP) of the subject, the minimum bid30 (MB) to get into
the third stage of the game, and framework’s dummies (G). A further discussion of the
variables and descriptive statistics is given in the Data section.
3.3.1. Hypotheses
Aggregate results of the experiments by Johnson et al. (2010) found and Chapter II
confirmed new risk attitudes in the presence of “sociality,” i.e. risk tolerance in both
gains and losses. Risk attitudes were measured by capturing the initial bid and comparing
it to the expected utility of a player for a particular round of the experiment. From the
instructions subjects understood that the three lowest bidders, i.e. three most risk averse,
will not advance to the third stage and play PD game. On the other hand risk tolerance
can be also interpreted as the demand for social interactions. That is why bid is the first
independent variable I consider.
29 I pool observations across all experiments.
30 Minimum bid is the third lowest bid for the round.
51
The ostracism stage (second stage of the round that is described further in the Data
section) provides several independent variables that are properties of the chips allocation
distribution. This is where I can test recent finding that choosing people that you play
with increases trust and, thus, prospects for cooperation(Catherine C. Eckel & Wilson,
2010). However, in this experimental design for a choice of one player to influence the
presence of another in the third stage of the game a player needs to allocate chips
selectively and to a fewer number of players as possible. At the extreme, giving all chips
to one player as well as the presence of chip allocation reciprocity between two players
can also influence the PD outcome by creating a strong trust-based relationship.
Based on previous scholarship the baseline model tests the following hypotheses:
H1: “Sociality” begets “sociality,” i.e. the increase in demand for social interactions
increases the probability of social choice, or cooperation.
H2: The chips allocations on the second stage of the game concentrated on a fewer
number of opponents increase the probability to cooperation.
H3: The more experienced the player is the less likely he is going to cooperate.
H4: Participants from Russian are expected to be the least sharing and cooperative.
52
3.4. Data
The data section of Chapter III replicates parts of the data section of Chapter II. This
is because the experiments used for both chapters are identical. Original data were
collected with the help of the z-Tree31 (Zurich Toolbox for Readymade Economic
Experiments) software package. The same program code was used for experiments in the
United States, Russia, and New Zealand. The experiments were run in 3 different
countries to address the possibility that any finding was (or was not) a function of the
cultural background and in 2 frameworks: gains and losses to reproduce the prospect
theory findings (Kahneman & Tversky, 1979). The data display observations of each
stage of the game, including the PD game over time. Observations reflect the choices of
different sets of 12 participants over 16 experiments. Each experiment contained from 15
to 20 periods. However, the Dependent Variable exists only for the 6 out of 12
participants who entered the PD game in the third stage of the round. The experimental
design is described in detail in Chapter II, section 2.4.2.
3.4.1. Summary Statistics
To empirically implement equation 3.3.4 the rest of the data underwent modification.
The Dependent Variable is the decision to cooperate (C). This is a dummy variable that
takes value “1” if a player cooperates and “0” if a player defects. In the raw dataset,
however, the decisions to cooperate or not were totaled up for a particular period from the
beginning of the experiment. The variable was modified in a dummy-type variable. The
31 http://www.iew.uzh.ch/ztree/index.php
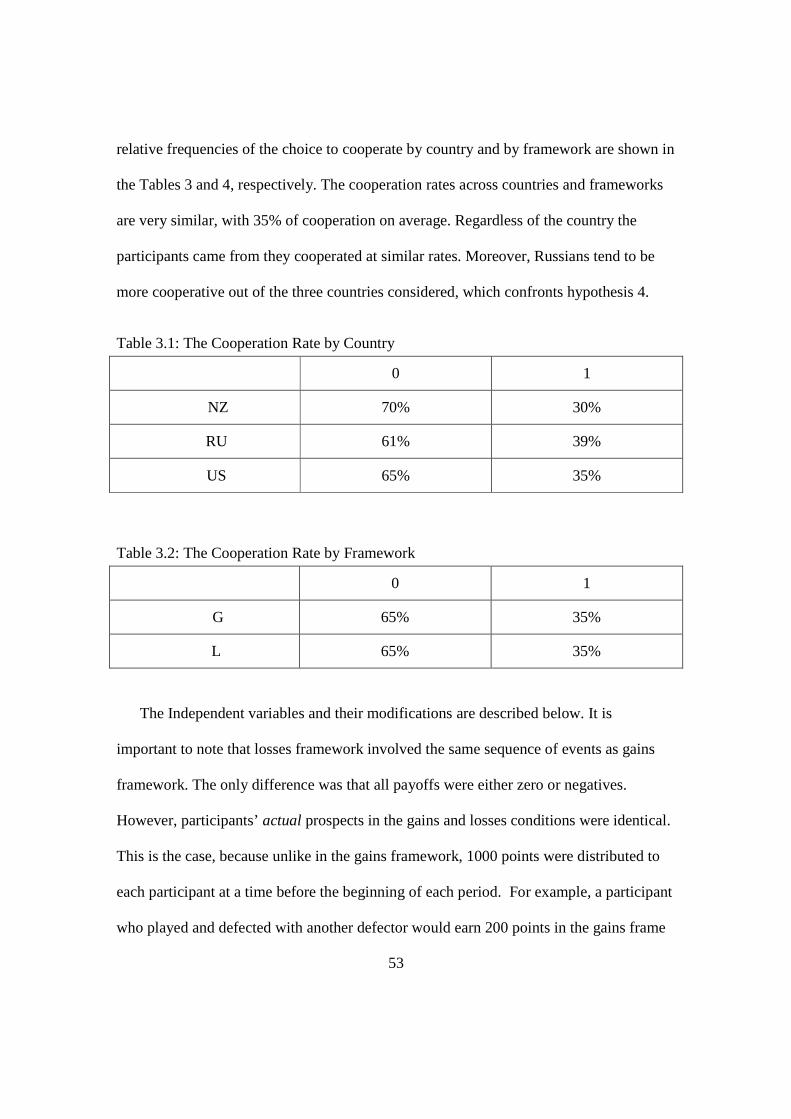
53
relative frequencies of the choice to cooperate by country and by framework are shown in
the Tables 3 and 4, respectively. The cooperation rates across countries and frameworks
are very similar, with 35% of cooperation on average. Regardless of the country the
participants came from they cooperated at similar rates. Moreover, Russians tend to be
more cooperative out of the three countries considered, which confronts hypothesis 4.
Table 3.1: The Cooperation Rate by Country
0 1
NZ 70% 30%
RU 61% 39%
US 65% 35%
Table 3.2: The Cooperation Rate by Framework
0 1
G 65% 35%
L 65% 35%
The Independent variables and their modifications are described below. It is
important to note that losses framework involved the same sequence of events as gains
framework. The only difference was that all payoffs were either zero or negatives.
However, participants’ actual prospects in the gains and losses conditions were identical.
This is the case, because unlike in the gains framework, 1000 points were distributed to
each participant at a time before the beginning of each period. For example, a participant
who played and defected with another defector would earn 200 points in the gains frame
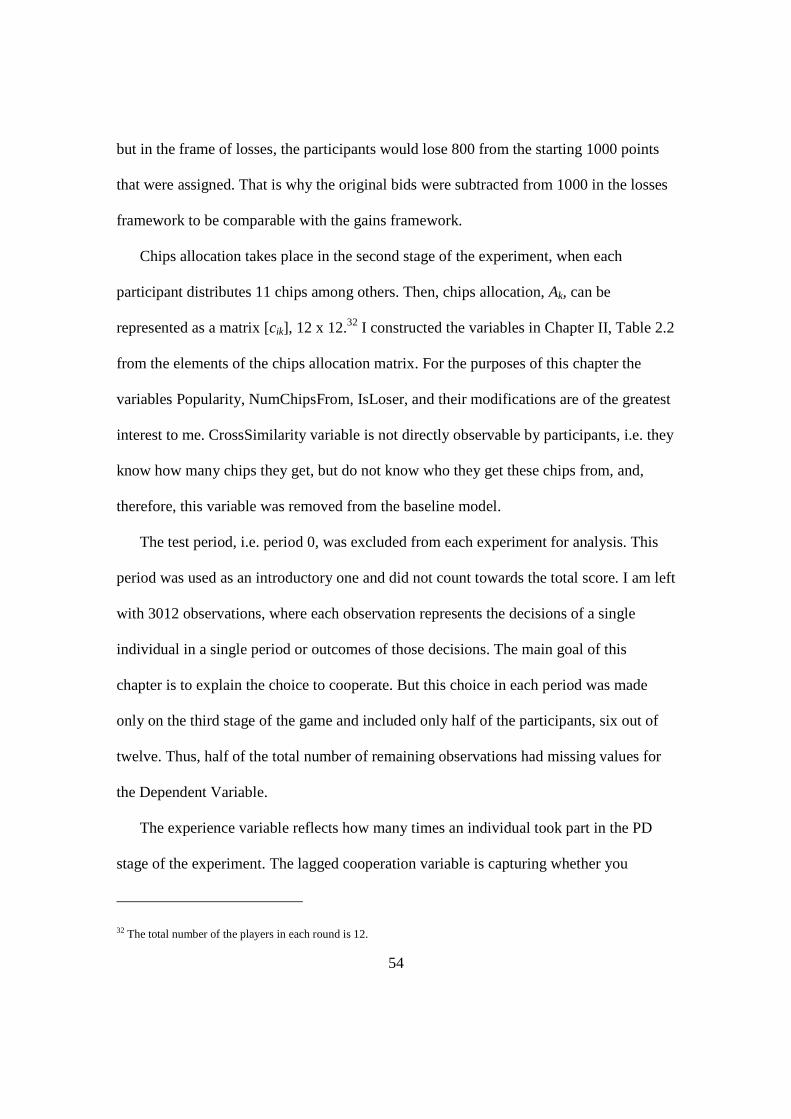
54
but in the frame of losses, the participants would lose 800 from the starting 1000 points
that were assigned. That is why the original bids were subtracted from 1000 in the losses
framework to be comparable with the gains framework.
Chips allocation takes place in the second stage of the experiment, when each
participant distributes 11 chips among others. Then, chips allocation, Ak, can be
represented as a matrix [cik], 12 x 12.32 I constructed the variables in Chapter II, Table 2.2
from the elements of the chips allocation matrix. For the purposes of this chapter the
variables Popularity, NumChipsFrom, IsLoser, and their modifications are of the greatest
interest to me. CrossSimilarity variable is not directly observable by participants, i.e. they
know how many chips they get, but do not know who they get these chips from, and,
therefore, this variable was removed from the baseline model.
The test period, i.e. period 0, was excluded from each experiment for analysis. This
period was used as an introductory one and did not count towards the total score. I am left
with 3012 observations, where each observation represents the decisions of a single
individual in a single period or outcomes of those decisions. The main goal of this
chapter is to explain the choice to cooperate. But this choice in each period was made
only on the third stage of the game and included only half of the participants, six out of
twelve. Thus, half of the total number of remaining observations had missing values for
the Dependent Variable.
The experience variable reflects how many times an individual took part in the PD
stage of the experiment. The lagged cooperation variable is capturing whether you
32 The total number of the players in each round is 12.
55
cooperated last time you entered the game33, in order to avoid large number of missing
values. All independent variables, excluding binary ones, and the summary statistics for
them are shown below, in the Table 3.3.
Table 3.3: Independent Variables Summary Statistics
Variable Obs Mean St. Dev. Min Max
Profit 3012 290.492 320.691 0 1000
Bid 3012 566.219 244.989 0 1000
Popularity 3012 11 4.721 0 42
NumChipsFrom 3012 4.826 2.804 1 11
Experience 3012 4.727 3.781 0 19
3.5. Results
I estimate the model given by equation 3.3.4 using logit34. In Table 3.4, I provide the
estimation results of the baseline model35. It consists of a logit regression with and
without fixed effects for experiments.
33 Only 6 participants out of 12 enter the PD game at each round. Lagged cooperation variable keeps the memory ofyour last PD decision till the next time you enter the game in the third stage of the round.
34 One need to recall that different distributions are used for probit and logit regressions. For logit – a logisticdistribution, and for probit- normal, where the main difference is in tails. Thus, having data at extremes or havingunbalanced set of choices entails significant differences in estimates. However, it’s not the case in my analysis. Theprobit estimates give me the same signs as in logit and similar levels of significance. However, I observe lowermagnitudes, which is due to the calculation of parameters. Thus, I use logit for the further models.
35 The baseline model excluded NumFromChips variable, because it challenges hypothesis of increase in cooperationlikelihood with the ability of choosing specific opponents. Also coefficient for the NumFromChips variable isstatistically significant only at 10% level, but experience variable loses its significance.
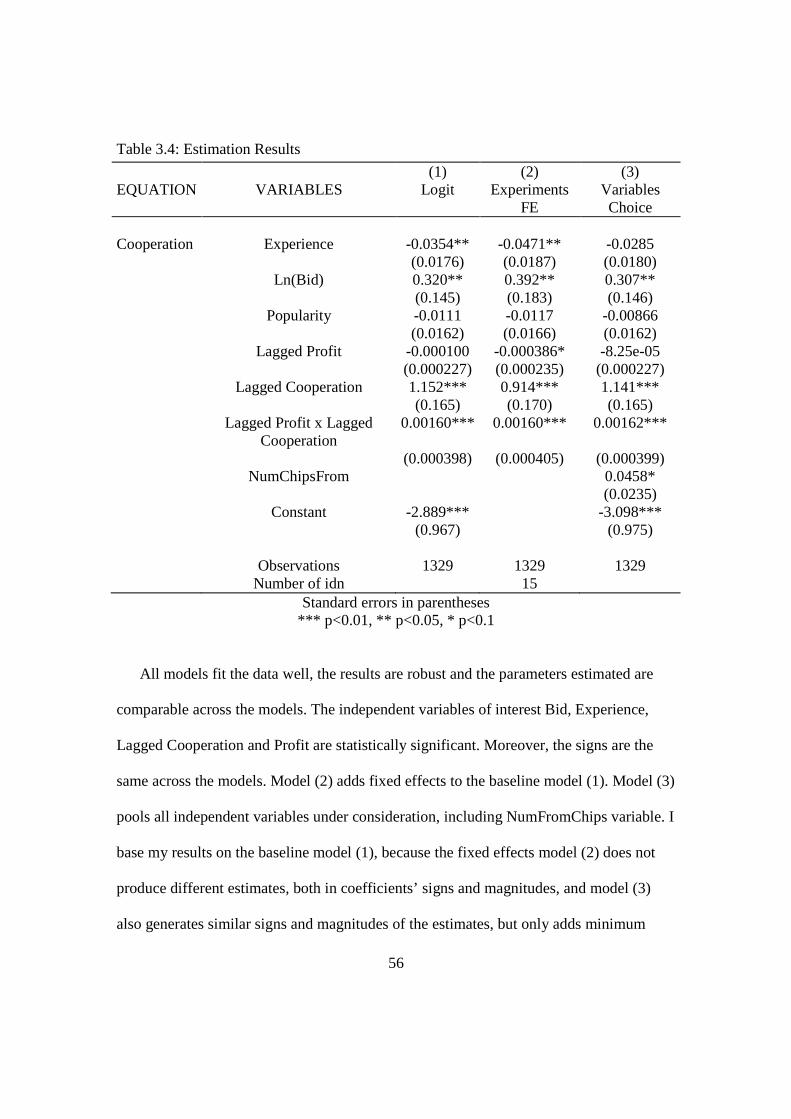
56
Table 3.4: Estimation Results
(1) (2) (3)EQUATION VARIABLES Logit Experiments
FEVariablesChoice
Cooperation Experience -0.0354** -0.0471** -0.0285(0.0176) (0.0187) (0.0180)
Ln(Bid) 0.320** 0.392** 0.307**(0.145) (0.183) (0.146)
Popularity -0.0111 -0.0117 -0.00866(0.0162) (0.0166) (0.0162)
Lagged Profit -0.000100 -0.000386* -8.25e-05(0.000227) (0.000235) (0.000227)
Lagged Cooperation 1.152*** 0.914*** 1.141***(0.165) (0.170) (0.165)
Lagged Profit x LaggedCooperation
0.00160*** 0.00160*** 0.00162***
(0.000398) (0.000405) (0.000399)NumChipsFrom 0.0458*
(0.0235)Constant -2.889*** -3.098***
(0.967) (0.975)
Observations 1329 1329 1329Number of idn 15
Standard errors in parentheses*** p<0.01, ** p<0.05, * p<0.1
All models fit the data well, the results are robust and the parameters estimated are
comparable across the models. The independent variables of interest Bid, Experience,
Lagged Cooperation and Profit are statistically significant. Moreover, the signs are the
same across the models. Model (2) adds fixed effects to the baseline model (1). Model (3)
pools all independent variables under consideration, including NumFromChips variable. I
base my results on the baseline model (1), because the fixed effects model (2) does not
produce different estimates, both in coefficients’ signs and magnitudes, and model (3)
also generates similar signs and magnitudes of the estimates, but only adds minimum
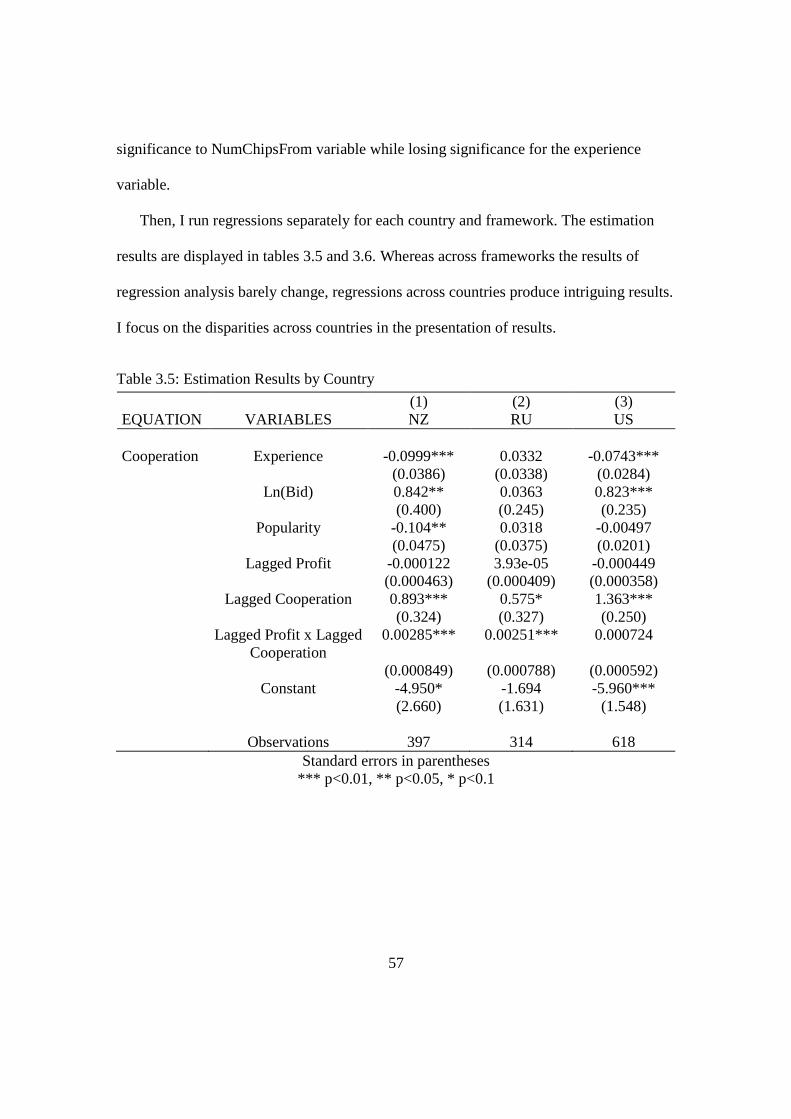
57
significance to NumChipsFrom variable while losing significance for the experience
variable.
Then, I run regressions separately for each country and framework. The estimation
results are displayed in tables 3.5 and 3.6. Whereas across frameworks the results of
regression analysis barely change, regressions across countries produce intriguing results.
I focus on the disparities across countries in the presentation of results.
Table 3.5: Estimation Results by Country
(1) (2) (3)EQUATION VARIABLES NZ RU US
Cooperation Experience -0.0999*** 0.0332 -0.0743***(0.0386) (0.0338) (0.0284)
Ln(Bid) 0.842** 0.0363 0.823***(0.400) (0.245) (0.235)
Popularity -0.104** 0.0318 -0.00497(0.0475) (0.0375) (0.0201)
Lagged Profit -0.000122 3.93e-05 -0.000449(0.000463) (0.000409) (0.000358)
Lagged Cooperation 0.893*** 0.575* 1.363***(0.324) (0.327) (0.250)
Lagged Profit x LaggedCooperation
0.00285*** 0.00251*** 0.000724
(0.000849) (0.000788) (0.000592)Constant -4.950* -1.694 -5.960***
(2.660) (1.631) (1.548)
Observations 397 314 618Standard errors in parentheses
*** p<0.01, ** p<0.05, * p<0.1
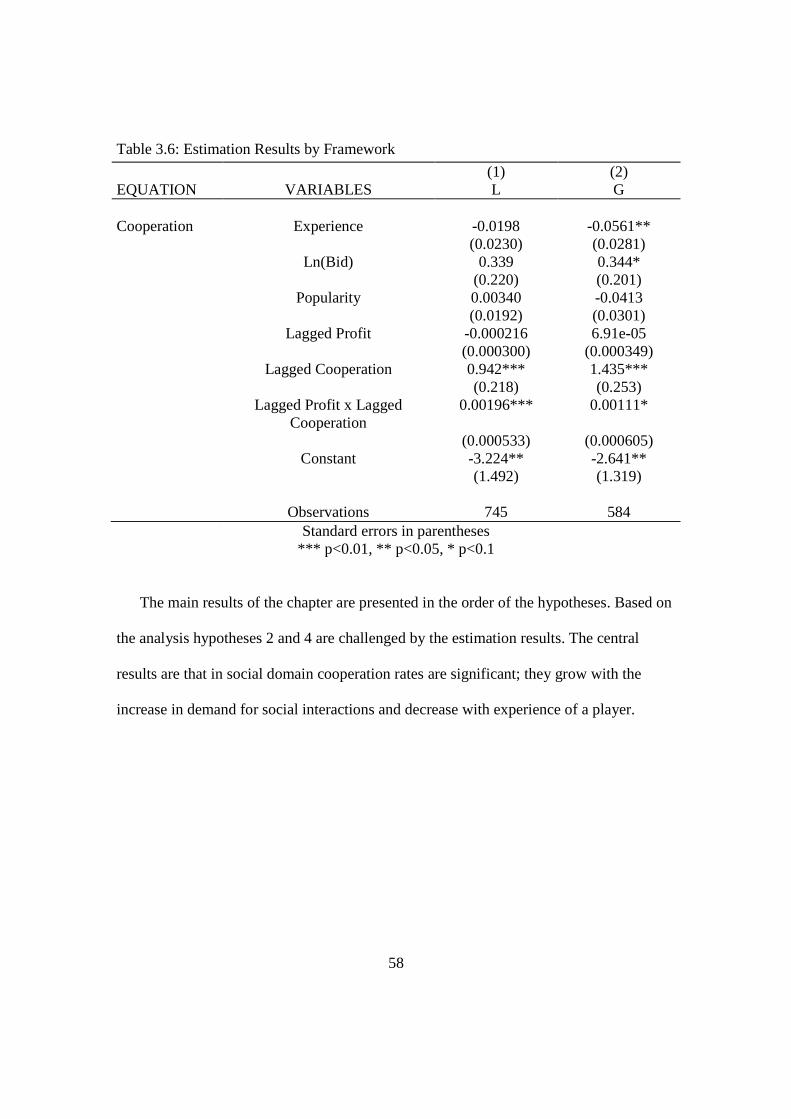
58
Table 3.6: Estimation Results by Framework
(1) (2)EQUATION VARIABLES L G
Cooperation Experience -0.0198 -0.0561**(0.0230) (0.0281)
Ln(Bid) 0.339 0.344*(0.220) (0.201)
Popularity 0.00340 -0.0413(0.0192) (0.0301)
Lagged Profit -0.000216 6.91e-05(0.000300) (0.000349)
Lagged Cooperation 0.942*** 1.435***(0.218) (0.253)
Lagged Profit x LaggedCooperation
0.00196*** 0.00111*
(0.000533) (0.000605)Constant -3.224** -2.641**
(1.492) (1.319)
Observations 745 584Standard errors in parentheses
*** p<0.01, ** p<0.05, * p<0.1
The main results of the chapter are presented in the order of the hypotheses. Based on
the analysis hypotheses 2 and 4 are challenged by the estimation results. The central
results are that in social domain cooperation rates are significant; they grow with the
increase in demand for social interactions and decrease with experience of a player.
59
Result 1
Despite the Prisoner’s Dilemma equilibrium, a significant proportion of subjects
cooperated in the presence of “sociality.”
Support
The incidence of cooperation across countries and frameworks is reported in tables 3.1
and 3.2. It is obvious that Nash expectation of zero cooperation in such PD games is not
supported. The average rate of cooperation is 35% and is robust across countries and
frameworks.
Result 2
“Sociality” begets “sociality”, i.e. the increase in the demand for “sociality,” increases the
rates of cooperation, or “social” choice.
Support
Hypothesis 1 is supported by the estimated model in Table 3.4. In particular, this is
shown with the positive coefficient for the bid variable. I consider bid as a demand for
the social interaction stage of the round, i.e. Prisoner’s Dilemma, thus, the positive sign
of the coefficient means that the increase in bid that a player decides upon increases the
likelihood of cooperation.
Result 3
Sharing with others is critical for cooperation.
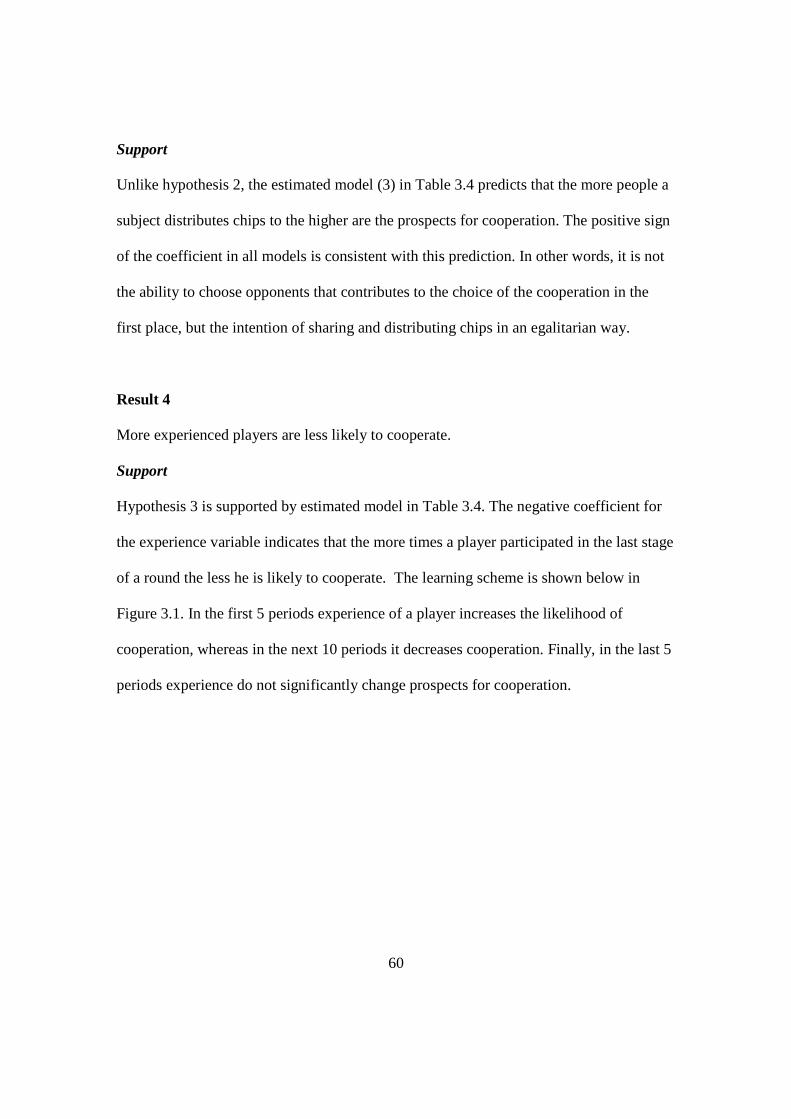
60
Support
Unlike hypothesis 2, the estimated model (3) in Table 3.4 predicts that the more people a
subject distributes chips to the higher are the prospects for cooperation. The positive sign
of the coefficient in all models is consistent with this prediction. In other words, it is not
the ability to choose opponents that contributes to the choice of the cooperation in the
first place, but the intention of sharing and distributing chips in an egalitarian way.
Result 4
More experienced players are less likely to cooperate.
Support
Hypothesis 3 is supported by estimated model in Table 3.4. The negative coefficient for
the experience variable indicates that the more times a player participated in the last stage
of a round the less he is likely to cooperate. The learning scheme is shown below in
Figure 3.1. In the first 5 periods experience of a player increases the likelihood of
cooperation, whereas in the next 10 periods it decreases cooperation. Finally, in the last 5
periods experience do not significantly change prospects for cooperation.
61
Figure 3.2: Learning Model
Result 5
Participants from Russia cooperate more than participants from other countries and their
choice of cooperation is dependent on the profit they received last time they cooperated.
Support
Unlike hypothesis 4 suggests, Russians are found to be more cooperative then
participants from other countries based on the Table 3.1 results. Unlike, NZ (1) and US
(3) estimation that corroborate baseline model results in Table 3.5, in Russia (2) the only
independent variables that have statistically significant coefficients are lagged
cooperation and interaction term, which indicates that Russians base their decision solely
.2.3
.4.5
.6P
r(C
oo
per
atio
n)
0 5 10 15 20Experience
Period 1-5 Period 11-15
Period 6-10 Period 16-20
62
on their profit last time they cooperated: the higher the profit they get last time they
cooperated the higher the prospects of cooperation.
Result 6
More popular players cooperate less.
Support
Based on the results of estimation for New Zealand in Table 3.5, model (1) the more
popular the player is the less he is likely to cooperate (negative coefficient for popularity
variable). This is the only case where popularity variable is statistically significant.
Popular players mimic cooperators, but in reality they do not need to appear ‘friendly’ in
PD game in order to gain support from other players.
3.6. Conclusion
The main result of this chapter is that cooperation, or social choice, increases with the
presence of “sociality.” Given the results of estimated models in Table 3.4, I am able to
support two out of four hypotheses I made based on theory and previous literature
assumptions. I find that increase in the demand for “sociality” improves rates of
cooperation, whereas the experience in PD game decreases cooperation. Unlike
hypothesis 2, the estimated model suggests that more egalitarian a player is in distributing
chips the higher are the chances of cooperation. In addition, my model supported
previous results on the importance of the trust between the subjects. The trust gained in
63
the experimental settings is due to the control of the experimental environment, or
“sociality”. Participants distribute chips and expect chips and cooperation in return.
The results suggest that future research should start with the recognition of the
countries’ effects and their theoretical grounding. The disparities between the countries
are striking, however, the background research neither expects, nor explains them. This
chapter is based on the single choice of cooperation. Unlike this, the analysis can be
based on the sequence of two choices (CC, CD, DC, DD), one for the current period, the
other for the last period the participant entered the PD game, and estimated using
multinomial logit. On the other hand, the model can be constructed using the longer
sequences of choices, i.e. multiple-spell model of “social” choice dynamics. The main
purpose of such a model is to investigate the time before a certain event occurs. Zero
profit after PD stage of the game can be presented as this event. Thus, not only I can find
out what causes the events of interest, but also I can look for the evidence of lagged
duration dependence, i.e. the impact of the length of initial spell on the probability of
subsequent events.
Variables of the second stage of the round, the properties of chips allocation
distribution, were not statistically significant in the models presented. However, the
second ostracism stage is the most intriguing one, although ambiguous, since it is mostly
dependent on the emotional state of the participants. In the real world humans are
normally able to influence the pool from which their social contacts are drawn and,
thereby, they have some capacity to control the risk that is involved in PD-type games
played with the members of that pool. The vivid example is admission committees in the
academic departments, where choosing the ‘right’ people will foster cooperation within
64
the department. However, it may not happen in the laboratory setting of the experiment
described.
The further research can be done to focus on players, who are left behind, i.e.
unpopular players that are willing to play in the PD game, but do not receive enough
chips, or support from other players. These players appear to be a problem for social
environments, like the one constructed by these experiments, because on average
unpopular players defect more on others, possible in revenge for not being chosen in the
previous rounds and being indicated as unpopular. Can it be the case that not only
unpopular players behave in an unsocial way, but also unsocial behavior is the cause for
unpopularity?
Social dilemmas and experimental designs that recreate them abound. On the one
hand, cooperative behavior, such as giving to charity, voting in elections, contributing to
public goods, participating in local politics or even leaving tips in the restaurants where
one will never return is believed to be beneficial for the social environment and,
therefore, it is worthy for each individual in the long-run. On the other hand, when one
examines the cooperative actions one by one a good economic reasoning for them often is
not seen, especially, in the long-run, when one learns how to play the PD-type games and
what strategies to choose. Moreover, as cooperation is not socially embedded in societies,
it requires a system of governance (Teece, 1992; Yamagishi, 2003) that facilitates
coordination and ensures cooperation. The apparent failure of current structures results in
dilemma’s status being preserved.
65
CHAPTER IV
NEUROBEHAVIORAL FEATURES OF “SOCIALITY”
4.1. Introduction
In this chapter I focus on neurobehavioral features of “sociality.” Functional magnetic
resonance imaging (fMRI) (Huettel, Song, & McCarthy, 2004) is the recent sophisticated
technology that allows researchers to study functional neuroanatomy of the human brain
noninvasively. Due to its noninvasive nature, it can be used in healthy human volunteers,
including children. The imaging is based on the fact that two different forms of the
hemoglobin molecule - oxyhemoglobin (when hemoglobin binds oxygen in the lungs)
and deoxyhemoglobin (when hemoglobin releases the oxygen in the peripheral tissues)
have slightly different magnetic properties. This difference is detected by the fMRI
method in the brain with a millimeter resolution. When one region of the brain works
harder than others during a particular task (e.g., visual cortex during perception of visual
stimuli), there is more inflow of blood to this region leading to a higher concentration of
oxyhemoglobin relative to other, non-active sites of the brain.
For the past 15-20 years, the fMRI has been used extensively to study brain
activations related to higher cognitive functions, including attention, language, memory,
emotions and others. In recent years, there has been a growing interest to apply this
methodology to study brain mechanisms of more complex human behaviors, including
social interactions, economic or political decisions (Huettel et al., 2004). Currently
neuroimaging is also seen as the key tool to understand the nature of the various peculiar
aspects of human behavior such as “economic irrationality” (Peterson, 2005), altruism
66
and “altruistic punishment” (De Quervain et al., 2004; Waytz, Zaki, & Mitchell, 2012),
asymmetry between gains and losses (Yacubian et al., 2006), preference of egalitarian
outcomes (Sanfey et al., 2003; Schreiber et al., 2010; Tricomi, Rangel, Camerer, &
O’Doherty, 2010) and many others. Use of this methodology has the potential to advance
the knowledge of the existing theoretical accounts of how people make decisions and
judgments by informing and constraining these models based on the underlying
neuroscience.
This chapter aims to utilize the fMRI technology in combination with laboratory
experiments in an attempt to study brain mechanisms of human social interactions. The
research questions include: In what regions of the brain is there an increased activation
associated with interaction with humans as opposed to playing computer? Are the brain
bases of social welfare choice different from those of collective action? Does the neural
basis for the preference of egalitarian outcomes in the presence of “sociality” differ from
the one without; if yes, map the difference in the brain?
The remainder of this chapter is organized as follows. Section 2 provides an overview
of previous findings of neuroscience in relation to social domain. This section is meant to
present hypotheses that are tested in the next sections and establish the theoretical
grounding for the stimuli used in the experiments. The two subsequent sections, 3 and 4,
present descriptions of the laboratory as well as fMRI experiments, the models that I use
for analysis, and the data collected. My results are presented in Section 5. Finally, in
Section 6, I provide a summary of the findings of the chapter and discuss applications and
avenues for future research.
67
4.2. Theory
The interest in using biological variables to explain social behavior has been for a
long time, however, biological approaches to social psychology were seen as
“reductionist and having little to contribute to ‘real’ conceptual debates in the field”
(Harmon-Jones & Winkielman, 2007, p. 3).Only in recent years a new discipline social
neuroscience (Cacioppo et al., 2002) started to emerge, which is an attempt to understand
mechanisms that underlie social behavior using a mix of biological and social approaches
(Willingham & Dunn, 2003). On the other hand a relatively new discipline
neuroeconomics opens up the “black box” of the brain by finding neural correlates of
choice behavior (C. Camerer, Loewenstein, & Prelec, 2005; Lohrenz & Montague, 2008)
and behavior under risk and uncertainty (Hsu, Bhatt, Adolphs, Tranel, & Camerer, 2005).
Unfortunately, current knowledge of neural mechanisms for social decision making is
still limited (Lee, 2008).
What are the benefits and contributions of neuro- disciplines? First of all, the additive
value of neuroimaging lies in the fact that the same behavior can be caused by activity in
different regions of the brain (Krueger, Grafman, & McCabe, 2008). Second, if social
cognition constantly results in a different pattern of brain activity than non-social one and
the regions of brain activation during social cognition have a special status (high levels of
activity even at rest) in the brain (Adolphs, 2003; Jenkins & Mitchell, 2011). If this is
true to what extent are brain systems that control social behavior domain specific
(Cosmides & Tooby, 1994b; Stone, Winkielman, & Harmon-Jones, 2007)? If
evolutionary perspective provides theoretical grounding for domain specificity,
neuroscience then gives an opportunity to investigate it.
68
My dissertation focuses on the domain of “sociality.” In particular, chapter II
estimates the additional value that individuals place on being in the social environment
by foregoing material resources and, thus, personal gain. Similar study was done in
neuroscience (Zaki & Mitchell, 2011) and its results suggest that many behaviors are
aimed at maximizing social, not personal material outcomes. This happens because
people see intrinsic value in social ideals, such as equity and fairness, or, in other words,
“fairness can be its own reward” (Zaki & Mitchell, 2011, p. 4). If this study considers
social ideals having value in itself, my dissertation explores the additional value that
processes in the domain of “sociality” possess. Although with the experiments I carry out
I am not able to distinguish between the value in itself and the value of the processes
involved, this remains an ambitious goal for future experiments. Nevertheless, in this
chapter I attempt to find what brain regions are corresponding to a neural value of
“sociality” and lay foundation in future to identify and estimate this neural value.
I use a set of computer and fMRI experiments to achieve this goal. At first, I was
trying to replicate as close as possible the experiments used for chapters II and III in
order to use them in the scanner. However, I gave in on this arduous task and decided that
a simpler experiment will serve me better, especially given my first interaction with fMRI
data. Both computer and fMRI experiments are described in detail in Section 3 of this
chapter. The experiments use Prisoner’s Dilemma game and Welfare game. Whereas PD
game was thoroughly described and theoretical solution found in chapters II and III of my
dissertation, Welfare game is new to this manuscript. The rest of the Theory section I
devote to finding Nash equilibrium in the Welfare game and discussing its results and
applications.
69
Welfare game resembles a simultaneous version of the Ultimatum game with unfair
offer. The Ultimatum game is a game often played in laboratory experiments in which
two players interact to decide how to divide a sum of money that is given to them. One of
the players proposes how to divide the sum between the two players, and the other can
either accept or reject this proposal. If the second player rejects, none of the players
receive anything. However, if the second player accepts, the money is split according to
the proposal. Usually the game is played only once or with randomly chosen partner so
that reciprocation is not an issue. Also quite often players do not change roles within one
game.
The equilibrium in the Ultimatum Game is not in the favor of the second player. By
rejecting the proposal, the second is choosing nothing rather than something. So, for a
rational player it would be better to accept any proposal that gives any amount bigger
than 0. Unlike that multiple studies (Henrich, 2004; Oosterbeek, Sloof, & Van De Kuilen,
2004) show that in many cultures people offer (50:50) splits and offers less than 20% are
usually rejected.
Welfare game payoffs structure is represented in experimental design section in table
4.2. Based on the payoffs the row chooser always prefers to choose up. The column
chooser’s best response to the row chooser’s dominant strategy is to choose left. That is
why the Nash equilibrium is (2; 6). However, the row chooser always gets the worse
payoff, than that of the column chooser. So, if the row chooser prefers egalitarian
outcomes, the row player’s deviation from the equilibrium can occur and result in either
of the two egalitarian options: (1; 1) and (4; 4).
70
The utility function defined solely on the outcomes is not able to explain the
preference for egalitarian outcomes. Instead, the additional portion of utility that I address
in Chapter II and is defined on the specific processes in the presence of “sociality” should
reveal which processes are crucial for the choice of egalitarian outcomes. On the other
hand, fMRI experiments help to map the activation related to the egalitarian outcomes
preferences in the brain.
4.2.1. Inequity Aversion
The preference of egalitarian outcomes can be introduced as the individual utility
function composed of both the player’s own payoff and the payoff of others (Fehr &
Schmidt, 1999). Then, the second component is weighted negatively if other players have
higher payoffs, and positively if they have lower payoffs. As such, if a player’s payoff is
held constant, he would prefer that others receive the same amount rather than more or
less. This concept of inequity aversion was proposed by Fehr and Schmidt (1999) to
capture the notion of fairness. It may provide an explanation to the well-known failure of
the traditional game theory to predict the results of the Ultimatum game (C. Camerer,
2003). This concept may even be a part of altruistic punishment, in the sense that players
want to punish not the free-riders, but those who do well, because while rich are often
viewed with contempt, people tend to sympathize with the poor.
Such preferences may be rational from an evolutionary standpoint. Clearly, an
individual should not like to lose out in a competition. In contrast, being too far ahead in
a competition may result in ostracism. Egalitarian preferences are close to those of
altruism, only being directed towards the least well off, which also makes sense from an
71
evolutionary perspective. Sacrificing some of your income if it is high to ensure that the
poor have the necessities may be an evolutionary stable strategy in kin groups. Inequity
aversion may also survive the transition to higher stakes. While market liberalization and
free trade may be beneficial to two states in international trade, if it benefits one more
than the other you may see resistance from the trade partner who would “lose out” to the
other. Inequity aversion can, therefore, be an example of rational behavior and can
explain some of the failures of rational self interest in predicting laboratory behavior.
Several utility function have been developed to account for the fairness concept and
not just monetary gains (Bicchieri & Chavez, 2010). Fehr-Schmidt model illustrates this
approach, but it is defined only on the outcomes as shown above. On the other hand, the
model developed by Rabin (1993) is focused on the role of actual actions and beliefs in
determining utility, i.e. on the processes and not the outcomes. In particular Rabin
introduces “kindness” of the player (Rabin, 1993, p. 11) and incorporates the individual
belief of one player about “kindness” of her opponent into the utility function. Moreover,
the reciprocity is taken care of with the interaction term. This is a great insight of how to
model the utility function defined on beliefs. Nevertheless, I do not implement this
approach in my dissertation and only discuss its applications to the theory of “sociality”
in the last chapter.
4.2.2. Hypotheses
Previous research in neuroeconomics suggested the necessity to understand how brain
evaluates potential goals and outcomes. What brain structures are responsible for the
computation of the economic value? What other cognitive, emotional and visceral
72
processes affect this computation? Scholars find that the ventral striatum, ventromedial
prefrontal cortex (VMPFC) and medial orbitofrontal cortex (OFC) areas are involved in
the assignment of value to stimuli at the time of decision making (Hare, O'Doherty,
Camerer, Schultz, & Rangel, 2008; Plassmann, O'Doherty, & Rangel, 2007). Earlier
animal research found that activation in ventral striatum of monkeys is sensitive to new
knowledge about rewards (Montague, Dayan, & Sejnowski, 1996), whereas further
research on humans displayed activation in dorsal and ventral striatum and VMPFC
related to anticipation and acquiring of monetary rewards (Knutson, Fong, Adams,
Varner, & Hommer, 2001). Although Damasio (1994) argued that VMPFC plays a huge
role in encoding the consequences of alternative courses of action affectively, strict
functional differences between the orbitofrontal and ventromedial areas are not fully
known (Loewenstein, Rick, & Cohen, 2008). However, VMPFC is found to be less
associated with social functions and more with just regulation of emotions, whereas OFC
is more active during guessing tasks and decisions under uncertainty(Schnider, Treyer, &
Buck, 2005). Based on the results of the previous research I propose the following
preliminary hypothesis:
H1: The difference in response and activation in ventral striatum, VMPFC and medial
OFC areas are likely to be found between the human and computer conditions of fMRI
experiment as well as between Welfare and PD games.
Furthermore, the “rational” decision making is found to be correlated with superior
working memory (Devetag & Warglien, 2003) that, in turn, correspond with increased
73
activity in the dorsolateral prefrontal cortex (DLPFC) (Carter & Van Veen, 2007;
Krueger et al., 2008; Weissman, Perkins, & Woldorff, 2008). In particular, DLPFC plays
an important role in creating links between our actions and their eventual outcomes in
working memory (Genovesio, Tsujimoto, & Wise, 2006). However, social situations
often require the brain not only to use previous experiences to select future behavior, but
also to form some beliefs about other person and better predict other players’ choices.
Current research suggest that two regions of the human brain, such as DLPFC and the
posterior superior sulcus (posterior STS), play crucial roles in evaluating others behavior
(Krueger et al., 2008). STS is found to be more activated when people play PD and
Ultimatum games against another person than when they played against computer
(Rilling, Sanfey, Aronson, Nystrom, & Cohen, 2004). If activation in DLPFC may
contribute to rationality of decisions in social situations (Weissman et al., 2008), the
prosocial decision making, on the other hand, is expected to be connected to the
activation in the regions of the temporoparietal junction (Emonds, Declerck, Boone,
Vandervliet, & Parizel, 2011). That is why I hypothesize:
H2: There will be likely an increased activity in the DLPFC, when the participant plays a
computer or when he plays a human and chooses defection in PD game and is accepting
inequity in Welfare game, whereas when she plays a human and makes cooperation or
fairness choice in the game there will be likely an increased activity in the regions of the
temporopatietal junction and STS.
74
Similarly, brain regions associated with reward should be more active during fair,
than during unfair condition. These reward regions include the ventral striatum, the
amygdala, VMPFC and OFC (Cardinal, Parkinson, Hall, & Everitt, 2002; Tabibnia,
Satpute, & Lieberman, 2008; Trepel, Fox, & Poldrack, 2005), where amygdala and OFC
are regions critical for processing emotions (Davidson, Putnam, & Larson, 2000; Dolan,
2002). VMPFC is also reported to activate during tasks involving inequality in social
settings (Fliessbach et al., 2007; Tabibnia et al., 2008; Tricomi et al., 2010). Therefore, I
hypothesize:
H3: There will be likely increased activity in the VMPFC, amygdala and OFC in Welfare
game condition as opposed to PD game condition.
Although I identify the regions of interest for my hypotheses, I do not implement a
region of interest (ROI) analysis. Instead I use whole brain contrasts to isolate neural
activity associated with making decisions in the social circles playing a computer further
described in Section 4 of this chapter.
4.3. Methodology
4.3.1. Computer Experiment
The first group of subjects for the computerized portion of experiment is 48 college
students (10 females) recruited from “Corruption and Mafia” class that Mikhail Myagkov
taught at University of Oregon in Fall 2010. All participants were required to sign the
necessary informed consent forms. Before the experiment began, the players were asked
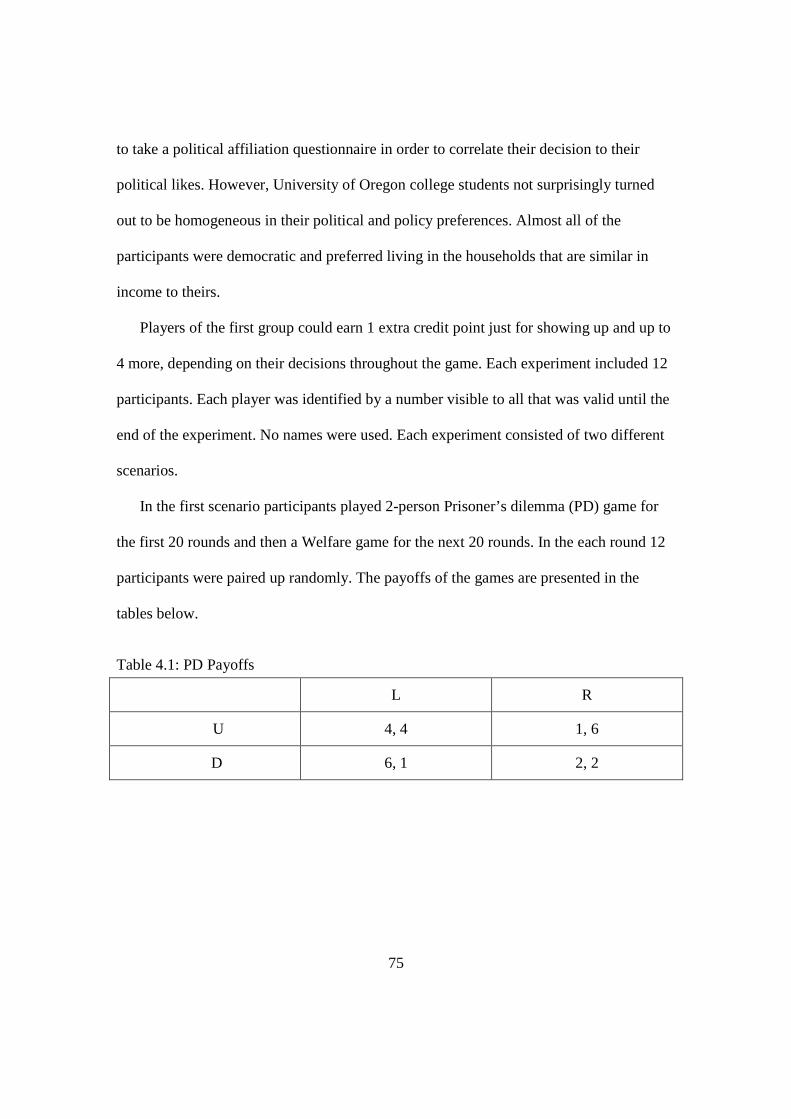
75
to take a political affiliation questionnaire in order to correlate their decision to their
political likes. However, University of Oregon college students not surprisingly turned
out to be homogeneous in their political and policy preferences. Almost all of the
participants were democratic and preferred living in the households that are similar in
income to theirs.
Players of the first group could earn 1 extra credit point just for showing up and up to
4 more, depending on their decisions throughout the game. Each experiment included 12
participants. Each player was identified by a number visible to all that was valid until the
end of the experiment. No names were used. Each experiment consisted of two different
scenarios.
In the first scenario participants played 2-person Prisoner’s dilemma (PD) game for
the first 20 rounds and then a Welfare game for the next 20 rounds. In the each round 12
participants were paired up randomly. The payoffs of the games are presented in the
tables below.
Table 4.1: PD Payoffs
L R
U 4, 4 1, 6
D 6, 1 2, 2
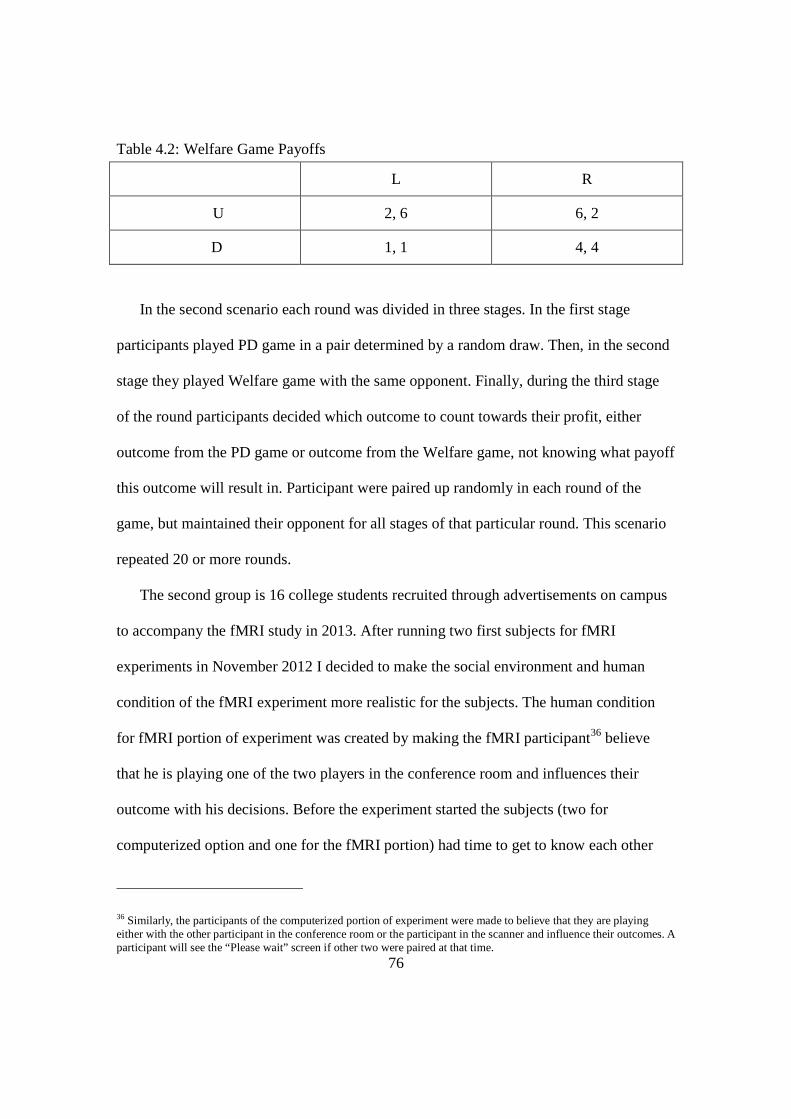
76
Table 4.2: Welfare Game Payoffs
L R
U 2, 6 6, 2
D 1, 1 4, 4
In the second scenario each round was divided in three stages. In the first stage
participants played PD game in a pair determined by a random draw. Then, in the second
stage they played Welfare game with the same opponent. Finally, during the third stage
of the round participants decided which outcome to count towards their profit, either
outcome from the PD game or outcome from the Welfare game, not knowing what payoff
this outcome will result in. Participant were paired up randomly in each round of the
game, but maintained their opponent for all stages of that particular round. This scenario
repeated 20 or more rounds.
The second group is 16 college students recruited through advertisements on campus
to accompany the fMRI study in 2013. After running two first subjects for fMRI
experiments in November 2012 I decided to make the social environment and human
condition of the fMRI experiment more realistic for the subjects. The human condition
for fMRI portion of experiment was created by making the fMRI participant36 believe
that he is playing one of the two players in the conference room and influences their
outcome with his decisions. Before the experiment started the subjects (two for
computerized option and one for the fMRI portion) had time to get to know each other
36 Similarly, the participants of the computerized portion of experiment were made to believe that they are playingeither with the other participant in the conference room or the participant in the scanner and influence their outcomes. Aparticipant will see the “Please wait” screen if other two were paired at that time.
77
and engage in an informal conversation in the conference room. When the participant for
the fMRI portion left the conference room to enter the scanner, the participants remaining
in the conference room played the first scenario of the game described above, however,
only for 2 players. In reality they were playing against each other in 2-person Prisoner’s
dilemma (PD) game for the first 15 rounds and then a Welfare game for the next 15
rounds. Each of the subjects could earn $5 for just showing up and up to $10 more for the
decisions they made throughout the experiment.
4.3.2. fMRI Experiment
Subjects of the fMRI experiment are 10 college students (5 females). Subjects
provided written informed consent approved by the University of Oregon Human Studies
Committee37. All participants were recruited through advertisements on campus. All
subjects were right handed, healthy, had normal or corrected-to-normal vision, had no
history of psychiatric diagnoses, neurological or metabolic illnesses, and were not taking
medications that interfere with the performance of fMRI. Participants could be of any
gender and ethnicity, but must be at least 18 years old. The only exclusion criterion is
based on MRI safety screening (ferromagnetic metal in the body, e.g., dental braces). The
participants of fMRI experiment can earn $10 for the initial appointment, where MRI
safety policies were reviewed, $5 just for showing up on the day of experiment and up to
$20 more, depending on their decisions throughout the game.
37 IRB Protocol Number 09232011.094 was approved by Research Compliance Services University of OregonInstitutional Review Board on 21st December 2011.
78
Prior to entering the scanner the subjects completed questionnaire on political
attitudes and a series of practice trials of the similar game on paper. Therefore, the
participants understood and were ready for the stimuli presented in the actual experiment.
Participants were told on the day of experiment that they will be Row choosers (choose
between up (U) and down (D)) and will maintain the same role for the whole experiment.
Stimuli included two instruction conditions (Humans and Computers38), two game
conditions (PD and Welfare games in tables 4.1 and 4.2 respectively), feedback screen
that showed profit of participant based on her decision and a control condition. Subjects
were instructed to look at the central plus sign, and had to switch their attention from the
central plus sign to the game stimulus (a table 2x2 that was centered on the central plus
sign) in each trial to determine the their response by pressing either left or right button on
the button box in their right hand. Subjects knew that by pressing left button, they choose
up (U) and by pressing right button – down (D).
In order to answer the research questions the following neural experimental design
was used. The experiment consisted of 4 blocks (Humans + PD (PG1), Humans +
Welfare (PG2), Computers + PD (CG1), Computers + Welfare (CG2)) with events within
each block. To distinguish between blocks the instruction screen in the beginning of each
block identifies, whether the participant plays computer or a human. In reality the
participant always plays computerized strategy with fixed probabilities: for game 1, PD
game, R with p=.85, L with p=.15; for game 2, Welfare game, L with p=.85, R with
p=.15. The game condition does not change throughout the block. The blocks were
38 Instruction screen showed either: “You are playing with people in the conference room” or “You are playing withcomputers making random choices.”
79
alternated: for half of the participants the order was PG1, PG2, CG1, CG2, for the other
half – CG1, CG2, PG1, PG2.
I used an event-related fMRI design with a pseudorandom (predetermined
unpredictable) order of game and control condition within a block with the same
interstimulus and intertrial intervals used in M. Posner attention studies (Abdullaev,
Posner, Nunnally, & Dishion, 2010; Flombaum & Posner, 2005) that approximate an
exponential distribution with a certain mean. The jittering of the time intervals between
game and feedback and between feedback and the next trial is done in order to separate
brain activity to the game and feedback stimuli.
In the game condition (Figure 4.1) the plus sign remained on the center of the screen
for 1000ms. The game stimulus followed after a variable interval (“one of 12
predetermined intervals including three 300ms intervals, and one each of 550, 800, 1050,
1550, 2300, 3300, 4800, 6550, and 11800ms, approximating an exponential distribution
with a mean interval of 2800ms” (Abdullaev et al., 2010, p. 47)). The game stimulus
stayed until response or for 30000ms. Then a fixation screen was on for 1000ms followed
by another variable intertrial interval (mean of 6000ms) and finally the feedback screen
was on for 2000ms till the onset of the next trial.
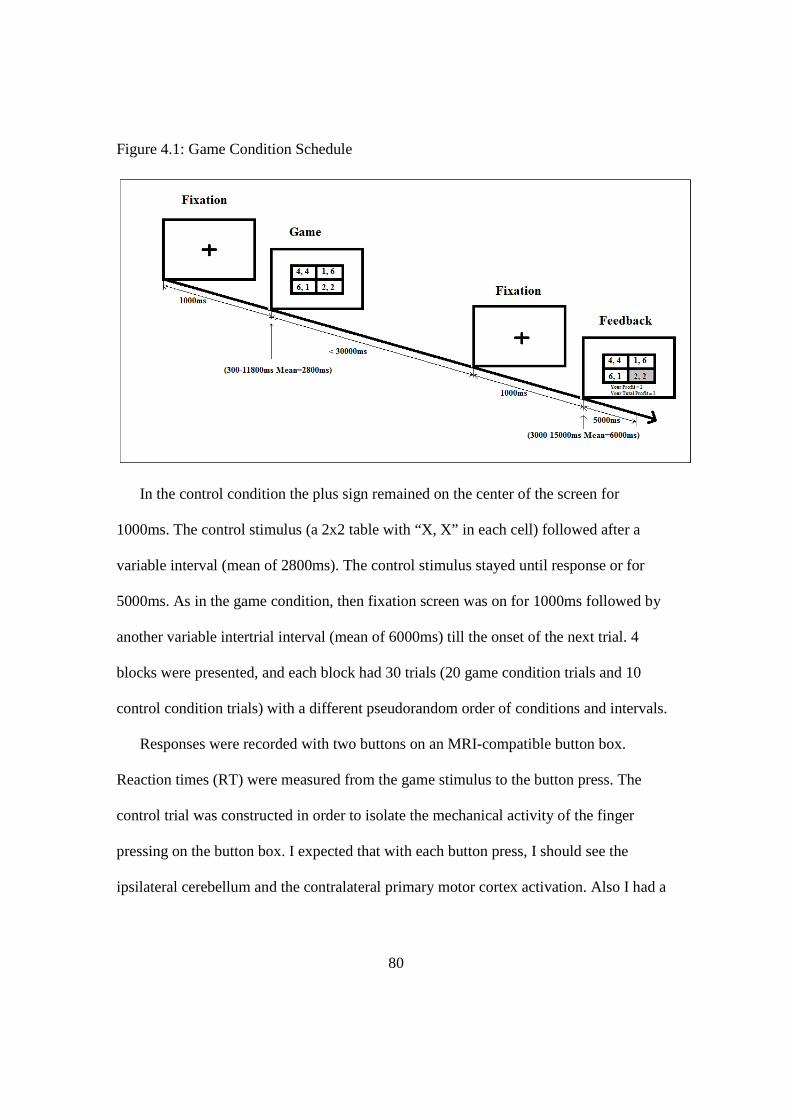
80
Figure 4.1: Game Condition Schedule
In the control condition the plus sign remained on the center of the screen for
1000ms. The control stimulus (a 2x2 table with “X, X” in each cell) followed after a
variable interval (mean of 2800ms). The control stimulus stayed until response or for
5000ms. As in the game condition, then fixation screen was on for 1000ms followed by
another variable intertrial interval (mean of 6000ms) till the onset of the next trial. 4
blocks were presented, and each block had 30 trials (20 game condition trials and 10
control condition trials) with a different pseudorandom order of conditions and intervals.
Responses were recorded with two buttons on an MRI-compatible button box.
Reaction times (RT) were measured from the game stimulus to the button press. The
control trial was constructed in order to isolate the mechanical activity of the finger
pressing on the button box. I expected that with each button press, I should see the
ipsilateral cerebellum and the contralateral primary motor cortex activation. Also I had a
81
30s baseline period in front of each block with no stimuli except a central plus sign for
fixation. So that each condition of the task can be compared to the baseline period.
4.4. Data
The data is collected through a combination of fMRI recordings and computerized
cognitive tasks. The computerized tasks automatically record decisions that participants
make. fMRI data are continuously recorded from the scanner.
4.4.1. Computer Laboratory Data
Data were collected with the help of the z-Tree39 (Zurich Toolbox for Readymade
Economic Experiments) software package. The same program code was used for 4
experimental sessions with the first group of participants. The data reflect observations of
decisions of each participant in each period. Observations reflect the choices of 4
different sets of 12 participants over 60 or more periods.
The program code was modified for the second group of participants to account for 2
participants rather than 12 participants playing at the same time. Observations for the
second group of participants include the choices of 16 participants (8 pairs) over 30
periods.
4.4.2. fMRI Data
Stimuli were presented and behavioral data are collected using the Presentation
program (www.neurobehavioralsystems.com) run on a computer. Stimuli are presented
with a digital projector/reverse screen display system to the screen at the back end of the
39 http://www.iew.uzh.ch/ztree/index.php
82
MRI scanner bore. Subjects see the screen via a small tilted mirror attached to the
birdcage coil in front of their eyes.
Imaging is performed using a 3T Siemens Allegra head-only MRI scanner at Lewis
Center for Neuroimaging. A standard birdcage coil is used to acquire data from the entire
brain. Subjects wear earplugs and earphones to protect their hearing. Additional soft
padding is used between earphones and inside the wall of the head coil to diminish head
movements.
For functional MRI, the EP2D-BOLD (Blood oxygen level dependent) sequence was
run with repetition time (TR) = 2000ms, echo time (TE) = 30ms, flip angle = 90o, Field
of View (FOV) = 200 mm. The brain was covered with 32 4mm thick slices acquired in a
custom manner (first even slices and then odd slices). For structural MRI scan, the 3D
Magnetization Prepared Rapid Acquisition Gradient Echo (MPRAGE) TR=2500ms,
TE=4.38ms, flip angle = 8o, FOV = 256, 160 slices was run for 8 min to acquire 1 mm3
high resolution anatomical scans for registration purposes.
The fMRI study is reported following the guidelines identified by Poldrack (2008).
Statistical analysis based on the General Linear Modeling (GLM) is used for fMRI data
analysis as implemented in the FSL 5.0.2 (FMRIB Software Library). All fMRI data is
analyzed using FEAT (FMRIB Expert Analysis Tool) available as part of FSL (freely
available at www.fmrib.ox.ac.uk/fsl) (S. M. Smith et al., 2004). Preprocessing included
the default options, such as separating images of brain from the rest of the images of the
head, i.e. creating a brain mask, using the Brain Extraction Tool (BET) (S. M. Smith,
2002), pre-whitening for local autocorrelation correction using FILM (FMRIB Improved
Linear Model) (Woolrich, Ripley, Brady, & Smith, 2001), motion correction based on
83
rigid-body transformations using MCFLIRT (Motion Correction FMRIB Linear Image
Registration Tool) (Jenkinson, Bannister, Brady, & Smith, 2002), spatial smoothing using
a Gaussian kernel and highpass temporal filtering as implemented in FSL as well as slice
timing correction using a customized text file.
The analysis is done in three steps. On the first level I analyze each session’s data, i.e.
execute time-series analysis of the raw 4D fMRI data. I generate voxel-wise parameter
estimates of the hemodynamic (blood-oxygen-level-dependent) responses to the different
stimuli I used in fMRI experiment. These voxel-wise parameter estimates represent the
change in the blood-oxygenation level for a given stimulus compared to the baseline
neural activation of no stimulus presentation and control stimulus. Modeled regressors
included cooperation, i.e. choosing up (U) in PD game (g1) both in human and in
computer condition, C_pg1 and C_cg1 respectively; defection, D_pg1 and D_cg1;
inequity aversion (down (D) in Welfare game (g2)), IA_pg2 and IA_cg2; and inequity
tolerance, IT_pg2 and IT_cg2. Each explanatory variable was created by convolving the
stimulus actual duration times (from onset of stimulus till response using one of the
buttons) within each stimulus with a standard gamma hemodynamic response function
using FEAT. Through first-level analysis I obtained parameter estimates as well as
statistical maps for each regressor.
On the second level I combine each subject’s activation across several blocks and
create contrasts (for human vs. computer conditions: C_pg1 vs. C_cg1, D_pg1 vs. D_cg1,
IA_pg2 vs. IA_cg2, IT_pg2 vs. IT_cg2; and WF vs. PD: IA_pg2 vs. C_pg1) using a

84
fixed40 effects analysis with cluster-level statistical threshold of Z > 2.3 and p < 0.05. In
order to compare human condition to computer condition and inequity aversion in
Welfare game to cooperation in Prisoner’s Dilemma I subtract one stimulus type (e.g. in
computer condition) from another type (e.g. in human condition). The hypothesis of
interest here is whether in each voxel the activation to human condition stimuli is greater
than in computer condition. I also implement this type of contrast in the opposite
direction, i.e. where activation in computer condition is higher than activation in human
condition. In result I generate statistical maps for each of the 5 contrasts for each subject.
These contrast activation maps were registered to each subject’s own high-resolution
structural image and also to the Montreal Neurological Institute (MNI) 152-standard
template.
Finally on the third level I used FLAME (FMRIB’s Local Analysis of Mixed Effects)
modeling and one-sample t-test to decide whether the group41 activates on average.
Mixed effects model the subject variability and, therefore, allow making inferences about
the wider population from which the subjects were drawn. Each of the contrasts for the
group are Gaussianized intro Z-statistical images and thresholded at Z > 2.3 with a
cluster-corrected significance threshold of p < 0.05 (Worsley, 2001). The high resolution
structural MRI images of individual subjects were standardized to the MNI space and
averaged within the group to create an average structural template.
40 I followed the recommended fixed-effects analysis at the mid-level. Fixed-effects analysis avoids issues withestimating the block-to-block variance, especially if there are not many blocks per subject, 4 in my case.
41 Although fMRI experiment for the first two subjects didn’t include socialization phase, I do not compare a group of 2to a group of 8. Moreover, the second subject did not cooperate in PD game or express inequity aversion in the Welfaregame, so I am not able to create all 5 contrasts on the second level of analysis for him. That is why his contrasts add upto average activity in two cases. The mean activation of a group with or without first two participants does not result insignificant differences.
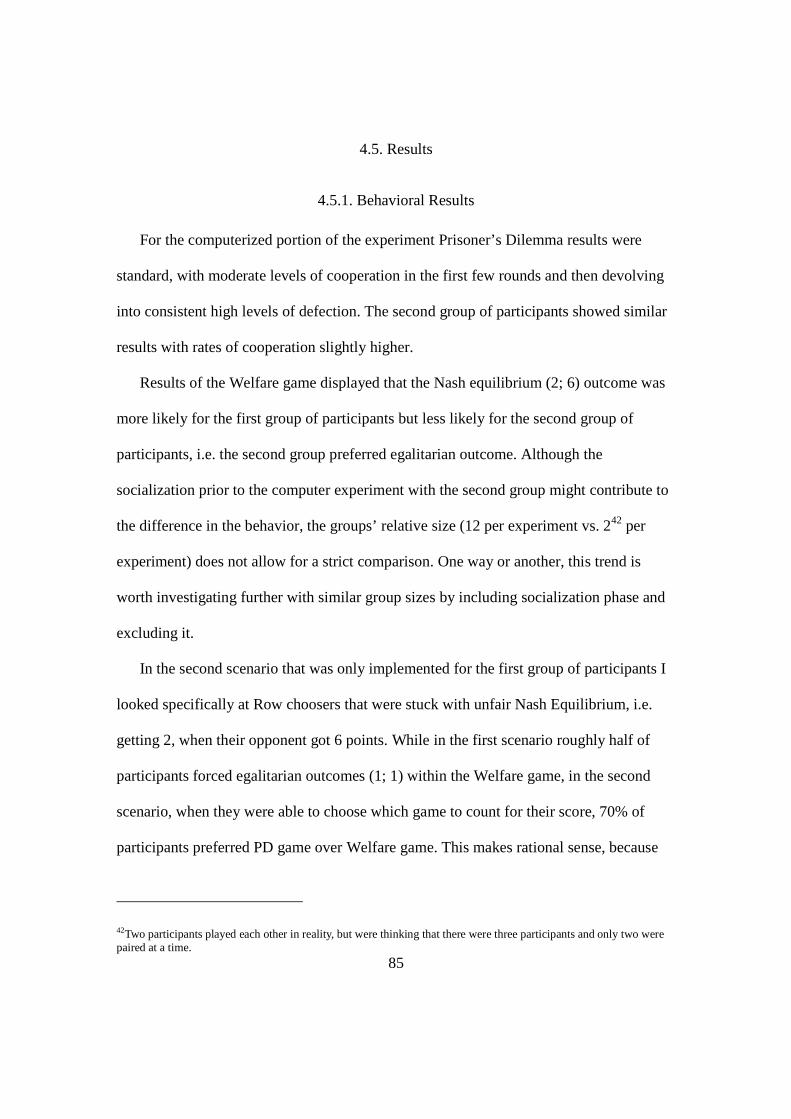
85
4.5. Results
4.5.1. Behavioral Results
For the computerized portion of the experiment Prisoner’s Dilemma results were
standard, with moderate levels of cooperation in the first few rounds and then devolving
into consistent high levels of defection. The second group of participants showed similar
results with rates of cooperation slightly higher.
Results of the Welfare game displayed that the Nash equilibrium (2; 6) outcome was
more likely for the first group of participants but less likely for the second group of
participants, i.e. the second group preferred egalitarian outcome. Although the
socialization prior to the computer experiment with the second group might contribute to
the difference in the behavior, the groups’ relative size (12 per experiment vs. 242 per
experiment) does not allow for a strict comparison. One way or another, this trend is
worth investigating further with similar group sizes by including socialization phase and
excluding it.
In the second scenario that was only implemented for the first group of participants I
looked specifically at Row choosers that were stuck with unfair Nash Equilibrium, i.e.
getting 2, when their opponent got 6 points. While in the first scenario roughly half of
participants forced egalitarian outcomes (1; 1) within the Welfare game, in the second
scenario, when they were able to choose which game to count for their score, 70% of
participants preferred PD game over Welfare game. This makes rational sense, because
42Two participants played each other in reality, but were thinking that there were three participants and only two werepaired at a time.
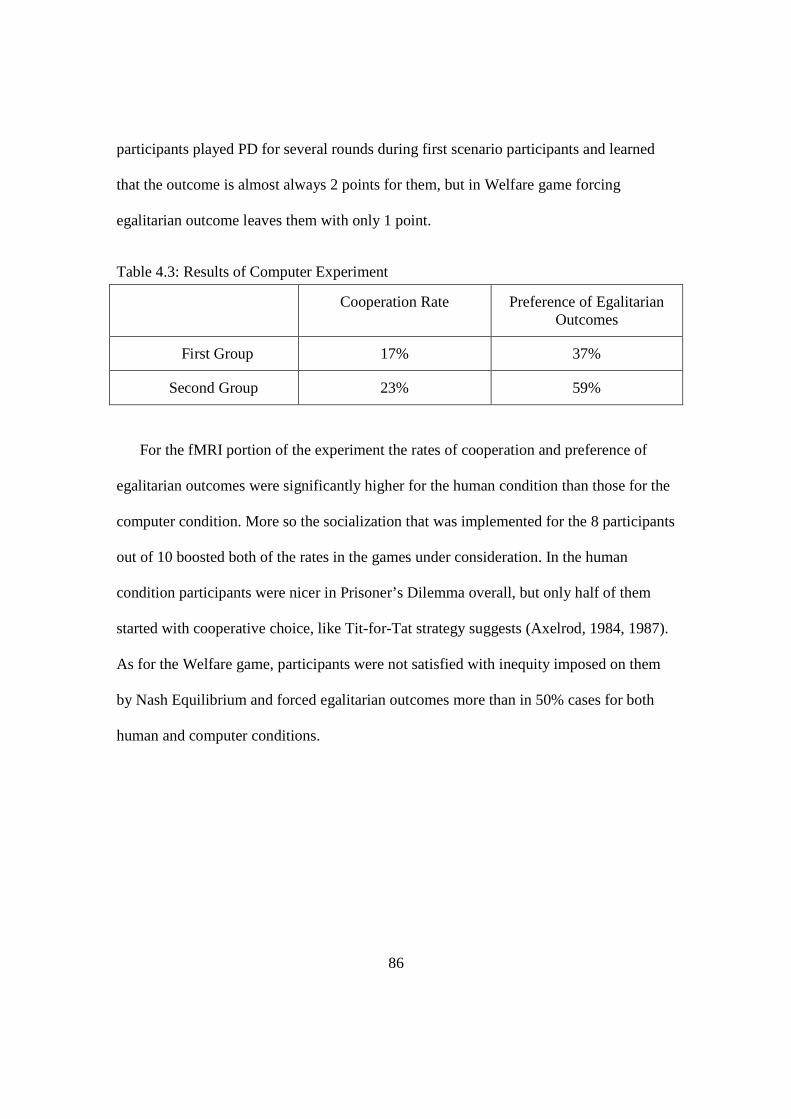
86
participants played PD for several rounds during first scenario participants and learned
that the outcome is almost always 2 points for them, but in Welfare game forcing
egalitarian outcome leaves them with only 1 point.
Table 4.3: Results of Computer Experiment
Cooperation Rate Preference of EgalitarianOutcomes
First Group 17% 37%
Second Group 23% 59%
For the fMRI portion of the experiment the rates of cooperation and preference of
egalitarian outcomes were significantly higher for the human condition than those for the
computer condition. More so the socialization that was implemented for the 8 participants
out of 10 boosted both of the rates in the games under consideration. In the human
condition participants were nicer in Prisoner’s Dilemma overall, but only half of them
started with cooperative choice, like Tit-for-Tat strategy suggests (Axelrod, 1984, 1987).
As for the Welfare game, participants were not satisfied with inequity imposed on them
by Nash Equilibrium and forced egalitarian outcomes more than in 50% cases for both
human and computer conditions.
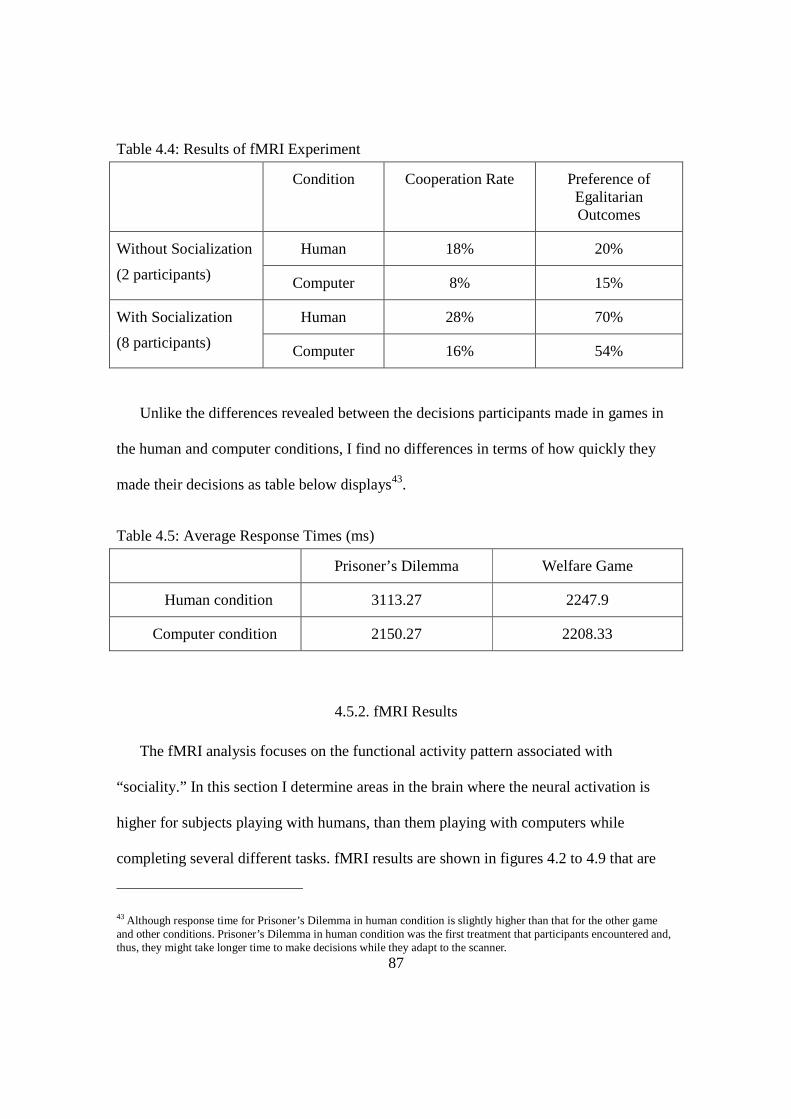
87
Table 4.4: Results of fMRI Experiment
Condition Cooperation Rate Preference ofEgalitarianOutcomes
Without Socialization
(2 participants)
Human 18% 20%
Computer 8% 15%
With Socialization
(8 participants)
Human 28% 70%
Computer 16% 54%
Unlike the differences revealed between the decisions participants made in games in
the human and computer conditions, I find no differences in terms of how quickly they
made their decisions as table below displays43.
Table 4.5: Average Response Times (ms)
Prisoner’s Dilemma Welfare Game
Human condition 3113.27 2247.9
Computer condition 2150.27 2208.33
4.5.2. fMRI Results
The fMRI analysis focuses on the functional activity pattern associated with
“sociality.” In this section I determine areas in the brain where the neural activation is
higher for subjects playing with humans, than them playing with computers while
completing several different tasks. fMRI results are shown in figures 4.2 to 4.9 that are
43 Although response time for Prisoner’s Dilemma in human condition is slightly higher than that for the other gameand other conditions. Prisoner’s Dilemma in human condition was the first treatment that participants encountered and,thus, they might take longer time to make decisions while they adapt to the scanner.
88
generated with help of FSLView 3.1. Left, Right, Anterior=front, Posterior=back,
Superior=top, Inferior=bottom (L, R, A, P, S, I) orientation markers are displayed on
each of the figures, making the orientation clear. Below I report functional activation in
the areas as specified in MNI structural atlas (Collins, Holmes, Peters, & Evans, 2004;
Mazziotta et al., 2001) and Talairach Daemon Labels atlas (Lancaster et al., 2000).
I find significant areas of activation for 4 out of 5 specified contrasts in the fMRI data
section. Defection contrast, i.e. defection in Prisoner’s Dilemma, does not show any
significant activation between human and computer conditions. Moreover, contrasts that
are done in the opposite direction, i.e. answering the question where the activation is
higher for computer condition than for human condition, also do not reveal any
significant engagement even at a lenient threshold of p < 0.1.
Cooperation in PD game with humans compared to cooperation in PD with computers
is associated with a signal increase in dorsolateral prefrontal cortex (DLPFC), Brodmann
areas 8 and 9 (BA 8, BA 9), Figure 4.244, and parietal lobe, BA 40, Figure 4.3. Inequity
aversion in Welfare game is corresponding to the activation in caudate and putamen,
figures 4.4 and 4.5, respectively. Inequity tolerance in Welfare game displays a stronger
signal for human condition in insular cortex, BA 13, Figure 4.6 and parietal lobe, BA 40,
Figure 4.7. The contrast of Welfare game vs. PD game shows higher activation in
parahippocampal gyrus, BA 30 and in medial temporal gyrus, BA 39, as shown in figures
4.8 and 4.9, respectively.
44 Activation is on the border between BA 8 and BA 9. I present only the image that identifies activation in BA 8, butdiscuss the functions of both areas in the Results section of this chapter.
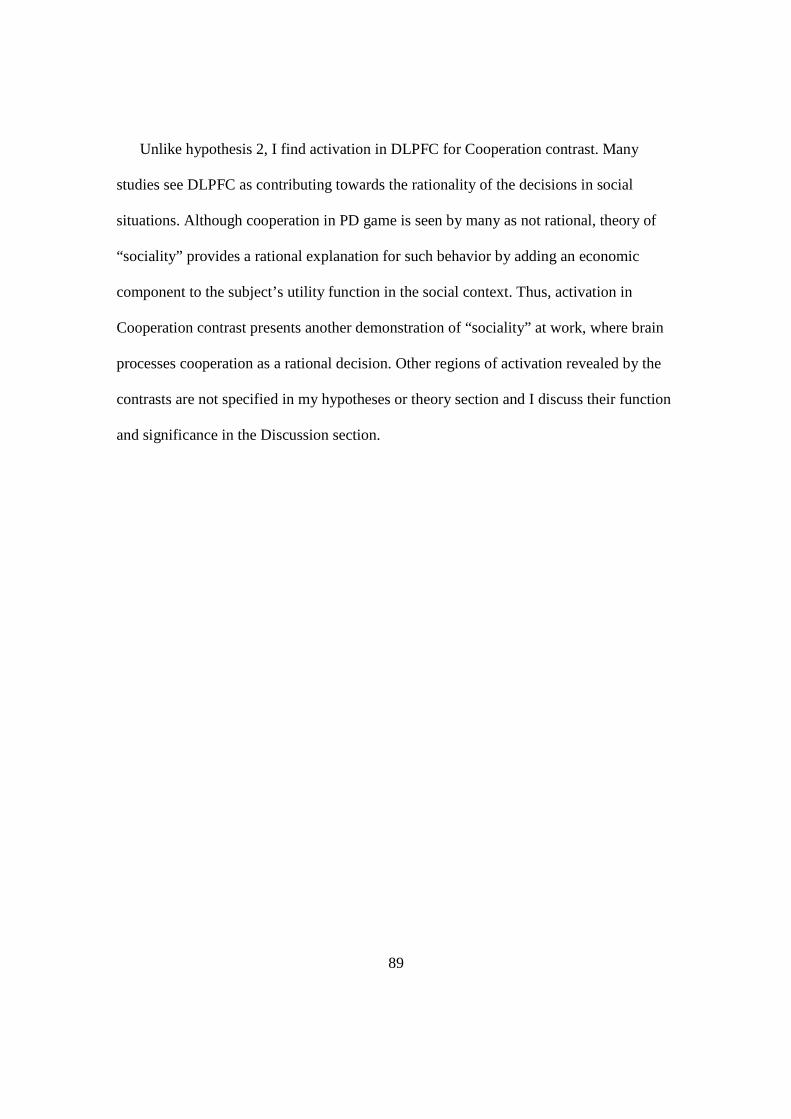
89
Unlike hypothesis 2, I find activation in DLPFC for Cooperation contrast. Many
studies see DLPFC as contributing towards the rationality of the decisions in social
situations. Although cooperation in PD game is seen by many as not rational, theory of
“sociality” provides a rational explanation for such behavior by adding an economic
component to the subject’s utility function in the social context. Thus, activation in
Cooperation contrast presents another demonstration of “sociality” at work, where brain
processes cooperation as a rational decision. Other regions of activation revealed by the
contrasts are not specified in my hypotheses or theory section and I discuss their function
and significance in the Discussion section.
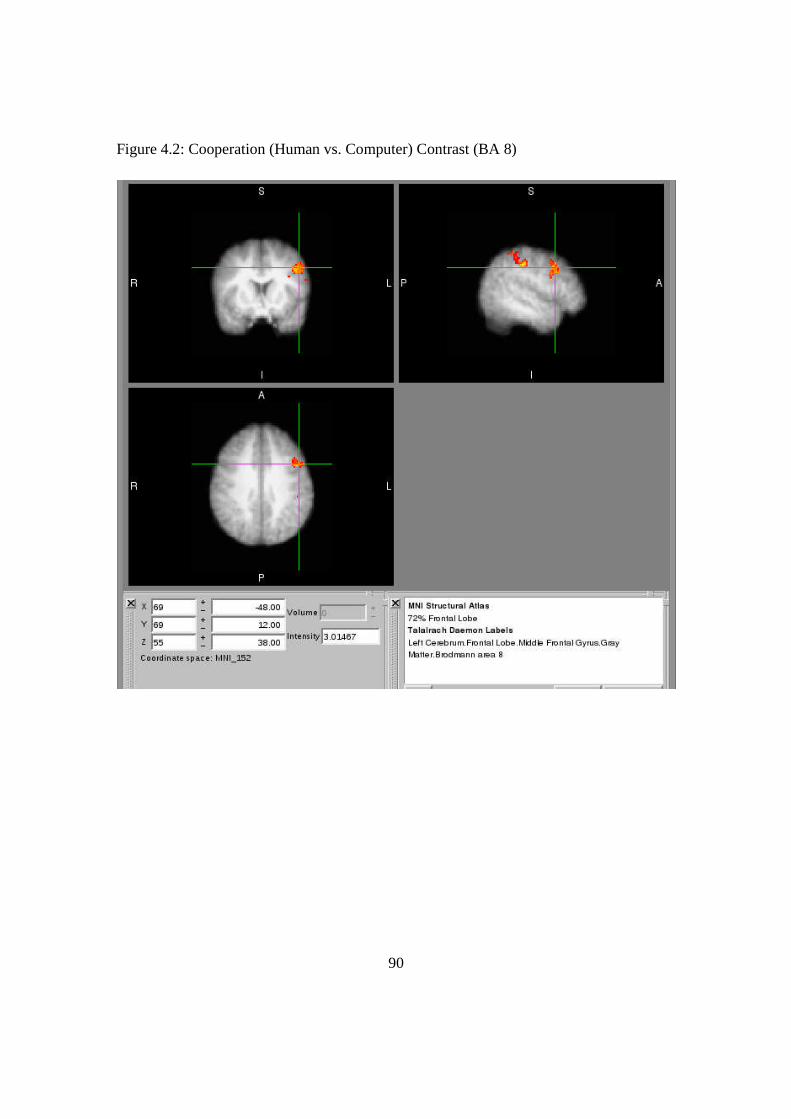
90
Figure 4.2: Cooperation (Human vs. Computer) Contrast (BA 8)
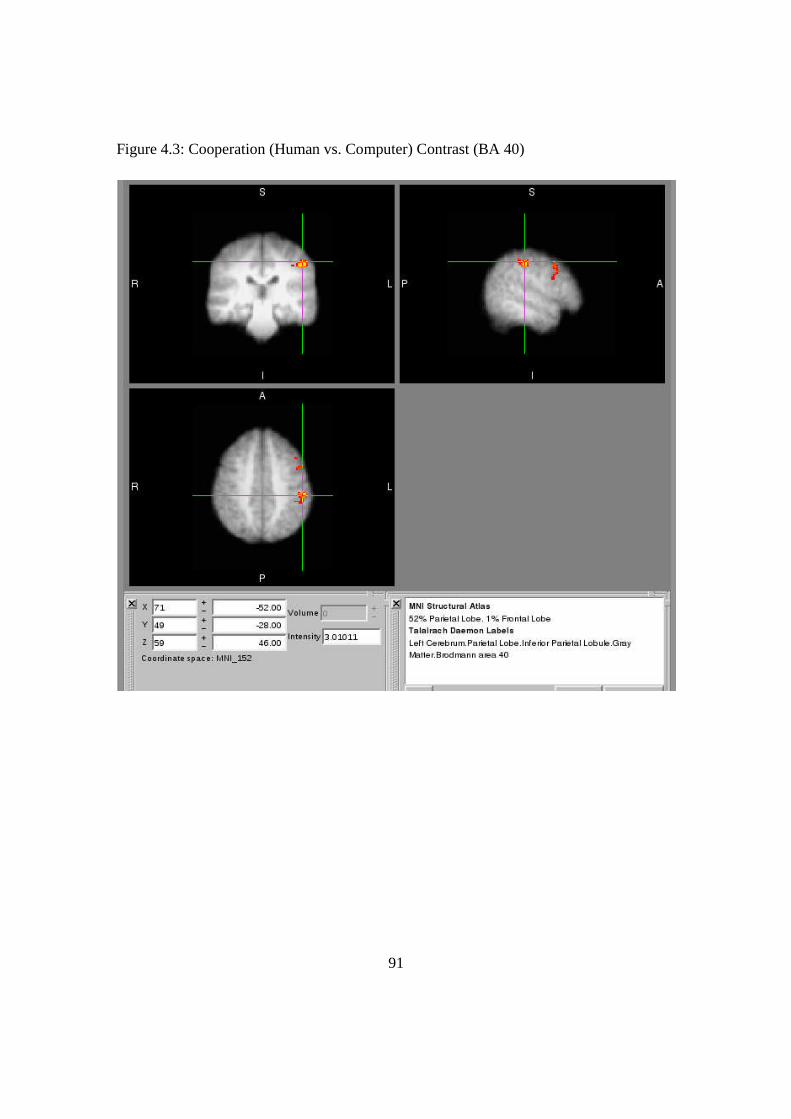
91
Figure 4.3: Cooperation (Human vs. Computer) Contrast (BA 40)
92
Figure 4.4: Inequity Aversion (Human vs. Computer) Contrast (Caudate)
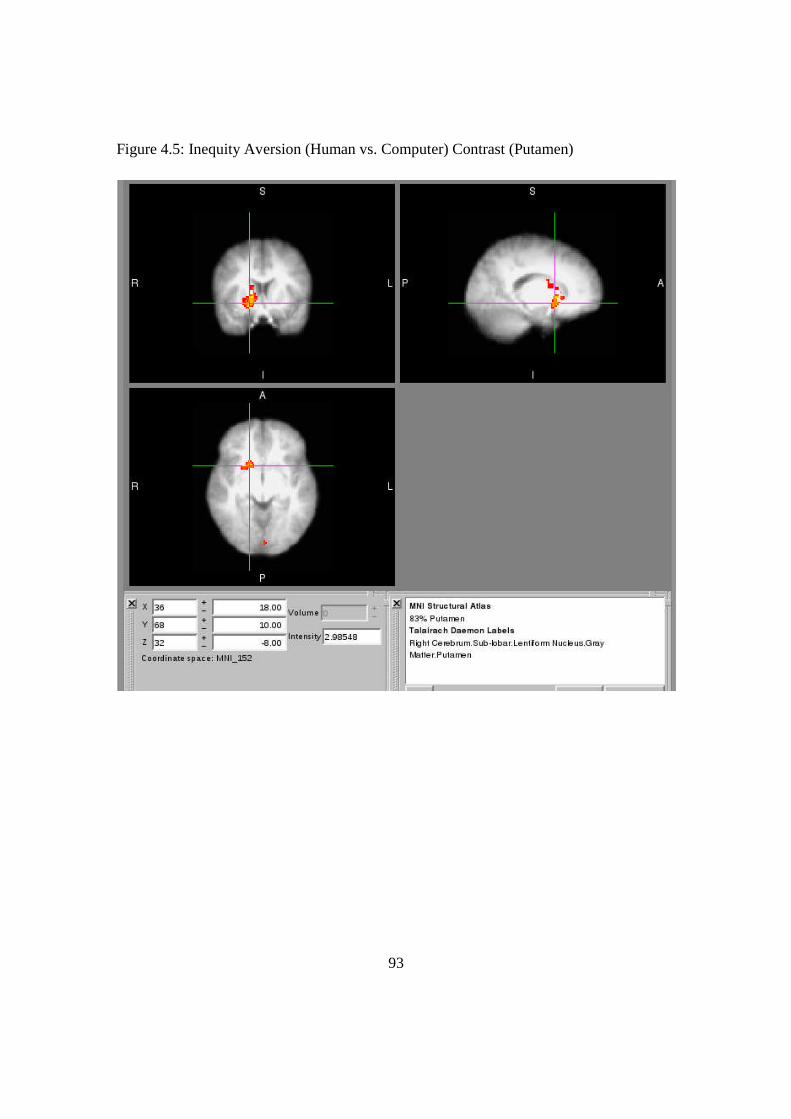
93
Figure 4.5: Inequity Aversion (Human vs. Computer) Contrast (Putamen)
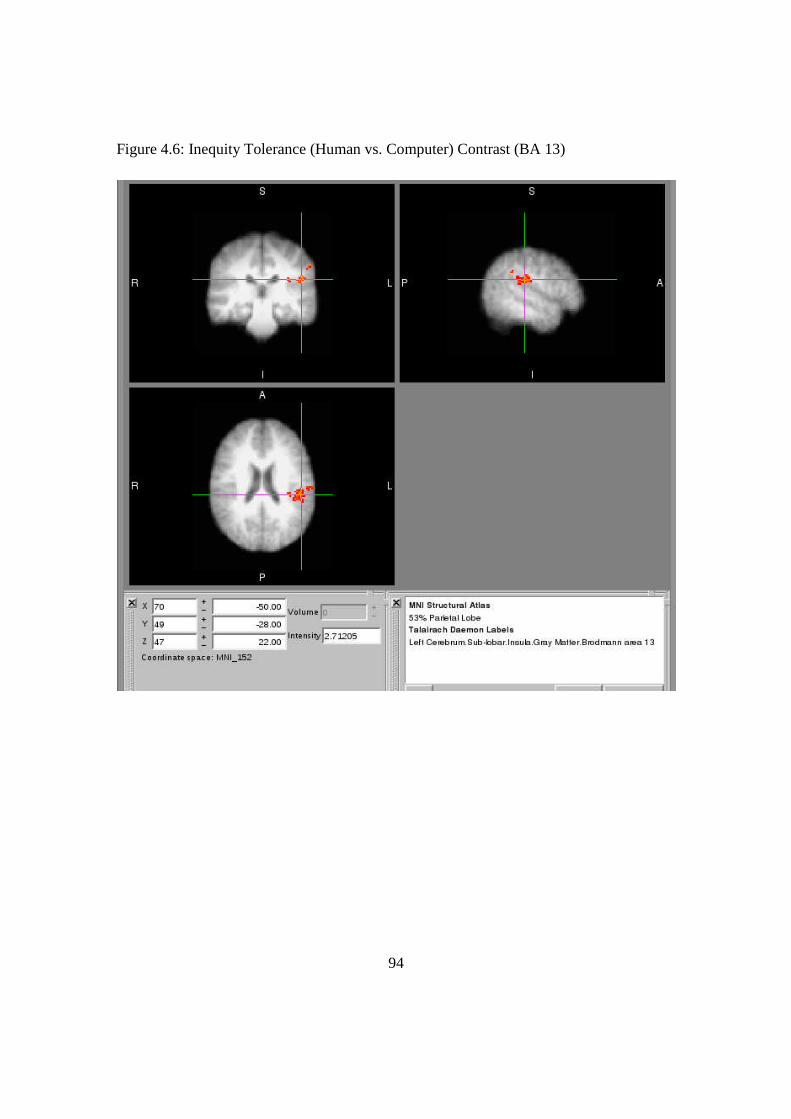
94
Figure 4.6: Inequity Tolerance (Human vs. Computer) Contrast (BA 13)
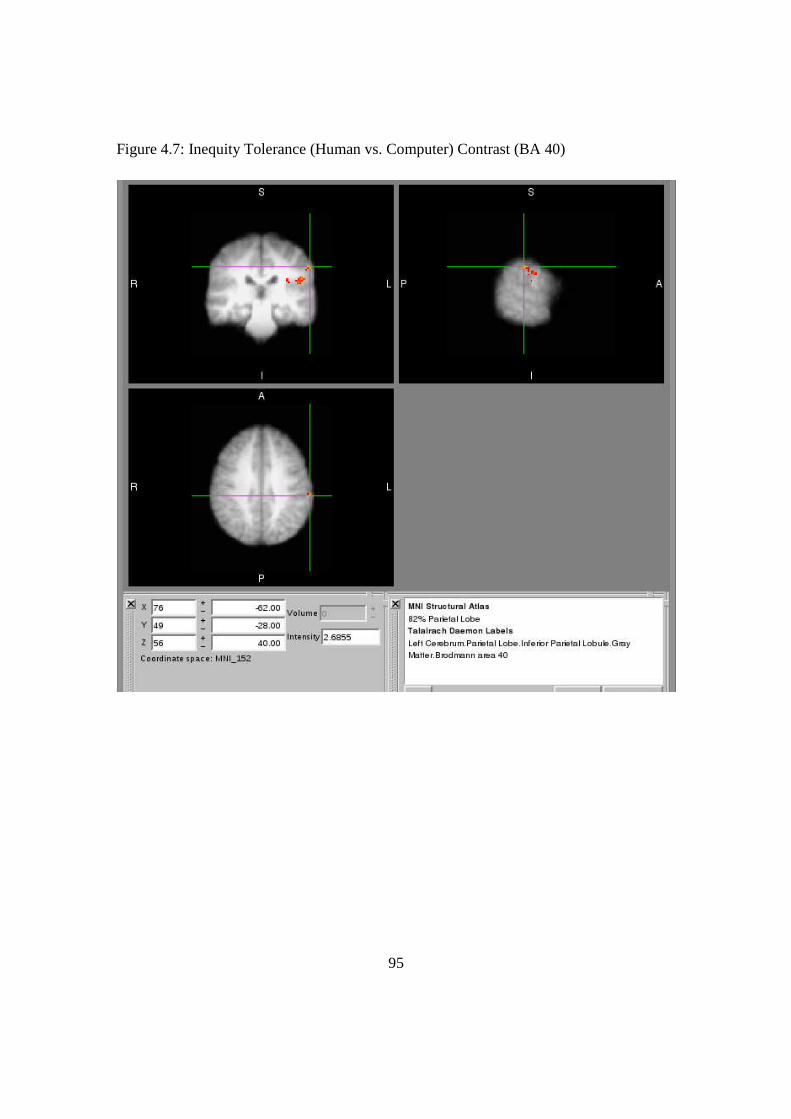
95
Figure 4.7: Inequity Tolerance (Human vs. Computer) Contrast (BA 40)
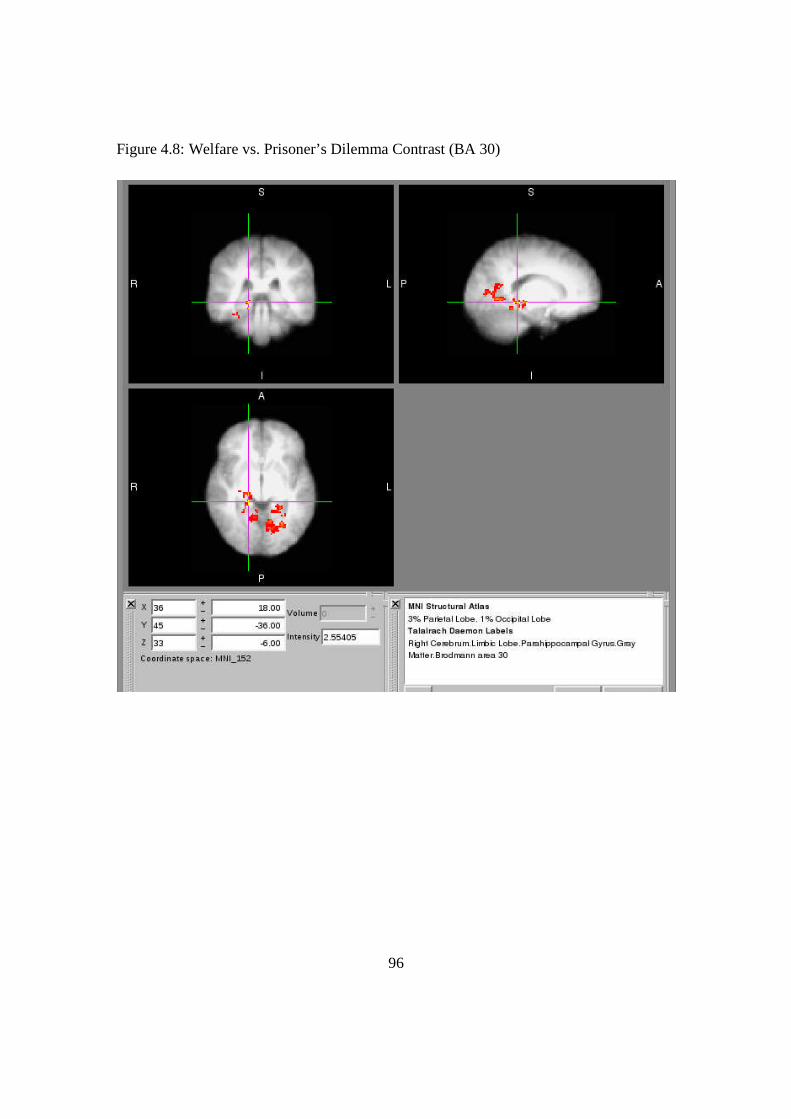
96
Figure 4.8: Welfare vs. Prisoner’s Dilemma Contrast (BA 30)
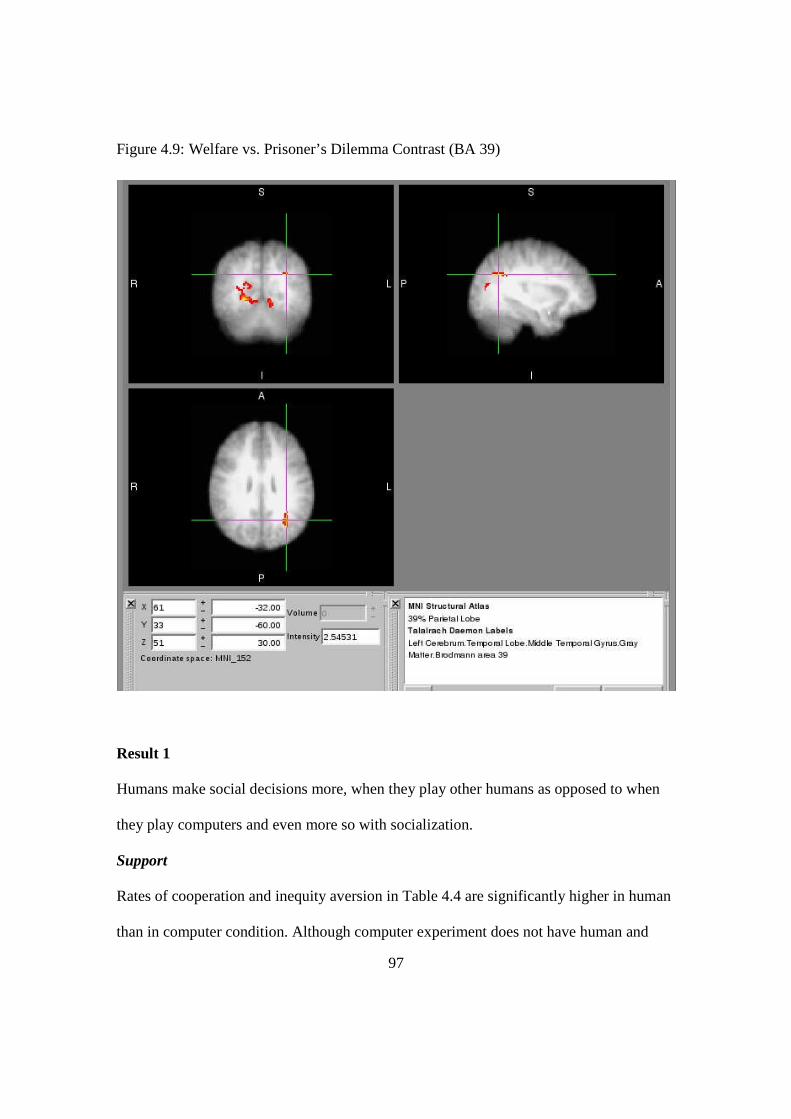
97
Figure 4.9: Welfare vs. Prisoner’s Dilemma Contrast (BA 39)
Result 1
Humans make social decisions more, when they play other humans as opposed to when
they play computers and even more so with socialization.
Support
Rates of cooperation and inequity aversion in Table 4.4 are significantly higher in human
than in computer condition. Although computer experiment does not have human and
98
computer condition to compare, it does add statistical power to the result that with
socialization45 the rates of social decisions increase as displayed in tables 4.3 and 4.4.
Result 2
Individuals are more concerned with inequity, than defection.
Support
The same groups of participants show less rationality in Welfare game, than in Prisoner’s
Dilemma as presented in tables 4.3 and 4.4. Moreover, row players from the computer
experiment (first group) in the second scenario preferred to count PD game payoff
towards their profit significantly more often than Welfare game outcome.
Result 3
Cooperation in PD game is rational in the social environment.
Support
I reveal activation in DLPFC for Cooperation contrast, Figure 4.2. This region is involved
in goal maintenance and working memory. Many scholars attributed it to the rational
decision-making in social situations. This provides confirmation for my theory, because
adding another portion of utility, i.e. “sociality,” that corresponds to the social process
certainly makes cooperation rational. I find activation in BA 8 and BA 9. Whereas
Brodmann area 9 functions include sustaining attention and working memory, BA 8 is
even more intriguing, as it is linked to management of uncertainty (Platt & Huettel, 2008)
45 The second group for computer experiment had socialization phase prior to the experiment, whereas first group didnot.
99
as well as hopes or high expectations (Boscher, Romijn, Vermaat, & de Vries, 2012).
Therefore, although it is rational for subjects to cooperate in the presence of “sociality”
they still have some hope for reciprocity and face uncertainty regarding the decision of
their opponent.
4.5.3. Discussion
Welfare game highlights activations in different areas for inequity aversion and
inequity tolerance. In particular, inequity aversion in the human vs. computer condition is
related to regions of caudate and putamen. Both of these regions are an important part of
the brain’s learning and memory system (Graybiel, 2005). In particular, activation in
caudate nucleus is found in feedback processing (Packard & Knowlton, 2002) and as a
neural basis of altruistic punishment (De Quervain et al., 2004). On the other hand, recent
study finds that highlights in putamen are correlated with hate (Zeki & Romaya, 2008). I
suggest that inequity aversion decision engages general learning and discovery of the
equilibrium in this game by receiving certain outcomes in each round and processing this
feedback. Subjects (row players) face an unfair equilibrium in Welfare game and,
although they hate inequity aversion choice, because it results in the lowest payoff, they
force egalitarian outcomes and produce something similar to altruistic punishment, where
they lose from it but their opponent is punished for being rich in the equilibrium.
Inequity tolerance decision involves activations in Brodmann area 13 (BA 13) and
BA 40. BA 13 is located in the insular cortex that has many functions as reported by
fMRI studies. Most relevant for me is connection of this area to an informative feedback
response (Tsukamoto et al., 2006), error awareness (Klein et al., 2007), and fear response
100
(Phelps et al., 2001; Turner et al., 2007). I assume that the inequity tolerance decision
included fear for losing out in terms of total profit to the opponent after subsequent
rounds of the game. BA 40, or inferior parietal lobe, is mostly known for its
somatosensory functions. However, scholars find that significant activations in the left
part are present during calculation tasks (Hirsch, Moreno, & Kim, 2001). This area has
significant activation for cooperation and inequity tolerance contrasts. Thus, I conclude
that brain area related to calculation has significantly higher activation in human
condition, because subjects were not only computing their own payoffs and gains, but
also of their opponents.
Contrast between Welfare game and PD game displays highlight in BA 30 that along
with adjacent areas forms posterior cingulate gyrus. Its functions include spatial memory
and orientation (Owen, Milner, Petrides, & Evans, 1996), as well as face recognition
(Leube, Erb, Grodd, Bartels, & Kircher, 2001). Neither the former, nor the latter directly
correspond to the stimuli presented to the subjects. Another area activated is BA 39,
middle temporal gyrus that is also involved in calculation (Grabner et al., 2007), as well
as in “theory of mind” (Goel, Grafman, Sadato, & Hallett, 1995), i.e. modeling
knowledge, rationality, etc. of another person’s mind. Indeed, calculation and “theory of
mind” occur in both games, however, while PD game is familiar and is frequently used in
multiple courses in college, Welfare game, as a rare simultaneous version of Ultimatum
game requires participants to think through other subject’s strategy and execute the cost-
benefit analysis.
Although I see some activations in white matter, scholars generally believe that
activation in functional magnetic resonance imaging (fMRI) is restricted to gray matter
101
due to a higher cerebral blood flow and postsynaptic potentials taking place there
(Matthews, 2001; Mazerolle, D'Arcy, & Beyea, 2008). However, a number of fMRI
studies reported activation in white matter. Although majority of these studies used
visuomotor interhemispheric tasks, some were focused on eliciting interhemispheric
transfer (Mazerolle et al., 2008), transfer of information between cerebral hemispheres
that usually happens by means of corpus callosum. Activation in white matter revealed
that even for patients, in which the corpus callosum has been resected the brain
performance was impaired, but not abolished (Mazerolle et al., 2008).
4.6. Conclusion
Daily life confronts us with social situations and interactions on a regular basis.
However, we never even think how brain processes the decisions we make, especially
when we affect the outcomes of over people with our decisions. I conducted an fMRI
experiment, an easy one from the very first glance, that attempts to reveal the areas in our
brain where activations are higher when subjects play humans, than if they play
computers. As I mentioned earlier, at first, the ambition was to replicate the experiment
in chapters I and II in the scanner. Several studies mention differences in activations in
the brain when subjects are facing losses as opposed to if they are facing gains (Yacubian
et al., 2006). One of the main results of Chapter II suggests that risk tolerance is found in
both losses and gains frameworks in the presence of “sociality.” The additive value of
fMRI study is to find that the same behavior, e.g. risk tolerance, correlates to activations
in different areas of the brain, as could be found for the losses and gains. This remains a
vital goal for the future fMRI experiments.
102
The only activation I can relate to my hypotheses is revealed in the Cooperation
contrast. In particular, I find that cooperation in PD game is rational, as activation
highlighted for this contrast in human vs. computer condition appears in the dorsolateral
prefrontal cortex, a region involved in executive control, goal maintenance and working
memory. Other activations and significant brain regions are displayed for human vs.
computer contrast across different stimuli in the Results section and described in detail in
the Discussion section.
The data collected from the fMRI experiments can serve to answer many more
questions, than those raised in this chapter. For example, how subjects perceive
outcomes. While in this study my main focus was on the stimuli from onset till response,
next I can take into account the reaction towards the outcome displayed to the participant.
How will participants react to unfairness or defection? Or how will participants react and
what brain activation will be related to it if they defect, while the opponent cooperated?
Guilt aversion is studied thoroughly by Chang et al. (2011). In particular, is the guilt
aversion crucial for subjects to cooperate even if they can better achieve their goals by
acting selfishly? In social situations trust is also very important in which we sometimes
place trust in those around us or alternately are entrusted by others. Does the activation in
regions related to trust decrease once the subjects get defected on several times in a row?
Another way to model and analyze these data is to add behavioral covariates, such as
cooperation and inequity aversion rates and response times. However, political variables
cannot be added as covariates as the sample of UO students for the fMRI experiments
was homogeneous in terms of their political and policy attitudes. Although the design of
the behavioral task is a critical component of the current study, several contrasts were not
103
available for all subjects. That is why the preselection46 of participants is needed, so that
they will make not only rational, Nash equilibrium choices, but also cooperate and use
mixed strategies. Although the idea of prior socialization was brilliant, it is also vital to
compare groups with socialization to those without. Unfortunately, the contrast between
the group of two participants and a group of eight participants was not viable.
This was my first experience with fMRI experiment design as well as fMRI data and I
plan to further extend my knowledge of fMRI data acquisition, processing and sharpen
my fMRI design skills in the future.
46 Preselection can be implemented by a paper experiment or a survey prior to the experiment. However, this did notwork for this particular experiment. I did the survey and the paper experiment and although subject 2 made not rationalchoices in the paper version, he only made rational choices in the scanner.
104
CHAPTER V
CONCLUSION
In my dissertation I addressed the major theories of decision-making and proposed
the theory of “sociality.” I define “sociality” as the economic component of utility
function that accounts for the fact that individuals do not only care about outcomes, but
also about the processes which lead to these outcomes. Using the computer laboratory
experiments and fMRI brain-imaging technology I put my theory to a test and explore the
behavioral and neurobehavioral properties of “sociality.”
My main findings of the Chapter II suggest that in the social context human beings
value the social interaction more than the monetary outcomes of such interaction. The
main contribution of my theory was to explain the existence of new risk attitudes, i.e. risk
tolerance regardless of the framing. I confirm the predicted risk attitudes in the presence
of “sociality,” estimate the value of “sociality” and prove that value of “sociality” is able
to compensate for monetary loss. In Chapter III I look not at how individuals overcome
risks of social interactions, but at the characteristics and dynamics of the interactions
itself. I find that the increase in the demand for “sociality” improves the rates of
cooperation, whereas the experience in Prisoner’s Dilemma game decreases cooperation.
Chapter IV displays neurobehavioral features of “sociality.” One of the contrasts directly
supports the theory of “sociality.” In particular, human’s brain considers cooperation as
rational in the social environment, because the utility to cooperate is derived not only
from the outcome, but also from enjoying the social process. Other activations in the
presence of “sociality” I find in the regions of the brain responsible for management of
uncertainty, learning, memory, attention and emotions.
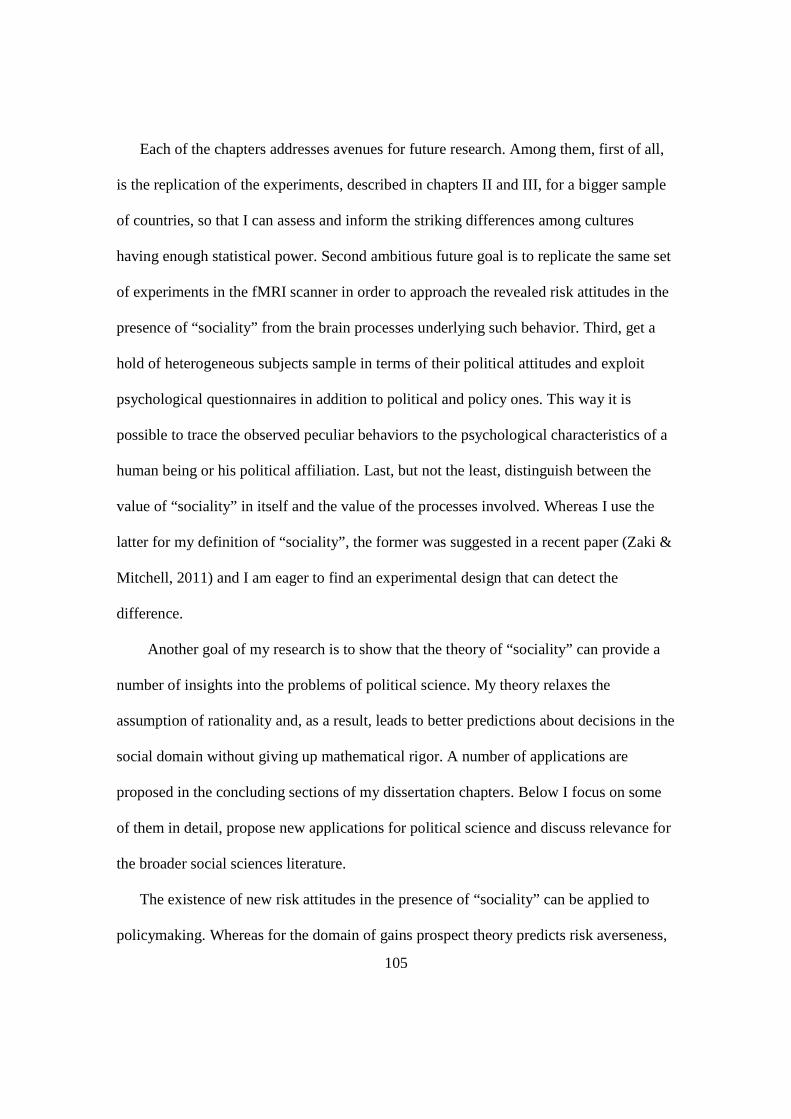
105
Each of the chapters addresses avenues for future research. Among them, first of all,
is the replication of the experiments, described in chapters II and III, for a bigger sample
of countries, so that I can assess and inform the striking differences among cultures
having enough statistical power. Second ambitious future goal is to replicate the same set
of experiments in the fMRI scanner in order to approach the revealed risk attitudes in the
presence of “sociality” from the brain processes underlying such behavior. Third, get a
hold of heterogeneous subjects sample in terms of their political attitudes and exploit
psychological questionnaires in addition to political and policy ones. This way it is
possible to trace the observed peculiar behaviors to the psychological characteristics of a
human being or his political affiliation. Last, but not the least, distinguish between the
value of “sociality” in itself and the value of the processes involved. Whereas I use the
latter for my definition of “sociality”, the former was suggested in a recent paper (Zaki &
Mitchell, 2011) and I am eager to find an experimental design that can detect the
difference.
Another goal of my research is to show that the theory of “sociality” can provide a
number of insights into the problems of political science. My theory relaxes the
assumption of rationality and, as a result, leads to better predictions about decisions in the
social domain without giving up mathematical rigor. A number of applications are
proposed in the concluding sections of my dissertation chapters. Below I focus on some
of them in detail, propose new applications for political science and discuss relevance for
the broader social sciences literature.
The existence of new risk attitudes in the presence of “sociality” can be applied to
policymaking. Whereas for the domain of gains prospect theory predicts risk averseness,
106
the theory of “sociality” anticipates risk tolerance. I view policy as an instrument to
improve procedures, well-being, and, thus, as existing in the domain of gains. Depending
on the area policymakers are working, they might be interested in implementing risky or
riskless policies. The theory of “sociality” then suggests that risky policy (e.g.,
environmental policy) is more likely to be implemented if policymakers make individual
decisions on behalf of that policy while surrounded by their peers, rather than while being
on a conference call. This happens more and more often in the age of technology.
Some might argue that policymakers are not passionate enough for the process and,
thus, do not necessarily extract utility from carrying out legislature act. Like in academia,
professors do not take out utility from faculty meetings simply because they do not enjoy
the process they are involved in and want to leave as soon as possible. However, some of
the social and political processes are enjoyable and this is directly portrayed by people
engaging in riots, protests, such as Occupy Wall Street, or riots last year in Moscow after
fraudulent parliamentary elections in Russia. Whereas participation in “occupy” protests
by a strict cost-benefit analysis will not reveal many benefits in terms of the outcome
involved, riots in Moscow will be considered very costly because of the high probability
of imprisonment. Actually it is an interesting task to follow the decrease in the riots
participation in Moscow and correlate it to the constant increase in costs of participation
due to the laws that were being enacted starting December 2011. This is also a field test
for the theory of “sociality,” i.e. measuring how costly should be the outcome to
outweigh the utility of participation in protests.
Today we also hear more and more often that people are embedded in social
networks. A wide range of political outcomes could be studied using social networks,
107
such as political campaigns (Williams & Gulati, 2007), voting (Nickerson, 2008), and
immigration patterns (Sanders, Nee, & Sernau, 2002). As for voting, many models of
elections have avoided situating voters in social networks, or social context in general,
although there is a growing evidence that the context and how voters are situated to one
another play a critical role in the decision. How the theory of “sociality” can help?
As citizens people involve in different political and societal processes that generate
“sociality,” an economic component of their utility function. Democratic participation,
that includes voting, is an example of such a process. People value participation rights as
much or even more than the outcome generated in the political process. This can explain
why people vote, although it is not rational. Hegel observed that “the casting of a single
vote is of no significance where there is a multitude of electors” (Buchanan, 1974).
Scholars investigate effects of social pressure on political participation (Gerber,
Green, & Larimer, 2008) and conclude that higher turnout is observed if mailings are
received that assure voters that their turnout will be publicized to their neighbors.
However, I distinguish “sociality” from social pressure. Although social pressure is used
to induce voters to adhere to a social norm and individuals might value the outcome, such
as convergence to the norm, they probably do not value the process, as in theory of
“sociality,” because the process is forced on them. Process adds a person utility only if he
likes being involved in this process and not if a person has to go through some procedures
he does not enjoy to get to an outcome, even a positive and desirable one.
People’s welfare and utility can also depend on the extent to which the distribution of
income in a society is unequal. Personal welfare can adapt quickly to status in a network,
but “is highly sensitive to gains and losses in position in the network” (McFadden, 2010,
108
p. 3). The term inequity aversion was used in relation to the Welfare game described in
Chapter IV. The row choosers in this game were facing unfair treatment, like people can
sometimes view social processes as biased and unfair. Whereas in the game the
participants were forcing egalitarian outcomes, in real life this creates preferences for
redistribution (Alesina & La Ferrara, 2005; Benz et al., 2002). If one cares only about the
outcome, he will be less likely to support redistributive policies, because if he gets rich he
becomes a net payer. However, if an individual considers processes in his utility function,
like theory of “sociality” asserts, and he views social processes as unfair, meaning that
she does not believe that society offers equal opportunities on average, then, she will be
more likely to support redistributive policies.
My dissertation asserts that “sociality” must be taken into consideration in modeling
decision making. Although I incorporate “sociality” in the decision-making process I still
rely on the core aspects of rationality to predict human behavior and use the concept of
economic utility. Humans are social animals and even if in some instances they thrive to
maximize their self-interest, they still use their social networks to define or refine their
preferences in other situations, where their preferences are not solely about outcomes, but
also about how those outcomes were generated. Today, interest in “sociality” is broad
and includes disciplines all around the scientific spectrum, but there is no straightforward
formalization of decision making in social context. My dissertation offers a simple way to
approach “sociality.”
109
REFERENCES CITED
Abdullaev, Y., Posner, M.I., Nunnally, R., & Dishion, T.J. (2010). Functional MRIevidence for inefficient attentional control in adolescent chronic cannabis abuse.Behavioural Brain Research, 215(1), 45-57.
Adolphs, R. (2003). Cognitive neuroscience of human social behaviour. Nature ReviewsNeuroscience, 4(3), 165-178.
Alesina, A., & La Ferrara, E. (2005). Preferences for Redistribution in the Land ofOpportunities. Journal of Public Economics, 89(5), 897-931.
Allais, M. (1953). Le comportement de l'homme rationnel devant le risque: Critique despostulats et axiomes de l'école Américaine. Econometrica: Journal of theEconometric Society, 503-546.
Andreoni, J. (1988). Why free ride?: Strategies and learning in public goods experiments.Journal of Public Economics, 37(3), 291-304.
Arrow, K.J. (1971). Essays in the Theory of Risk-Bearing: Markham Pub. Co.
Axelrod, R. (1984). The Evolution of Cooperation. New York: Basic Books.
Axelrod, R. (1987). The evolution of strategies in the iterated prisoner’s dilemma.Genetic Algorithms and Simulated Annealing, 32-41.
Axelrod, R., & Hamilton, W.D. (1981). The evolution of cooperation. Science, 211,1390-1396.
Becker, G.S. (1978). The Economic Approach to Human Behavior: The University ofChicago Press.
Benz, M., Frey, B., & Stutzer, A. (2002). Introducing procedural utility: Not only what,but also how matters. Zurich IEER Working Paper No. 129.
Bicchieri, C., & Chavez, A. (2010). Behaving as expected: Public information andfairness norms. Journal of Behavioral Decision Making, 23(2), 161-178.
Bicchieri, C., & Zhang, J. (2008). An embarrassment of riches: Modeling socialpreferences in ultimatum games. Handbook of the Philosophy of Economics.Elsevier.
Binmore, K. (2001). Why experiment in economics? The Economic Journal, 109(453),16-24.
110
Bohnet, I., Greig, F., Herrmann, B., & Zeckhauser, R. (2008). Betrayal aversion:Evidence from brazil, china, oman, switzerland, turkey, and the united states. TheAmerican Economic Review, 294-310.
Bond, M.H., & Forgas, J.P. (1984). Linking Person Perception to Behavior IntentionAcross Cultures The Role of Cultural Collectivism. Journal of Cross-CulturalPsychology, 15(3), 337-352.
Boscher, N., Romijn, L., Vermaat, L., & de Vries, F. (2012). The Evil Dead and thebrain.
Bowlby, J. (1969). Attachment and Loss. Vol. 1. Attachment: Hogarth London.
Brock, W.A., & Durlauf, S.N. (2001). Discrete choice with social interactions. Review ofEconomic Studies, 68(2), 235-260.
Buchanan, J.M. (1974). Hegel on the Calculus of Voting. Public Choice, 17(1), 99-101.
Cacioppo, J.T., Berntson, G.G., Adolphs, R., Carter, C.S., Davidson, R.J., McClintock,M.K., . . . Sternberg, E.M. (2002). Foundations in Social Neuroscience: MITPress.
Camerer, C. (2003). Behavioral game theory: Experiments in Strategic Interaction:Princeton University Press.
Camerer, C., Loewenstein, G., & Prelec, D. (2005). Neuroeconomics: How neurosciencecan inform economics. Journal of Economic Literature, 43(1), 9-64.
Camerer, C.F., & Fehr, E. (2006). When does" economic man" dominate social behavior?Science, 311(5757), 47.
Cardinal, R.N., Parkinson, J.A., Hall, J., & Everitt, B.J. (2002). Emotion and motivation:the role of the amygdala, ventral striatum, and prefrontal cortex. Neuroscienceand Biobehavioral Reviews, 26(3), 321-352.
Carmichael, F. (2005). A Guide to Game Theory: Financial Times/Prentice Hall.
Carr, J.L., & Landa, J.T. (1983). The economics of symbols, clan names, and religion.The Journal of Legal Studies, 12(1), 135-156.
Carter, C.S., & Van Veen, V. (2007). Anterior cingulate cortex and conflict detection: anupdate of theory and data. Cognitive, Affective, & Behavioral Neuroscience, 7(4),367-379.
111
Chang, L.J., Smith, A., Dufwenberg, M., & Sanfey, A.G. (2011). Triangulating theneural, psychological, and economic bases of guilt aversion. Neuron, 70(3), 560-572.
Chen, X.P., & Li, S. (2005). Cross-national differences in cooperative decision-making inmixed-motive business contexts: the mediating effect of vertical and horizontalindividualism. Journal of International Business Studies, 36(6), 622-636.
Collins, D.L., Holmes, C.J., Peters, T.M., & Evans, A.C. (2004). Automatic 3‐D model‐based neuroanatomical segmentation. Human Brain Mapping, 3(3), 190-208.
Cosmides, L., & Tooby, J. (1994a). Better than rational: Evolutionary psychology and theinvisible hand. The American Economic Review, 84(2), 327-332.
Cosmides, L., & Tooby, J. (1994b). Origins of domain specificity: The evolution offunctional organization. Mapping the Mind: Domain Specificity in Cognition andCulture, 85–116.
Cox, T.H., Lobel, S.A., & McLeod, P.L. (1991). Effects of ethnic group culturaldifferences on cooperative and competitive behavior on a group task. Academy ofManagement Journal, 34(4), 827-847.
Damasio, A.R. (1994). Descartes & Error: Putnam New York.
Davidson, R.J., Putnam, K.M., & Larson, C.L. (2000). Dysfunction in the neural circuitryof emotion regulation--a possible prelude to violence. Science, 289(5479), 591-594.
Dawkins, R., & Krebs, J.R. (1978). Animal signals: information or manipulation.Behavioural Ecology: An Evolutionary Approach, 282–309.
De Quervain, D.J.F., Fischbacher, U., Treyer, V., Schellhammer, M., Schnyder, U.,Buck, A., & Fehr, E. (2004). The neural basis of altruistic punishment. Science,305(5688), 1254.
Devetag, G., & Warglien, M. (2003). Games and phone numbers: Do short-term memorybounds affect strategic behavior? Journal of Economic Psychology, 24(2), 189-202.
Dolan, R.J. (2002). Emotion, cognition, and behavior. Science, 298(5596), 1191-1194.
Druckman, J., & Kam, C. (2011). Students as Experimental Participants: A Defense ofthe 'Narrow Data Base'. In J. N. Druckman, D. P. Green, K. J. H. & L. A. (Eds.),Cambridge Handbook of Experimental Political Science (pp. 41-57): CambridgeUniversity Press.
112
Druckman, J.N., Green, D.P., Kuklinski, J.H., & Lupia, A. (2006). The growth anddevelopment of experimental research in political science. American PoliticalScience Review, 100(4), 627.
Druckman, J.N., Green, D.P., Kuklinski, J.H., & Lupia, A. (2011). Cambridge Handbookof Experimental Political Science: Cambridge University Press.
Eckel, C.C., & Grossman, P.J. (1998). Are women less selfish than men?: Evidence fromdictator experiments. The Economic Journal, 108(448), 726-735.
Eckel, C.C., & Wilson, R.K. (2010). Shopping for Trust. Paper presented at the MidwestPolitical Science Association Conference, Chicago, IL
Emonds, G., Declerck, C.H., Boone, C., Vandervliet, E.J.M., & Parizel, P.M. (2011).Comparing the neural basis of decision making in social dilemmas of people withdifferent social value orientations, a fMRI study. Journal of Neuroscience,Psychology, and Economics, 4(1), 11-24.
Fagley, N., & Miller, P.M. (1997). Framing effects and arenas of choice: Your money oryour life? Organizational Behavior and Human Decision Processes, 71(3), 355-373.
Fehr, E., & Gachter, S. (2002). Altruistic punishment in humans. Nature, 415(6868), 137-140.
Fehr, E., & Schmidt, K.M. (1999). A theory of fairness, competition, and cooperation*.Quarterly Journal of Economics, 114(3), 817-868.
Fliessbach, K., Weber, B., Trautner, P., Dohmen, T., Sunde, U., Elger, C.E., & Falk, A.(2007). Social comparison affects reward-related brain activity in the humanventral striatum. Science, 318(5854), 1305.
Flombaum, J.I., & Posner, M.I. (2005). The activation of attentional networks.Neuroimage, 26, 471-479.
Frank, M., Ekman, P., & Friesen, W. (1993). Behavioral markers and recognizability ofthe smile of enjoyment. Journal of Personality and Social Psychology 64, 83-93.
Frey, B.S., & Stutzer, A. (2005). Beyond outcomes: measuring procedural utility. OxfordEconomic Papers, 57(1), 90-111.
Friedman, M., & Savage, L.J. (1948). The utility analysis of choices involving risk. TheJournal of Political Economy, 56(4), 279-304.
113
Gambetta, D. (1988). Mafia: The Price of Distrust. S. 158-175. Trust Making andBreaking Cooperative Relations. Gambetta D.(Ed.). Oxford: Blackwell.
Genovesio, A., Tsujimoto, S., & Wise, S.P. (2006). Neuronal activity related to elapsedtime in prefrontal cortex. Journal of Neurophysiology, 95(5), 3281-3285.
Gerber, A.S., Green, D.P., & Larimer, C.W. (2008). Social pressure and vote turnout:Evidence from a large-scale field experiment. American Political Science Review,102(1), 33.
Goel, V., Grafman, J., Sadato, N., & Hallett, M. (1995). Modeling other minds.NeuroReport-International Journal for Rapid Communications of Research inNeuroscience, 6(13), 1741-1746.
Grabner, R.H., Ansari, D., Reishofer, G., Stern, E., Ebner, F., & Neuper, C. (2007).Individual differences in mathematical competence predict parietal brainactivation during mental calculation. Neuroimage, 38(2), 346-356.
Graybiel, A.M. (2005). The basal ganglia: learning new tricks and loving it. CurrentOpinion in Neurobiology, 15(6), 638-644.
Griesinger, D.W., & Livingston Jr, J.W. (1973). Toward a model of interpersonalmotivation in experimental games. Behavioral Science, 18(3), 173-188.
Hare, T.A., O'Doherty, J., Camerer, C.F., Schultz, W., & Rangel, A. (2008). Dissociatingthe role of the orbitofrontal cortex and the striatum in the computation of goalvalues and prediction errors. The Journal of Neuroscience, 28(22), 5623.
Harmon-Jones, E., & Winkielman, P. (2007). Social Neuroscience: IntegratingBiological and Psychological Explanations of Social Behavior: The GuilfordPress.
Hemesath, M., & Pomponio, X. (1998). Cooperation and culture: Students from chinaand the united states in a prisoner's dilemma. Cross-Cultural Research, 32(2),171-184.
Hemmingway, E. (1937). To Have and to Have Not. New York: Scribners.
Henrich, J.P. (2004). Foundations of Human Sociality: Economic Experiments andEthnographic Evidence from Fifteen Small-Scale Societies: Oxford UniversityPress, USA.
Hirsch, J., Moreno, D.R., & Kim, K.H.S. (2001). Interconnected large-scale systems forthree fundamental cognitive tasks revealed by functional MRI. Journal ofCognitive Neuroscience, 13(3), 389-405.
114
Hofstede, G. (1980). Culture's Consequences: International Differences in Work-RelatedValues (Vol. 5): Sage Publications, Incorporated.
Hsu, M., Bhatt, M., Adolphs, R., Tranel, D., & Camerer, C.F. (2005). Neural systemsresponding to degrees of uncertainty in human decision-making. Science,310(5754), 1680-1683.
Huettel, S.A., Song, A.W., & McCarthy, G. (2004). Functional magnetic resonanceimaging (Vol. 1): Sinauer Associates Sunderland, MA.
Jenkins, A.C., & Mitchell, J.P. (2011). How Has Cognitive Neuroscience Contributed toSocial Psychological Theory? Social Neuroscience: Toward Understanding theUnderpinnings of the Social Mind: Toward Understanding the Underpinnings ofthe Social Mind, 1.
Jenkinson, M., Bannister, P., Brady, M., & Smith, S. (2002). Improved optimization forthe robust and accurate linear registration and motion correction of brain images.Neuroimage, 17(2), 825-841.
Johnson, T., Myagkov, M., & Orbell, J. (2004). Sociality as a defensive response to thethreat of loss. Politics and the Life Sciences, 23(2), 13-19.
Johnson, T., Orbell, J., & Myagkov, M. (2010). Risky Decision Making in the Domain of‘Sociality’. Working Paper.
Kagel, J.H., & Roth, A.E. (1995). The Handbook of Experimental Economics. Princeton:Princeton University Press.
Kahn, L.M., & Murnighan, J.K. (1993). Conjecture, uncertainty, and cooperation inprisoner's dilemma games: Some experimental evidence. Journal of EconomicBehavior & Organization, 22(1), 91-117.
Kahneman, D., & Tversky, A. (1979). Prospect theory: An analysis of decision underrisk. Econometrica: Journal of the Econometric Society, 263-291.
Keeney, R.L., & Raiffa, H. (1993). Decisions with Multiple Objectives: Preferences andValue Tradeoffs: Cambridge Univ Pr.
Klein, T.A., Endrass, T., Kathmann, N., Neumann, J., Von Cramon, D.Y., & Ullsperger,M. (2007). Neural correlates of error awareness. Neuroimage, 34(4), 1774-1781.
Knutson, B., Fong, G.W., Adams, C.M., Varner, J.L., & Hommer, D. (2001).Dissociation of reward anticipation and outcome with event-related fMRI.Neuroreport, 12(17), 3683-3687.
115
Krebs, J.R., & Dawkins, R. (1984). Animal signals: mind-reading and manipulation.Behavioural Ecology: An Evolutionary Approach, 2, 380-402.
Krueger, F., Grafman, J., & McCabe, K. (2008). Neural correlates of economic gameplaying. Philosophical Transactions of the Royal Society B: Biological Sciences,363(1511), 3859.
Kuhlman, D.M., & Marshello, A. (1975). Individual differences in the game motives ofown, relative, and joint gain. Journal of Research in Personality, 9(3), 240-251.
Lancaster, J.L., Woldorff, M.G., Parsons, L.M., Liotti, M., Freitas, C.S., Rainey, L., . . .Fox, P.T. (2000). Automated Talairach atlas labels for functional brain mapping.Human Brain Mapping, 10(3), 120-131.
Landa, J.T. (1981). Theory of the Ethically Homogeneous Middleman Group: AnInstitutional Alternative to Contract Law, A. J. Legal Studies, 10, 349.
Ledyard, J.O. (1994). Public goods: A survey of experimental research. PublicEconomics.
Lee, D. (2008). Game theory and neural basis of social decision making. NatureNeuroscience, 11(4), 404-409.
Leube, D.T., Erb, M., Grodd, W., Bartels, M., & Kircher, T.T.J. (2001). Differentialactivation in parahippocampal and prefrontal cortex during word and faceencoding tasks. Neuroreport, 12(12), 2773-2777.
Liebrand, W.B.G., & Van Run, G.J. (1985). The effects of social motives on behavior insocial dilemmas in two cultures. Journal of Experimental Social Psychology,21(1), 86-102.
Loewenstein, G., Rick, S., & Cohen, J.D. (2008). Neuroeconomics. Annual ReviewPsychology, 59, 647-672.
Lohrenz, T., & Montague, P.R. (2008). Neuroeconomics: What neuroscience can learnfrom economics. Psychology and Economic Behaviour, 457-492.
Mailath, G.J., & Samuelson, L. (2006). Repeated Games and Reputations: Long-RunRelationships: Oxford University Press, USA.
Marwell, G., Oliver, P.E., & Prahl, R. (1988). Social networks and collective action: Atheory of the critical mass. III. American Journal of Sociology, 502-534.
116
Matthews, P.M. (2001). An introduction to functional magnetic resonance imaging of thebrain. Functional MRI: An Introduction to Methods. Oxford University Press,New York, 5-34.
Mazerolle, E.L., D'Arcy, R.C.N., & Beyea, S.D. (2008). Detecting functional magneticresonance imaging activation in white matter: Interhemispheric transfer across thecorpus callosum. BMC Neuroscience, 9(1), 84.
Mazziotta, J., Toga, A., Evans, A., Fox, P., Lancaster, J., Zilles, K., . . . Pike, B. (2001).A probabilistic atlas and reference system for the human brain: InternationalConsortium for Brain Mapping (ICBM). Philosophical Transactions of the RoyalSociety of London. Series B: Biological Sciences, 356(1412), 1293-1322.
McClintock, C.G. (1972). Game behavior and social motivation in interpersonal settings.Experimental Social Psychology, 271-297.
McDermott, R., Fowler, J.H., & Smirnov, O. (2008). On the evolutionary origin ofprospect theory preferences. Journal of Politics, 70(2), 335-350.
McFadden, D. (2010). Sociality, Rationality, and the Ecology of Choice.
Menshikov, I., Menshikova, O., Myagkov, M., & Plott, C.R. From Non Market Attitudesto Market Behavior: Laboratory Market Experiments in Moscow and the HvatatProperty of Human Behavior.
Mercer, J. (2005). Prospect theory and political science. Annual Review Political Science,8, 1-21.
Montague, P.R., Dayan, P., & Sejnowski, T.J. (1996). A framework for mesencephalicdopamine systems based on predictive Hebbian learning. The Journal ofNeuroscience, 16(5), 1936-1947.
Nickerson, D.W. (2008). Is voting contagious? Evidence from two field experiments.American Political Science Review, 102(1), 49.
Oosterbeek, H., Sloof, R., & Van De Kuilen, G. (2004). Cultural differences in ultimatumgame experiments: Evidence from a meta-analysis. Experimental Economics,7(2), 171-188.
Ordeshook, P.C. (1986). Game Theory and Political Theory: An Introduction: CambridgeUniv Pr.
Ortmann, A., & Tichy, L.K. (1999). Gender differences in the laboratory: evidence fromprisoner’s dilemma games. Journal of Economic Behavior & Organization, 39(3),327-339.

117
Osborne, M.J., & Rubinstein, A. (1994). A course in game theory: MIT press.
Owen, A.M., Milner, B., Petrides, M., & Evans, A.C. (1996). A specific role for the rightparahippocampal gyrus in the retrieval of object-location: A positron emissiontomography study. Journal of Cognitive Neuroscience, 8(6), 588-602.
Packard, M.G., & Knowlton, B.J. (2002). Learning and memory functions of the basalganglia. Annual Review of Neuroscience, 25(1), 563-593.
Peterson, R.L. (2005). The neuroscience of investing: fMRI of the reward system. BrainResearch Bulletin, 67(5), 391-397.
Phelps, E.A., O'Connor, K.J., Gatenby, J.C., Gore, J.C., Grillon, C., & Davis, M. (2001).Activation of the left amygdala to a cognitive representation of fear. NatureNeuroscience, 4(4), 437-441.
Plassmann, H., O'Doherty, J., & Rangel, A. (2007). Orbitofrontal cortex encodeswillingness to pay in everyday economic transactions. The Journal ofNeuroscience, 27(37), 9984.
Platt, M.L., & Huettel, S.A. (2008). Risky business: the neuroeconomics of decisionmaking under uncertainty. Nature Neuroscience, 11(4), 398-403.
Plott, C.R. (1976). Axiomatic social choice theory: An overview and interpretation.American Journal of Political Science, 511-596.
Poldrack, R.A., Fletcher, P.C., Henson, R.N., Worsley, K.J., Brett, M., & Nichols, T.E.(2008). Guidelines for reporting an fMRI study. Neuroimage, 40(2), 409-414.
Rabin, M. (1993). Incorporating fairness into game theory and economics. The AmericanEconomic Review, 1281-1302.
Rilling, J.K., Sanfey, A.G., Aronson, J.A., Nystrom, L.E., & Cohen, J.D. (2004). Theneural correlates of theory of mind within interpersonal interactions. Neuroimage,22(4), 1694-1703.
Roth, A.E., Prasnikar, V., Okuno-Fujiwara, M., & Zamir, S. (1991). Bargaining andmarket behavior in Jerusalem, Ljubljana, Pittsburgh, and Tokyo: An experimentalstudy. The American Economic Review, 1068-1095.
Sanders, J., Nee, V., & Sernau, S. (2002). Asian immigrants' reliance on social ties in amultiethnic labor market. Social Forces, 81(1), 281-314.
118
Sandholm, T.W., & Crites, R.H. (1996). Multiagent reinforcement learning in the iteratedprisoner's dilemma. Biosystems, 37(1), 147-166.
Sanfey, A.G., Rilling, J.K., Aronson, J.A., Nystrom, L.E., & Cohen, J.D. (2003). Theneural basis of economic decision-making in the ultimatum game. Science,300(5626), 1755.
Savage, L.J. (1972). The Foundations of Statistics: Dover Pubns.
Scharlemann, J., Eckel, C., Kacelnik, A., & Wilson, R. (2001). The value of a smile:Game theory with a human face. Journal of Economic Psychology, 22(5), 617-640.
Schnider, A., Treyer, V., & Buck, A. (2005). The human orbitofrontal cortex monitorsoutcomes even when no reward is at stake. Neuropsychologia, 43(3), 316-323.
Schoemaker, P.J.H. (1980). Experiments on Decisions under Risk: The Expected UtilityHypothesis: Martinus Nijhoff Pub.
Schoemaker, P.J.H. (1982). The expected utility model: Its variants, purposes, evidenceand limitations. Journal of Economic Literature, 529-563.
Schreiber, D., Dawes, C.T., Loewen, P.J., Simmons, A.N., Flagan, T., McElreath, R., . . .Paulus, M.P. (2010). The Neural Basis of Egalitarian Behaviors.
Selten, R. (1991). Evolution, learning, and economic behavior. Games and EconomicBehavior, 3(1), 3-24.
Selten, R., & Stoecker, R. (1986). End behavior in sequences of finite Prisoner'sDilemma supergames A learning theory approach. Journal of Economic Behavior& Organization, 7(1), 47-70.
Silverstein, A., Cross, D., Brown, J., & Rachlin, H. (1998). Prior experience andpatterning in a prisoner's dilemma game. Journal of Behavioral Decision Making,11(2), 123-138.
Smith, P.B., & Bond, M.H. (1993). Social Psychology Across Cultures: Analysis andPerspectives: Harvester Wheatsheaf.
Smith, S.M. (2002). Fast robust automated brain extraction. Human Brain Mapping,17(3), 143-155.
Smith, S.M., Jenkinson, M., Woolrich, M.W., Beckmann, C.F., Behrens, T., Johansen-Berg, H., . . . Flitney, D.E. (2004). Advances in functional and structural MRimage analysis and implementation as FSL. Neuroimage, 23, S208.
119
Stockard, J., Van De Kragt, A.J.C., & Dodge, P.J. (1988). Gender roles and behavior insocial dilemmas: Are there sex differences in cooperation and in its justification?Social Psychology Quarterly, 154-163.
Stone, V.E., Winkielman, P., & Harmon-Jones, E. (2007). An Evolutionary Perspectiveon Domain Specificity in Social Intelligence. Social Neuroscience. IntegratingBiological and Psychological Explanations of Social Behavior. NewYork/London, 316-349.
Tabibnia, G., Satpute, A.B., & Lieberman, M.D. (2008). The sunny side of fairness.Psychological Science, 19(4), 339.
Tajfel, H. (1981). Human Groups and Social Categories: Studies in Social Psychology:Cambridge Univ Pr.
Tajfel, H. (1982). Social psychology of intergroup relations. Annual Review ofPsychology, 33(1), 1-39.
Tajfel, H. (2010). Social Identity and Intergroup Relations (Vol. 7): Cambridge Univ Pr.
Teece, D.J. (1992). Competition, cooperation, and innovation: Organizationalarrangements for regimes of rapid technological progress. Journal of EconomicBehavior & Organization, 18(1), 1-25.
Trepel, C., Fox, C.R., & Poldrack, R.A. (2005). Prospect theory on the brain? Toward acognitive neuroscience of decision under risk. Cognitive Brain Research, 23(1),34-50.
Triandis, H.C. (1989). The self and social behavior in differing cultural contexts.Psychological Review; Psychological Review, 96(3), 506.
Tricomi, E., Rangel, A., Camerer, C.F., & O’Doherty, J.P. (2010). Neural evidence forinequality-averse social preferences. Nature, 463(7284), 1089-1091.
Tsukamoto, T., Kotani, Y., Ohgami, Y., Omura, K., Inoue, Y., & Aihara, Y. (2006).Activation of insular cortex and subcortical regions related to feedback stimuli ina time estimation task: an fMRI study. Neuroscience Letters, 399(1), 39-44.
Turner, B.M., Paradiso, S., Marvel, C.L., Pierson, R., Boles Ponto, L.L., Hichwa, R.D., &Robinson, R.G. (2007). The cerebellum and emotional experience.Neuropsychologia, 45(6), 1331-1341.
Tversky, A. (1975). A critique of expected utility theory: Descriptive and normativeconsiderations. Erkenntnis, 9(2), 163-173.
120
Von Neumann, J., Morgenstern, O., Rubinstein, A., & Kuhn, H.W. (1944). Theory ofGames and Economic Behavior: Princeton Univ Pr.
Waytz, A., Zaki, J., & Mitchell, J.P. (2012). Response of dorsomedial prefrontal cortexpredicts altruistic behavior. The Journal of Neuroscience, 32(22), 7646-7650.
Weber, E.U., & Hsee, C.K. (1999). Models and mosaics: Investigating cross-culturaldifferences in risk perception and risk preference. Psychonomic Bulletin &Review, 6(4), 611-617.
Weissman, D., Perkins, A., & Woldorff, M. (2008). Cognitive control in social situations:A role for the dorsolateral prefrontal cortex. Neuroimage, 40(2), 955-962.
Wilcoxon, F. (1945). Individual comparisons by ranking methods. Biometrics Bulletin,1(6), 80-83.
Williams, C.B., & Gulati, G.J. (2007). Social Networks in Political Campaigns:Facebook and the 2006 Midterm Elections. Paper presented at the annual meetingof the American Political Science Association.
Willingham, D.T., & Dunn, E.W. (2003). What neuroimaging and brain localization cando, cannot do and should not do for social psychology. Journal of Personality andSocial Psychology, 85(4), 662.
Wong, R.Y., & Hong, Y. (2005). Dynamic influences of culture on cooperation in theprisoner's dilemma. Psychological Science, 16(6), 429-434.
Woolrich, M.W., Ripley, B.D., Brady, M., & Smith, S.M. (2001). Temporalautocorrelation in univariate linear modeling of FMRI data. Neuroimage, 14(6),1370-1386.
Worsley, K. (2001). Statistical analysis of activation images. Functional MRI: anIntroduction to Methods, 14, 251-270.
Xiao, E., & Bicchieri, C. (2010). When equality trumps reciprocity. Journal of EconomicPsychology, 31(3), 456-470.
Yacubian, J., Gläscher, J., Schroeder, K., Sommer, T., Braus, D.F., & Büchel, C. (2006).Dissociable systems for gain-and loss-related value predictions and errors ofprediction in the human brain. The Journal of Neuroscience, 26(37), 9530.
Yamagishi, T. (1988). Exit from the group as an individualistic solution to the free riderproblem in the United States and Japan. Journal of Experimental SocialPsychology, 24(6), 530-542.
121
Yamagishi, T. (2003). Cross-Societal Experimentation on Trust: A Comparison of theUnited States and Japan. In E. Ostrom & J. Walker (Eds.), Trust and Reciprocity(pp. 352-370). New York: Russell Sage Foundation.
Yamagishi, T., & Yamagishi, M. (1994). Trust and commitment in the United States andJapan. Motivation and Emotion, 18(2), 129-166.
Zaki, J., & Mitchell, J.P. (2011). Equitable decision making is associated with neuralmarkers of intrinsic value. Proceedings of the National Academy of Sciences,108(49), 19761-19766.
Zeki, S., & Romaya, J.P. (2008). Neural correlates of hate. PloS one, 3(10), e3556.
Recommended