National Cancer Intelligence Network Be Clear on Cancer: Oesophago-gastric cancer awareness regional pilot campaign: Interim evaluation report Interim evaluation results
Be Clear on Cancer: Oesophago-gastric cancer awareness regional pilot campaign Interim evaluation results
About Public Health England
Public Health England exists to protect and improve the nation's health and wellbeing, and reduce health inequalities. It does this through world-class science, knowledge and intelligence, advocacy, partnerships and the delivery of specialist public health services. PHE is an operationally autonomous executive agency of the Department of Health. Public Health England Wellington House 133-155 Waterloo Road London SE1 8UG Tel: 020 7654 8000 www.gov.uk/phe Twitter: @PHE_uk Facebook: www.facebook.com/PublicHealthEngland Prepared by: National Cancer Intelligence Network For queries relating to this document, please contact: [email protected] © Crown copyright 2015 You may re-use this information (excluding logos) free of charge in any format or medium, under the terms of the Open Government Licence v3.0. To view this licence, visit OGL or email [email protected]. Where we have identified any third party copyright information you will need to obtain permission from the copyright holders concerned. Any enquiries regarding this publication should be sent to [email protected]. Published July 2015 PHE publications gateway number: 2015177 This document is available in other formats on request. Please call 020 7654 8158 or email [email protected]
2
Be Clear on Cancer: Oesophago-gastric cancer awareness regional pilot campaign Interim evaluation results
The intelligence networks
Public Health England operates a number of intelligence networks, which work with partners to develop world-class population health intelligence to help improve local, national and international public health systems. National Cancer Intelligence Network
The National Cancer Intelligence Network (NCIN) is a UK-wide initiative, working to drive improvements in standards of cancer care and clinical outcomes by improving and using the information collected about cancer patients for analysis, publication and research. National Cardiovascular Intelligence Network
The National Cardiovascular Intelligence Network (NCVIN) analyses information and data and turns it into meaningful timely health intelligence for commissioners, policy makers, clinicians and health professionals to improve services and outcomes. National Child and Maternal Health Intelligence Network
The National Child and Maternal Health Intelligence Network (NCMHIN) provides information and intelligence to improve decision-making for high-quality, cost-effective services. Its work supports policy makers, commissioners, managers, regulators, and other health stakeholders working on children’s, young people’s and maternal health. National Mental Health, Dementia and Neurology Intelligence Network
The National Mental Health Intelligence Networks (NMHDNIN) brings together the distinct National Mental Health Intelligence Network, the Dementia Intelligence Network and the Neurology Intelligence Network under a single programme. The Networks work in partnership with key stakeholder organisations. The Networks seeks to put information and intelligence into the hands of decision makers to improve mental health and wellbeing, support the reduction of risk and improve the lives of people living with dementia and improve neurology services. National End of Life Care Intelligence Network
The National End of Life Care Intelligence Network (NEoLCIN) aims to improve the collection and analysis of information related to the quality, volume and costs of care provided by the NHS, social services and the third sector to adults approaching the end of life. This intelligence will help drive improvements in the quality and productivity of services.
3
Be Clear on Cancer: Oesophago-gastric cancer awareness regional pilot campaign Interim evaluation results
Contents About Public Health England 2
The intelligence networks 2
Contents 4
Executive summary 5
Introduction 9
Public awareness and knowledge 10
Campaign communication 11 Knowledge of oesophago-gastric cancer symptoms 11 Action taken as a result of the campaign 11
Urgent GP referrals for suspected cancer and related cancer diagnoses 12
Methods 12 Urgent GP referrals for suspected cancer 18 Cancer diagnoses resulting from an urgent GP referral for suspected cancer 24 Conversion rate 32 Cancer diagnoses recorded in the Cancer Waiting Times database 39 Detection rate 48
Appendix 1: List of tables 56
Appendix 2: List of figures 58
4
Be Clear on Cancer: Oesophago-gastric cancer awareness regional pilot campaign Interim evaluation results
Executive summary
A regional oesophago-gastric cancer awareness campaign ran in the North East of England (Tyne Tees TV and Borders TV regions) from 10 February to 9 March 2014. The campaign’s primary key message was ‘Having heartburn, most days, for three weeks or more could be a sign of cancer – tell your doctor’, with a secondary message of ‘if food is sticking when you swallow, tell your doctor’. A full and final evaluation report for the regional pilot oesophago-gastric campaign will be published when the analysis of all metrics is complete. In advance of the final evaluation report, this interim report provides the results available to date. The oesophago-gastric cancer awareness regional pilot campaign was well recognised across all channels. Prior to the campaign, awareness of symptoms was low but afterwards knowledge increased significantly. The campaign also appears to have caused an increase in the number of urgent GP referrals for suspected upper GI cancers in the regional pilot area. There is some evidence that the campaign may have affected the detection rate, particularly for those aged in their 60s, however, there is little or no evidence of an impact on the number of cancers diagnosed after an urgent GP referral for suspected upper GI cancers, the conversion rate or the number of CWT recorded cancers. The following points form a summary of the main results detailed in this report: Public awareness and knowledge
1.1 A quarter (25%) were confident in their knowledge of oesophago-gastric cancer symptoms at the pre stage and this increased to more than one in three (35%) in the pilot region at the post stage. The control region did not experience this increase, suggesting that the positive pilot region results were a consequence of the campaign.
1.2 The proportion who stated that persistent heartburn was a definite warning sign of
oesophago-gastric cancer increased significantly from one in ten (11%) to three in ten (31%). Likewise, persistent indigestion as a definite warning sign increased from 9% to 25% and food sticking increased from 23% to 38%.
5
Be Clear on Cancer: Oesophago-gastric cancer awareness regional pilot campaign Interim evaluation results
Urgent GP referrals for suspected upper GI cancers
1.3 The regional pilot oesophago-gastric cancer awareness campaign appears to have resulted in a large increase in referrals for suspected upper GI cancers, from February to April 2013 to February to April 2014.
1.4 Within the regional pilot area, there was a 52% increase in referrals for suspected
upper GI cancers. This compares to an increase of 17% in the control area. 1.5 For suspected head and neck cancers1, there was also a larger increase in
referrals for the regional pilot area (27%) compared to the control area (16%), however, the difference between the two areas was smaller than for upper GI referrals.
1.6 Larger increases in suspected upper GI cancer referrals were found for those aged
in their 50s (85%) and 60s (69%), with a smaller increase for those aged 80 and over (18%).
1.7 The increase in upper GI referrals was larger for men (63%) than for women (44%), resulting in smaller differences, between men and women, in the number and rate of referrals.
Conversion rate of urgent GP referrals for suspected upper GI cancers
1.8 For February to April 2014, compared to February to April 2013, there is little
evidence that the regional pilot oesophago-gastric cancer awareness campaign had an impact on either the numbers of cancer diagnoses resulting from an urgent GP referral for suspected upper GI cancers or on the conversion rates for these referrals, for any of oesophageal, stomach or upper GI cancers.
1.9 There was a large amount of natural variation in the number of oesophageal,
stomach and upper GI cancer diagnoses resulting from an urgent GP referral for suspected upper GI cancers, reflecting the relatively small numbers of such cases, both for the regional pilot area and control area.
1.10 There were no statistically significant changes in the number of diagnoses resulting from an urgent GP referral for suspected upper GI cancers, either overall
1 For an ‘other referrals’ comparator in the cancer waiting times analysis, we have used referrals for suspected head and neck cancers for recent evaluations, as this is a common referral type less likely to have been affected by campaigns, with no specific campaign directed at it.
6
Be Clear on Cancer: Oesophago-gastric cancer awareness regional pilot campaign Interim evaluation results
in the regional pilot area or by age group or sex. Neither were there any significant changes in the control area.
1.11 However, for those aged 60 to 69, the percentage changes in the number of diagnoses resulting from an urgent GP referral for suspected upper GI cancers were quite large, although the numbers were small, with an 85% increase for oesophageal cancer and a 59% increase for upper GI cancers.
1.12 Long-term trends showed decreasing conversion rates for urgent GP referrals for suspected upper GI cancers both for the regional pilot area and control area.
1.13 Within the regional pilot area, the stomach cancer conversion rate decreased significantly by 0.5 percentage points, from 0.9% to 0.4% and the upper GI cancer conversion rate decreased significantly by 1.1 percentage points, from 4.1% to 3.0%. As these decreases were slightly larger than those seen for the control area, there may have been a small additional decrease during the campaign period.
1.14 There were no statistically significant changes in either oesophageal or upper GI cancer conversion rates by age group.
1.15 By sex, the only significant change was a decrease in the upper GI cancer conversion rate for men, although this appeared to largely reflect the longer term decreasing trend.
Detection rate for upper GI cancers
1.16 There is some evidence that the regional pilot oesophago-gastric cancer awareness campaign may have had an impact on detection rate, but not the number of CWT recorded cancers, for oesophageal, stomach and upper GI cancers, for March to May 2014, compared to the same months in 2013, particularly for those aged in their 60s.
1.17 However, results were based on a relatively small number of oesophageal,
stomach and upper GI cancer diagnoses, with trends in CWT recorded diagnoses and detection rates demonstrating much inherent variation. It is also important to remember that, for these metrics, it is particularly difficult to define a campaign-affected period, due to varying diagnostic routes and time-periods.
1.18 For the regional pilot area, there were small decreases in the number of the oesophageal (6%), stomach (10%) and upper GI (4%) cancer diagnoses recorded in the CWT data, but these changes were not statistically significant. Similarly, for the control area, the smaller changes were not significant.
7
Be Clear on Cancer: Oesophago-gastric cancer awareness regional pilot campaign Interim evaluation results
1.19 There were no significant changes in the number of cancers, for any age-group or by sex.
1.20 There were increases in the detection rates in the regional pilot area, ranging from 3.3 percentage points, for upper GI cancer, to 9.5 percentage points, for oesophageal cancer, however, none of these changes were statistically significant and nor were any changes by sex.
1.21 There were statistically significant increases in the detection rates for those aged 60 to 69 for both oesophageal and stomach cancers, as well as all upper GI cancers combined. The detection rate increased by: • 40 percentage points for oesophageal cancer, from 46% to 86%; • 50 percentage points for stomach cancer, from 21% to 71%; and • 29 percentage points for upper GI cancer, from 35% to 64%.
8
Be Clear on Cancer: Oesophago-gastric cancer awareness regional pilot campaign Interim evaluation results
Introduction
Be Clear on Cancer awareness campaigns
Be Clear on Cancer campaigns have been developed to improve early diagnosis by raising awareness of the symptoms of cancer and encouraging people with those symptoms to see their GP early. The Be Clear on Cancer brand has been used to promote awareness and early diagnosis of specific cancer types since January 2011. The oesophago-gastric cancer local campaign was developed using the Be Clear on Cancer branding and ran from April to July 2012. Since 2013 the programme has been led by Public Health England, working in partnership with the Department of Health and NHS England. Each campaign is tested locally and then regionally, with a view to rolling them out nationally if they prove to be effective. For each Be Clear on Cancer campaign there is a comprehensive evaluation process. Data is collected on a number of metrics to reflect possible campaign impact. These include whether campaigns are raising awareness of signs and symptoms of cancer; more people are going to their GPs with the symptoms highlighted by the campaign; more people are being referred urgently for suspected cancer; there is an increase in diagnostic activity; those referred urgently for suspected cancer are diagnosed with cancer; there are increases in the number of cancers diagnosed and if there is evidence of a shift towards earlier stage disease.
Oesophago-gastric cancer awareness regional pilot campaign
A local Be Clear on Cancer campaign featuring the symptoms of oesophago-gastric cancer was developed and run in eight areas from April to July 2012. After evaluation of the local campaign it was decided to develop a regional campaign which subsequently ran from February to March 2014. A mixture of TV, radio, press, poster, out of home (GP surgeries) and digital advertising was used alongside a public relations campaign. Leaflets to target those aged over 50 (as this group are most at risk of oesophago-gastric cancer) were distributed via GP surgeries and at football matches. Direct mail was also sent to men in this region, as they are more at risk of the disease than women.
9
Be Clear on Cancer: Oesophago-gastric cancer awareness regional pilot campaign Interim evaluation results
Public awareness and knowledge
Research methodology
The research was conducted through pre and post campaign surveys in test and control areas. The test area was the North East for the oesophago-gastric cancer campaign. The rest of England (excluding the North West, as a similar ovarian cancer regional pilot campaign ran at the same time in this area) provided the control area. Samples of approximately 300 adults aged 50 plus were interviewed face to face in the pilot area at both pre and post stages. The research was conducted by TNS-BMRB, an independent market research agency specialising in social research. The survey was a face to face survey among a representative sample of adults aged 50 plus in England. This was supplemented with additional face to face interviews in the North East pilot region. The pre campaign interviews took place between 13 January 2014 and 2 February 2014 and the post campaign interviews took place between 17 March 2014 and 6 April 2014.
Campaign awareness and recognition
Over eight in ten (84%) had seen recent cancer publicity at the pre stage in the pilot region with a similar proportion having seen cancer publicity in the control (79%). An indicative increase occurred at the post stage among pilot region respondents (from 84% to 87%). This resulted in a significantly higher level of awareness for pilot region respondents when compared to the control at the post stage, suggesting that the campaign has had an impact on awareness levels. There was a significant increase pre to post campaign in the proportion of pilot region respondents who had recently seen publicity relating to heartburn (0% to 13%). Recall of this publicity remained at zero in the control region at both research stages, indicating that the increase in the pilot region was as a result of the campaign. There was also an increase in those in the pilot region recalling publicity that encouraged them to see their doctor (6% to 13%) while the corresponding results remained static among the control group. In the pilot region eight in ten (79%) recognised at least one of the advertisements from the oesophago-gastric cancer campaign. This was the highest level achieved across the six regional pilots to date. The TV (69%) and press advertisements (35%) achieved above average recognition, while recognition of the radio advertising (26%) and leaflet (19%) was in line with average
10
Be Clear on Cancer: Oesophago-gastric cancer awareness regional pilot campaign Interim evaluation results
Campaign communication
The call to action message (‘go to doctor’) was spontaneously taken out by over half of respondents (56%) after seeing the advertisements. The messages concerning symptoms were less commonly received. Less than one in six (15%) mentioned being aware of signs or symptoms and only 7% mentioned heartburn or indigestion for three weeks or more. When prompted, almost nine in ten took out messages relating to heartburn and food sticking. A quarter (25%) were confident in their knowledge of oesophago-gastric cancer symptoms at the pre stage and this increased to more than one in three (35%) in the pilot region at the post stage. The control region did not experience this increase, suggesting that the positive pilot region results were a consequence of the campaign. Despite the increase in the pilot region, confidence levels remained substantially below average at both stages (25% compared with 40% average pre and 35% compared with 50% post) highlighting the need for a national campaign.
Knowledge of oesophago-gastric cancer symptoms
Positive increases in prompted knowledge of key symptoms were seen among those in the pilot region. The proportion who stated that persistent heartburn was a definite warning sign of oesophago-gastric cancer increased significantly from one in ten (11%) to three in ten (31%). Likewise, persistent indigestion as a definite warning sign increased from 9% to 25% and food sticking increased from 23% to 38%. None of these increases in understanding were seen among those in the control region, pointing to the campaign as responsible for this change.
Action taken as a result of the campaign
Eight in ten (82%) agreed that the advertising would make them more likely to go to the GP with any symptoms featured in the campaign. This was around the average level for regional pilot campaigns. One in six (16%) of those who recognised the campaign stated that they had taken some action, with the most common action being to talk to friends or family members to advise them (7%). Just fewer than one in twenty (4%) said they had made an appointment with their GP.
11
Be Clear on Cancer: Oesophago-gastric cancer awareness regional pilot campaign Interim evaluation results
Urgent GP referrals for suspected cancer and related cancer diagnoses
This chapter considers whether the regional pilot oesophago-gastric cancer awareness campaign had an impact on the number of urgent GP referrals for suspected upper gastrointestinal (upper GI) cancers or on Cancer Waiting Times (CWT) recorded information on upper GI cancer diagnoses. Methods
Metric definitions
Analysis considers the following metrics, all derived from the Cancer Waiting Times data: Urgent GP referrals for suspected cancer (R) Urgent GP referrals for suspected upper GI cancers, presented by month first seen. (Also known as two week wait (TWW) referrals.) Cancer diagnoses resulting from an urgent GP referral for suspected cancer (TC) Those upper GI cancer diagnoses (ICD10 C15-C16, C22-C25) resulting from an urgent GP referral for suspected upper GI cancers, presented by month first seen. (Also known as two week wait (TWW) cancers, or 62 day cancers [based on the waiting times target from urgent GP referral to first treatment].) Conversion rate (C) Percentage of urgent GP referrals for suspected upper GI cancers resulting in a diagnosis of upper GI cancer, presented by month first seen. Cancer diagnoses recorded in the Cancer Waiting Times database (CC) All upper GI cancer diagnoses recorded in the CWT database (CWT-Db), presented by month of first treatment. (Also known as CWT cancers, or 31 day cancers [based on the waiting times target from decision to treat to first treatment].) Detection Rate (D) Percentage of CWT-Db recorded upper GI cancer diagnoses which resulted from an urgent GP referral for suspected upper GI cancers, presented by month of first treatment.
12
Be Clear on Cancer: Oesophago-gastric cancer awareness regional pilot campaign Interim evaluation results
When patients are referred, cancer is only a suspicion, with the cancer or other diagnoses to be confirmed. As a result, specific cancer type diagnoses are unknown and so urgent GP referrals for suspected cancer are recorded against a limited number of broad cancer types. One of these broad cancer types is upper GI cancers, incorporating oesophageal and gastric (also referred to as stomach) cancers, along with several other types of cancer (eg. liver and pancreatic). Therefore, these analyses are repeated for diagnoses of all upper GI cancers, oesophageal cancer (ICD10 C15) and stomach cancer (ICD10 C16), although all related to all referrals for suspected upper GI cancers. Defining the campaign period
The campaign ran from 10 February to 9 March 2014. Therefore we might expect an impact on referrals first seen during the campaign months (February and March) and, allowing for reasonable delays from campaign activity to referral, in the month following the end of the campaign (April). These delays may occur for several reasons, for example some patients may need to see the campaign materials multiple times before reacting; some patients may need to wait for a GP appointment, especially if they prefer a convenient time or a specific GP, and so may be seen by the GP after the campaign ended. Dates are based on ‘date first seen’ as recorded in the CWT-Db, reflecting the date seen in secondary care rather than primary care, and referrals made towards the end of the campaign may not have been seen in secondary care until after the campaign ended. Therefore the period from February to April 2014 was considered as the ‘campaign period’ for referrals, and also for cancer diagnoses resulting from an urgent GP referral for suspected cancer and for the conversion rate, as these were defined using the date first seen recorded for the referral. There is a necessary period of time between the date first seen following an urgent GP referral for suspected cancer and the start of treatment. This is because of the time required to perform diagnostic tests or to plan and arrange treatment, for example, and will vary for different patients and trusts. This meant that, for cancer diagnoses recorded in the CWT database and the detection rate, it was not possible to identify a clear period relating directly and specifically to the campaign. Diagnoses in the early campaign months could include those resulting from referrals prior to the campaign or at the beginning of the campaign. Similarly, diagnoses in the months after the campaign could include those resulting from referrals during the campaign or after the end of the campaign. Taking into consideration the average interval from date first seen to treatment start date, and the waiting times target of 62 days from urgent GP referral to first treatment, the period from March to May was thought to best represent the
13
Be Clear on Cancer: Oesophago-gastric cancer awareness regional pilot campaign Interim evaluation results
campaign effect. This period should include many of the diagnoses resulting from campaign period referrals without too many diagnoses from pre- or post-campaign referrals. Therefore the period from March to May 2014 was considered as the ‘campaign period’ for upper GI cancer diagnoses recorded in the CWT-Db and for the detection rate. Comparator referral types
The number of urgent GP referrals for suspected cancer has continued to increase year-on-year. This means that the evaluation’s comparison of the change from one year to the next is likely to reflect a combination of the campaign’s impact and the general increase in referrals. It is not possible to separate these two reasons for any particular referral type, but it is useful to consider the change in referrals for other suspected cancers to provide an indication of increase that was not associated with the campaign. However, due to the impact of previous regional and national Be Clear on Cancer campaigns, it was necessary to exclude a number of campaign-affected referral types from this comparison. Therefore, analysis of the change in referrals for other suspected cancers only considered referrals for suspected head and neck cancers. Guide to presentation
As the analysis considers a number of breakdowns, the following numbering system has been used throughout the chapter:
1. Total 2. By age 3. By sex
For total referrals only, with nested results to consider how changes in upper GI referrals may differ from general referral changes:
a. Referrals for suspected upper GI cancers b. Referrals for suspected head and neck cancers
For other metrics, with nested results to consider how changes for oesophageal, stomach and upper GI cancers may differ:
a. Results for oesophageal cancer b. Results for stomach cancer c. Results for upper GI cancers
For the campaign period (February to April 2014), the number of urgent GP referrals for suspected upper GI cancers were presented, alongside comparable results for the same months in the previous year. Year-on-year percentage change figures were
14
Be Clear on Cancer: Oesophago-gastric cancer awareness regional pilot campaign Interim evaluation results
calculated based on these referral counts, as this reflected the absolute change in levels of activity. A referral rate was also presented, in order to provide some context to explain how differences in the percentage change between areas (or ages) may relate differing referral patterns. Differences in referral rates would suggest there may be underlying differences in referral practices or cancer incidence between groups. It was not possible to assess whether any apparent campaign impact may have resulted from these underlying differences. Data for upper GI cancer diagnoses resulting from an urgent GP referral for suspected upper GI cancers and conversion rate were presented for the campaign period (February to April 2014), alongside comparable results for the same months in the previous year and the year-on-year percentage point change in the rate. Data for upper GI cancer diagnoses recorded in the CWT-Db and detection rate were presented for the campaign period (March to May 2014), alongside comparable results for the same months in the previous year and the year-on-year percentage point change in the rate. As this report considers a regional pilot campaign, most results were presented for the regional pilot area only. For the purposes of analysis this area was defined using the former North of England Cancer Network area. For overall results, comparison is made to a control area, which was defined as England excluding both the regional pilot area and local pilot areas. For the oesophago-gastric campaign, the local pilot areas were the following 25 former PCTs: Dudley; County Durham; Darlington; Sandwell; Wolverhampton City; Wandsworth; Newcastle; North Tyneside; Northumberland Care Trust; Cumbria Teaching; South Tyneside; Gateshead; Sunderland Teaching; Hartlepool; Middlesbrough; Redcar and Cleveland; Stockton-on-Tees Teaching; Bedfordshire; Cambridgeshire; Peterborough; Suffolk; Norfolk; Great Yarmouth and Waveney; Hertfordshire; and Luton. Statistical methods
Urgent GP referral rates vary greatly with age. To take account of differing age profiles of patients in different areas, the rates presented here were directly age-standardised and presented as rates per 100,000 population using the 2013 European Standard Population weights. Age-specific crude referral rates were presented for the age breakdown. For referrals and cancer diagnoses, the reported p-values were obtained from a likelihood ratio test. The null hypothesis was that the number of urgent GP referrals or cancer diagnoses in the campaign period in 2014 and the same months in 2013 came from the same Poisson distribution.
15
Be Clear on Cancer: Oesophago-gastric cancer awareness regional pilot campaign Interim evaluation results
For conversion and detection rates, the reported p-values are obtained from a two-sample proportion test. The null hypothesis was that the rate in the campaign period in 2014 was equal to the equivalent rate in 2013. P-values less than 0.05 indicate a statistically significant difference between the two periods, at the 95% level. This chapter provides results from a large number of statistical tests. Please note that, with a considered significance level of 95%, you could expect 5% of tests to provide a “statistically significant” result by chance. Data notes
Please note that there were a few data quality issues: For January to April 2012, no CWT data was uploaded by Imperial College Healthcare NHS Trust. However, this issue is expected to have a very limited impact on the results presented here, as it should only result in small differences to the results presented in the control area trend charts. For October to December 2012, some referral data was not uploaded for Central Manchester University Hospitals NHS Foundation Trust, however, this issue is expected to have a very limited impact on the results presented here, as it should only result in small differences to the results presented in the control area trend charts. For March 2013, no treatment data was uploaded by Chelsea and Westminster Hospital NHS Foundation Trust. However, this issue is expected to have a limited impact on the results presented here, as it should only result in small differences to the results presented for the control area’s comparator period (February to April 2013 or March to May 2013), and in the control area trend charts. For Colchester Hospital University NHS Foundation Trust, it was reported that some Cancer Waiting Times records, possibly until June 2014, were submitted incorrectly. A subsequent investigation into this issue confirmed that only a small number of records were affected. Data used for these analyses are as submitted but, considering the small number of records affected, this issue should not have an impact on these results. Of 312,015 TWW referrals for suspected upper GI cancers, 302 were excluded from analyses (120 due to missing demographic information; 182 due to null or invalid postcodes). Of 275,878 TWW referrals for suspected head and neck cancers, 330 were excluded from the analysis (148 due to missing demographics; 182 due to null or invalid postcodes).
16
Be Clear on Cancer: Oesophago-gastric cancer awareness regional pilot campaign Interim evaluation results
Of 21,093 cancers diagnoses resulting from an urgent GP referral for suspected upper GI cancers, including 15,551 upper GI cancer diagnoses of which there were 7,909 oesophageal cancer diagnoses and 2,777 stomach cancer diagnoses, 26 were excluded from analyses (17 due to missing demographic information; nine due to null or invalid postcodes).
Of 45,317 CWT recorded upper GI cancer diagnoses, including 15,932 oesophageal cancer diagnoses and 8,735 stomach cancer diagnoses, 93 were excluded from analyses (70 due to missing demographic information; 23 due to null or invalid postcodes). Monthly diagnoses, conversion rate and detection rate data can be quite variable because they are based on only a small number of cancer diagnoses, particularly for some of the smaller breakdowns. For this reason, some of the age groups are not plotted on the monthly trend charts, and some trend charts are quarterly rather than monthly. Data Source
Cancer Waiting Times data was obtained from the National Cancer Waiting Times Monitoring Dataset, provided by NHS England.
17
Be Clear on Cancer: Oesophago-gastric cancer awareness regional pilot campaign Interim evaluation results
Urgent GP referrals for suspected cancer
Total results
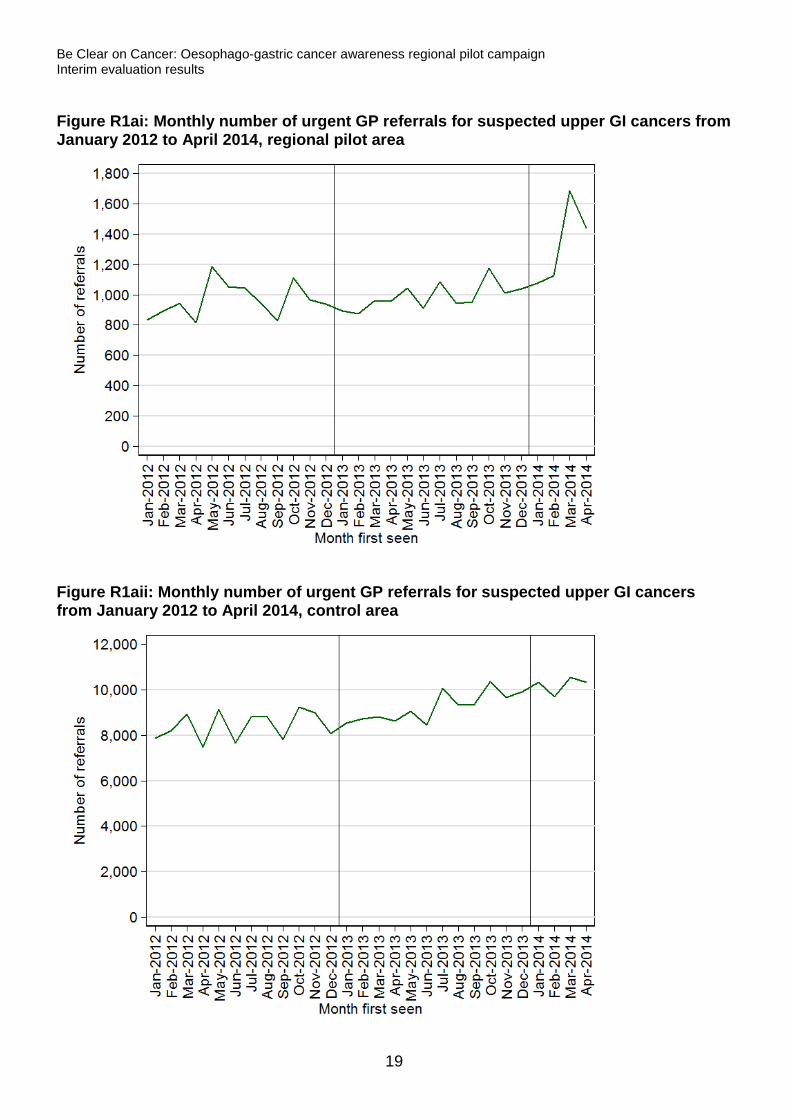
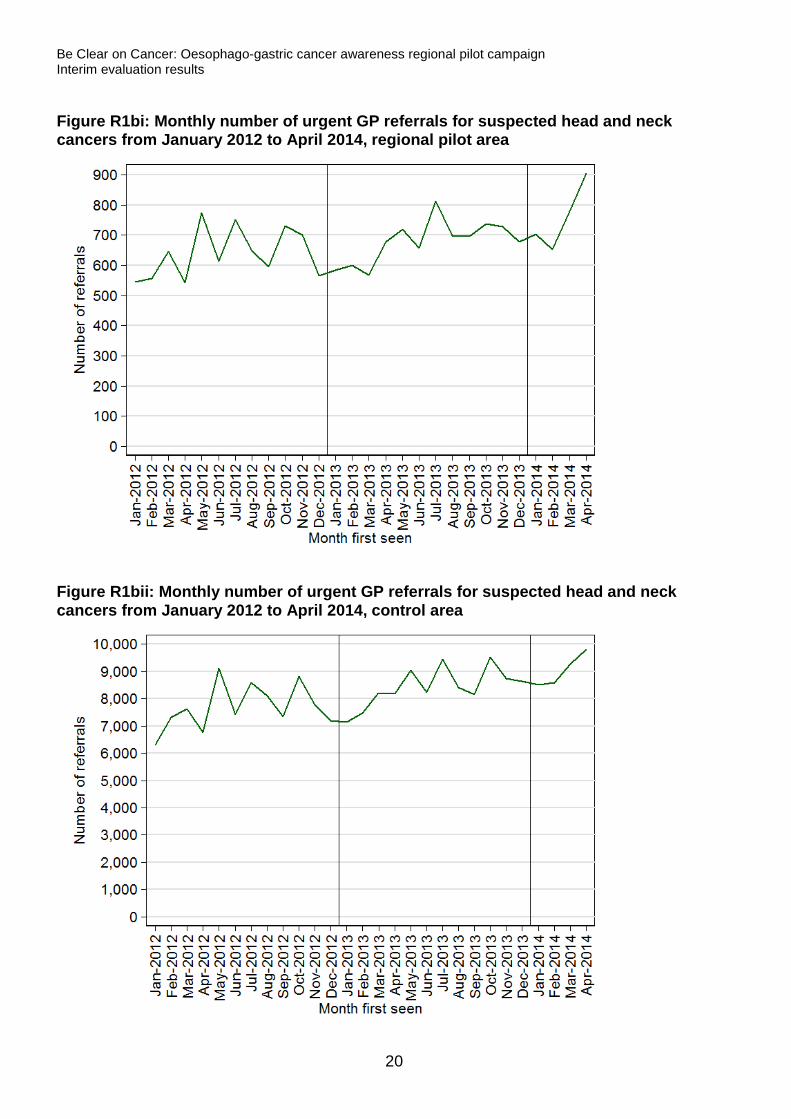
Figures R1ai and R1aii both show a general upward trend in referrals for suspected upper GI cancers. Although, for regional pilot areas (Figure R1ai), there was also a notable increase in February to April 2014, particularly in March. This result is also demonstrated in Table R1a, with statistically significant increases in urgent GP referrals for suspected upper GI cancers for both the regional pilot area and the control area, for February to April 2014 compared to the same months in 2013, however, the 52% increase within the regional pilot area, from 2,795 referrals in February to April 2013 to 4,257 referrals in the same months in 2014, was much larger than the 17% increase in the control area. Referrals for suspected head and neck cancers, a control referral type, also exhibit a general increasing trend (Figures R1bi and R1bii). Table R1b shows that, from 2013 to 2014, the increase for February to April was statistically significant for both the regional pilot area and the control area. Although the increase of 27% in the regional pilot area was again larger than the 16% increase in the control area, it was more similar to the control area increase than for suspected upper GI cancer referrals. Table R1a: Number of urgent GP referrals for suspected upper GI cancers, with referral rate and percentage change in number of referrals, from February to April 2013 and February to April 2014
Overall February to April
Referrals % Change in number P-value Referral rate
Estimate 95% CI Regional pilot
area 2013 2,795 52.3 <0.001 401.4 (386.5, 416.7) 2014 4,257 611.7 (593.3, 630.6)
Control area 2013 26,143 17.0 <0.001 280.8 (277.4, 284.3) 2014 30,585 327.9 (324.2, 331.6)
Table R1b: Number of urgent GP referrals for suspected head and neck cancers, with referral rate and percentage change in number of referrals, from February to April 2013 and February to April 2014
Overall February to April
Referrals % Change in number P-value Referral rate
Estimate 95% CI Regional pilot
area 2013 1,844 26.6 <0.001 259.7 (247.9, 272.0) 2014 2,335 331.2 (317.8, 345.0)
Control area 2013 23,860 15.9 <0.001 246.2 (243.1, 249.4) 2014 27,647 285.8 (282.4, 289.3)
18
Be Clear on Cancer: Oesophago-gastric cancer awareness regional pilot campaign Interim evaluation results
Figure R1ai: Monthly number of urgent GP referrals for suspected upper GI cancers from January 2012 to April 2014, regional pilot area
Figure R1aii: Monthly number of urgent GP referrals for suspected upper GI cancers from January 2012 to April 2014, control area
19
Be Clear on Cancer: Oesophago-gastric cancer awareness regional pilot campaign Interim evaluation results
Figure R1bi: Monthly number of urgent GP referrals for suspected head and neck cancers from January 2012 to April 2014, regional pilot area
Figure R1bii: Monthly number of urgent GP referrals for suspected head and neck cancers from January 2012 to April 2014, control area
20
Be Clear on Cancer: Oesophago-gastric cancer awareness regional pilot campaign Interim evaluation results
Age results
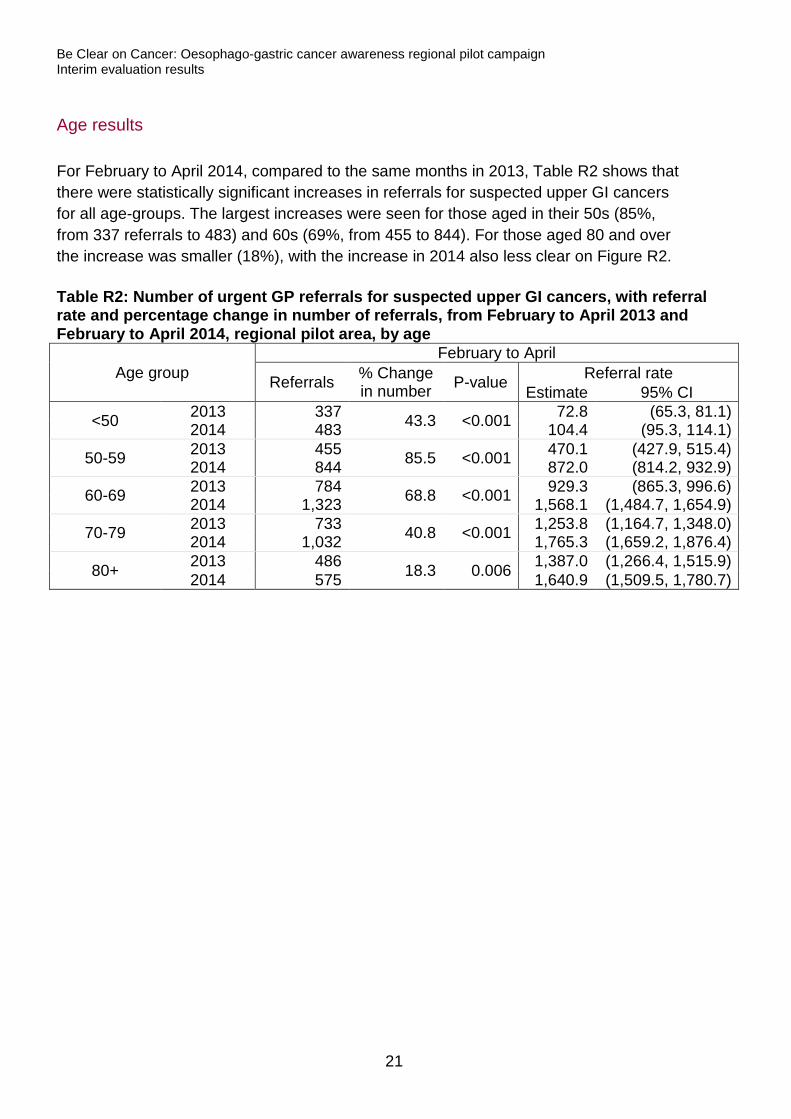
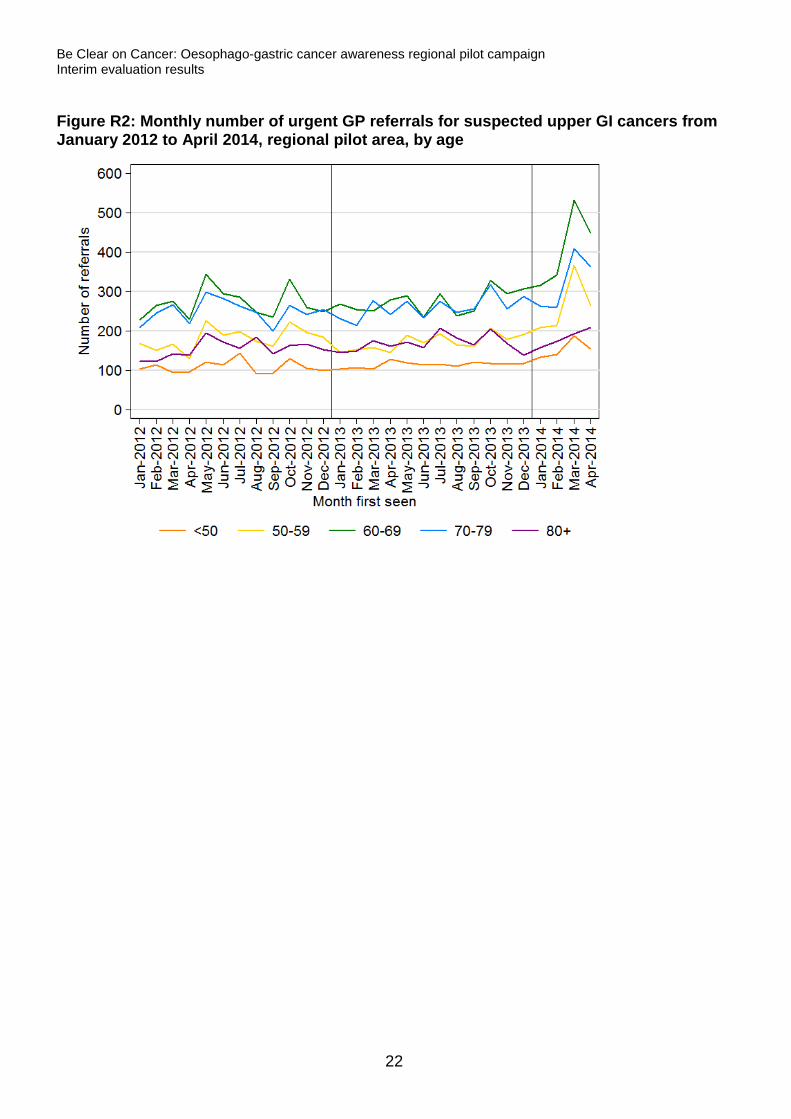
For February to April 2014, compared to the same months in 2013, Table R2 shows that there were statistically significant increases in referrals for suspected upper GI cancers for all age-groups. The largest increases were seen for those aged in their 50s (85%, from 337 referrals to 483) and 60s (69%, from 455 to 844). For those aged 80 and over the increase was smaller (18%), with the increase in 2014 also less clear on Figure R2. Table R2: Number of urgent GP referrals for suspected upper GI cancers, with referral rate and percentage change in number of referrals, from February to April 2013 and February to April 2014, regional pilot area, by age
Age group February to April
Referrals % Change in number P-value Referral rate
Estimate 95% CI
<50 2013 337 43.3 <0.001 72.8 (65.3, 81.1) 2014 483 104.4 (95.3, 114.1)
50-59 2013 455 85.5 <0.001 470.1 (427.9, 515.4) 2014 844 872.0 (814.2, 932.9)
60-69 2013 784 68.8 <0.001 929.3 (865.3, 996.6) 2014 1,323 1,568.1 (1,484.7, 1,654.9)
70-79 2013 733 40.8 <0.001 1,253.8 (1,164.7, 1,348.0) 2014 1,032 1,765.3 (1,659.2, 1,876.4)
80+ 2013 486 18.3 0.006 1,387.0 (1,266.4, 1,515.9) 2014 575 1,640.9 (1,509.5, 1,780.7)
21
Be Clear on Cancer: Oesophago-gastric cancer awareness regional pilot campaign Interim evaluation results
Figure R2: Monthly number of urgent GP referrals for suspected upper GI cancers from January 2012 to April 2014, regional pilot area, by age
22
Be Clear on Cancer: Oesophago-gastric cancer awareness regional pilot campaign Interim evaluation results
Sex Results
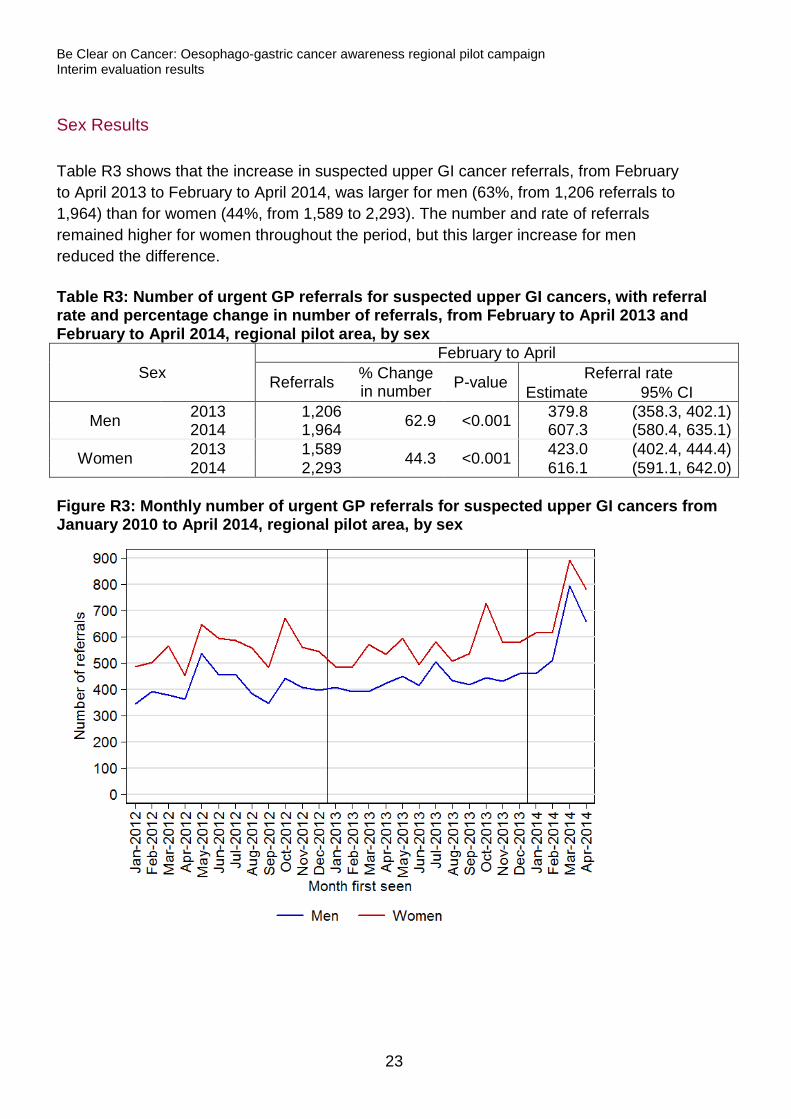
Table R3 shows that the increase in suspected upper GI cancer referrals, from February to April 2013 to February to April 2014, was larger for men (63%, from 1,206 referrals to 1,964) than for women (44%, from 1,589 to 2,293). The number and rate of referrals remained higher for women throughout the period, but this larger increase for men reduced the difference. Table R3: Number of urgent GP referrals for suspected upper GI cancers, with referral rate and percentage change in number of referrals, from February to April 2013 and February to April 2014, regional pilot area, by sex
Sex February to April
Referrals % Change in number P-value Referral rate
Estimate 95% CI
Men 2013 1,206 62.9 <0.001 379.8 (358.3, 402.1) 2014 1,964 607.3 (580.4, 635.1)
Women 2013 1,589 44.3 <0.001 423.0 (402.4, 444.4) 2014 2,293 616.1 (591.1, 642.0)
Figure R3: Monthly number of urgent GP referrals for suspected upper GI cancers from January 2010 to April 2014, regional pilot area, by sex
23
Be Clear on Cancer: Oesophago-gastric cancer awareness regional pilot campaign Interim evaluation results
Cancer diagnoses resulting from an urgent GP referral for suspected cancer
Total results
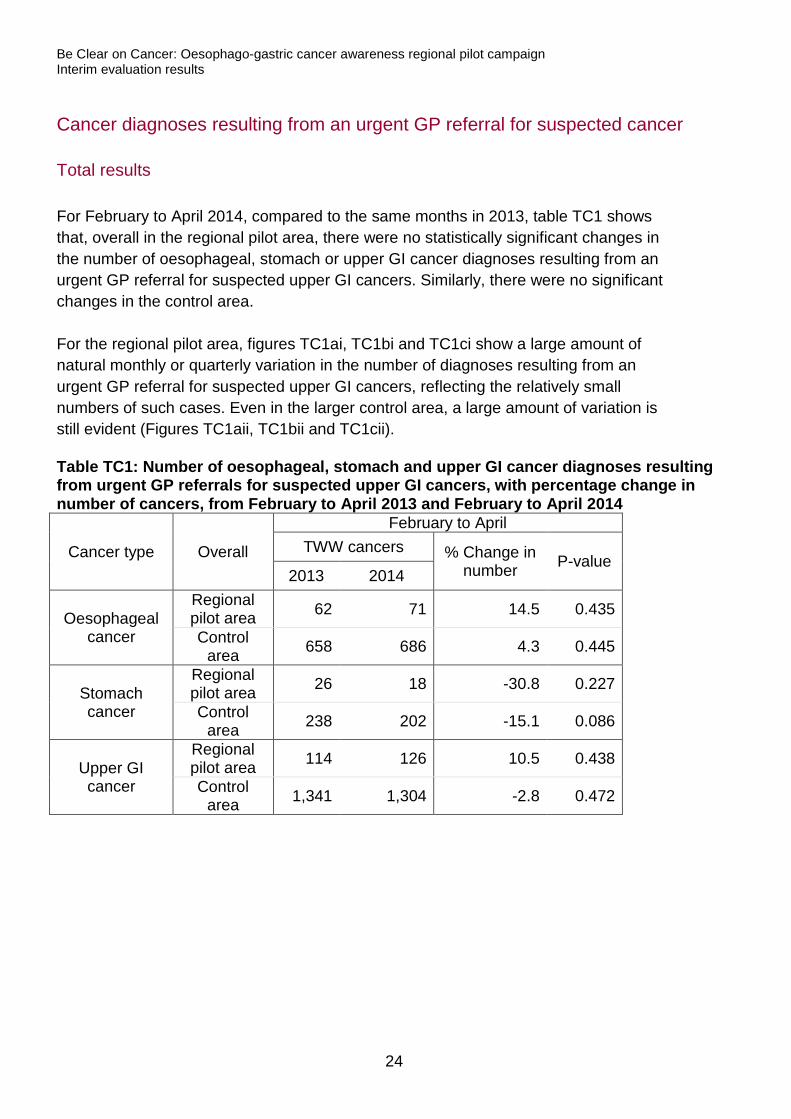
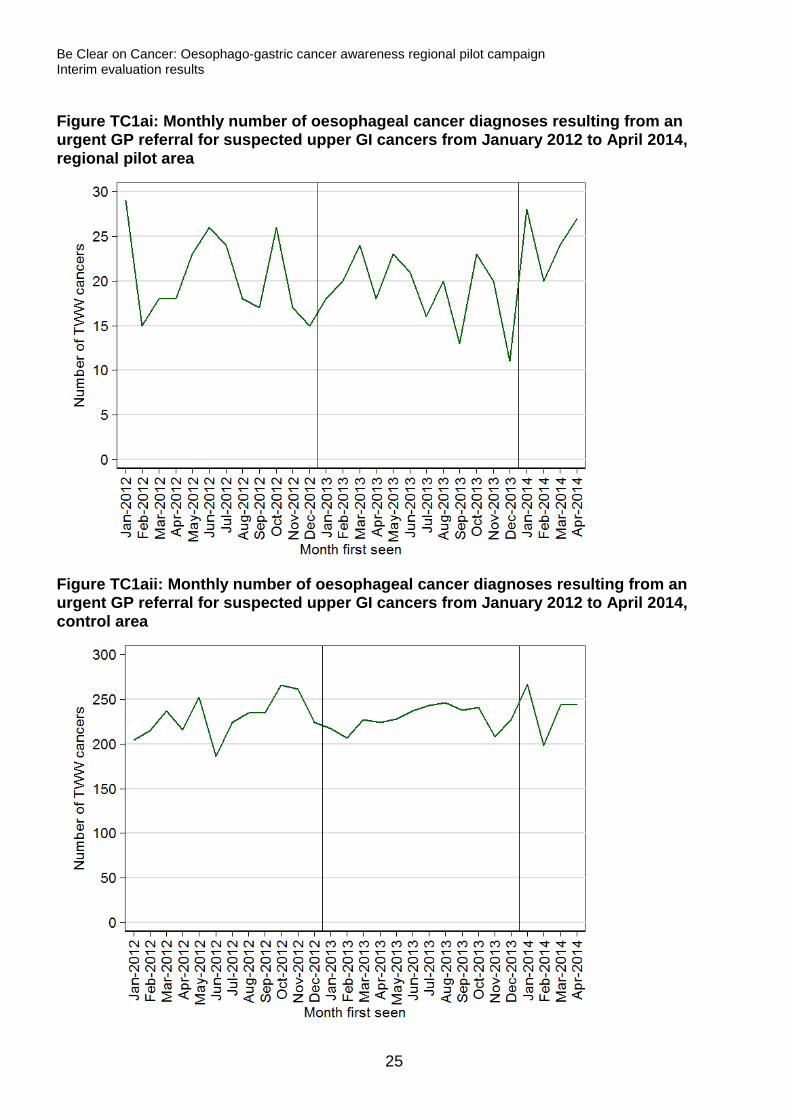
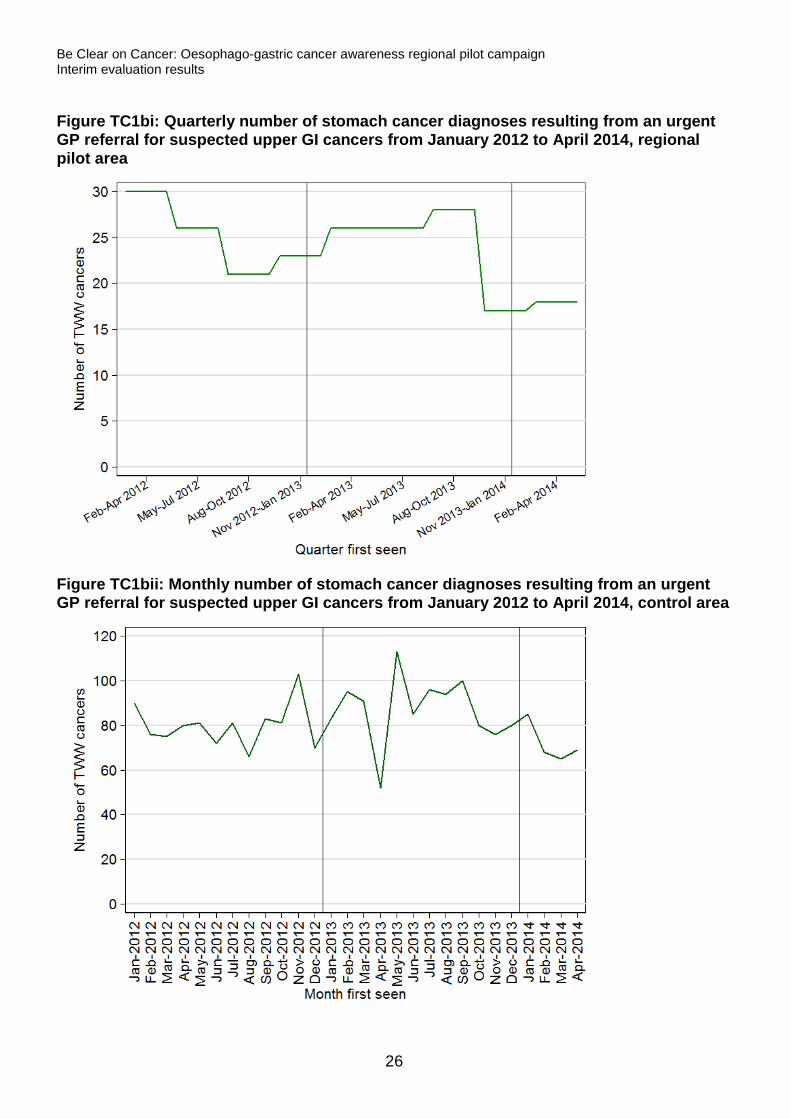
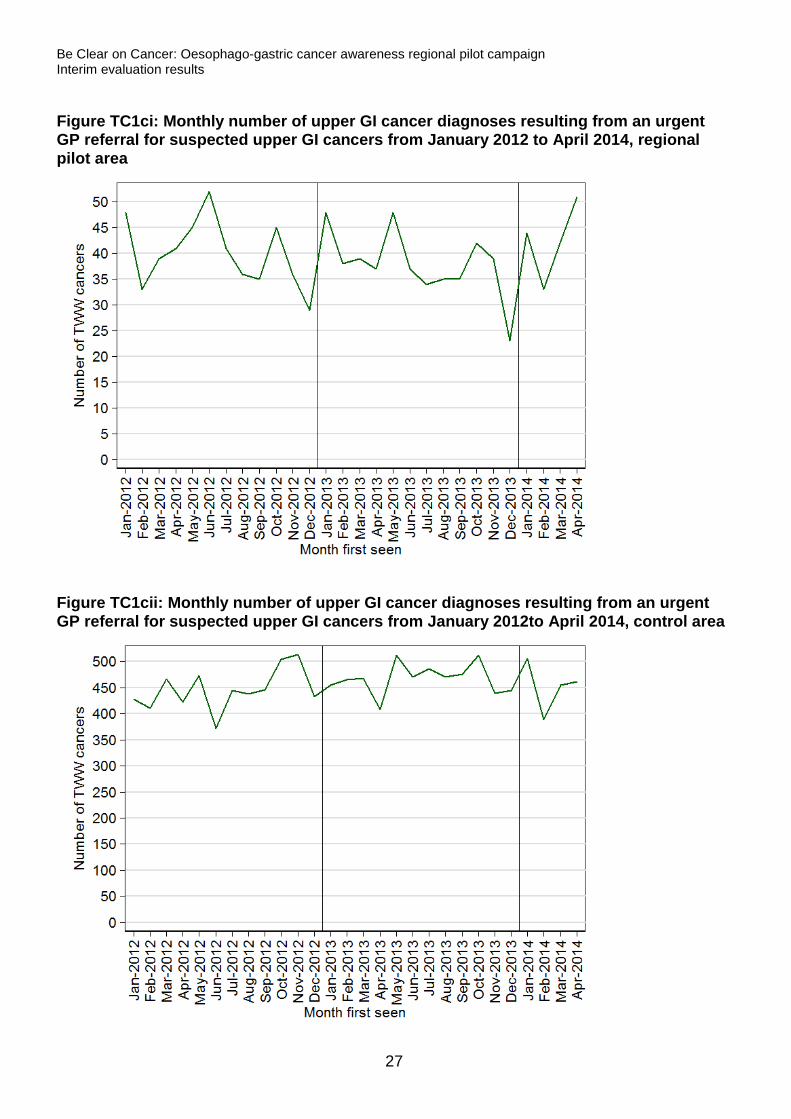
For February to April 2014, compared to the same months in 2013, table TC1 shows that, overall in the regional pilot area, there were no statistically significant changes in the number of oesophageal, stomach or upper GI cancer diagnoses resulting from an urgent GP referral for suspected upper GI cancers. Similarly, there were no significant changes in the control area. For the regional pilot area, figures TC1ai, TC1bi and TC1ci show a large amount of natural monthly or quarterly variation in the number of diagnoses resulting from an urgent GP referral for suspected upper GI cancers, reflecting the relatively small numbers of such cases. Even in the larger control area, a large amount of variation is still evident (Figures TC1aii, TC1bii and TC1cii). Table TC1: Number of oesophageal, stomach and upper GI cancer diagnoses resulting from urgent GP referrals for suspected upper GI cancers, with percentage change in number of cancers, from February to April 2013 and February to April 2014
Cancer type Overall
February to April TWW cancers % Change in
number P-value 2013 2014
Oesophageal cancer
Regional pilot area 62 71 14.5 0.435
Control area 658 686 4.3 0.445
Stomach cancer
Regional pilot area 26 18 -30.8 0.227
Control area 238 202 -15.1 0.086
Upper GI cancer
Regional pilot area 114 126 10.5 0.438
Control area 1,341 1,304 -2.8 0.472
24
Be Clear on Cancer: Oesophago-gastric cancer awareness regional pilot campaign Interim evaluation results
Figure TC1ai: Monthly number of oesophageal cancer diagnoses resulting from an urgent GP referral for suspected upper GI cancers from January 2012 to April 2014, regional pilot area
Figure TC1aii: Monthly number of oesophageal cancer diagnoses resulting from an urgent GP referral for suspected upper GI cancers from January 2012 to April 2014, control area
25
Be Clear on Cancer: Oesophago-gastric cancer awareness regional pilot campaign Interim evaluation results
Figure TC1bi: Quarterly number of stomach cancer diagnoses resulting from an urgent GP referral for suspected upper GI cancers from January 2012 to April 2014, regional pilot area
Figure TC1bii: Monthly number of stomach cancer diagnoses resulting from an urgent GP referral for suspected upper GI cancers from January 2012 to April 2014, control area
26
Be Clear on Cancer: Oesophago-gastric cancer awareness regional pilot campaign Interim evaluation results
Figure TC1ci: Monthly number of upper GI cancer diagnoses resulting from an urgent GP referral for suspected upper GI cancers from January 2012 to April 2014, regional pilot area
Figure TC1cii: Monthly number of upper GI cancer diagnoses resulting from an urgent GP referral for suspected upper GI cancers from January 2012to April 2014, control area
27
Be Clear on Cancer: Oesophago-gastric cancer awareness regional pilot campaign Interim evaluation results
Age results
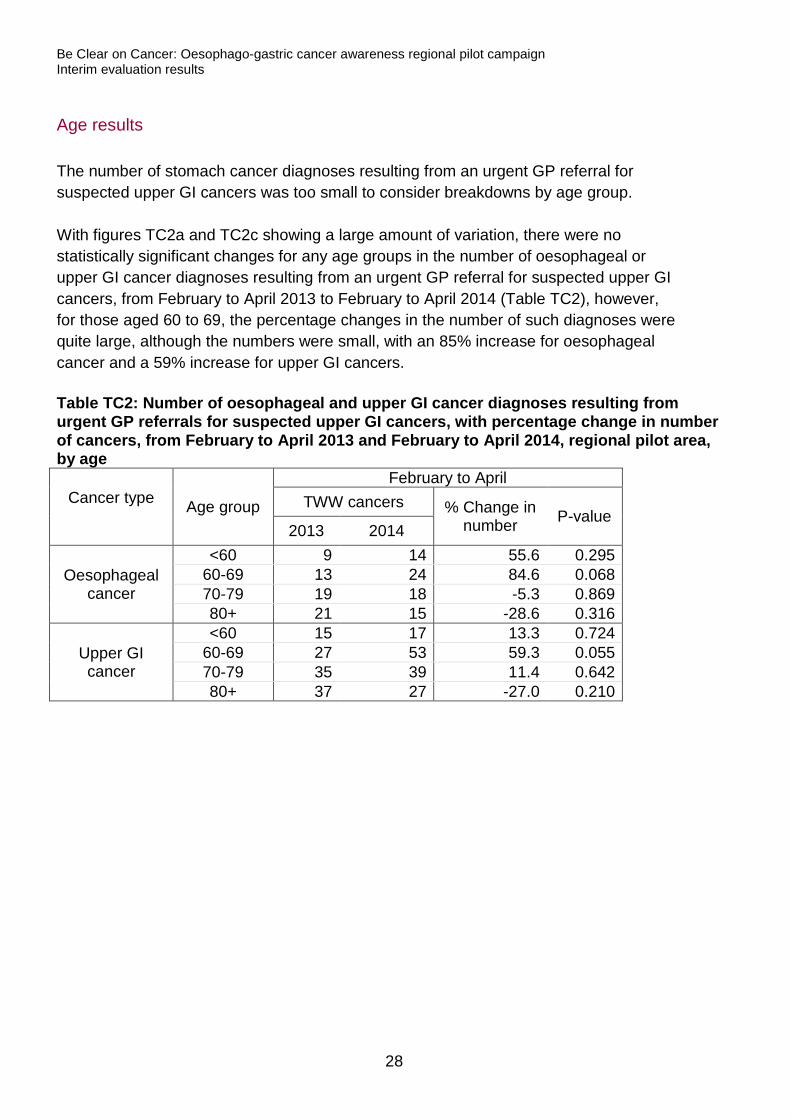
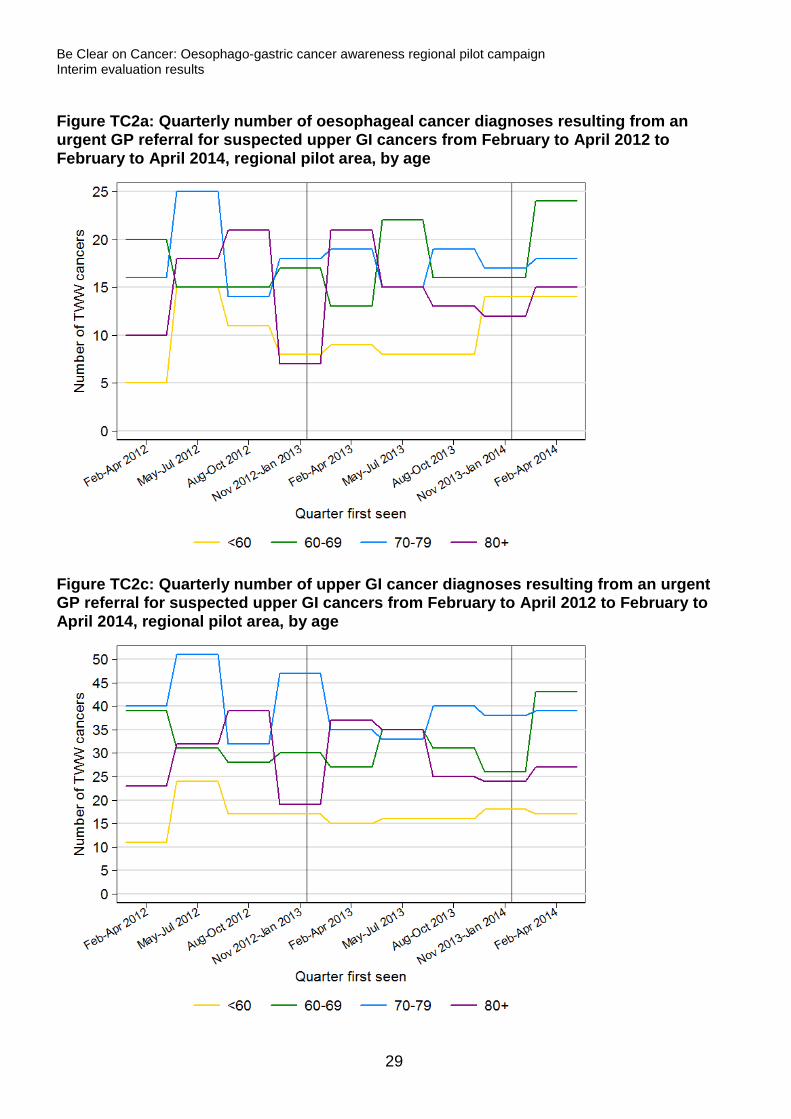
The number of stomach cancer diagnoses resulting from an urgent GP referral for suspected upper GI cancers was too small to consider breakdowns by age group. With figures TC2a and TC2c showing a large amount of variation, there were no statistically significant changes for any age groups in the number of oesophageal or upper GI cancer diagnoses resulting from an urgent GP referral for suspected upper GI cancers, from February to April 2013 to February to April 2014 (Table TC2), however, for those aged 60 to 69, the percentage changes in the number of such diagnoses were quite large, although the numbers were small, with an 85% increase for oesophageal cancer and a 59% increase for upper GI cancers. Table TC2: Number of oesophageal and upper GI cancer diagnoses resulting from urgent GP referrals for suspected upper GI cancers, with percentage change in number of cancers, from February to April 2013 and February to April 2014, regional pilot area, by age
Cancer type Age group
February to April TWW cancers % Change in
number P-value 2013 2014
Oesophageal cancer
<60 9 14 55.6 0.295 60-69 13 24 84.6 0.068 70-79 19 18 -5.3 0.869 80+ 21 15 -28.6 0.316
Upper GI cancer
<60 15 17 13.3 0.724 60-69 27 53 59.3 0.055 70-79 35 39 11.4 0.642 80+ 37 27 -27.0 0.210
28
Be Clear on Cancer: Oesophago-gastric cancer awareness regional pilot campaign Interim evaluation results
Figure TC2a: Quarterly number of oesophageal cancer diagnoses resulting from an urgent GP referral for suspected upper GI cancers from February to April 2012 to February to April 2014, regional pilot area, by age
Figure TC2c: Quarterly number of upper GI cancer diagnoses resulting from an urgent GP referral for suspected upper GI cancers from February to April 2012 to February to April 2014, regional pilot area, by age
29
Be Clear on Cancer: Oesophago-gastric cancer awareness regional pilot campaign Interim evaluation results
Sex Results
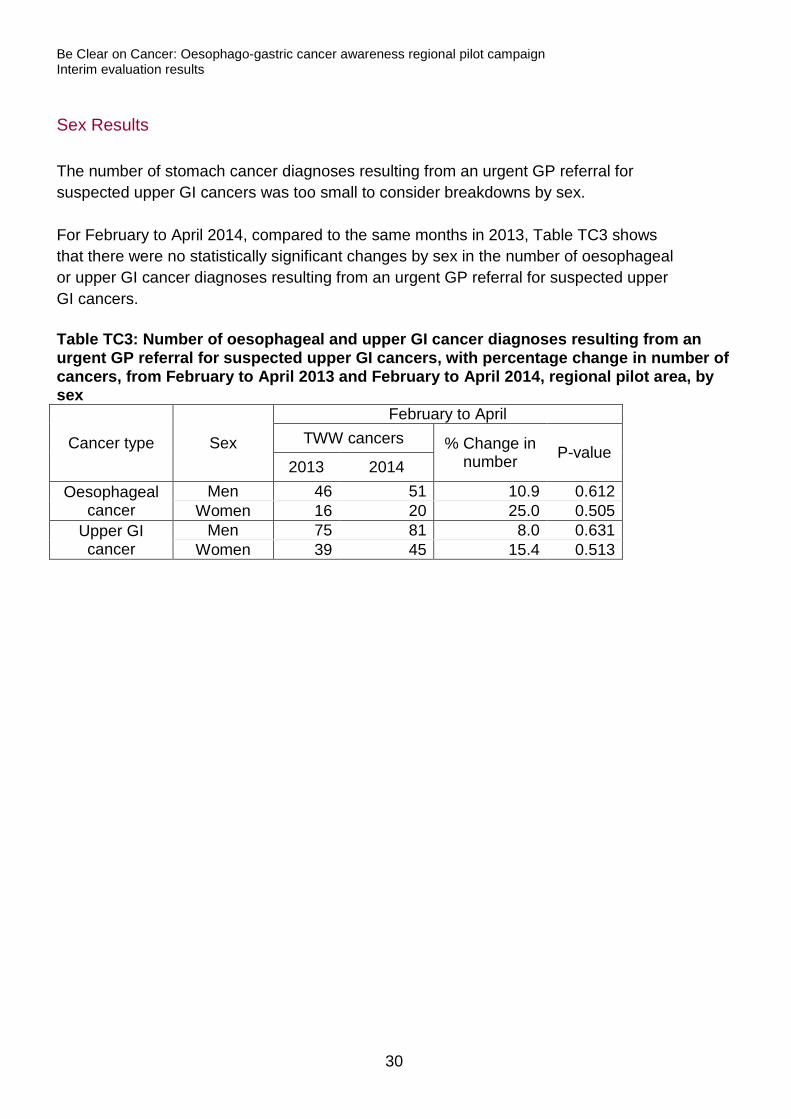
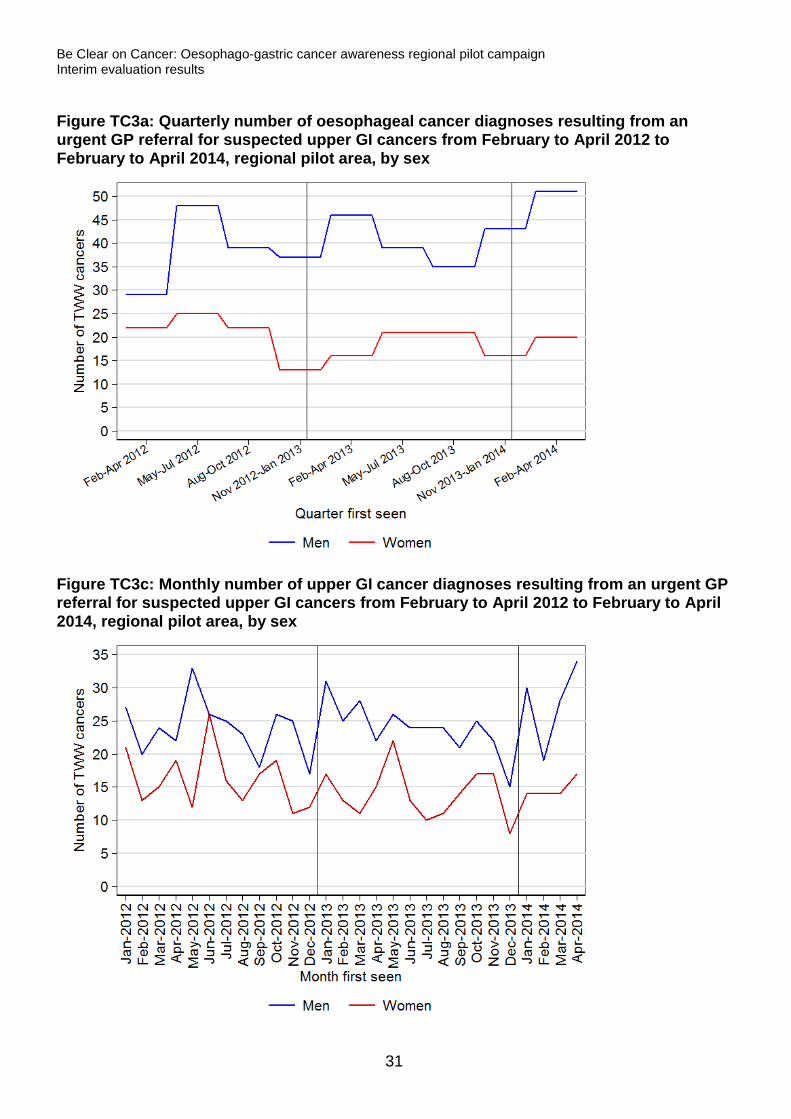
The number of stomach cancer diagnoses resulting from an urgent GP referral for suspected upper GI cancers was too small to consider breakdowns by sex. For February to April 2014, compared to the same months in 2013, Table TC3 shows that there were no statistically significant changes by sex in the number of oesophageal or upper GI cancer diagnoses resulting from an urgent GP referral for suspected upper GI cancers. Table TC3: Number of oesophageal and upper GI cancer diagnoses resulting from an urgent GP referral for suspected upper GI cancers, with percentage change in number of cancers, from February to April 2013 and February to April 2014, regional pilot area, by sex
Cancer type Sex
February to April TWW cancers % Change in
number P-value 2013 2014
Oesophageal cancer
Men 46 51 10.9 0.612 Women 16 20 25.0 0.505
Upper GI cancer
Men 75 81 8.0 0.631 Women 39 45 15.4 0.513
30
Be Clear on Cancer: Oesophago-gastric cancer awareness regional pilot campaign Interim evaluation results
Figure TC3a: Quarterly number of oesophageal cancer diagnoses resulting from an urgent GP referral for suspected upper GI cancers from February to April 2012 to February to April 2014, regional pilot area, by sex
Figure TC3c: Monthly number of upper GI cancer diagnoses resulting from an urgent GP referral for suspected upper GI cancers from February to April 2012 to February to April 2014, regional pilot area, by sex
31
Be Clear on Cancer: Oesophago-gastric cancer awareness regional pilot campaign Interim evaluation results
Conversion rate
Total results
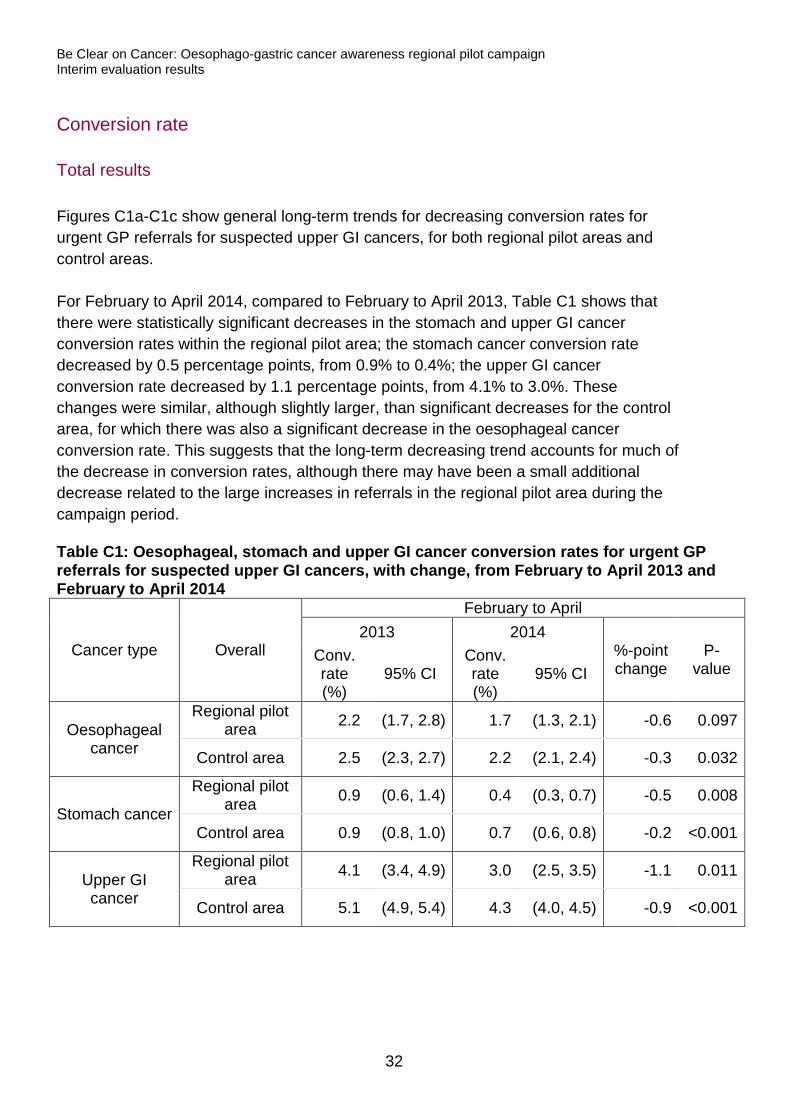
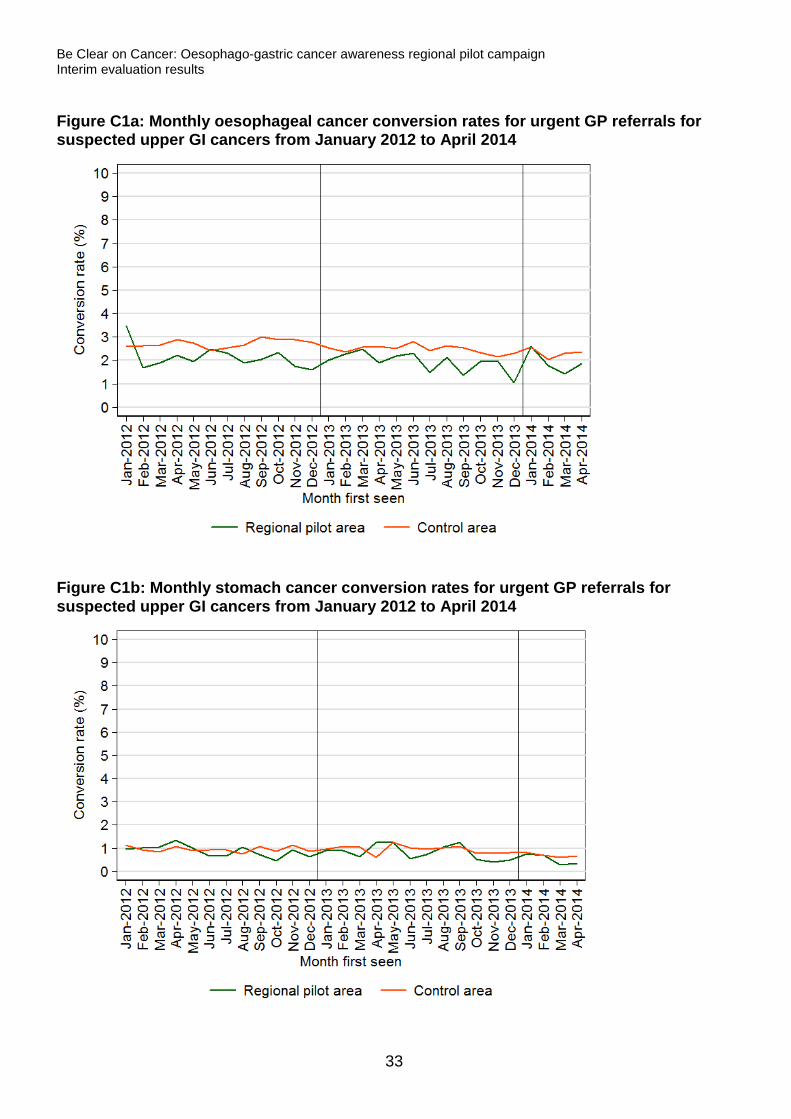
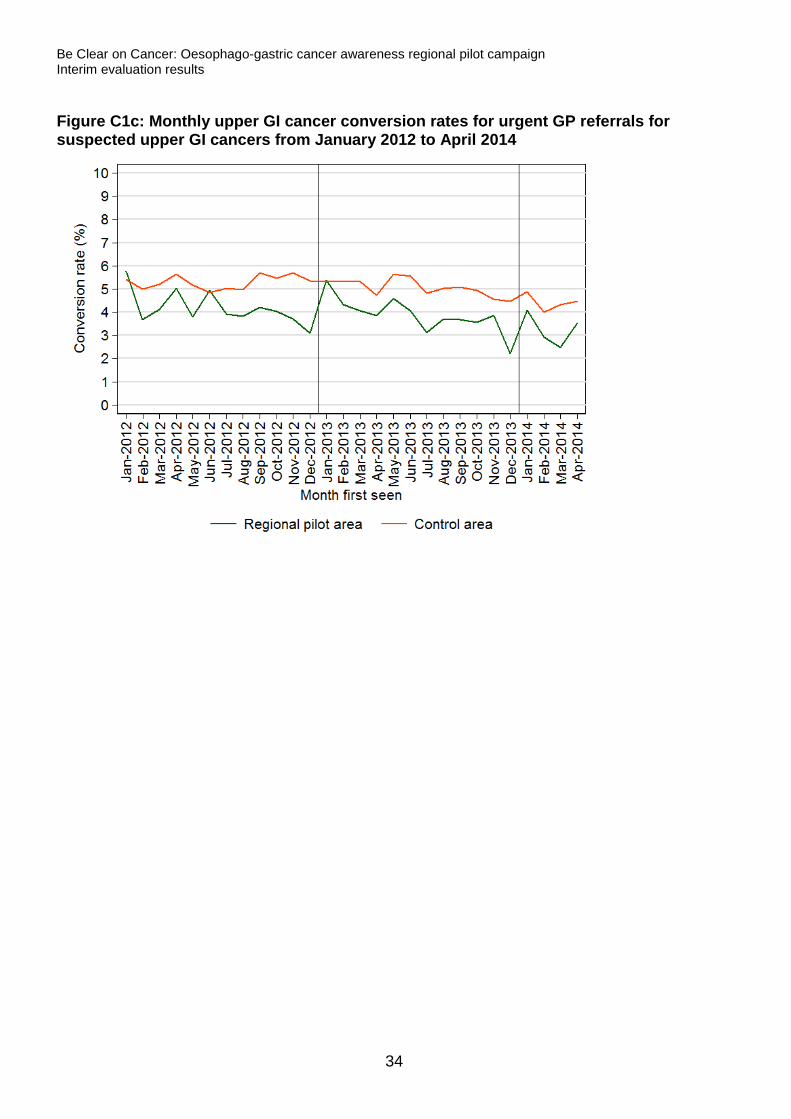
Figures C1a-C1c show general long-term trends for decreasing conversion rates for urgent GP referrals for suspected upper GI cancers, for both regional pilot areas and control areas. For February to April 2014, compared to February to April 2013, Table C1 shows that there were statistically significant decreases in the stomach and upper GI cancer conversion rates within the regional pilot area; the stomach cancer conversion rate decreased by 0.5 percentage points, from 0.9% to 0.4%; the upper GI cancer conversion rate decreased by 1.1 percentage points, from 4.1% to 3.0%. These changes were similar, although slightly larger, than significant decreases for the control area, for which there was also a significant decrease in the oesophageal cancer conversion rate. This suggests that the long-term decreasing trend accounts for much of the decrease in conversion rates, although there may have been a small additional decrease related to the large increases in referrals in the regional pilot area during the campaign period. Table C1: Oesophageal, stomach and upper GI cancer conversion rates for urgent GP referrals for suspected upper GI cancers, with change, from February to April 2013 and February to April 2014
Cancer type Overall
February to April 2013 2014
%-point change
P-value
Conv. rate (%)
95% CI Conv. rate (%)
95% CI
Oesophageal cancer
Regional pilot area 2.2 (1.7, 2.8) 1.7 (1.3, 2.1) -0.6 0.097
Control area 2.5 (2.3, 2.7) 2.2 (2.1, 2.4) -0.3 0.032
Stomach cancer
Regional pilot area 0.9 (0.6, 1.4) 0.4 (0.3, 0.7) -0.5 0.008
Control area 0.9 (0.8, 1.0) 0.7 (0.6, 0.8) -0.2 <0.001
Upper GI cancer
Regional pilot area 4.1 (3.4, 4.9) 3.0 (2.5, 3.5) -1.1 0.011
Control area 5.1 (4.9, 5.4) 4.3 (4.0, 4.5) -0.9 <0.001
32
Be Clear on Cancer: Oesophago-gastric cancer awareness regional pilot campaign Interim evaluation results
Figure C1a: Monthly oesophageal cancer conversion rates for urgent GP referrals for suspected upper GI cancers from January 2012 to April 2014
Figure C1b: Monthly stomach cancer conversion rates for urgent GP referrals for suspected upper GI cancers from January 2012 to April 2014
33
Be Clear on Cancer: Oesophago-gastric cancer awareness regional pilot campaign Interim evaluation results
Figure C1c: Monthly upper GI cancer conversion rates for urgent GP referrals for suspected upper GI cancers from January 2012 to April 2014
34
Be Clear on Cancer: Oesophago-gastric cancer awareness regional pilot campaign Interim evaluation results
Age results
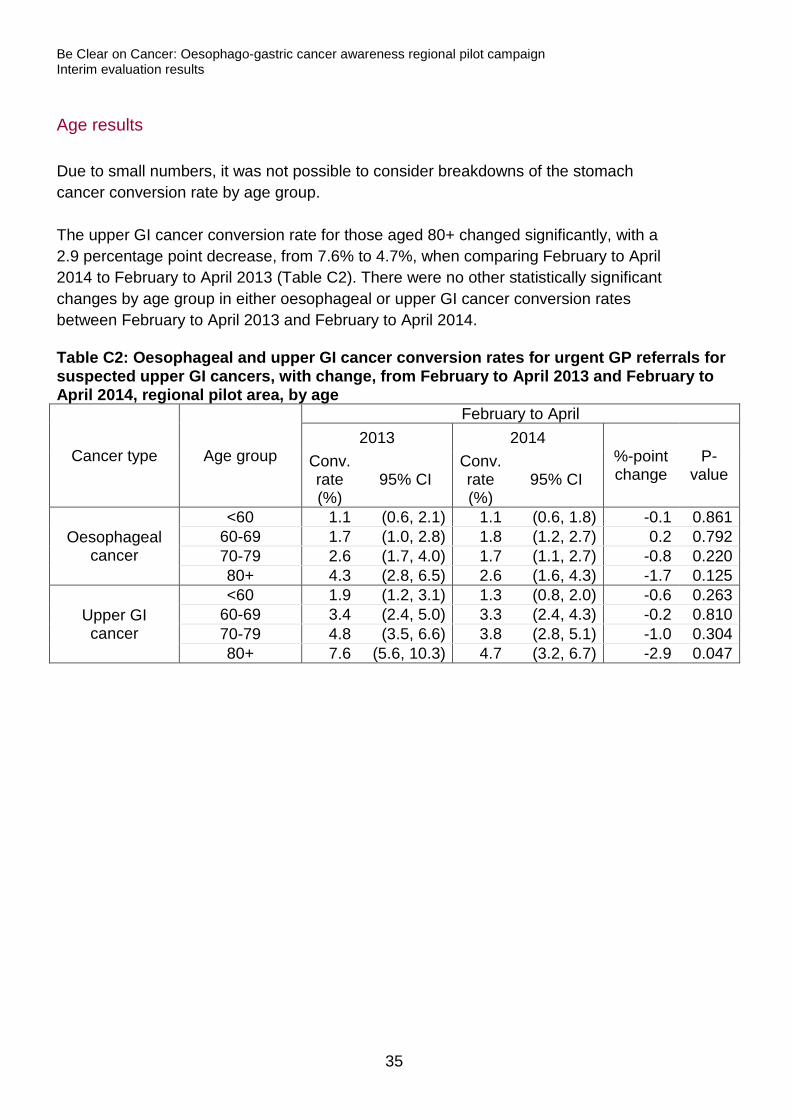
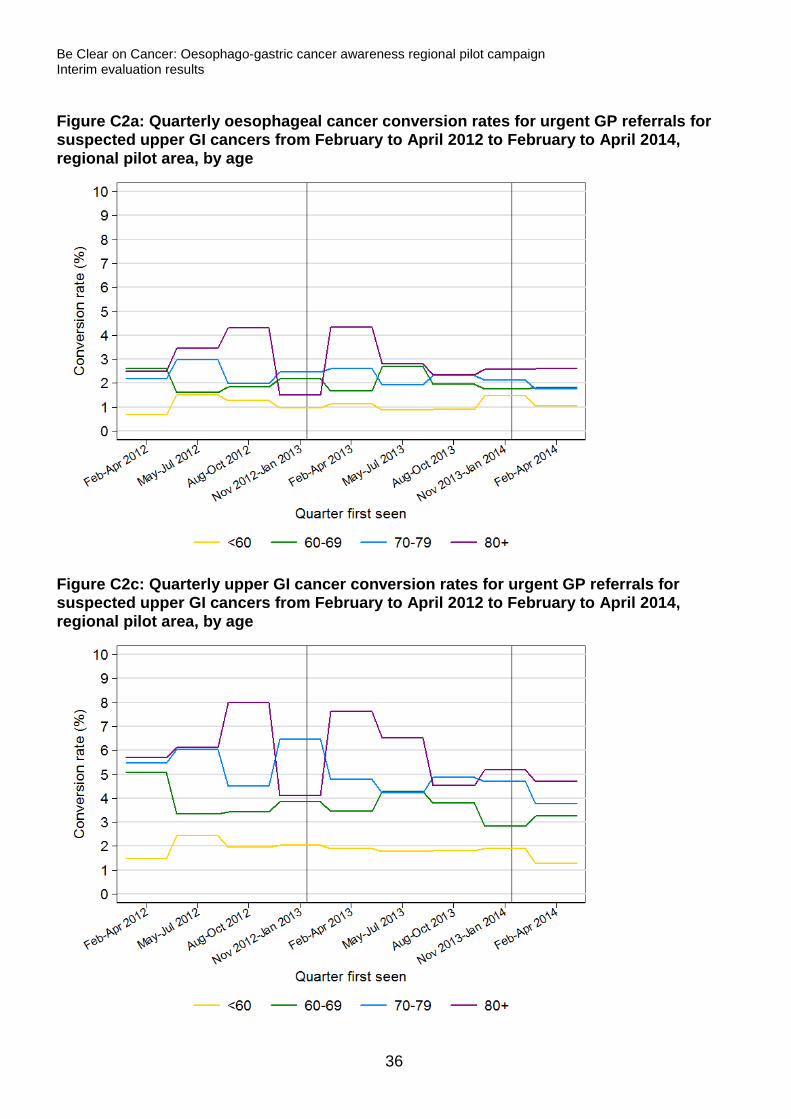
Due to small numbers, it was not possible to consider breakdowns of the stomach cancer conversion rate by age group. The upper GI cancer conversion rate for those aged 80+ changed significantly, with a 2.9 percentage point decrease, from 7.6% to 4.7%, when comparing February to April 2014 to February to April 2013 (Table C2). There were no other statistically significant changes by age group in either oesophageal or upper GI cancer conversion rates between February to April 2013 and February to April 2014. Table C2: Oesophageal and upper GI cancer conversion rates for urgent GP referrals for suspected upper GI cancers, with change, from February to April 2013 and February to April 2014, regional pilot area, by age
Cancer type Age group
February to April 2013 2014
%-point change
P-value
Conv. rate (%)
95% CI Conv. rate (%)
95% CI
Oesophageal cancer
<60 1.1 (0.6, 2.1) 1.1 (0.6, 1.8) -0.1 0.861 60-69 1.7 (1.0, 2.8) 1.8 (1.2, 2.7) 0.2 0.792 70-79 2.6 (1.7, 4.0) 1.7 (1.1, 2.7) -0.8 0.220 80+ 4.3 (2.8, 6.5) 2.6 (1.6, 4.3) -1.7 0.125
Upper GI cancer
<60 1.9 (1.2, 3.1) 1.3 (0.8, 2.0) -0.6 0.263 60-69 3.4 (2.4, 5.0) 3.3 (2.4, 4.3) -0.2 0.810 70-79 4.8 (3.5, 6.6) 3.8 (2.8, 5.1) -1.0 0.304 80+ 7.6 (5.6, 10.3) 4.7 (3.2, 6.7) -2.9 0.047
35
Be Clear on Cancer: Oesophago-gastric cancer awareness regional pilot campaign Interim evaluation results
Figure C2a: Quarterly oesophageal cancer conversion rates for urgent GP referrals for suspected upper GI cancers from February to April 2012 to February to April 2014, regional pilot area, by age
Figure C2c: Quarterly upper GI cancer conversion rates for urgent GP referrals for suspected upper GI cancers from February to April 2012 to February to April 2014, regional pilot area, by age
36
Be Clear on Cancer: Oesophago-gastric cancer awareness regional pilot campaign Interim evaluation results
Sex Results
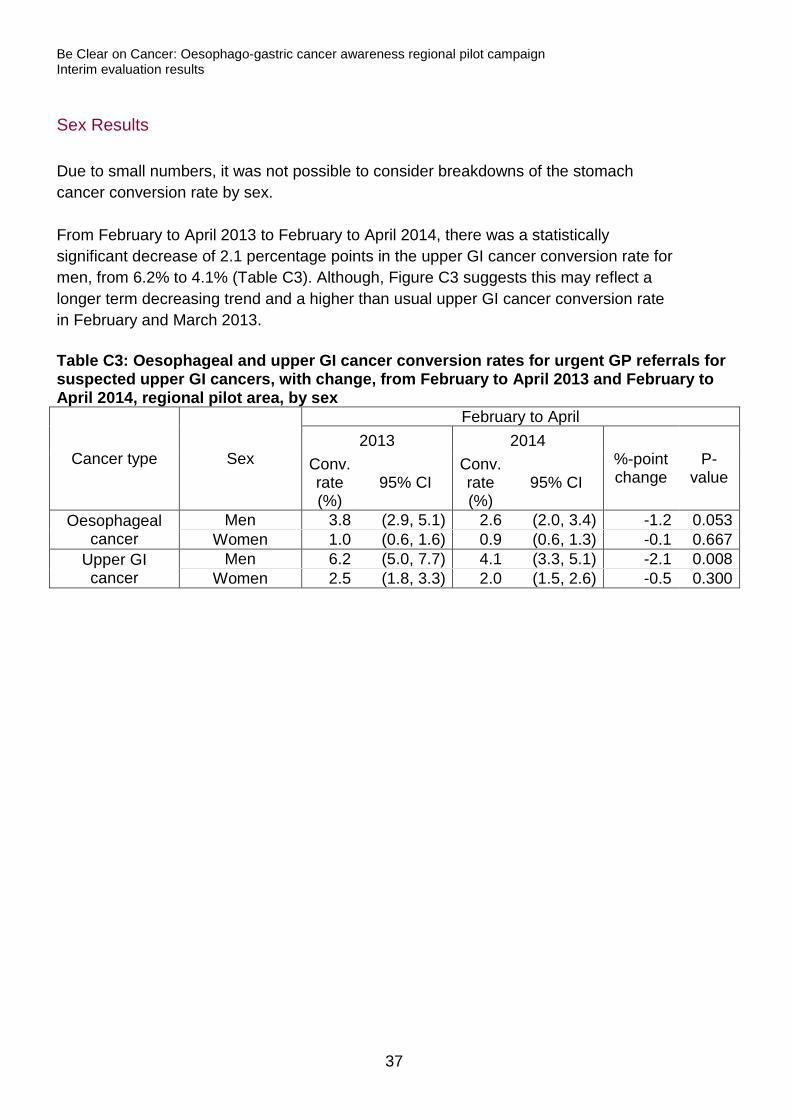
Due to small numbers, it was not possible to consider breakdowns of the stomach cancer conversion rate by sex. From February to April 2013 to February to April 2014, there was a statistically significant decrease of 2.1 percentage points in the upper GI cancer conversion rate for men, from 6.2% to 4.1% (Table C3). Although, Figure C3 suggests this may reflect a longer term decreasing trend and a higher than usual upper GI cancer conversion rate in February and March 2013. Table C3: Oesophageal and upper GI cancer conversion rates for urgent GP referrals for suspected upper GI cancers, with change, from February to April 2013 and February to April 2014, regional pilot area, by sex
Cancer type Sex
February to April 2013 2014
%-point change
P-value
Conv. rate (%)
95% CI Conv. rate (%)
95% CI
Oesophageal cancer
Men 3.8 (2.9, 5.1) 2.6 (2.0, 3.4) -1.2 0.053 Women 1.0 (0.6, 1.6) 0.9 (0.6, 1.3) -0.1 0.667
Upper GI cancer
Men 6.2 (5.0, 7.7) 4.1 (3.3, 5.1) -2.1 0.008 Women 2.5 (1.8, 3.3) 2.0 (1.5, 2.6) -0.5 0.300
37
Be Clear on Cancer: Oesophago-gastric cancer awareness regional pilot campaign Interim evaluation results
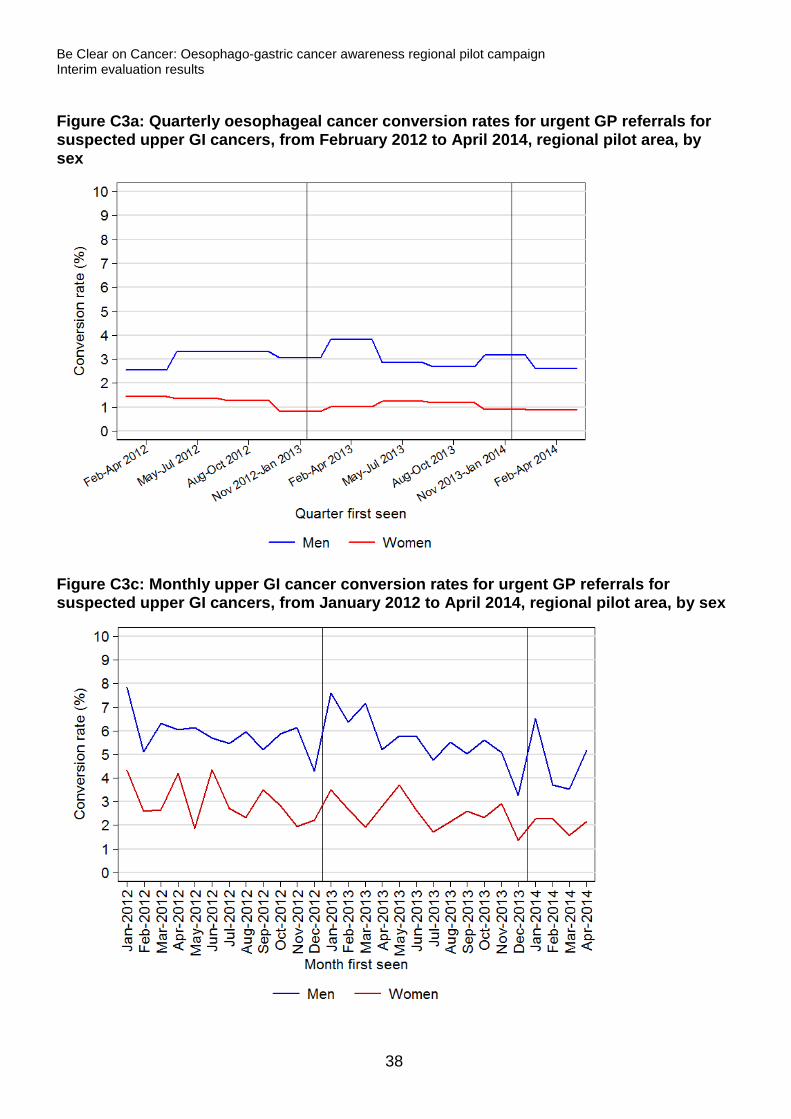
Figure C3a: Quarterly oesophageal cancer conversion rates for urgent GP referrals for suspected upper GI cancers, from February 2012 to April 2014, regional pilot area, by sex
Figure C3c: Monthly upper GI cancer conversion rates for urgent GP referrals for suspected upper GI cancers, from January 2012 to April 2014, regional pilot area, by sex
38
Be Clear on Cancer: Oesophago-gastric cancer awareness regional pilot campaign Interim evaluation results
Cancer diagnoses recorded in the Cancer Waiting Times database
Total results
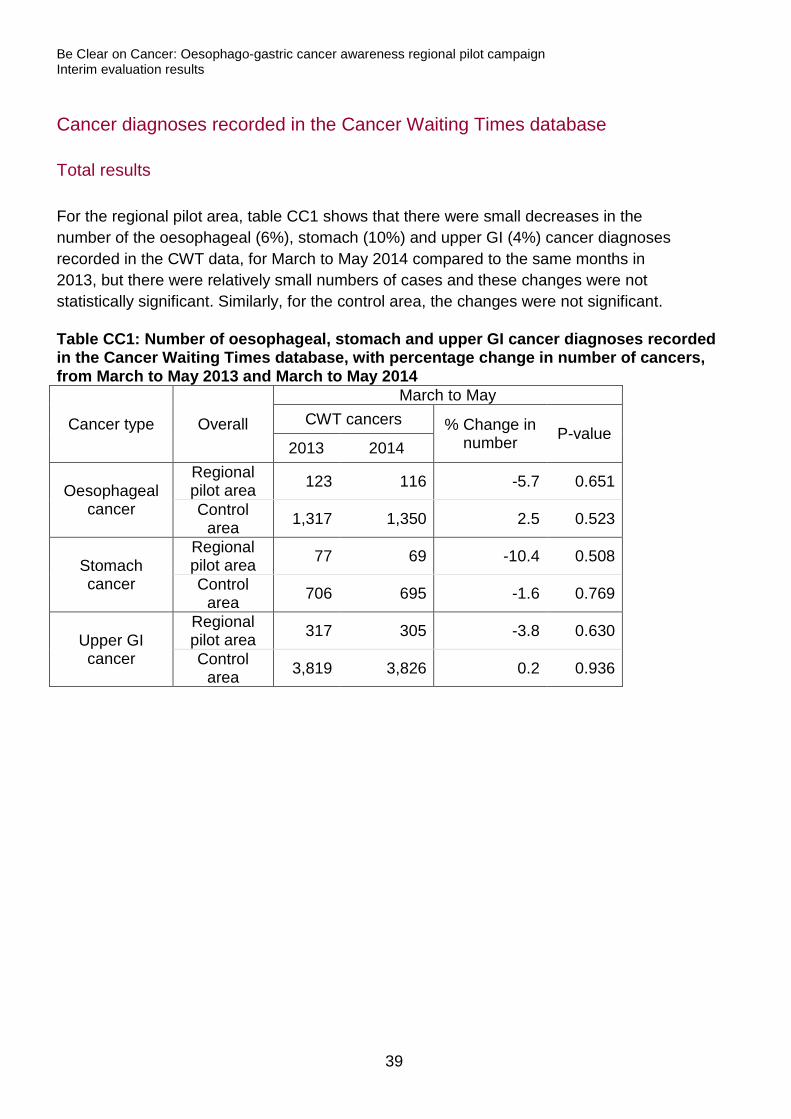
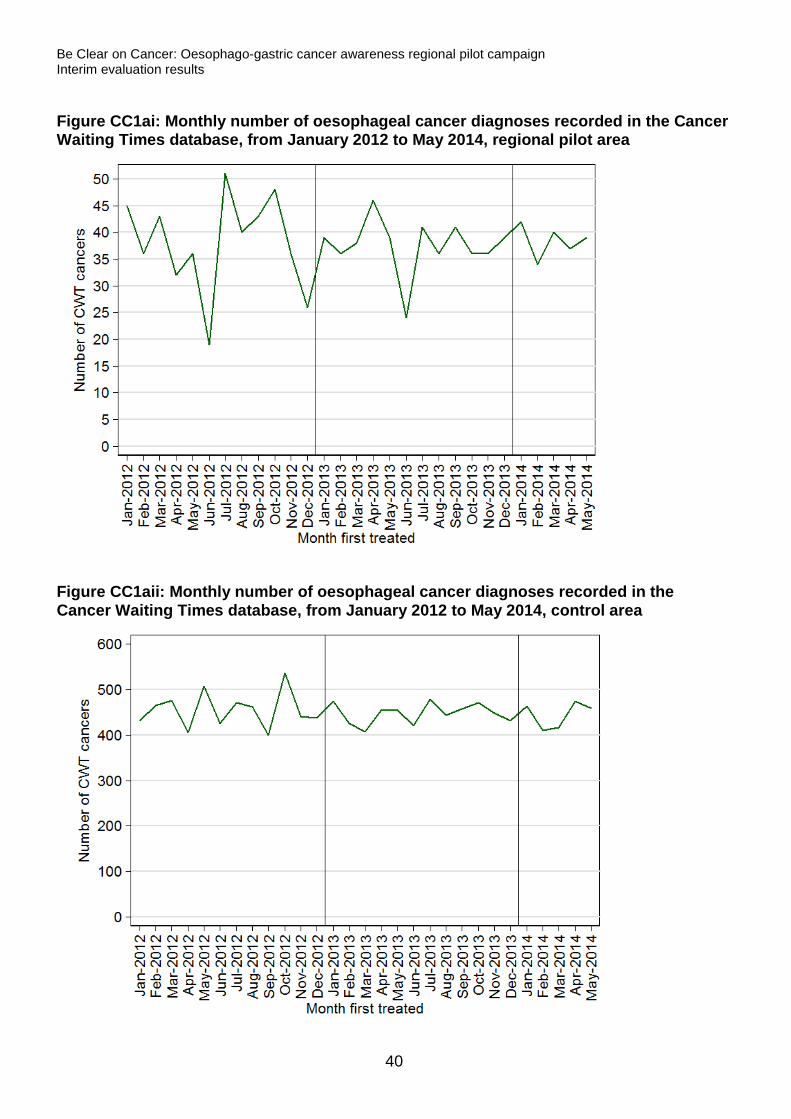
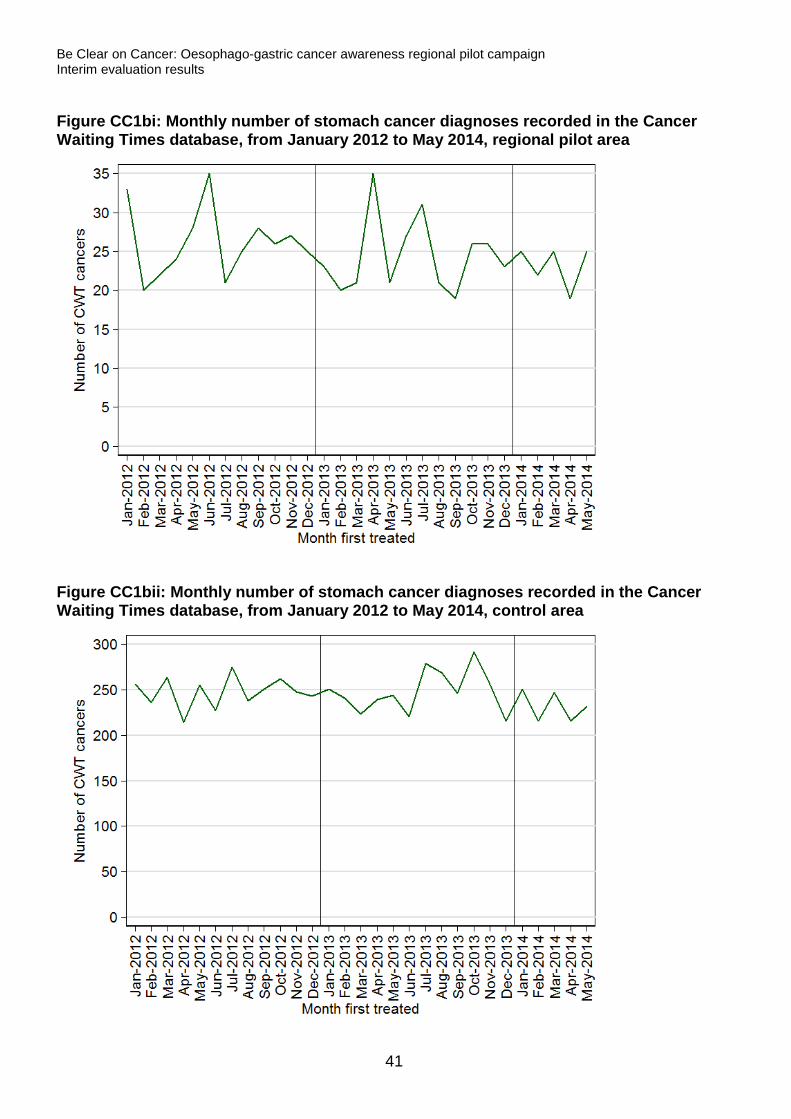
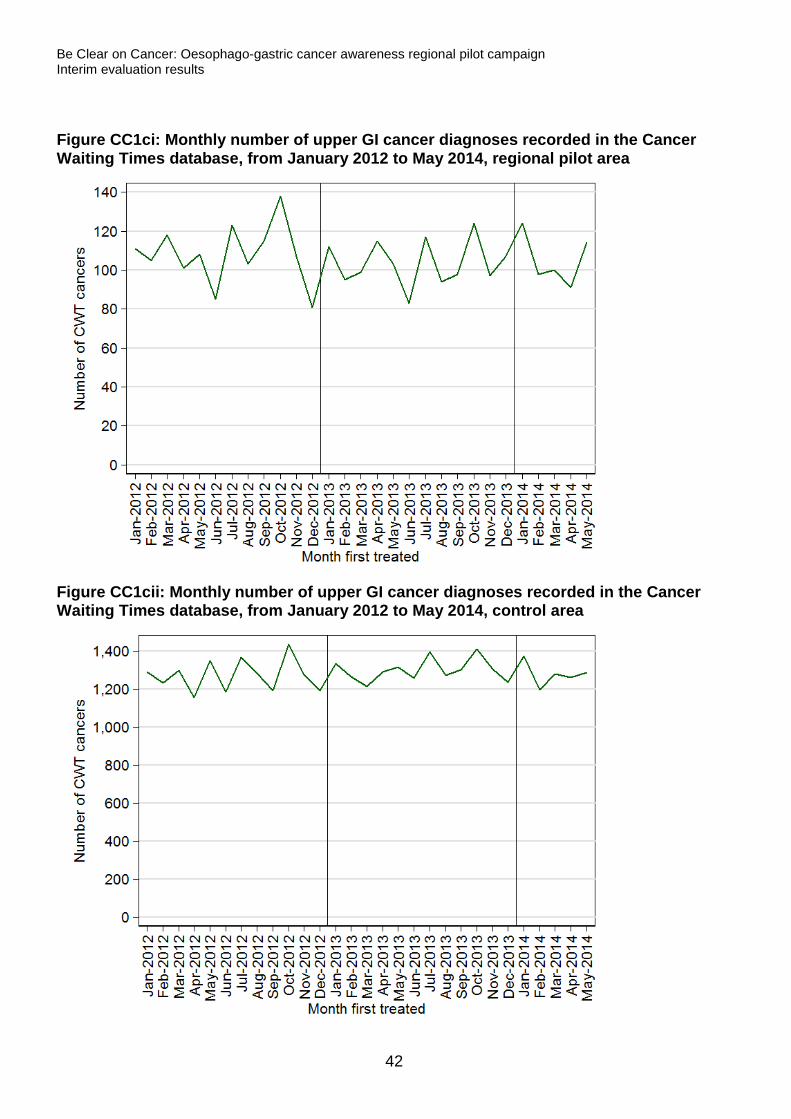
For the regional pilot area, table CC1 shows that there were small decreases in the number of the oesophageal (6%), stomach (10%) and upper GI (4%) cancer diagnoses recorded in the CWT data, for March to May 2014 compared to the same months in 2013, but there were relatively small numbers of cases and these changes were not statistically significant. Similarly, for the control area, the changes were not significant. Table CC1: Number of oesophageal, stomach and upper GI cancer diagnoses recorded in the Cancer Waiting Times database, with percentage change in number of cancers, from March to May 2013 and March to May 2014
Cancer type Overall
March to May CWT cancers % Change in
number P-value 2013 2014
Oesophageal cancer
Regional pilot area 123 116 -5.7 0.651
Control area 1,317 1,350 2.5 0.523
Stomach cancer
Regional pilot area 77 69 -10.4 0.508
Control area 706 695 -1.6 0.769
Upper GI cancer
Regional pilot area 317 305 -3.8 0.630
Control area 3,819 3,826 0.2 0.936
39
Be Clear on Cancer: Oesophago-gastric cancer awareness regional pilot campaign Interim evaluation results
Figure CC1ai: Monthly number of oesophageal cancer diagnoses recorded in the Cancer Waiting Times database, from January 2012 to May 2014, regional pilot area
Figure CC1aii: Monthly number of oesophageal cancer diagnoses recorded in the Cancer Waiting Times database, from January 2012 to May 2014, control area
40
Be Clear on Cancer: Oesophago-gastric cancer awareness regional pilot campaign Interim evaluation results
Figure CC1bi: Monthly number of stomach cancer diagnoses recorded in the Cancer Waiting Times database, from January 2012 to May 2014, regional pilot area
Figure CC1bii: Monthly number of stomach cancer diagnoses recorded in the Cancer Waiting Times database, from January 2012 to May 2014, control area
41
Be Clear on Cancer: Oesophago-gastric cancer awareness regional pilot campaign Interim evaluation results
Figure CC1ci: Monthly number of upper GI cancer diagnoses recorded in the Cancer Waiting Times database, from January 2012 to May 2014, regional pilot area
Figure CC1cii: Monthly number of upper GI cancer diagnoses recorded in the Cancer Waiting Times database, from January 2012 to May 2014, control area
42
Be Clear on Cancer: Oesophago-gastric cancer awareness regional pilot campaign Interim evaluation results
Age results
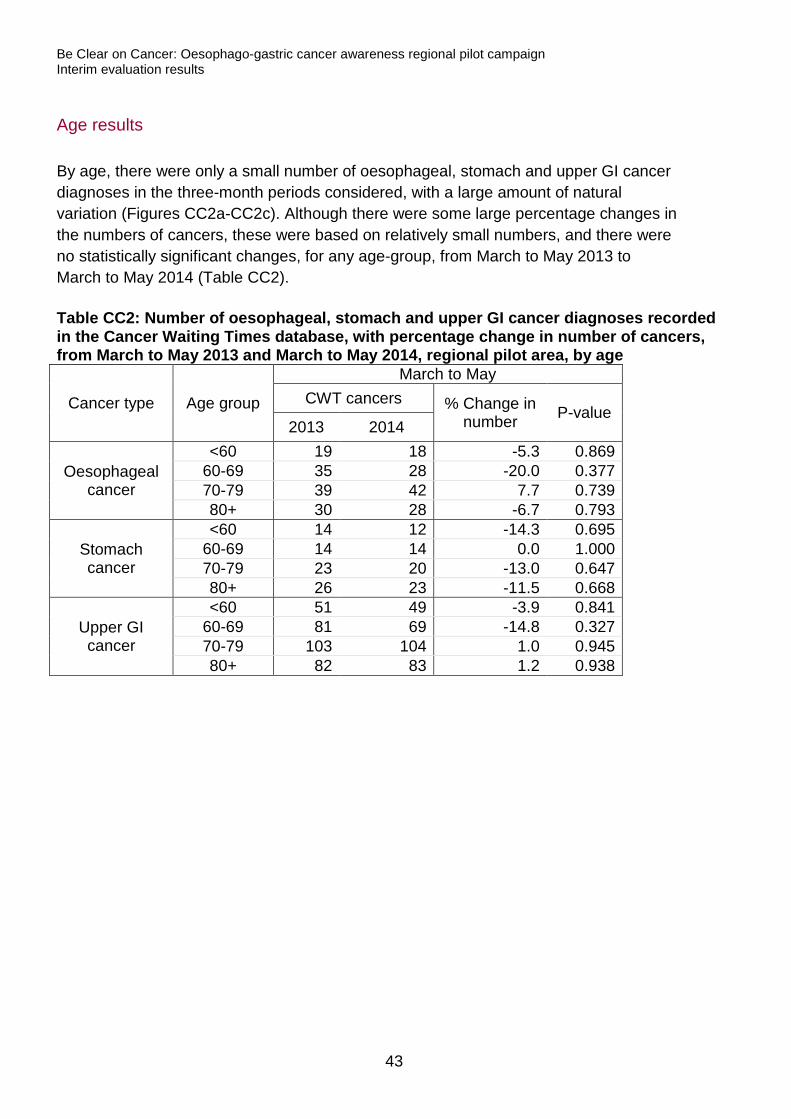
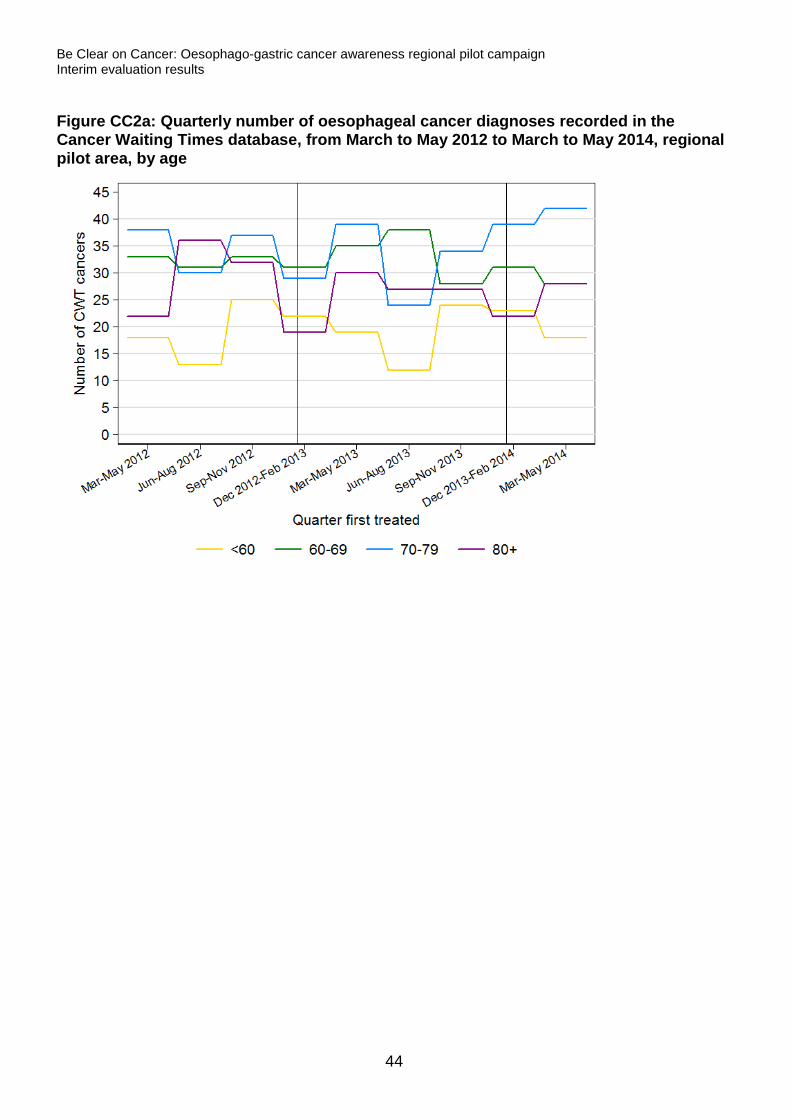
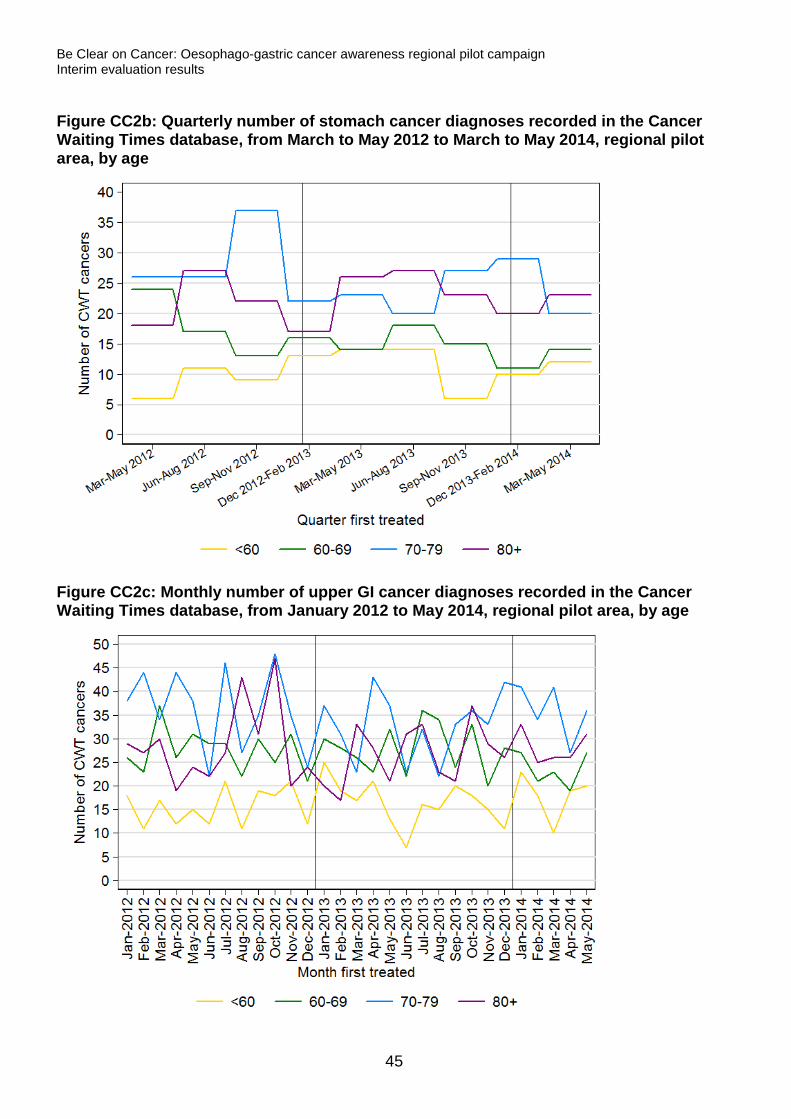
By age, there were only a small number of oesophageal, stomach and upper GI cancer diagnoses in the three-month periods considered, with a large amount of natural variation (Figures CC2a-CC2c). Although there were some large percentage changes in the numbers of cancers, these were based on relatively small numbers, and there were no statistically significant changes, for any age-group, from March to May 2013 to March to May 2014 (Table CC2). Table CC2: Number of oesophageal, stomach and upper GI cancer diagnoses recorded in the Cancer Waiting Times database, with percentage change in number of cancers, from March to May 2013 and March to May 2014, regional pilot area, by age
Cancer type Age group
March to May CWT cancers % Change in
number P-value 2013 2014
Oesophageal cancer
<60 19 18 -5.3 0.869 60-69 35 28 -20.0 0.377 70-79 39 42 7.7 0.739 80+ 30 28 -6.7 0.793
Stomach cancer
<60 14 12 -14.3 0.695 60-69 14 14 0.0 1.000 70-79 23 20 -13.0 0.647 80+ 26 23 -11.5 0.668
Upper GI cancer
<60 51 49 -3.9 0.841 60-69 81 69 -14.8 0.327 70-79 103 104 1.0 0.945 80+ 82 83 1.2 0.938
43
Be Clear on Cancer: Oesophago-gastric cancer awareness regional pilot campaign Interim evaluation results
Figure CC2a: Quarterly number of oesophageal cancer diagnoses recorded in the Cancer Waiting Times database, from March to May 2012 to March to May 2014, regional pilot area, by age
44
Be Clear on Cancer: Oesophago-gastric cancer awareness regional pilot campaign Interim evaluation results
Figure CC2b: Quarterly number of stomach cancer diagnoses recorded in the Cancer Waiting Times database, from March to May 2012 to March to May 2014, regional pilot area, by age
Figure CC2c: Monthly number of upper GI cancer diagnoses recorded in the Cancer Waiting Times database, from January 2012 to May 2014, regional pilot area, by age
45
Be Clear on Cancer: Oesophago-gastric cancer awareness regional pilot campaign Interim evaluation results
Sex Results
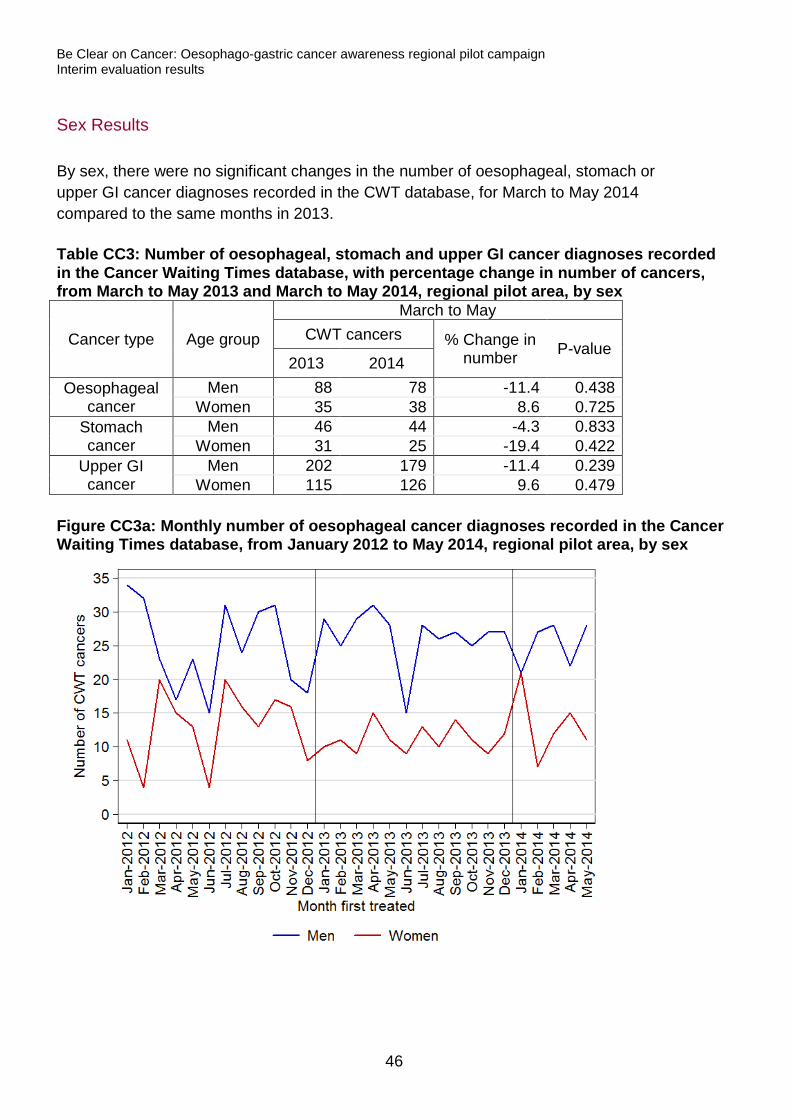
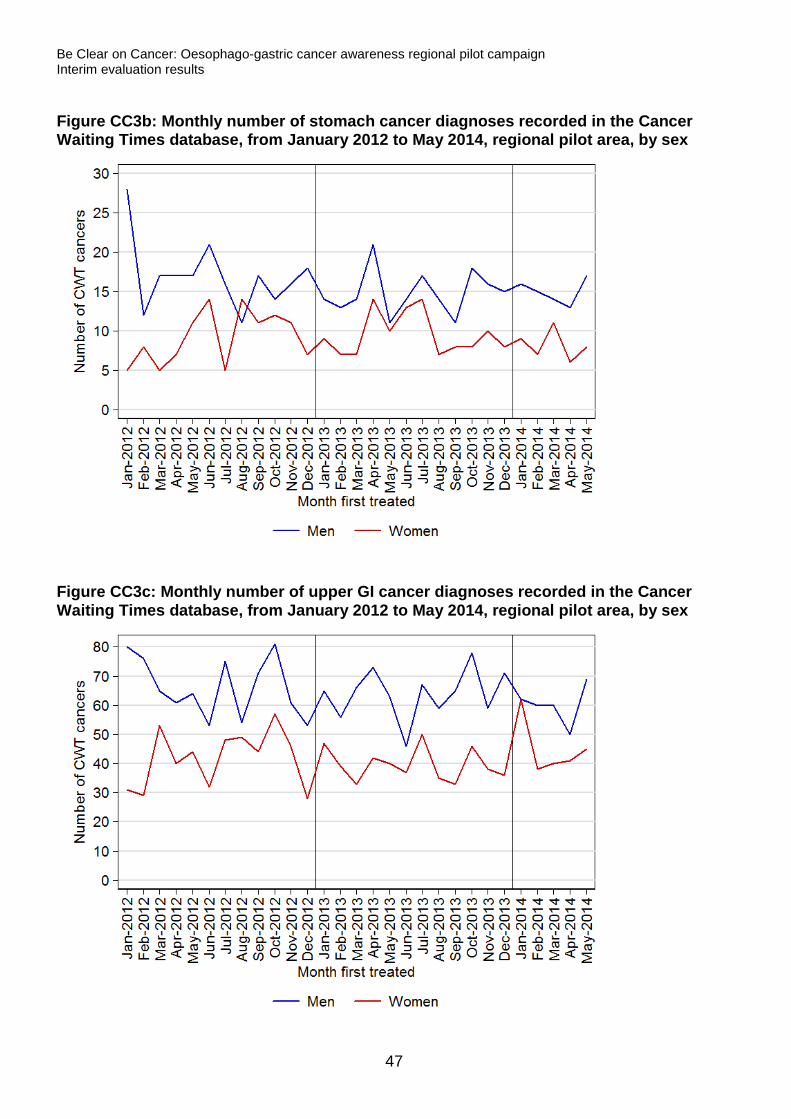
By sex, there were no significant changes in the number of oesophageal, stomach or upper GI cancer diagnoses recorded in the CWT database, for March to May 2014 compared to the same months in 2013. Table CC3: Number of oesophageal, stomach and upper GI cancer diagnoses recorded in the Cancer Waiting Times database, with percentage change in number of cancers, from March to May 2013 and March to May 2014, regional pilot area, by sex
Cancer type Age group
March to May CWT cancers % Change in
number P-value 2013 2014
Oesophageal cancer
Men 88 78 -11.4 0.438 Women 35 38 8.6 0.725
Stomach cancer
Men 46 44 -4.3 0.833 Women 31 25 -19.4 0.422
Upper GI cancer
Men 202 179 -11.4 0.239 Women 115 126 9.6 0.479
Figure CC3a: Monthly number of oesophageal cancer diagnoses recorded in the Cancer Waiting Times database, from January 2012 to May 2014, regional pilot area, by sex
46
Be Clear on Cancer: Oesophago-gastric cancer awareness regional pilot campaign Interim evaluation results
Figure CC3b: Monthly number of stomach cancer diagnoses recorded in the Cancer Waiting Times database, from January 2012 to May 2014, regional pilot area, by sex
Figure CC3c: Monthly number of upper GI cancer diagnoses recorded in the Cancer Waiting Times database, from January 2012 to May 2014, regional pilot area, by sex
47
Be Clear on Cancer: Oesophago-gastric cancer awareness regional pilot campaign Interim evaluation results
Detection rate
Total results
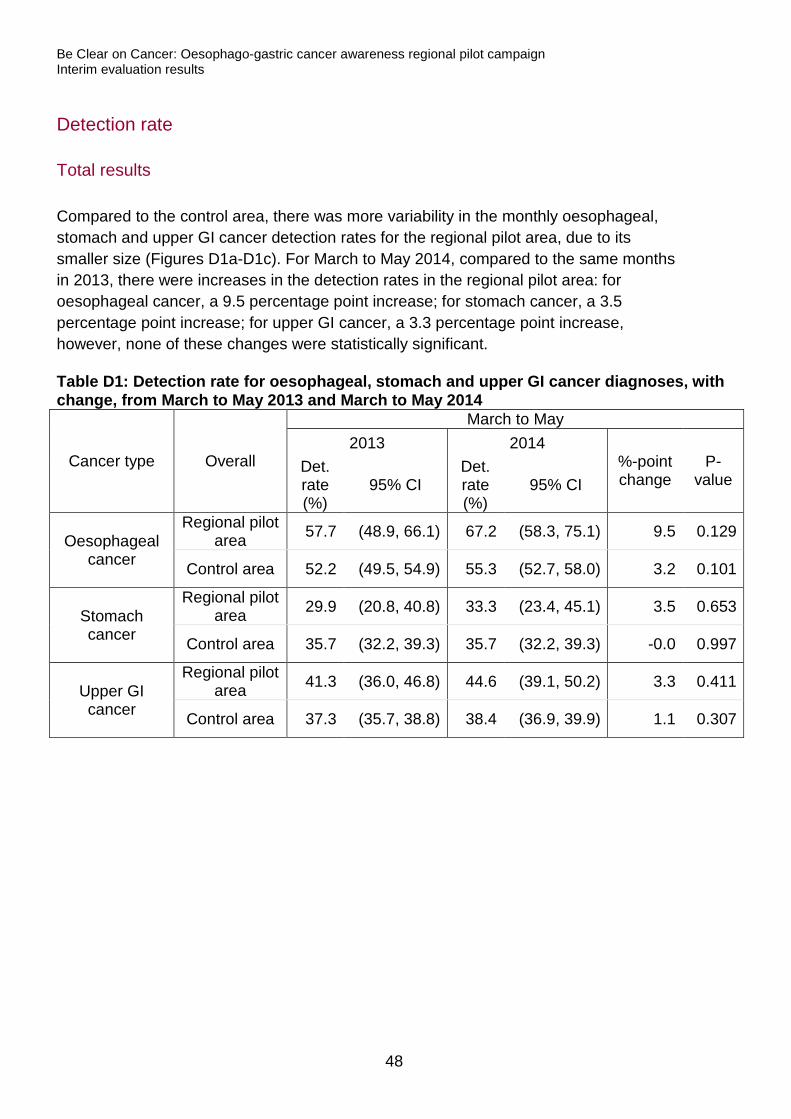
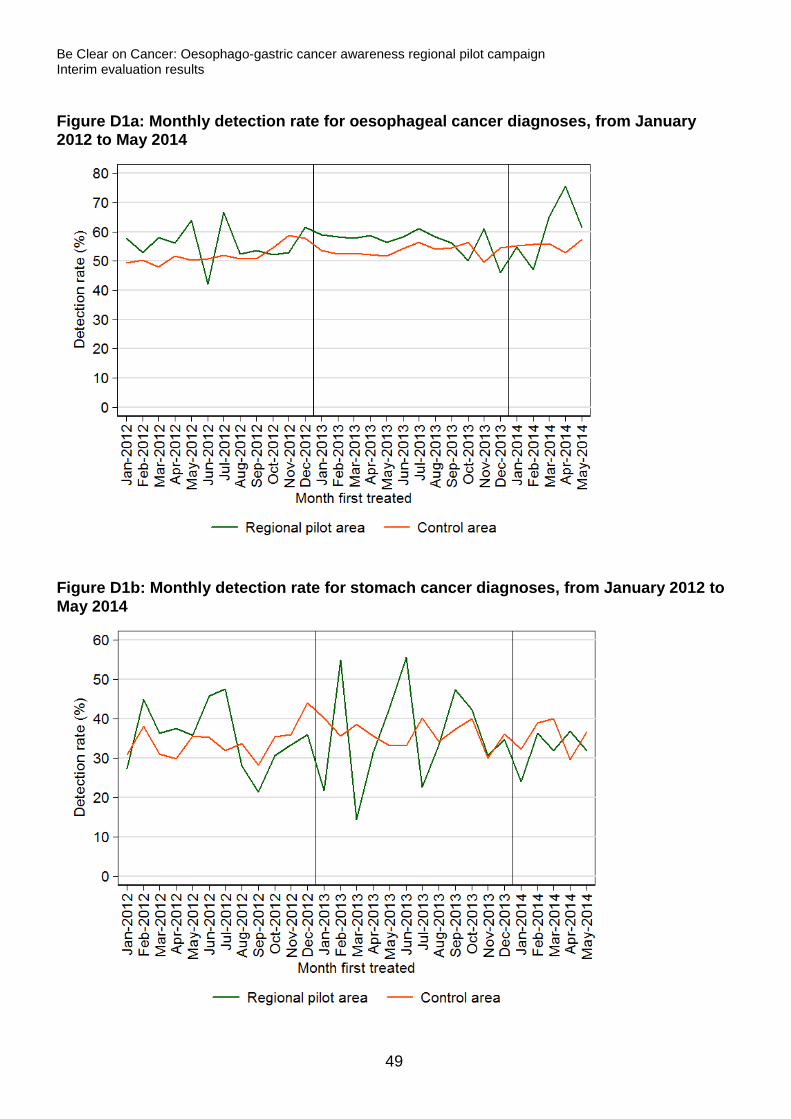
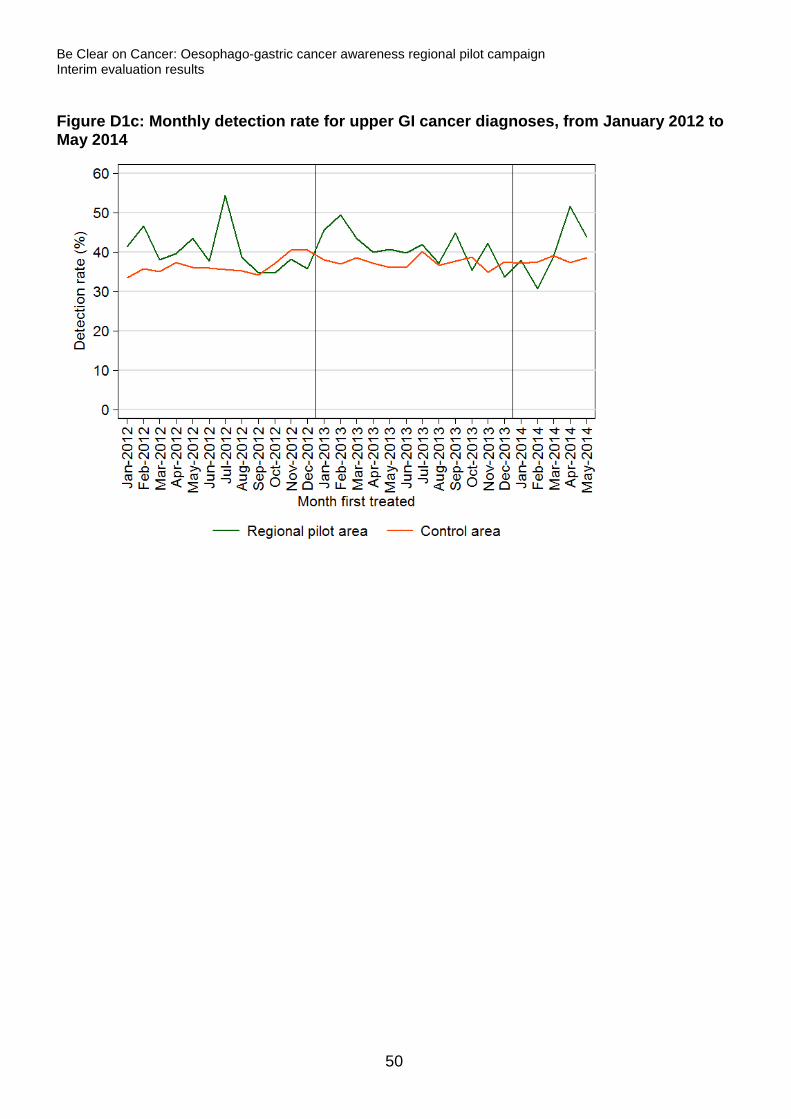
Compared to the control area, there was more variability in the monthly oesophageal, stomach and upper GI cancer detection rates for the regional pilot area, due to its smaller size (Figures D1a-D1c). For March to May 2014, compared to the same months in 2013, there were increases in the detection rates in the regional pilot area: for oesophageal cancer, a 9.5 percentage point increase; for stomach cancer, a 3.5 percentage point increase; for upper GI cancer, a 3.3 percentage point increase, however, none of these changes were statistically significant. Table D1: Detection rate for oesophageal, stomach and upper GI cancer diagnoses, with change, from March to May 2013 and March to May 2014
Cancer type Overall
March to May 2013 2014
%-point change
P-value
Det. rate (%)
95% CI Det. rate (%)
95% CI
Oesophageal cancer
Regional pilot area 57.7 (48.9, 66.1) 67.2 (58.3, 75.1) 9.5 0.129
Control area 52.2 (49.5, 54.9) 55.3 (52.7, 58.0) 3.2 0.101
Stomach cancer
Regional pilot area 29.9 (20.8, 40.8) 33.3 (23.4, 45.1) 3.5 0.653
Control area 35.7 (32.2, 39.3) 35.7 (32.2, 39.3) -0.0 0.997
Upper GI cancer
Regional pilot area 41.3 (36.0, 46.8) 44.6 (39.1, 50.2) 3.3 0.411
Control area 37.3 (35.7, 38.8) 38.4 (36.9, 39.9) 1.1 0.307
48
Be Clear on Cancer: Oesophago-gastric cancer awareness regional pilot campaign Interim evaluation results
Figure D1a: Monthly detection rate for oesophageal cancer diagnoses, from January 2012 to May 2014
Figure D1b: Monthly detection rate for stomach cancer diagnoses, from January 2012 to May 2014
49
Be Clear on Cancer: Oesophago-gastric cancer awareness regional pilot campaign Interim evaluation results
Figure D1c: Monthly detection rate for upper GI cancer diagnoses, from January 2012 to May 2014
50
Be Clear on Cancer: Oesophago-gastric cancer awareness regional pilot campaign Interim evaluation results
Age results
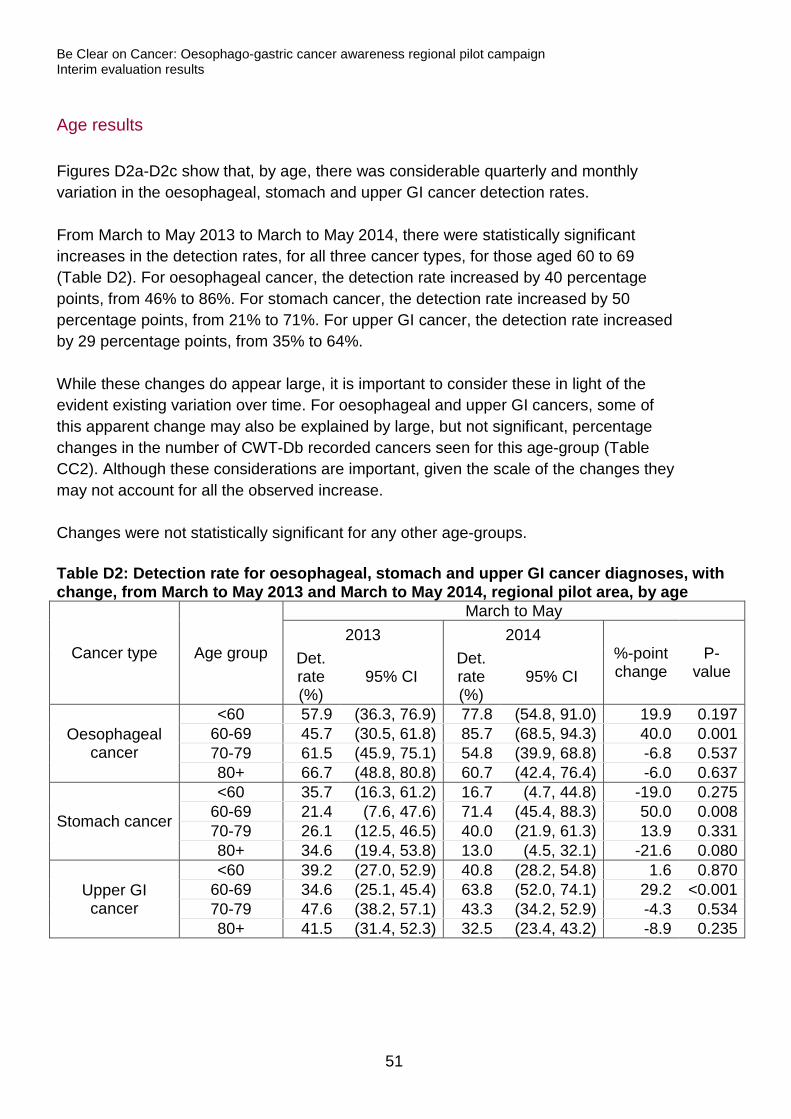
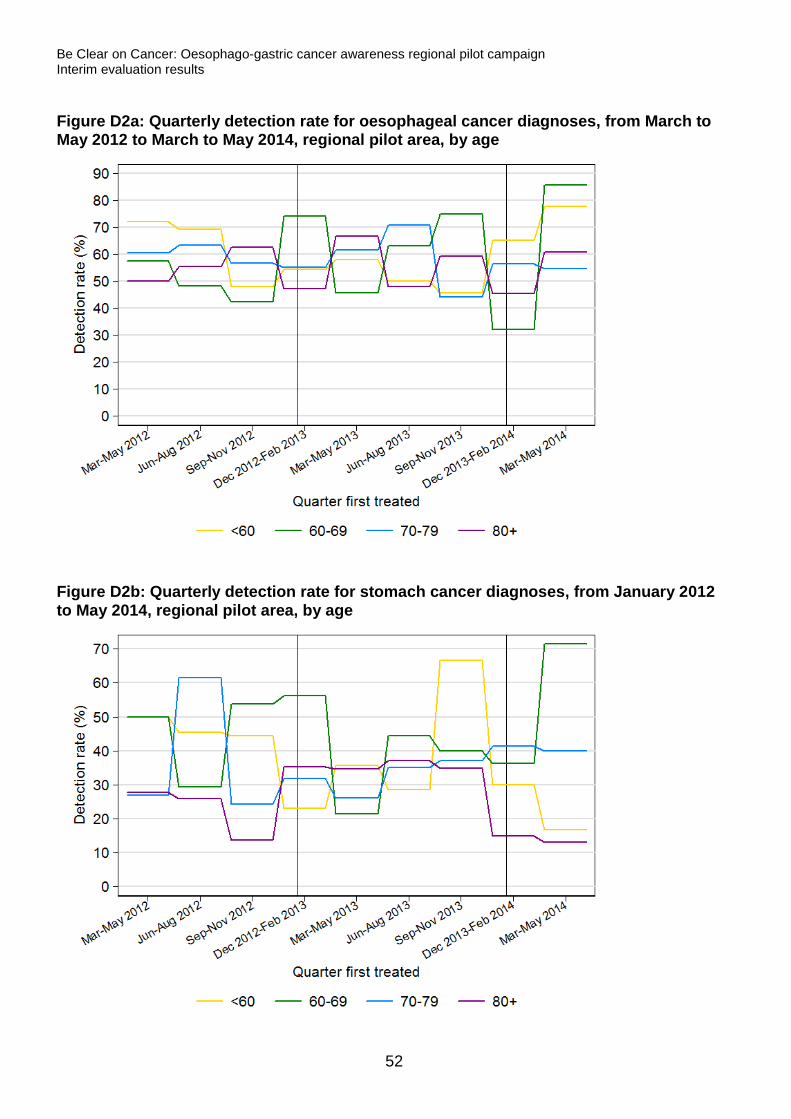
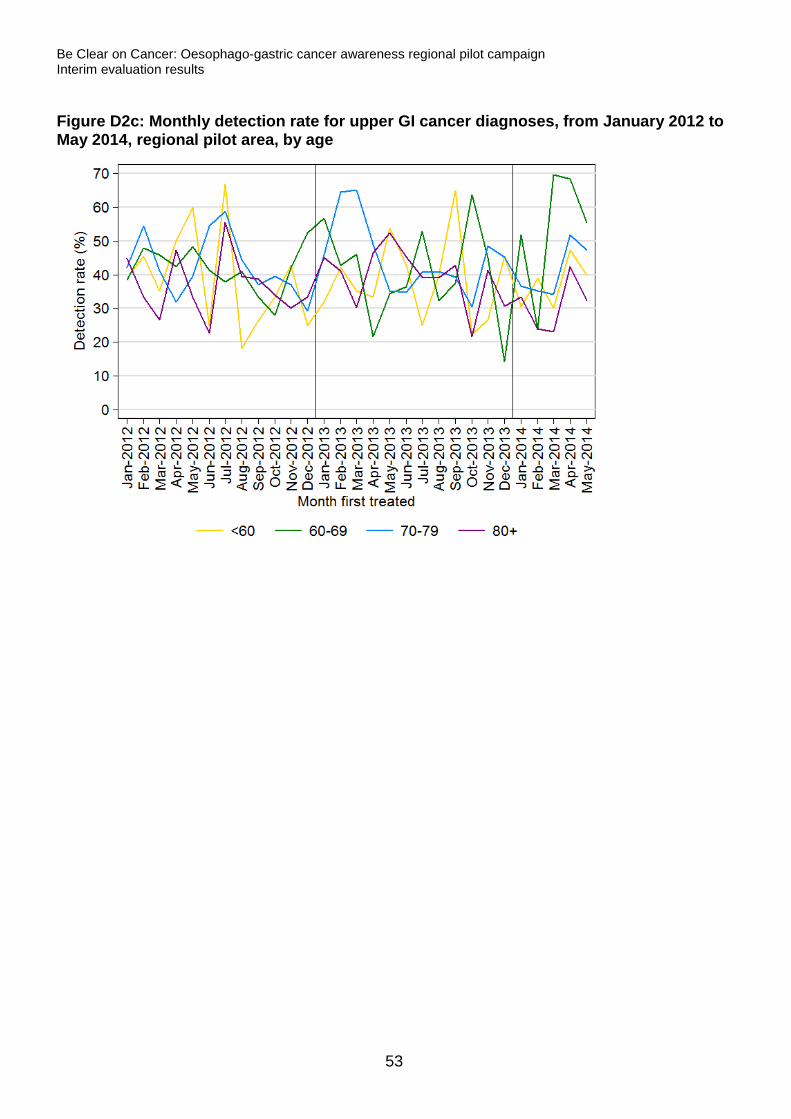
Figures D2a-D2c show that, by age, there was considerable quarterly and monthly variation in the oesophageal, stomach and upper GI cancer detection rates. From March to May 2013 to March to May 2014, there were statistically significant increases in the detection rates, for all three cancer types, for those aged 60 to 69 (Table D2). For oesophageal cancer, the detection rate increased by 40 percentage points, from 46% to 86%. For stomach cancer, the detection rate increased by 50 percentage points, from 21% to 71%. For upper GI cancer, the detection rate increased by 29 percentage points, from 35% to 64%. While these changes do appear large, it is important to consider these in light of the evident existing variation over time. For oesophageal and upper GI cancers, some of this apparent change may also be explained by large, but not significant, percentage changes in the number of CWT-Db recorded cancers seen for this age-group (Table CC2). Although these considerations are important, given the scale of the changes they may not account for all the observed increase. Changes were not statistically significant for any other age-groups. Table D2: Detection rate for oesophageal, stomach and upper GI cancer diagnoses, with change, from March to May 2013 and March to May 2014, regional pilot area, by age
Cancer type Age group
March to May 2013 2014
%-point change
P-value
Det. rate (%)
95% CI Det. rate (%)
95% CI
Oesophageal cancer
<60 57.9 (36.3, 76.9) 77.8 (54.8, 91.0) 19.9 0.197 60-69 45.7 (30.5, 61.8) 85.7 (68.5, 94.3) 40.0 0.001 70-79 61.5 (45.9, 75.1) 54.8 (39.9, 68.8) -6.8 0.537 80+ 66.7 (48.8, 80.8) 60.7 (42.4, 76.4) -6.0 0.637
Stomach cancer
<60 35.7 (16.3, 61.2) 16.7 (4.7, 44.8) -19.0 0.275 60-69 21.4 (7.6, 47.6) 71.4 (45.4, 88.3) 50.0 0.008 70-79 26.1 (12.5, 46.5) 40.0 (21.9, 61.3) 13.9 0.331 80+ 34.6 (19.4, 53.8) 13.0 (4.5, 32.1) -21.6 0.080
Upper GI cancer
<60 39.2 (27.0, 52.9) 40.8 (28.2, 54.8) 1.6 0.870 60-69 34.6 (25.1, 45.4) 63.8 (52.0, 74.1) 29.2 <0.001 70-79 47.6 (38.2, 57.1) 43.3 (34.2, 52.9) -4.3 0.534 80+ 41.5 (31.4, 52.3) 32.5 (23.4, 43.2) -8.9 0.235
51
Be Clear on Cancer: Oesophago-gastric cancer awareness regional pilot campaign Interim evaluation results
Figure D2a: Quarterly detection rate for oesophageal cancer diagnoses, from March to May 2012 to March to May 2014, regional pilot area, by age
Figure D2b: Quarterly detection rate for stomach cancer diagnoses, from January 2012 to May 2014, regional pilot area, by age
52
Be Clear on Cancer: Oesophago-gastric cancer awareness regional pilot campaign Interim evaluation results
Figure D2c: Monthly detection rate for upper GI cancer diagnoses, from January 2012 to May 2014, regional pilot area, by age
53
Be Clear on Cancer: Oesophago-gastric cancer awareness regional pilot campaign Interim evaluation results
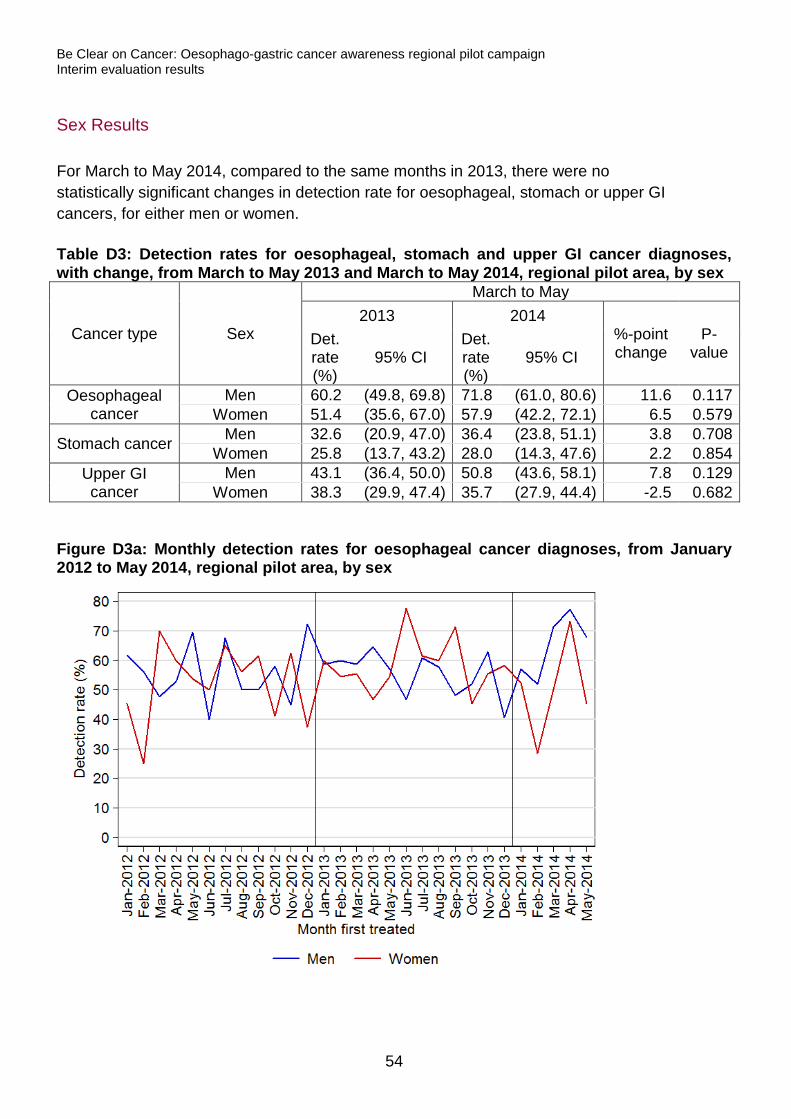
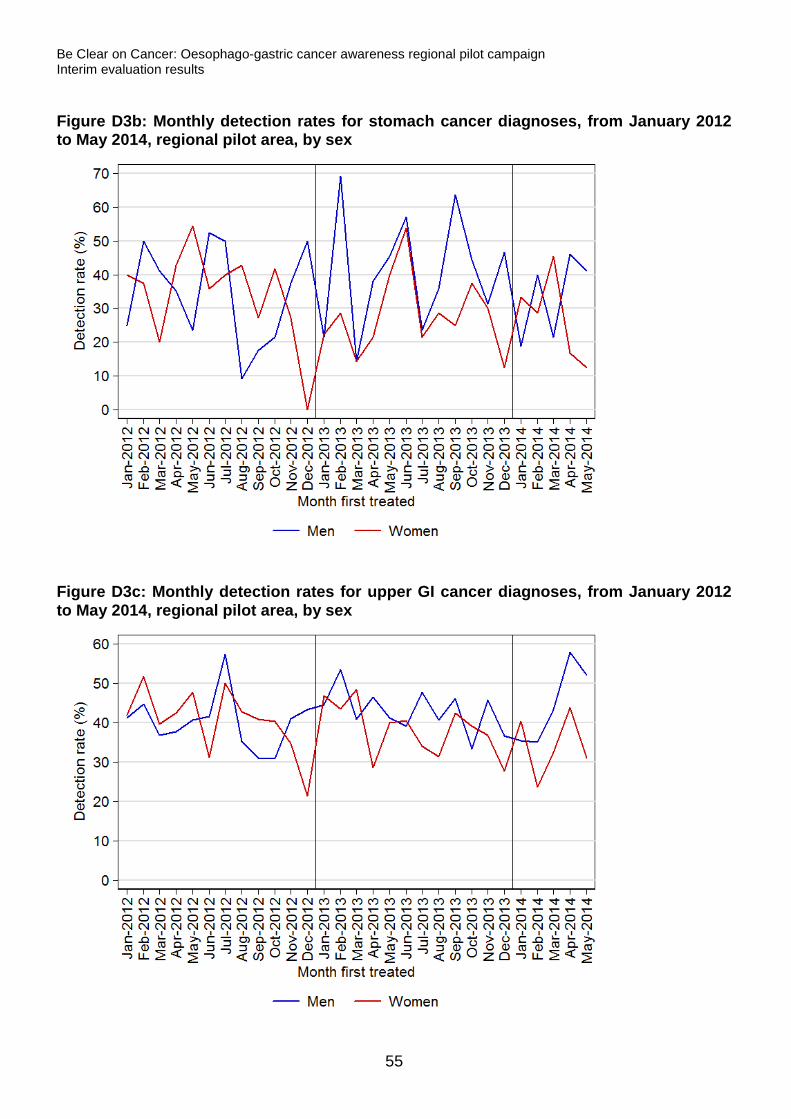
Sex Results
For March to May 2014, compared to the same months in 2013, there were no statistically significant changes in detection rate for oesophageal, stomach or upper GI cancers, for either men or women. Table D3: Detection rates for oesophageal, stomach and upper GI cancer diagnoses, with change, from March to May 2013 and March to May 2014, regional pilot area, by sex
Cancer type Sex
March to May 2013 2014
%-point change
P-value
Det. rate (%)
95% CI Det. rate (%)
95% CI
Oesophageal cancer
Men 60.2 (49.8, 69.8) 71.8 (61.0, 80.6) 11.6 0.117 Women 51.4 (35.6, 67.0) 57.9 (42.2, 72.1) 6.5 0.579
Stomach cancer Men 32.6 (20.9, 47.0) 36.4 (23.8, 51.1) 3.8 0.708 Women 25.8 (13.7, 43.2) 28.0 (14.3, 47.6) 2.2 0.854
Upper GI cancer
Men 43.1 (36.4, 50.0) 50.8 (43.6, 58.1) 7.8 0.129 Women 38.3 (29.9, 47.4) 35.7 (27.9, 44.4) -2.5 0.682
Figure D3a: Monthly detection rates for oesophageal cancer diagnoses, from January 2012 to May 2014, regional pilot area, by sex
54
Be Clear on Cancer: Oesophago-gastric cancer awareness regional pilot campaign Interim evaluation results
Figure D3b: Monthly detection rates for stomach cancer diagnoses, from January 2012 to May 2014, regional pilot area, by sex
Figure D3c: Monthly detection rates for upper GI cancer diagnoses, from January 2012 to May 2014, regional pilot area, by sex
55
Be Clear on Cancer: Oesophago-gastric cancer awareness regional pilot campaign Interim evaluation results
Appendix 1: List of tables
Table R1a: Number of urgent GP referrals for suspected upper GI cancers, with referral rate and percentage change in number of referrals, from February to April 2013 and February to April 2014 18
Table R1b: Number of urgent GP referrals for suspected head and neck cancers, with referral rate and percentage change in number of referrals, from February to April 2013 and February to April 2014 18
Table R2: Number of urgent GP referrals for suspected upper GI cancers, with referral rate and percentage change in number of referrals, from February to April 2013 and February to April 2014, regional pilot area, by age 21
Table R3: Number of urgent GP referrals for suspected upper GI cancers, with referral rate and percentage change in number of referrals, from February to April 2013 and February to April 2014, regional pilot area, by sex 23
Table TC1: Number of oesophageal, stomach and upper GI cancer diagnoses resulting from urgent GP referrals for suspected upper GI cancers, with percentage change in number of cancers, from February to April 2013 and February to April 2014 24
Table TC2: Number of oesophageal and upper GI cancer diagnoses resulting from urgent GP referrals for suspected upper GI cancers, with percentage change in number of cancers, from February to April 2013 and February to April 2014, regional pilot area, by age 28
Table TC3: Number of oesophageal and upper GI cancer diagnoses resulting from an urgent GP referral for suspected upper GI cancers, with percentage change in number of cancers, from February to April 2013 and February to April 2014, regional pilot area, by sex 30
Table C1: Oesophageal, stomach and upper GI cancer conversion rates for urgent GP referrals for suspected upper GI cancers, with change, from February to April 2013 and February to April 2014 32
Table C2: Oesophageal and upper GI cancer conversion rates for urgent GP referrals for suspected upper GI cancers, with change, from February to April 2013 and February to April 2014, regional pilot area, by age 35
Table C3: Oesophageal and upper GI cancer conversion rates for urgent GP referrals for suspected upper GI cancers, with change, from February to April 2013 and February to April 2014, regional pilot area, by sex 37
Table CC1: Number of oesophageal, stomach and upper GI cancer diagnoses recorded in the Cancer Waiting Times database, with percentage change in number of cancers, from March to May 2013 and March to May 2014 39
Table CC2: Number of oesophageal, stomach and upper GI cancer diagnoses recorded in the Cancer Waiting Times database, with percentage change in number of cancers, from March to May 2013 and March to May 2014, regional pilot area, by age 43
56

Be Clear on Cancer: Oesophago-gastric cancer awareness regional pilot campaign Interim evaluation results
Table CC3: Number of oesophageal, stomach and upper GI cancer diagnoses recorded in the Cancer Waiting Times database, with percentage change in number of cancers, from March to May 2013 and March to May 2014, regional pilot area, by sex 46
Table D1: Detection rate for oesophageal, stomach and upper GI cancer diagnoses, with change, from March to May 2013 and March to May 2014 48
Table D2: Detection rate for oesophageal, stomach and upper GI cancer diagnoses, with change, from March to May 2013 and March to May 2014, regional pilot area, by age 51
Table D3: Detection rates for oesophageal, stomach and upper GI cancer diagnoses, with change, from March to May 2013 and March to May 2014, regional pilot area, by sex 54
57
Be Clear on Cancer: Oesophago-gastric cancer awareness regional pilot campaign Interim evaluation results
Appendix 2: List of figures
Figure R1ai: Monthly number of urgent GP referrals for suspected upper GI cancers from January 2012 to April 2014, regional pilot area 19
Figure R1aii: Monthly number of urgent GP referrals for suspected upper GI cancers from January 2012 to April 2014, control area 19
Figure R1bi: Monthly number of urgent GP referrals for suspected head and neck cancers from January 2012 to April 2014, regional pilot area 20
Figure R1bii: Monthly number of urgent GP referrals for suspected head and neck cancers from January 2012 to April 2014, control area 20
Figure R2: Monthly number of urgent GP referrals for suspected upper GI cancers from January 2012 to April 2014, regional pilot area, by age 22
Figure R3: Monthly number of urgent GP referrals for suspected upper GI cancers from January 2010 to April 2014, regional pilot area, by sex 23
Figure TC1ai: Monthly number of oesophageal cancer diagnoses resulting from an urgent GP referral for suspected upper GI cancers from January 2012 to April 2014, regional pilot area 25
Figure TC1aii: Monthly number of oesophageal cancer diagnoses resulting from an urgent GP referral for suspected upper GI cancers from January 2012 to April 2014, control area25
Figure TC1bi: Quarterly number of stomach cancer diagnoses resulting from an urgent GP referral for suspected upper GI cancers from January 2012 to April 2014, regional pilot area 26
Figure TC1bii: Monthly number of stomach cancer diagnoses resulting from an urgent GP referral for suspected upper GI cancers from January 2012 to April 2014, control area26
Figure TC1ci: Monthly number of upper GI cancer diagnoses resulting from an urgent GP referral for suspected upper GI cancers from January 2012 to April 2014, regional pilot area 27
Figure TC1cii: Monthly number of upper GI cancer diagnoses resulting from an urgent GP referral for suspected upper GI cancers from January 2012 to April 2014, control area27
Figure TC2a: Quarterly number of oesophageal cancer diagnoses resulting from an urgent GP referral for suspected upper GI cancers from February to April 2012 to February to April 2014, regional pilot area, by age 29
Figure TC2c: Quarterly number of upper GI cancer diagnoses resulting from an urgent GP referral for suspected upper GI cancers from February to April 2012 to February to April 2014, regional pilot area, by age 29
58
Be Clear on Cancer: Oesophago-gastric cancer awareness regional pilot campaign Interim evaluation results
Figure TC3a: Quarterly number of oesophageal cancer diagnoses resulting from an urgent GP referral for suspected upper GI cancers from February to April 2012 to February to April 2014, regional pilot area, by sex 31
Figure TC3c: Monthly number of upper GI cancer diagnoses resulting from an urgent GP referral for suspected upper GI cancers from February to April 2012 to February to April 2014, regional pilot area, by sex 31
Figure C1a: Monthly oesophageal cancer conversion rates for urgent GP referrals for suspected upper GI cancers from January 2012 to April 2014 33
Figure C1b: Monthly stomach cancer conversion rates for urgent GP referrals for suspected upper GI cancers from January 2012 to April 2014 33
Figure C1c: Monthly upper GI cancer conversion rates for urgent GP referrals for suspected upper GI cancers from January 2012 to April 2014 34
Figure C2a: Quarterly oesophageal cancer conversion rates for urgent GP referrals for suspected upper GI cancers from February to April 2012 to February to April 2014, regional pilot area, by age 36
Figure C2c: Quarterly upper GI cancer conversion rates for urgent GP referrals for suspected upper GI cancers from February to April 2012 to February to April 2014, regional pilot area, by age 36
Figure C3a: Quarterly oesophageal cancer conversion rates for urgent GP referrals for suspected upper GI cancers, from February 2012 to April 2014, regional pilot area, by sex 38
Figure C3c: Monthly upper GI cancer conversion rates for urgent GP referrals for suspected upper GI cancers, from January 2012 to April 2014, regional pilot area, by sex 38
Figure CC1ai: Monthly number of oesophageal cancer diagnoses recorded in the Cancer Waiting Times database, from January 2012 to May 2014, regional pilot area 40
Figure CC1aii: Monthly number of oesophageal cancer diagnoses recorded in the Cancer Waiting Times database, from January 2012 to May 2014, control area 40
Figure CC1bi: Monthly number of stomach cancer diagnoses recorded in the Cancer Waiting Times database, from January 2012 to May 2014, regional pilot area 41
Figure CC1bii: Monthly number of stomach cancer diagnoses recorded in the Cancer Waiting Times database, from January 2012 to May 2014, control area 41
Figure CC1ci: Monthly number of upper GI cancer diagnoses recorded in the Cancer Waiting Times database, from January 2012 to May 2014, regional pilot area 42
Figure CC1cii: Monthly number of upper GI cancer diagnoses recorded in the Cancer Waiting Times database, from January 2012 to May 2014, control area 42
Figure CC2a: Quarterly number of oesophageal cancer diagnoses recorded in the Cancer Waiting Times database, from March to May 2012 to March to May 2014, regional pilot area, by age 44
59
Be Clear on Cancer: Oesophago-gastric cancer awareness regional pilot campaign Interim evaluation results
Figure CC2b: Quarterly number of stomach cancer diagnoses recorded in the Cancer Waiting Times database, from March to May 2012 to March to May 2014, regional pilot area, by age 45
Figure CC2c: Monthly number of upper GI cancer diagnoses recorded in the Cancer Waiting Times database, from January 2012 to May 2014, regional pilot area, by age 45
Figure CC3a: Monthly number of oesophageal cancer diagnoses recorded in the Cancer Waiting Times database, from January 2012 to May 2014, regional pilot area, by sex 46
Figure CC3b: Monthly number of stomach cancer diagnoses recorded in the Cancer Waiting Times database, from January 2012 to May 2014, regional pilot area, by sex 47
Figure CC3c: Monthly number of upper GI cancer diagnoses recorded in the Cancer Waiting Times database, from January 2012 to May 2014, regional pilot area, by sex 47
Figure D1a: Monthly detection rate for oesophageal cancer diagnoses, from January 2012 to May 2014 49
Figure D1b: Monthly detection rate for stomach cancer diagnoses, from January 2012 to May 2014 49
Figure D1c: Monthly detection rate for upper GI cancer diagnoses, from January 2012 to May 2014 50
Figure D2a: Quarterly detection rate for oesophageal cancer diagnoses, from March to May 2012 to March to May 2014, regional pilot area, by age 52
Figure D2b: Quarterly detection rate for stomach cancer diagnoses, from January 2012 to May 2014, regional pilot area, by age 52
Figure D2c: Monthly detection rate for upper GI cancer diagnoses, from January 2012 to May 2014, regional pilot area, by age 53
Figure D3a: Monthly detection rates for oesophageal cancer diagnoses, from January 2012 to May 2014, regional pilot area, by sex 54
Figure D3b: Monthly detection rates for stomach cancer diagnoses, from January 2012 to May 2014, regional pilot area, by sex 55
Figure D3c: Monthly detection rates for upper GI cancer diagnoses, from January 2012 to May 2014, regional pilot area, by sex 55
60
Recommended