BD Pathway Bioimaging Systems
Cellular Imaging for High-Content AnalysisDelivering industry-leading bioimaging, BD Pathway™ high-content cell analyzers combine superior image quality, flexible image capture, and live-cell analysis to address a wide range of applications. BD Pathway systems provide fluorescence intensity measurements, kinetic imaging, and morphological analysis, including subcellular imaging.
Both the benchtop BD Pathway 435 and the stand-alone BD Pathway 855 provide high performance and ease of use to improve workflow and productivity. Cellular images can be captured in either confocal or widefield mode to deliver high-resolution images for subsequent analysis. A unique optical spinning disk allows operators to switch between confocal or widefield modes, minimizing background fluorescence and maximizing image quality. An innovative motionless stage with movable optics enhances image stability for loosely adherent and live cells.
Powerful acquisition software allows administrators to easily develop templates for predefined routine or specialized applications. Researchers can visualize both endpoint and kinetic image data in a wide range of formats.
To support a wide range of applications, BD Biosciences also provides BD™ Bioimaging Certified Reagents ideally suited for optimal image acquisition and analysis.
As part of BD Biosciences ongoing commitment to bring innovative tools to life scientists for use in emerging areas of cell research, BD Pathway systems are backed by world-class technical and application support.
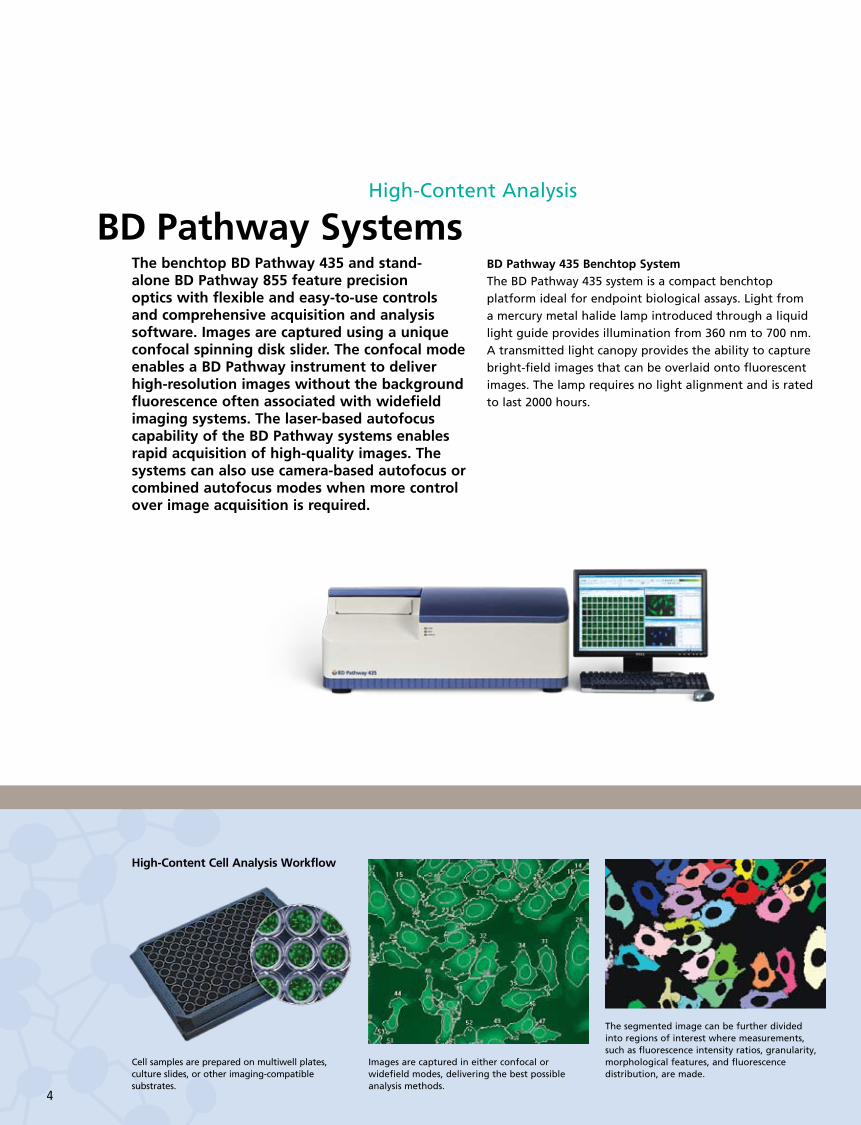
BD Pathway 435 Benchtop System The BD Pathway 435 system is a compact benchtop platform ideal for endpoint biological assays. Light from a mercury metal halide lamp introduced through a liquid light guide provides illumination from 360 nm to 700 nm. A transmitted light canopy provides the ability to capture bright-field images that can be overlaid onto fluorescent images. The lamp requires no light alignment and is rated to last 2000 hours.
High-Content Analysis
BD Pathway SystemsThe benchtop BD Pathway 435 and stand-alone BD Pathway 855 feature precision optics with flexible and easy-to-use controls and comprehensive acquisition and analysis software. Images are captured using a unique confocal spinning disk slider. The confocal mode enables a BD Pathway instrument to deliver high-resolution images without the background fluorescence often associated with widefield imaging systems. The laser-based autofocus capability of the BD Pathway systems enables rapid acquisition of high-quality images. The systems can also use camera-based autofocus or combined autofocus modes when more control over image acquisition is required.
High-Content Cell Analysis Workflow
4 5
Cell samples are prepared on multiwell plates, culture slides, or other imaging-compatible substrates.
Images are captured in either confocal or widefield modes, delivering the best possible analysis methods.
The segmented image can be further divided into regions of interest where measurements, such as fluorescence intensity ratios, granularity, morphological features, and fluorescence distribution, are made.
I N S T R U M E N T S
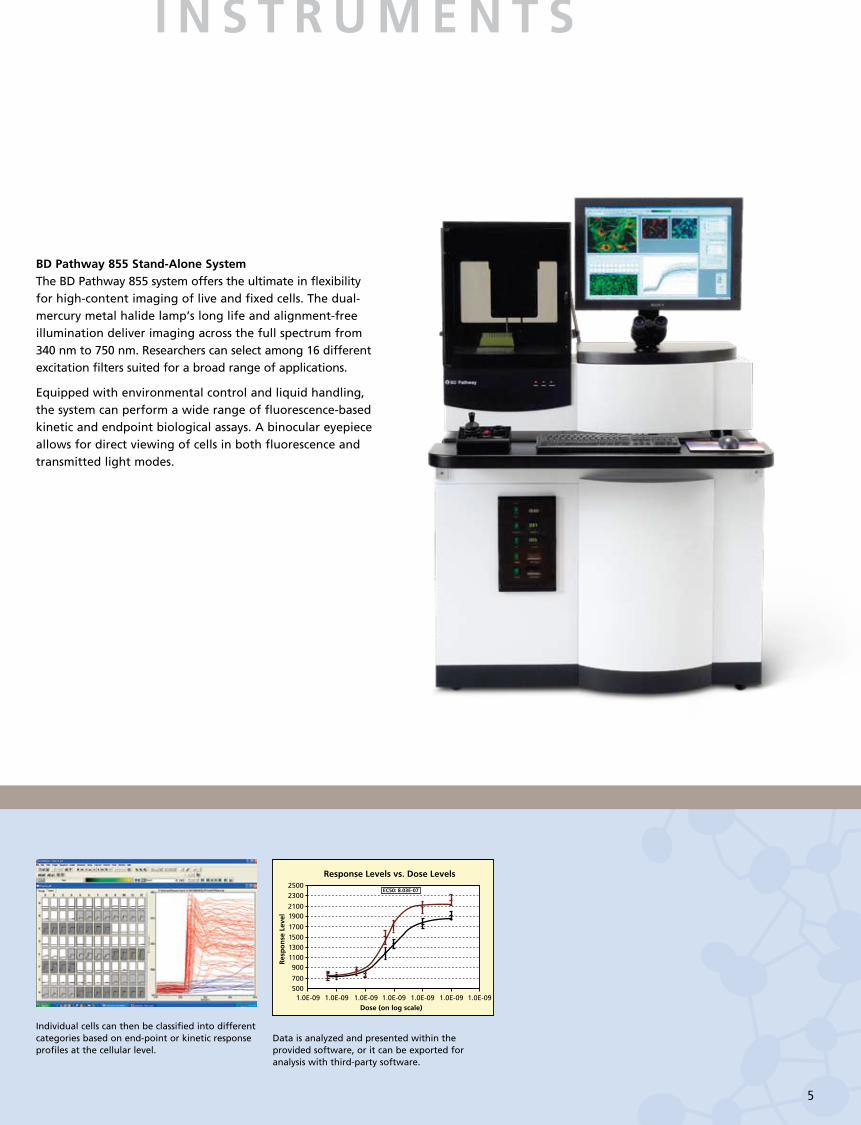
Response Levels vs. Dose Levels
EC50: 8.03E-0725002300
21001900
1700
150013001100900
700500
1.0E-09 1.0E-09 1.0E-09 1.0E-09 1.0E-09 1.0E-09 1.0E-09
Res
po
nse
Lev
el
Dose (on log scale)
BD Pathway 855 Stand-Alone System The BD Pathway 855 system offers the ultimate in flexibility for high-content imaging of live and fixed cells. The dual-mercury metal halide lamp’s long life and alignment-free illumination deliver imaging across the full spectrum from 340 nm to 750 nm. Researchers can select among 16 different excitation filters suited for a broad range of applications.
Equipped with environmental control and liquid handling, the system can perform a wide range of fluorescence-based kinetic and endpoint biological assays. A binocular eyepiece allows for direct viewing of cells in both fluorescence and transmitted light modes.
4 5
Individual cells can then be classified into different categories based on end-point or kinetic response profiles at the cellular level.
Data is analyzed and presented within the provided software, or it can be exported for analysis with third-party software.
Advanced optical systems in BD Pathway instruments provide even illumination at high intensity across the full spectrum, enabling a wide range of imaging options at multiple resolutions. Laser autofocus allows rapid image acquisition—under five minutes per 96-well plate. Different options for autofocus allow the BD Pathway system to switch from laser-based to camera-based or combined autofocus modes for applications requiring greater control over image acquisition. The unique real-time, true-optical spinning disk provides automated switching between widefield and confocal imaging. This capability delivers high-resolution images without background fluorescence often associated with widefield imaging systems.
High-precision x,y,z linear-motor positioning allows fast, precise image montage, also known as tiling, without the need for software processing. This capability helps achieve increased cell counts by acquiring multiple adjacent image fields per sample.
Superior Image Capture and Analysis
Advanced, Versatile Optical Design With BD Pathway high-content bioimagers, cellular images are captured in either confocal or widefield modes, providing the best possible images for analysis. To ensure optimal imaging and results, the BD Pathway system uses advanced optical features including autofocus, movable optics, and a confocal spinning disk.
6 7
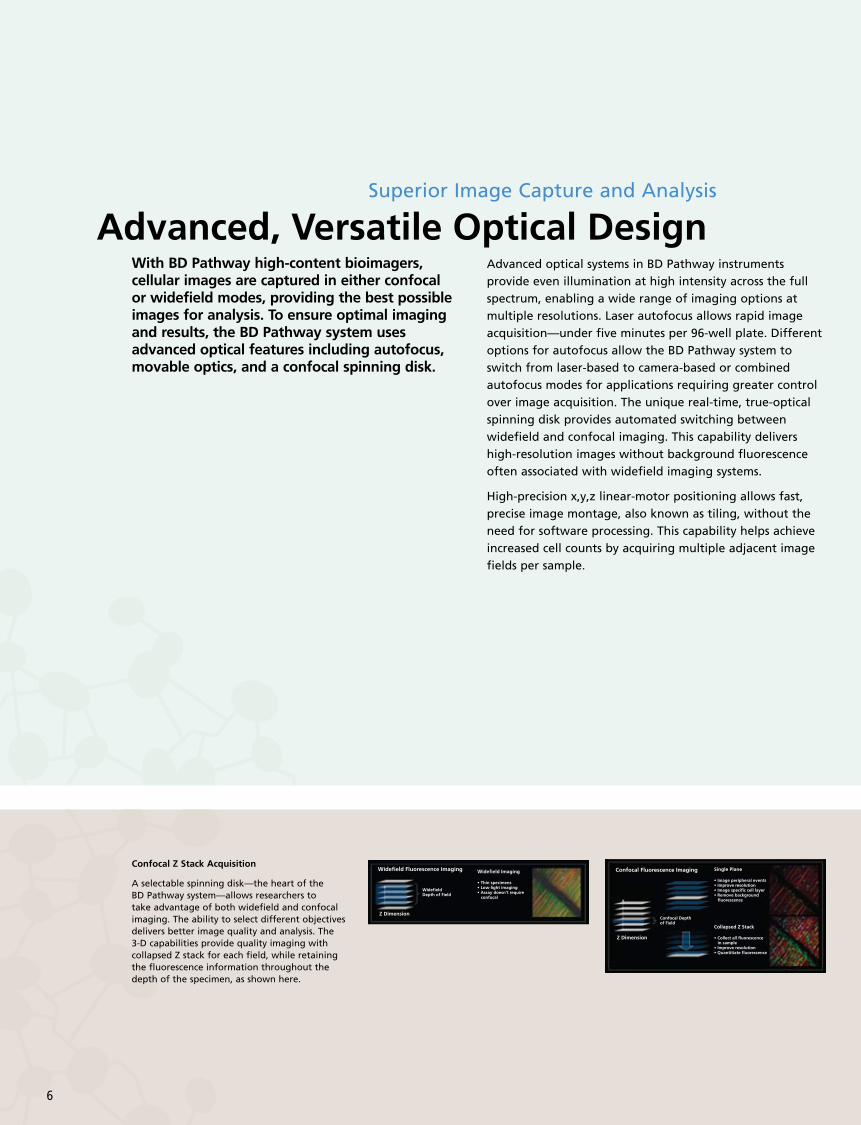
Widefield Fluorescence Imaging
Z Dimension
WidefieldDepth of Field
Widefield Imaging
confocal
Collapsed Z Stack
in sample
Single Plane
fluorescence
Confocal Depthof Field
Z Dimension
Confocal Fluorescence Imaging
Widefield Fluorescence Imaging
Z Dimension
WidefieldDepth of Field
Widefield Imaging
confocal
Collapsed Z Stack
in sample
Single Plane
fluorescence
Confocal Depthof Field
Z Dimension
Confocal Fluorescence ImagingConfocal Z Stack Acquisition
A selectable spinning disk—the heart of the BD Pathway system—allows researchers to take advantage of both widefield and confocal imaging. The ability to select different objectives delivers better image quality and analysis. The 3-D capabilities provide quality imaging with collapsed Z stack for each field, while retaining the fluorescence information throughout the depth of the specimen, as shown here.
O P T I C S
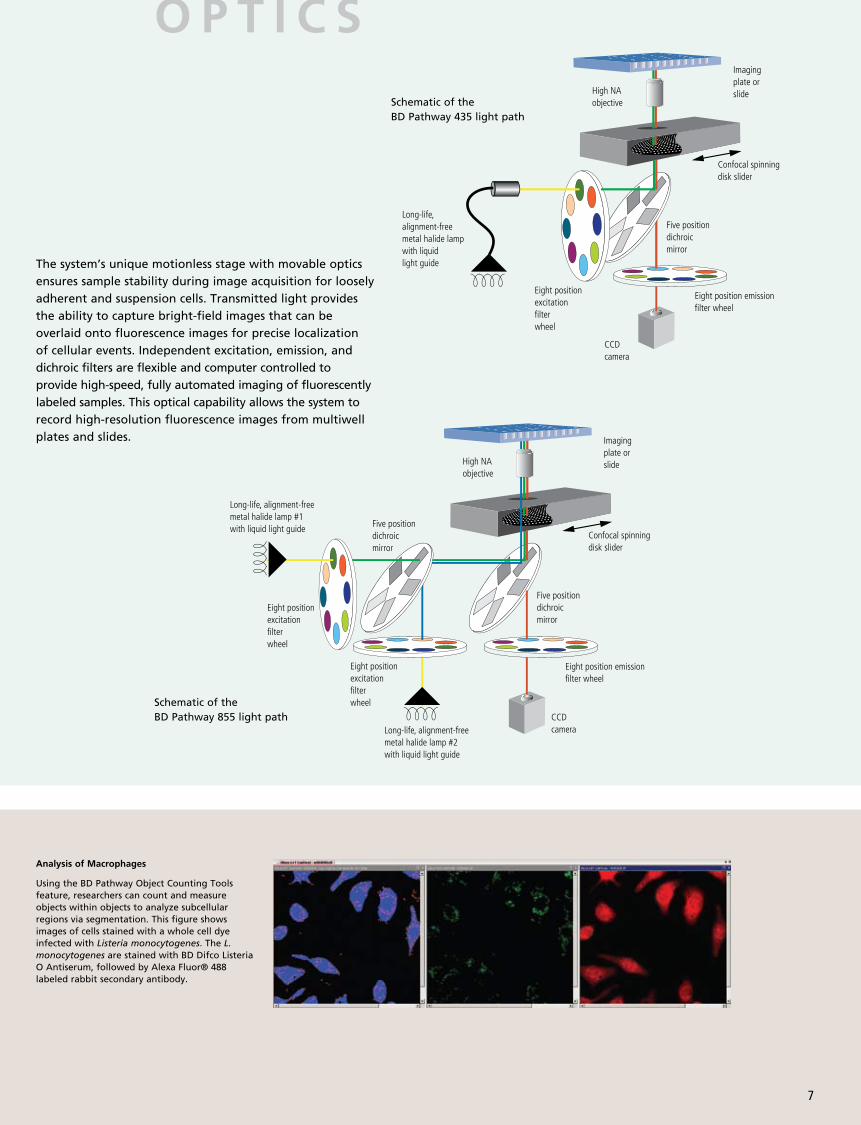
The system’s unique motionless stage with movable optics ensures sample stability during image acquisition for loosely adherent and suspension cells. Transmitted light provides the ability to capture bright-field images that can be overlaid onto fluorescence images for precise localization of cellular events. Independent excitation, emission, and dichroic filters are flexible and computer controlled to provide high-speed, fully automated imaging of fluorescently labeled samples. This optical capability allows the system to record high-resolution fluorescence images from multiwell plates and slides.
Five positiondichroic mirror
High NAobjective
Eight positionexcitation filter wheel
Eight position emission filter wheel
CCDcamera
Confocal spinningdisk slider
Long-life,alignment-freemetal halide lampwith liquidlight guide
Imagingplate or slide
High NAobjective
Eight positionexcitation filter wheel
Eight position emission filter wheel
CCDcamera
Confocal spinningdisk slider
Imagingplate or slide
Eight positionexcitation filter wheel
Five positiondichroic mirror
Five positiondichroic mirror
Long-life, alignment-freemetal halide lamp #1with liquid light guide
Long-life, alignment-freemetal halide lamp #2with liquid light guide
6 7
Analysis of Macrophages
Using the BD Pathway Object Counting Tools feature, researchers can count and measure objects within objects to analyze subcellular regions via segmentation. This figure shows images of cells stained with a whole cell dye infected with Listeria monocytogenes. The L. monocytogenes are stained with BD Difco Listeria O Antiserum, followed by Alexa Fluor® 488 labeled rabbit secondary antibody.
Schematic of the BD Pathway 435 light path
Schematic of the BD Pathway 855 light path
A N A L Y S I S
Easy Setup and AcquisitionFor routine analysis, predefined applications are set up by researchers and stored in the system for easy access with a single click. The Assay Launch dialog allows users to quickly select a routine application, enter the wells of the plate to be analyzed, and run the assay.
Intuitive Wizards for Applications Applications can be added to the Assay Launch dialog for easy access at any time. Researchers can choose applications provided by BD. BD Pathway Wizards require only basic knowledge of imaging, allowing researchers to configure the system using clear, easy to understand directions. The user is guided through the dialog, reviews the summary tab, and launches the application.
Capabilities for Advanced BioimagingAdvanced users can develop novel applications unique to their experimental needs. An intuitive macro builder allows researchers to choose from hundreds of instrument settings to meet their precise imaging requirements. The user can then experiment with a variety of settings before selecting those to apply. Once defined, these settings can be saved for running the advanced applications across any number of plates for improved results and reproducibility.
From Setup to Results
Software that Simplifies High-Content Analysis
The BD Pathway software suite simplifies high-content cellular analysis and accommodates a full range of bioimaging applications.
Response Levels vs. Dose Levels
Dose (on log scale)
40
35
30
25
20
15
10
5
0
1.00E-05 1.00E-04 1.00E-03
Ave
rag
e Fo
ci C
ou
nt
EC50: 3.80E-05
EC50: 3.86E-05
8 9
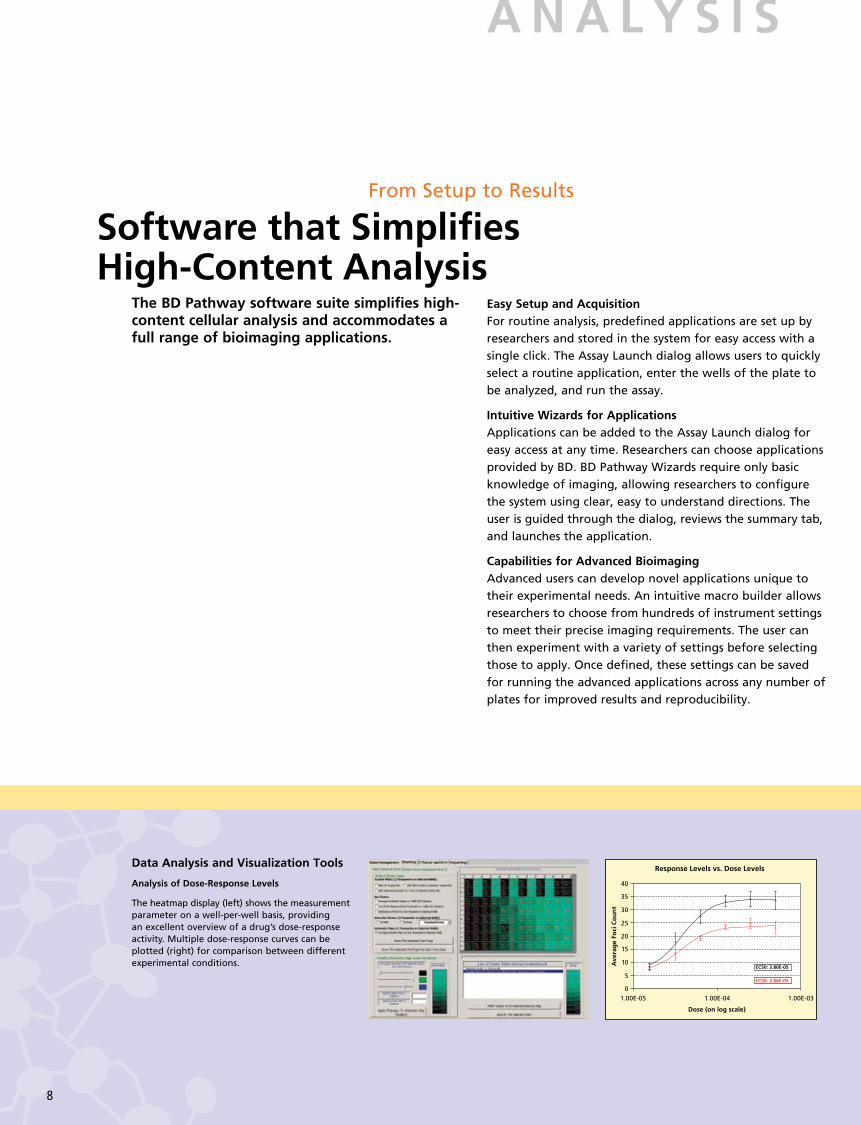
Data Analysis and Visualization Tools
Analysis of Dose-Response Levels
The heatmap display (left) shows the measurement parameter on a well-per-well basis, providing an excellent overview of a drug’s dose-response activity. Multiple dose-response curves can be plotted (right) for comparison between different experimental conditions.
Nuclear Translocation Assay
Ratio (nucleus/cytoplasm)
4000
3000
2000
1000
00.5 1 1.5 2
Ho
ech
st In
ten
sity
Nuclear Translocation Assay
Rat
io (
nu
cleu
s/cy
top
lasm
)
Drug Concentration (ng/ml)
1.5
1.3
1.1
0.9
0.70 0.02
plate 1plate 2
0.19 0.3 0.75 1.5 3.1 6.25 12.5 250.090.04
8 9
Analysis of Nuclear Translocation Assay
The scatter plot (left) shows the comparison between the area of the cell and rate of rise parameters. The bar chart (right) compares the response levels of two data sets.
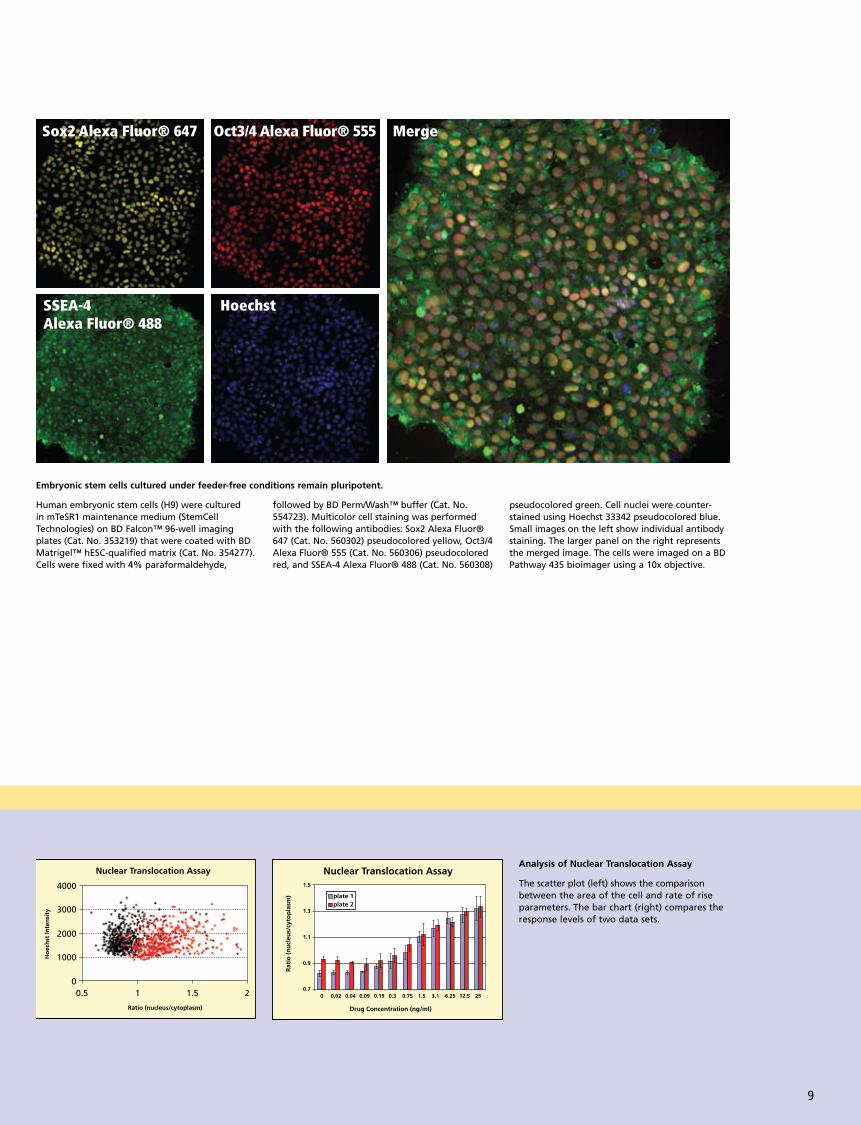
Human embryonic stem cells (H9) were cultured in mTeSR1 maintenance medium (StemCell Technologies) on BD Falcon™ 96-well imaging plates (Cat. No. 353219) that were coated with BD Matrigel™ hESC-qualified matrix (Cat. No. 354277). Cells were fixed with 4% paraformaldehyde,
followed by BD Perm/Wash™ buffer (Cat. No. 554723). Multicolor cell staining was performed with the following antibodies: Sox2 Alexa Fluor® 647 (Cat. No. 560302) pseudocolored yellow, Oct3/4 Alexa Fluor® 555 (Cat. No. 560306) pseudocolored red, and SSEA-4 Alexa Fluor® 488 (Cat. No. 560308)
pseudocolored green. Cell nuclei were counter-stained using Hoechst 33342 pseudocolored blue. Small images on the left show individual antibody staining. The larger panel on the right represents the merged image. The cells were imaged on a BD Pathway 435 bioimager using a 10x objective.
Embryonic stem cells cultured under feeder-free conditions remain pluripotent.
Sox2 Alexa Fluor® 647 Oct3/4 Alexa Fluor® 555
SSEA-4Alexa Fluor® 488
Hoechst
Merge
V I S U A L I Z A T I O N
Visualization of High-Content AnalysisUsing the BD Pathway system, bioresearchers collect and view data to gain insights into results at the cellular and subcellular level. BD Pathway software provides powerful image preprocessing filters for segmentation, including background correction, morphological, and convolution filters. These filters improve the extraction and identification of cells or cellular regions of interest for improved image analysis. The software also enables researchers to quickly and accurately split objects using sophisticated algorithms to optimize data analysis.
Additional Cellular and Subcellular AdvancesIntracellular imaging and analysis evaluating the cell nucleus are supported by band segmentation output, including erosion of the nuclear region. This output enables the BD Pathway system to deliver better results for plasma membrane translocation and additional subcellular region analysis. Exclusion regions can be created around the perinuclear region for improved signal to noise in other nucleus/cytoplasm translocation assays.
Morphometric, intensity, and positional measurements support more precise characterization and analysis of cellular and subcellular regions or phenotypes. The BD Pathway software also counts objects within objects, which is a useful tool for applications such as DNA damage, colocalization, and spot counting.
Analysis and Presentation
Powerful and Flexible Analysis ToolsThe BD Pathway system provides analysis and visualization tools for high-content image data. This data is analyzed using visualization tools such as bar charts, scatter plots, dose-response curves, heatmaps, cell-by-cell or well-by-well analysis, cell scoring (percentage of cells responding), and z’-factor. Both endpoint and kinetic data can be analyzed using the BD Pathway system.
10 11
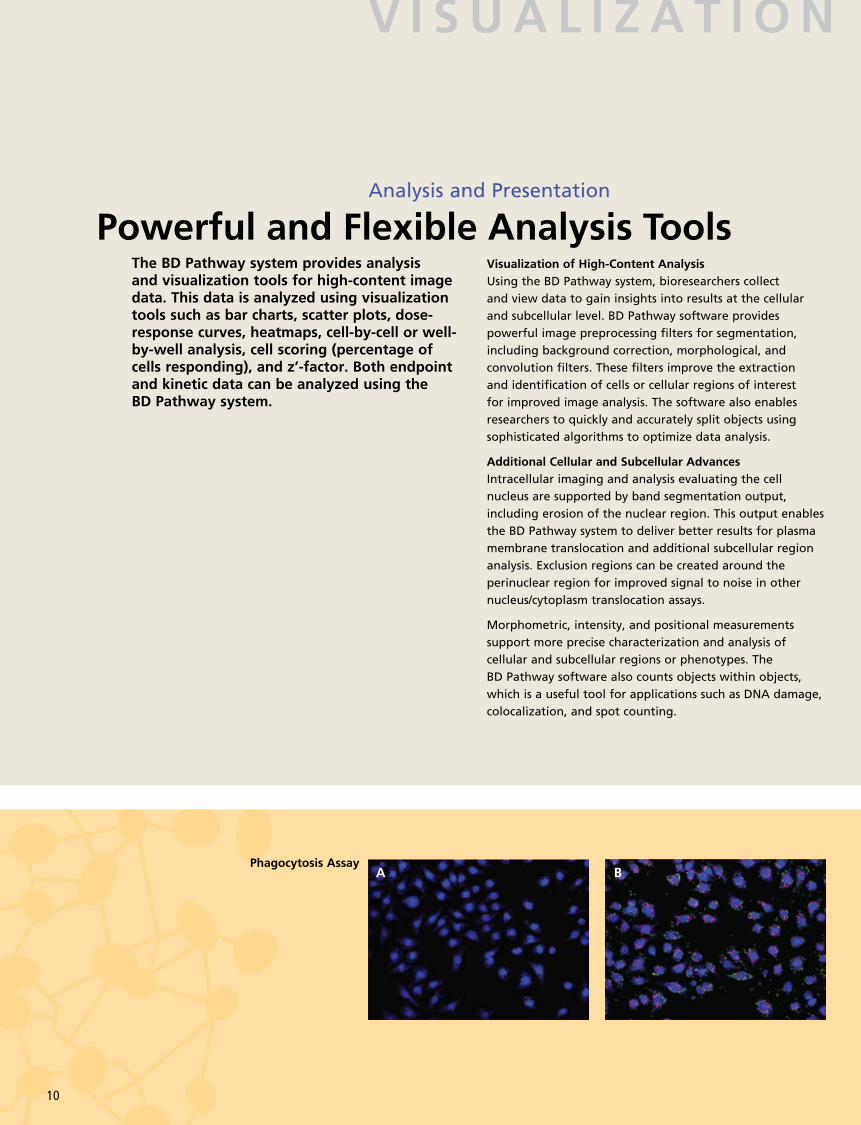
Phagocytosis AssayA B
Colocalization of Bacteria with Actin Bacterial Count/Macrophage
Co
loca
lizat
ion
Co
effi
cien
t
Bac
teri
al C
ou
nt/
Mac
rop
hag
e
0.45 9
8
7
6
5
4
3
2
1
0
0.4
0.35
0.3
0.25
0.2
0.15
0.1
0.05
00 50 100 150 200 0 50 100 150 200
Min after Infection Min after Infection
Wild-typeLLO-minus
Wild-typeLLO-minus
10 11
Bacterial Count
MOI (on log scale)
18
4
3.5
3
2.5
2
1.5
1
0.5
0
16
14
12
10
8
6
4
2
01 10 100 1000
Bound
Bound
Total
Control IFN- + LPS
Total
Nu
mb
er o
f B
acte
ria/
Mac
rop
hag
e
Bac
teri
al C
ou
nt/
Mac
rop
hag
e
Bacterial Count
MOI (on log scale)
18
4
3.5
3
2.5
2
1.5
1
0.5
0
16
14
12
10
8
6
4
2
01 10 100 1000
Bound
Bound
Total
Control IFN- + LPS
Total
Nu
mb
er o
f B
acte
ria/
Mac
rop
hag
e
Bac
teri
al C
ou
nt/
Mac
rop
hag
e
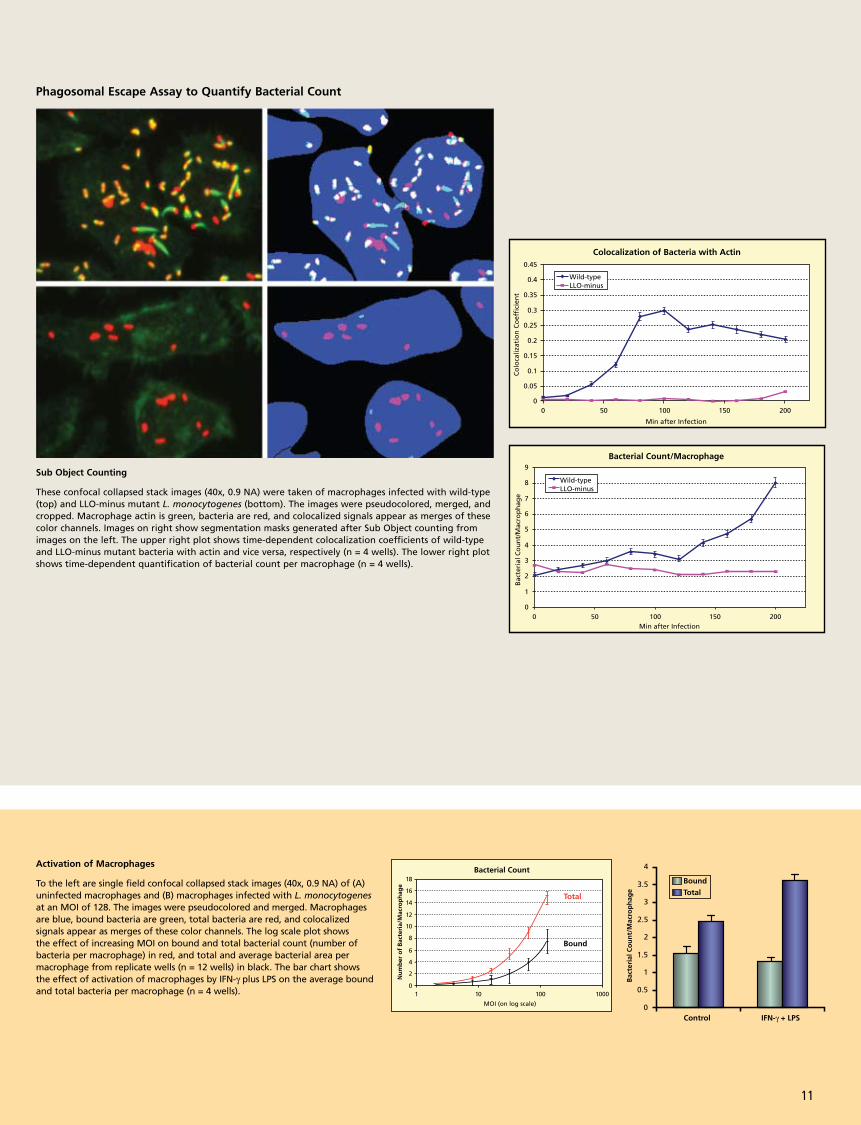
Phagosomal Escape Assay to Quantify Bacterial Count
Sub Object Counting
These confocal collapsed stack images (40x, 0.9 NA) were taken of macrophages infected with wild-type (top) and LLO-minus mutant L. monocytogenes (bottom). The images were pseudocolored, merged, and cropped. Macrophage actin is green, bacteria are red, and colocalized signals appear as merges of these color channels. Images on right show segmentation masks generated after Sub Object counting from images on the left. The upper right plot shows time-dependent colocalization coefficients of wild-type and LLO-minus mutant bacteria with actin and vice versa, respectively (n = 4 wells). The lower right plot shows time-dependent quantification of bacterial count per macrophage (n = 4 wells).
Activation of Macrophages
To the left are single field confocal collapsed stack images (40x, 0.9 NA) of (A) uninfected macrophages and (B) macrophages infected with L. monocytogenes at an MOI of 128. The images were pseudocolored and merged. Macrophages are blue, bound bacteria are green, total bacteria are red, and colocalized signals appear as merges of these color channels. The log scale plot shows the effect of increasing MOI on bound and total bacterial count (number of bacteria per macrophage) in red, and total and average bacterial area per macrophage from replicate wells (n = 12 wells) in black. The bar chart shows the effect of activation of macrophages by IFN-g plus LPS on the average bound and total bacteria per macrophage (n = 4 wells).
12
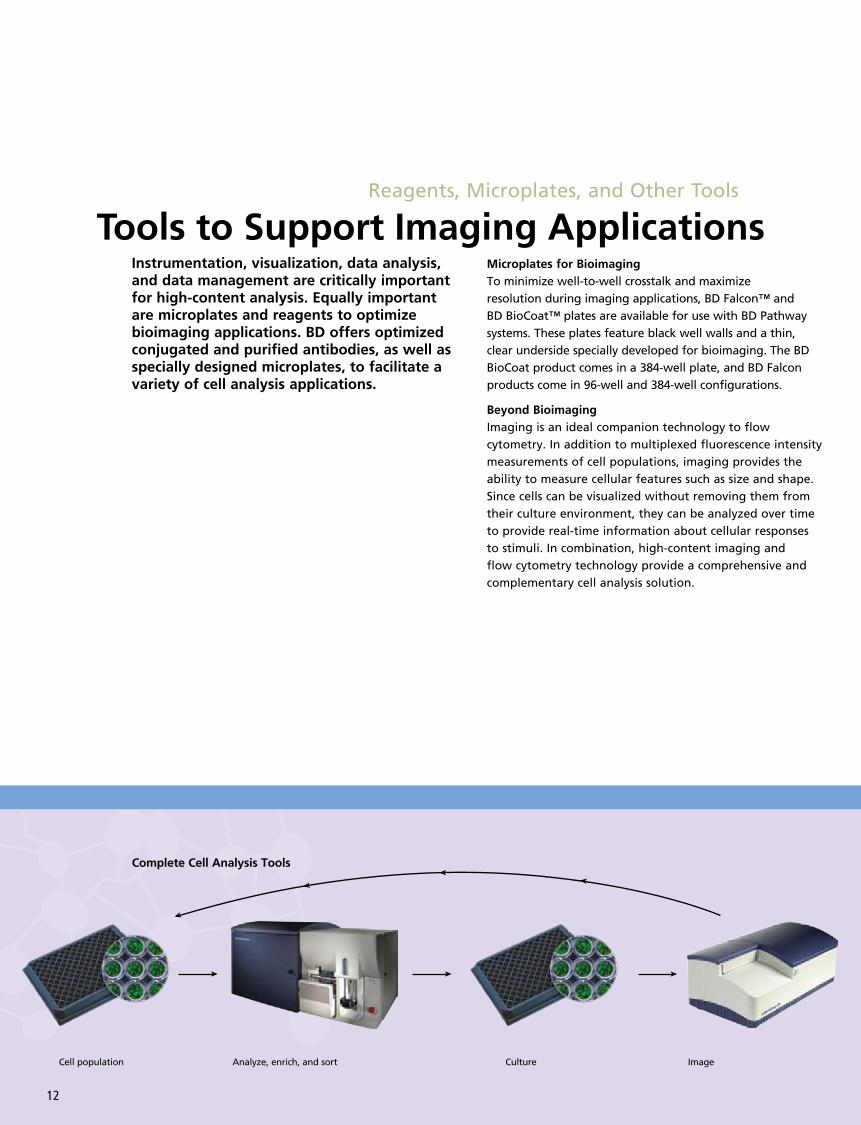
Complete Cell Analysis Tools
Cell population Analyze, enrich, and sort Culture Image
Microplates for BioimagingTo minimize well-to-well crosstalk and maximize resolution during imaging applications, BD Falcon™ and BD BioCoat™ plates are available for use with BD Pathway systems. These plates feature black well walls and a thin, clear underside specially developed for bioimaging. The BD BioCoat product comes in a 384-well plate, and BD Falcon products come in 96-well and 384-well configurations.
Beyond Bioimaging Imaging is an ideal companion technology to flow cytometry. In addition to multiplexed fluorescence intensity measurements of cell populations, imaging provides the ability to measure cellular features such as size and shape. Since cells can be visualized without removing them from their culture environment, they can be analyzed over time to provide real-time information about cellular responses to stimuli. In combination, high-content imaging and flow cytometry technology provide a comprehensive and complementary cell analysis solution.
Reagents, Microplates, and Other Tools
Tools to Support Imaging ApplicationsInstrumentation, visualization, data analysis, and data management are critically important for high-content analysis. Equally important are microplates and reagents to optimize bioimaging applications. BD offers optimized conjugated and purified antibodies, as well as specially designed microplates, to facilitate a variety of cell analysis applications.
R E A G E N T S
13
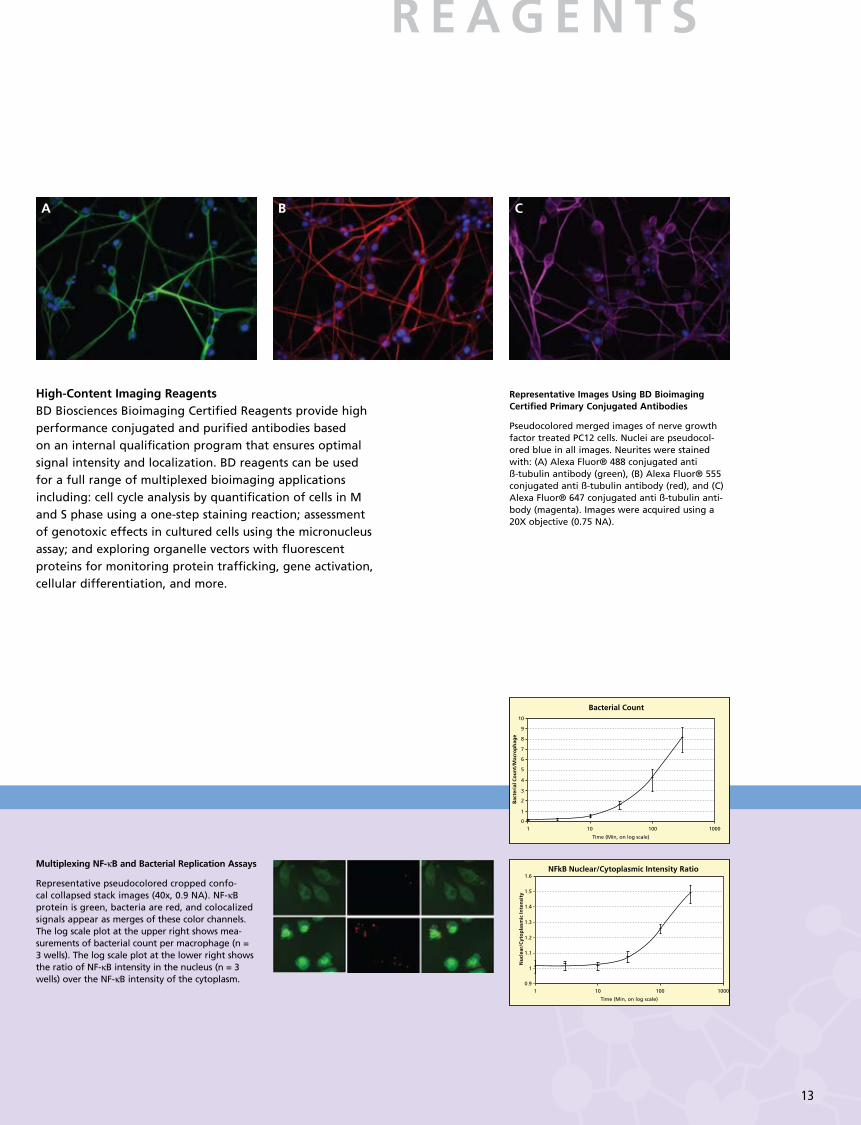
Multiplexing NF-κB and Bacterial Replication Assays
Representative pseudocolored cropped confo-cal collapsed stack images (40x, 0.9 NA). NF-κB protein is green, bacteria are red, and colocalized signals appear as merges of these color channels. The log scale plot at the upper right shows mea-surements of bacterial count per macrophage (n = 3 wells). The log scale plot at the lower right shows the ratio of NF-κB intensity in the nucleus (n = 3 wells) over the NF-κB intensity of the cytoplasm.
Representative Images Using BD Bioimaging Certified Primary Conjugated Antibodies
Pseudocolored merged images of nerve growth factor treated PC12 cells. Nuclei are pseudocol-ored blue in all images. Neurites were stained with: (A) Alexa Fluor® 488 conjugated anti ß-tubulin antibody (green), (B) Alexa Fluor® 555 conjugated anti ß-tubulin antibody (red), and (C) Alexa Fluor® 647 conjugated anti ß-tubulin anti-body (magenta). Images were acquired using a 20X objective (0.75 NA).
NFkB Nuclear/Cytoplasmic Intensity Ratio
Time (Min, on log scale) Time (Min, on log scale)
1 10 100 1000 1 10 100 1000
1.610
9
8
7
6
5
4
3
2
1
0
1.5
1.4
1.3
1.2
1.1
1
0.9
Nu
clea
r/C
yto
pla
smic
Inte
nsi
ty
Bacterial Count
Bac
teri
al C
ou
nt/
Mac
rop
hag
e
NFkB Nuclear/Cytoplasmic Intensity Ratio
Time (Min, on log scale) Time (Min, on log scale)
1 10 100 1000 1 10 100 1000
1.610
9
8
7
6
5
4
3
2
1
0
1.5
1.4
1.3
1.2
1.1
1
0.9
Nu
clea
r/C
yto
pla
smic
Inte
nsi
ty
Bacterial Count
Bac
teri
al C
ou
nt/
Mac
rop
hag
e
High-Content Imaging ReagentsBD Biosciences Bioimaging Certified Reagents provide high performance conjugated and purified antibodies based on an internal qualification program that ensures optimal signal intensity and localization. BD reagents can be used for a full range of multiplexed bioimaging applications including: cell cycle analysis by quantification of cells in M and S phase using a one-step staining reaction; assessment of genotoxic effects in cultured cells using the micronucleus assay; and exploring organelle vectors with fluorescent proteins for monitoring protein trafficking, gene activation, cellular differentiation, and more.
A B C
S E R V I C E
BD Biosciences is fully committed to the success and satisfaction of its customers. BD Pathway systems are backed by a world-class service and support organization with unmatched experience in cell science. Since 1974, BD has innovated cell analysis for optimal performance, ease of use, and improved workflow. This expertise is made available to BD Pathway customers through comprehensive training, applications and technical support, and expert field service.
Technical Application SupportBD Biosciences technical applications support specialists are available to provide field- or phone-based assistance and advice. They are well equipped to address customer needs in both instrument and applications support, including input on high content imaging reagents such as the BD™ Cell Cycle Kit, BD Gentest™ Micronucleus Assay Kit, BD Pharmingen™ FP organelle vectors, and BD™ Ratiomax Calcium Reagent Kit.
Field ServiceWhen instrument installation or service is required, a BD Biosciences Technical Field Service Engineer can be dispatched to the customer site. BD Biosciences field service engineers are located across the world. On-site service and maintenance agreements are available to provide long-term support for BD Pathway systems.
Technical Expertise from BD
Service and Support
14
Asia PacificBD SingaporeTel 65.6861.0633Fax 65.6860.1593
Australia/New ZealandAustraliaToll Free: 1800 656 100Tel 61.2.8875.7000Fax [email protected]
New ZealandToll Free: 0800 572.468 Tel 64.9.574.2468Fax [email protected]
United StatesBD [email protected] bdbiosciences.com
Customer/Technical ServiceToll Free 877.232.8995
Bioimaging SystemsFax 301.340.9775
Discovery LabwareFax 978.901.7490
Immunocytometry SystemsFax 800.325.9637
PharmingenFax 800.325.9637
JapanNippon Becton DickinsonToll Free 0120.8555.90Tel 81.24.593.5405Fax 81.24.593.5761
Latin America/CaribbeanBD BiosciencesToll Free 0800.771.7157Tel 55.11.5185.9995Fax [email protected]
EuropeBD BiosciencesTel 32.2.400.98.95Fax [email protected]
CanadaBD BiosciencesToll Free 800.268.5430Tel 905.288.6000Fax [email protected]
Regional Offices bdbiosciences.com/offices
BD Biosciences 2350 Qume Drive San Jose, CA 95131 bdbiosciences.com
23-10861-01
Class I (1) laser product.
For Research Use Only. Not for use in diagnostic or therapeutic procedures.
Alexa Fluor(R) is a registered trademark of Molecular Probes, Inc.
Purchase does not include or carry any right to resell or transfer this product either as a stand-alone product or as a component of another product. Any use of this product other than the permitted use without the express written authorization of Becton Dickinson and Company is strictly prohibited. Product availability and prices are subject to change without notice.
© 2009 Becton, Dickinson and Company. All rights reserved. No part of this publication may be reproduced, transmitted, transcribed, stored in retrieval systems, or translated into any language or computer language, in any form or by any means: electronic, mechanical, magnetic, optical, chemical, manual, or otherwise, without prior written permission from BD Biosciences.
BD, BD Logo and all other trademarks are property of Becton, Dickinson and Company. © 2009 BD
Recommended