© BAUER AG, D-86529 Schrobenhausen 13-05-15 IR-Presentation_Q1_2013
BAUER AG
Group Presentation
First quarter 2013
Bauma 2013 – Munich, Germany
© BAUER AG, D-86529 Schrobenhausen 13-05-15 IR-Presentation_Q1_2013 2
Total Group revenues
1,600
1,200
800
400
0
Orders in hand
800
600
400
200
0
Net profit
60
45
30
15
0
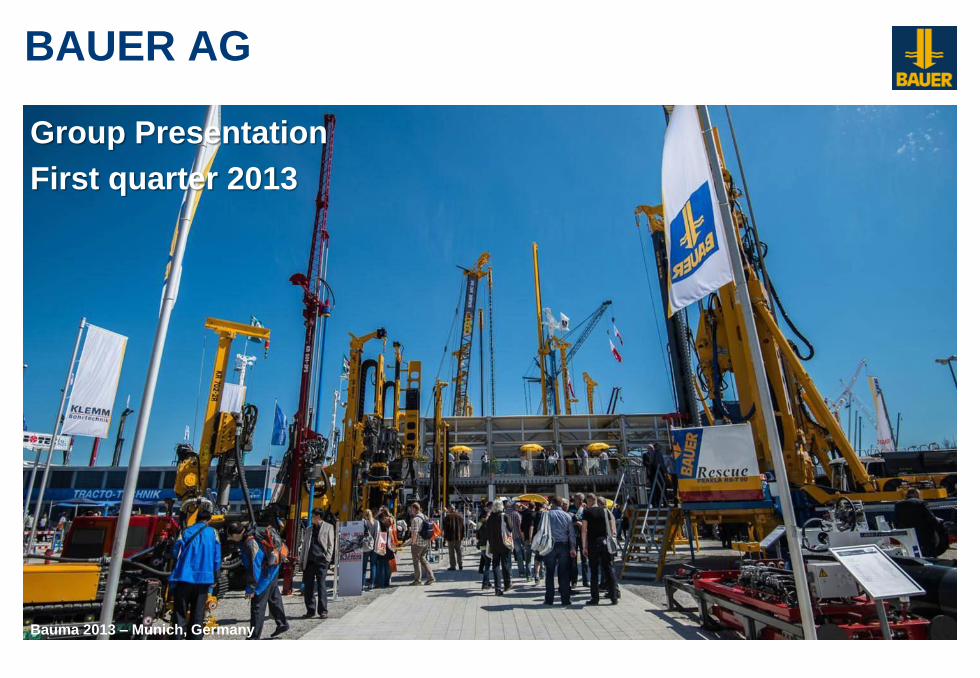
Key Figures FY 2012
Employees
12,000
9,000
6,000
3,000
0
in EUR million in EUR million
in EUR million in average
1,276 1,304 1,372
2009 2010 2011 2012
1,446 42.0 39.8 34.1
2009 2010 2011 2012*
25.8
2009 2010 2011 2012
508.9 614.9 750.0 785.0
2009 2010 2011 2012
8,872 9,094 9,646 10,253
*adjusted because of IAS 19 R
© BAUER AG, D-86529 Schrobenhausen 13-05-15 IR-Presentation_Q1_2013 3
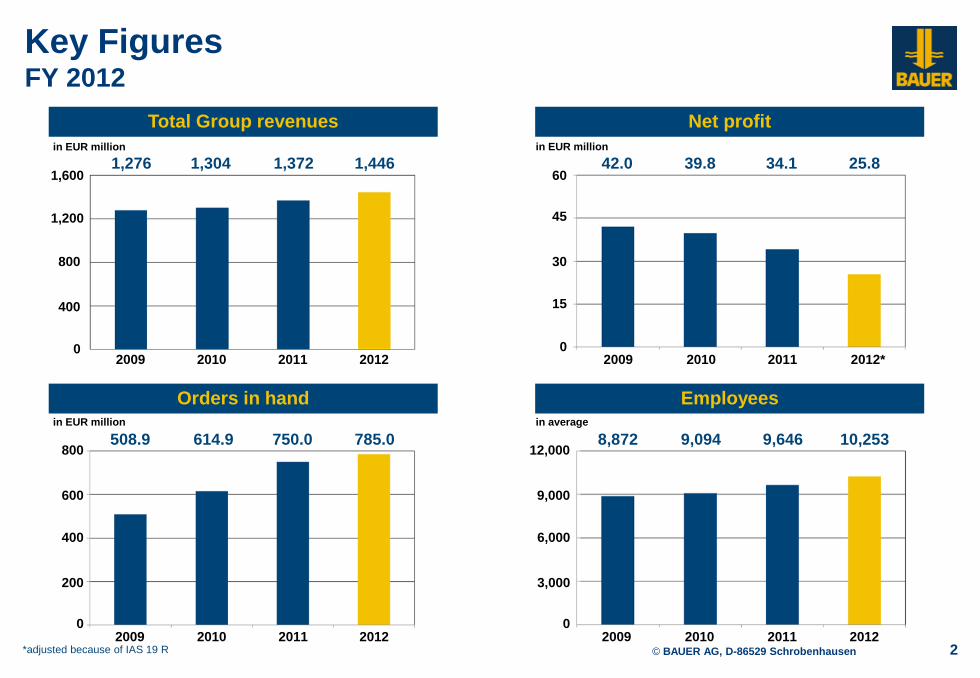
Mission & Strategy
Services, equipment & products dealing with ground
and groundwater
Our mission
Our strategy
The world is our market.
World market leadership for foundation technology.
Powerful development of drilling applications and related
services for resources, water and energy markets.
Optimizing worldwide organizational networks and self
controlling structures for the Group.
Growth 5 to 10 % per year.
BG 42 PremiumLine – Munich, Germany
© BAUER AG, D-86529 Schrobenhausen 13-05-15 IR-Presentation_Q1_2013 4
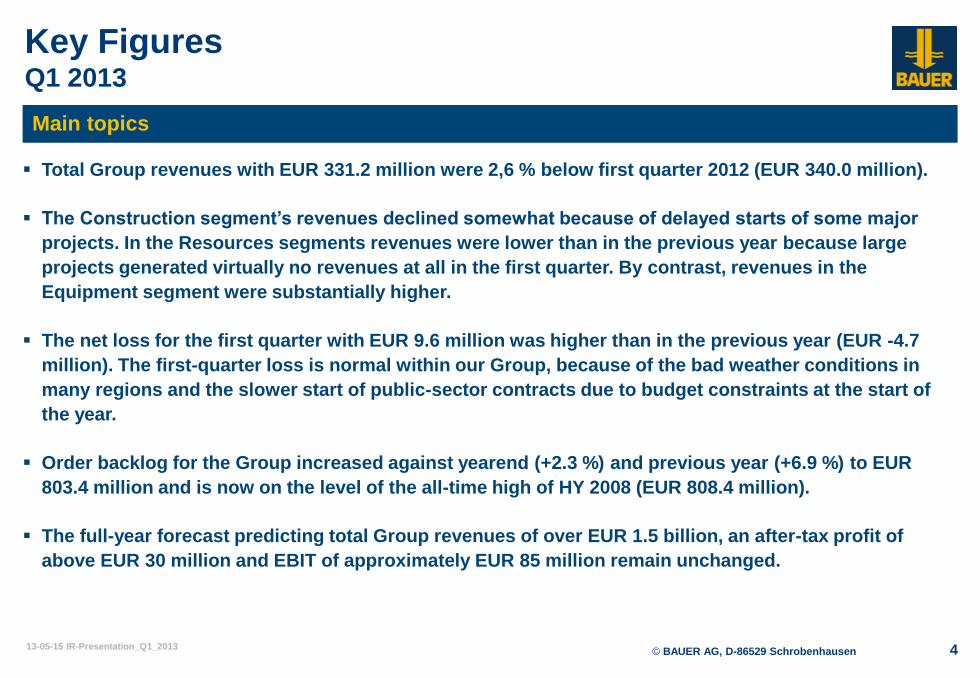
Total Group revenues with EUR 331.2 million were 2,6 % below first quarter 2012 (EUR 340.0 million).
The Construction segment’s revenues declined somewhat because of delayed starts of some major
projects. In the Resources segments revenues were lower than in the previous year because large
projects generated virtually no revenues at all in the first quarter. By contrast, revenues in the
Equipment segment were substantially higher.
The net loss for the first quarter with EUR 9.6 million was higher than in the previous year (EUR -4.7
million). The first-quarter loss is normal within our Group, because of the bad weather conditions in
many regions and the slower start of public-sector contracts due to budget constraints at the start of
the year.
Order backlog for the Group increased against yearend (+2.3 %) and previous year (+6.9 %) to EUR
803.4 million and is now on the level of the all-time high of HY 2008 (EUR 808.4 million).
The full-year forecast predicting total Group revenues of over EUR 1.5 billion, an after-tax profit of
above EUR 30 million and EBIT of approximately EUR 85 million remain unchanged.
Main topics
Key Figures Q1 2013
© BAUER AG, D-86529 Schrobenhausen 13-05-15 IR-Presentation_Q1_2013 5
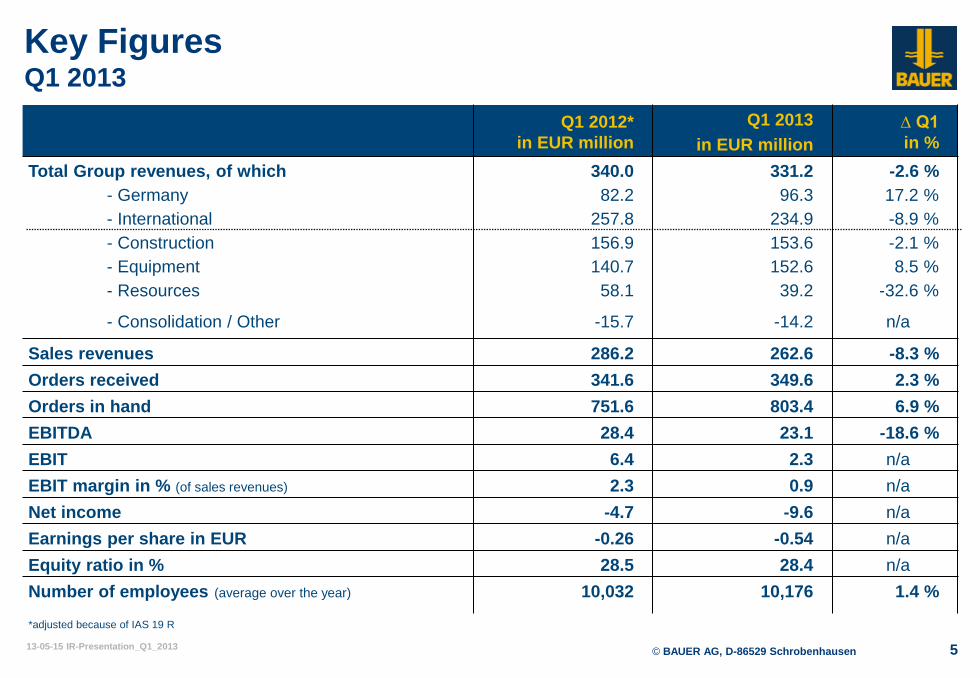
Key Figures Q1 2013
Q1 2012*
in EUR million
Q1 2013
in EUR million
∆ Q1
in %
Total Group revenues, of which
- Germany
- International
- Construction
- Equipment
- Resources
- Consolidation / Other
340.0
82.2
257.8
156.9
140.7
58.1
-15.7
331.2
96.3
234.9
153.6
152.6
39.2
-14.2
-2.6 %
17.2 %
-8.9 %
-2.1 %
8.5 %
-32.6 %
n/a
Sales revenues 286.2 262.6 -8.3 %
Orders received 341.6 349.6 2.3 %
Orders in hand 751.6 803.4 6.9 %
EBITDA 28.4 23.1 -18.6 %
EBIT 6.4 2.3 n/a
EBIT margin in % (of sales revenues) 2.3 0.9 n/a
Net income -4.7 -9.6 n/a
Earnings per share in EUR -0.26 -0.54 n/a
Equity ratio in % 28.5 28.4 n/a
Number of employees (average over the year) 10,032 10,176 1.4 %
*adjusted because of IAS 19 R
© BAUER AG, D-86529 Schrobenhausen 13-05-15 IR-Presentation_Q1_2013 6
Contents
Regional breakdown of revenues 3
Financials 4
Overview BAUER Group 1
BAUER market environment 2
p. 7
p. 14
p. 16
p. 18
5 Guidance 2013
6 Appendix
p. 25
p. 26
© BAUER AG, D-86529 Schrobenhausen 13-05-15 IR-Presentation_Q1_2013 7
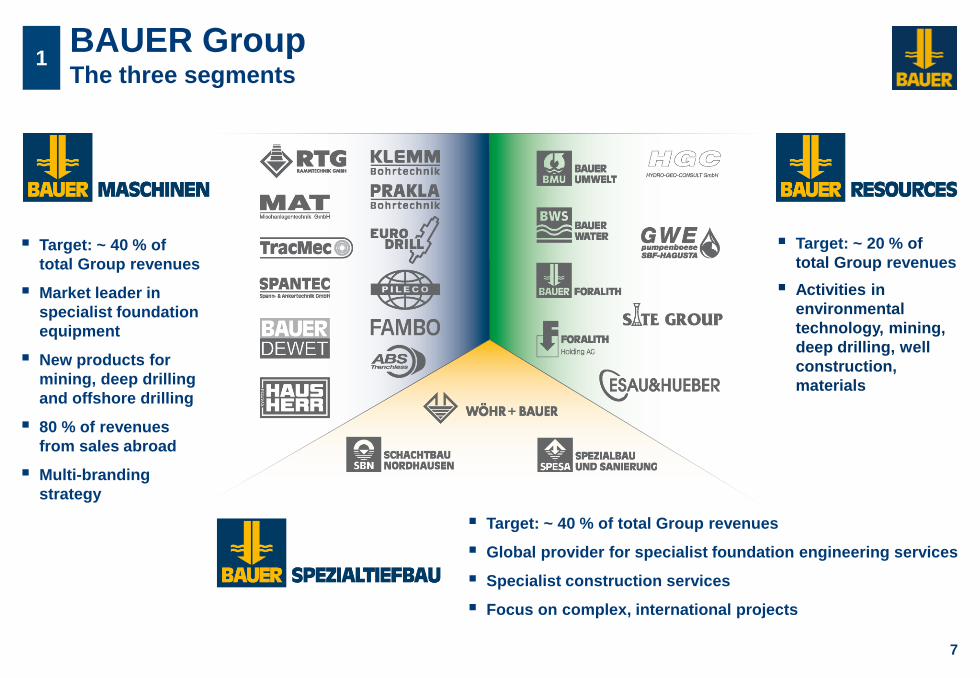
1 BAUER Group The three segments
Target: ~ 40 % of
total Group revenues
Market leader in
specialist foundation
equipment
New products for
mining, deep drilling
and offshore drilling
80 % of revenues
from sales abroad
Multi-branding
strategy
Target: ~ 40 % of total Group revenues
Global provider for specialist foundation engineering services
Specialist construction services
Focus on complex, international projects
Target: ~ 20 % of
total Group revenues
Activities in
environmental
technology, mining,
deep drilling, well
construction,
materials
© BAUER AG, D-86529 Schrobenhausen 13-05-15 IR-Presentation_Q1_2013 8
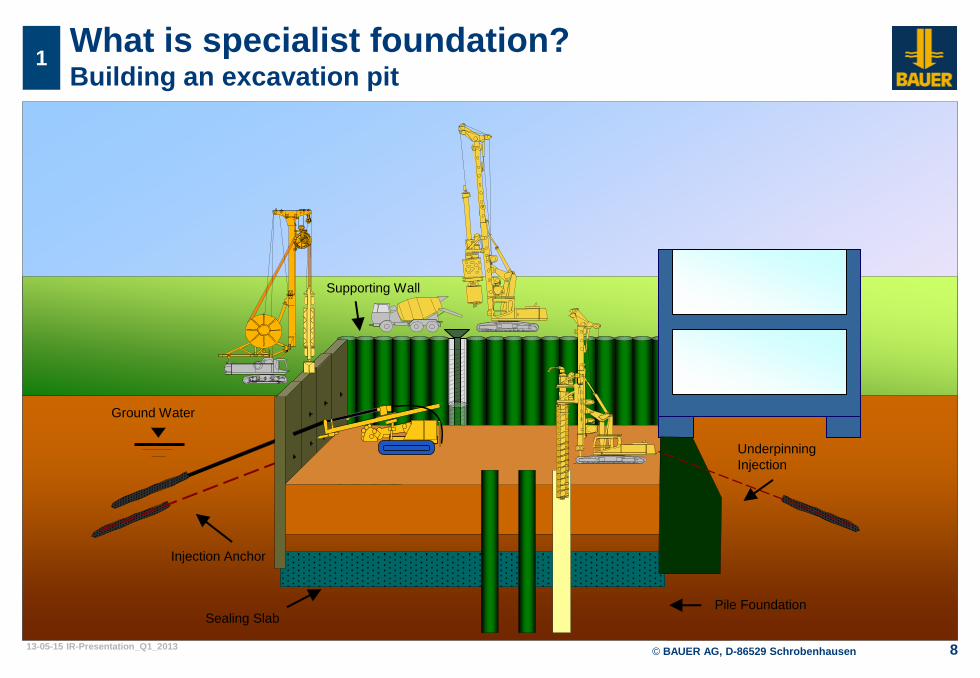
What is specialist foundation? Building an excavation pit
1
Ground Water
Injection Anchor
Sealing Slab
Supporting Wall
Underpinning
Injection
Pile Foundation

© BAUER AG, D-86529 Schrobenhausen 13-05-15 IR-Presentation_Q1_2013 9
What is specialist foundation used for? Applications for projects
1
Foundations Cut-off walls Excavation pits
Buildings Infrastructure Water – Energy Industry
Ground improvement
© BAUER AG, D-86529 Schrobenhausen 13-05-15 IR-Presentation_Q1_2013 10
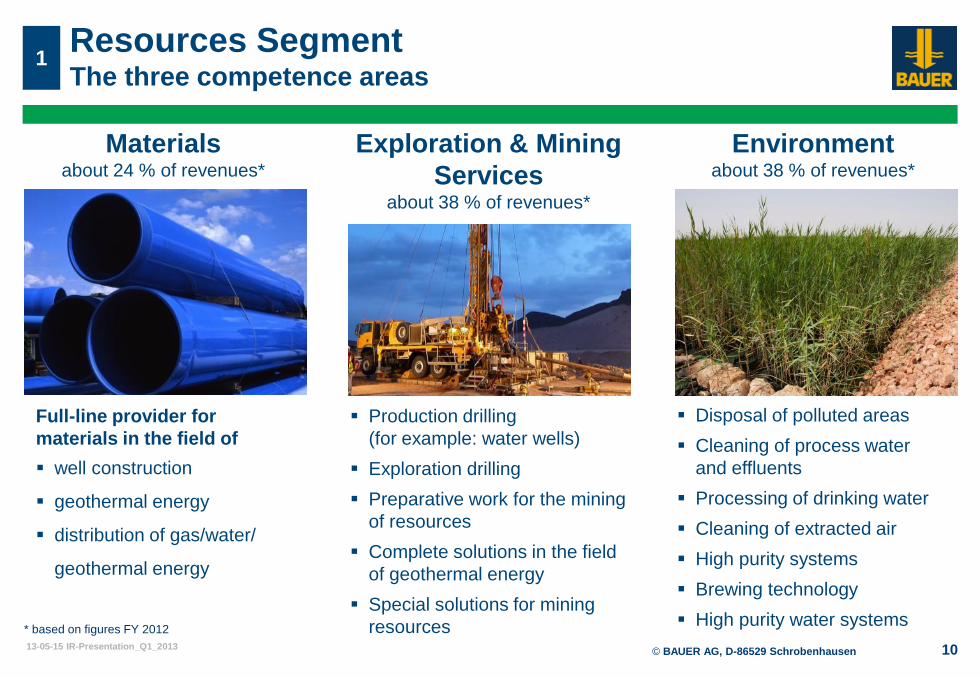
Resources Segment The three competence areas
1
Environment about 38 % of revenues*
Exploration & Mining
Services about 38 % of revenues*
Materials about 24 % of revenues*
Full-line provider for
materials in the field of
well construction
geothermal energy
distribution of gas/water/
geothermal energy
Production drilling
(for example: water wells)
Exploration drilling
Preparative work for the mining
of resources
Complete solutions in the field
of geothermal energy
Special solutions for mining
resources
Disposal of polluted areas
Cleaning of process water
and effluents
Processing of drinking water
Cleaning of extracted air
High purity systems
Brewing technology
High purity water systems * based on figures FY 2012
© BAUER AG, D-86529 Schrobenhausen 13-05-15 IR-Presentation_Q1_2013
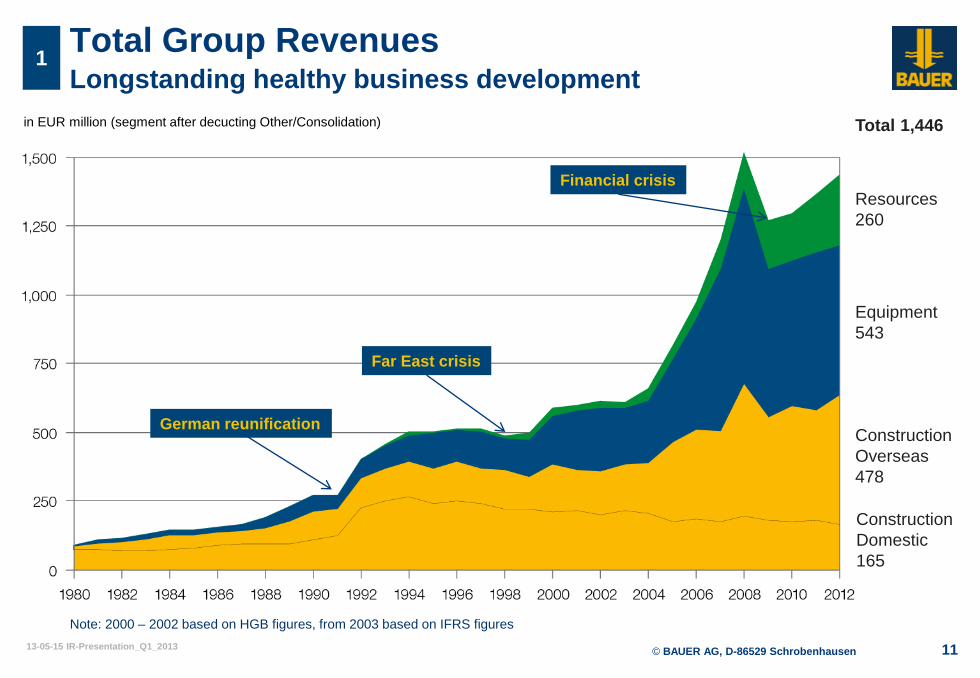
in EUR million (segment after decucting Other/Consolidation)
11
1
Note: 2000 – 2002 based on HGB figures, from 2003 based on IFRS figures
Resources
260
Equipment
543
Construction
Overseas
478
Total 1,446
Construction
Domestic
165
Total Group Revenues Longstanding healthy business development
German reunification
Far East crisis
Financial crisis
© BAUER AG, D-86529 Schrobenhausen 13-05-15 IR-Presentation_Q1_2013 12
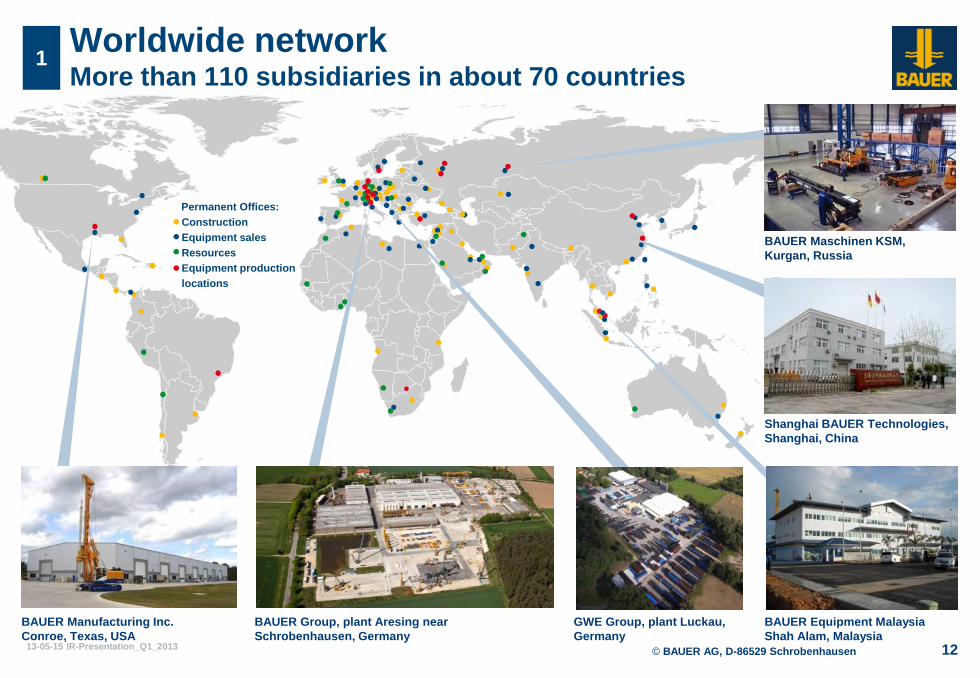
Worldwide network More than 110 subsidiaries in about 70 countries
1
BAUER Manufacturing Inc.
Conroe, Texas, USA
GWE Group, plant Luckau,
Germany
BAUER Maschinen KSM,
Kurgan, Russia
BAUER Equipment Malaysia
Shah Alam, Malaysia
Shanghai BAUER Technologies,
Shanghai, China
BAUER Group, plant Aresing near
Schrobenhausen, Germany
Permanent Offices:
Construction
Equipment sales
Resources
Equipment production
locations
© BAUER AG, D-86529 Schrobenhausen 13-05-15 IR-Presentation_Q1_2013 13
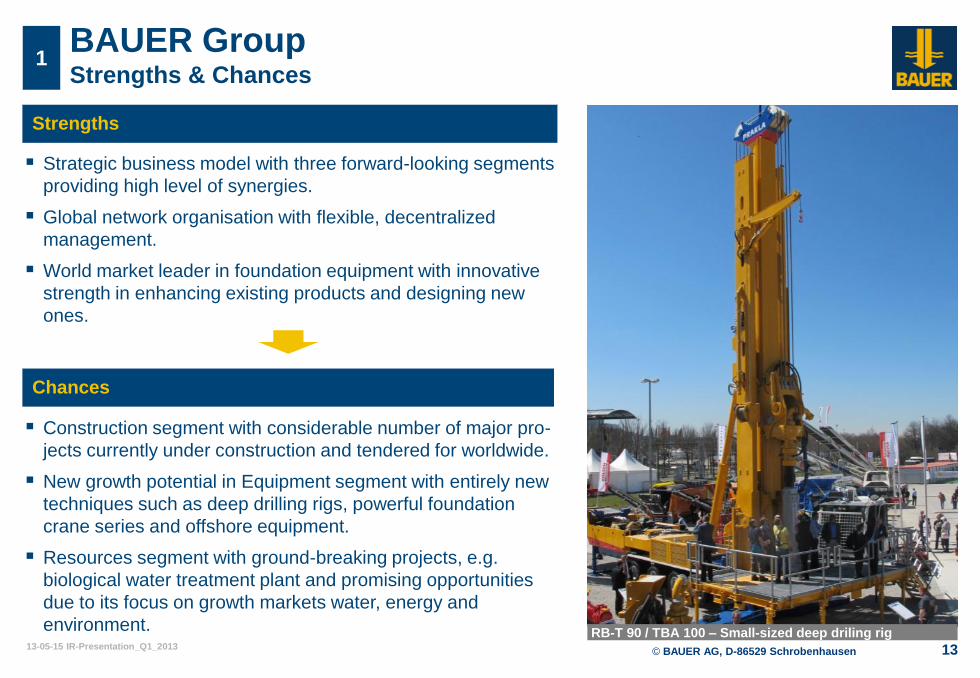
1 BAUER Group Strengths & Chances
Strategic business model with three forward-looking segments
providing high level of synergies.
Global network organisation with flexible, decentralized
management.
World market leader in foundation equipment with innovative
strength in enhancing existing products and designing new
ones.
Strengths
Chances
Construction segment with considerable number of major pro-
jects currently under construction and tendered for worldwide.
New growth potential in Equipment segment with entirely new
techniques such as deep drilling rigs, powerful foundation
crane series and offshore equipment.
Resources segment with ground-breaking projects, e.g.
biological water treatment plant and promising opportunities
due to its focus on growth markets water, energy and
environment. RB-T 90 / TBA 100 – Small-sized deep driling rig
© BAUER AG, D-86529 Schrobenhausen 13-05-15 IR-Presentation_Q1_2013
+
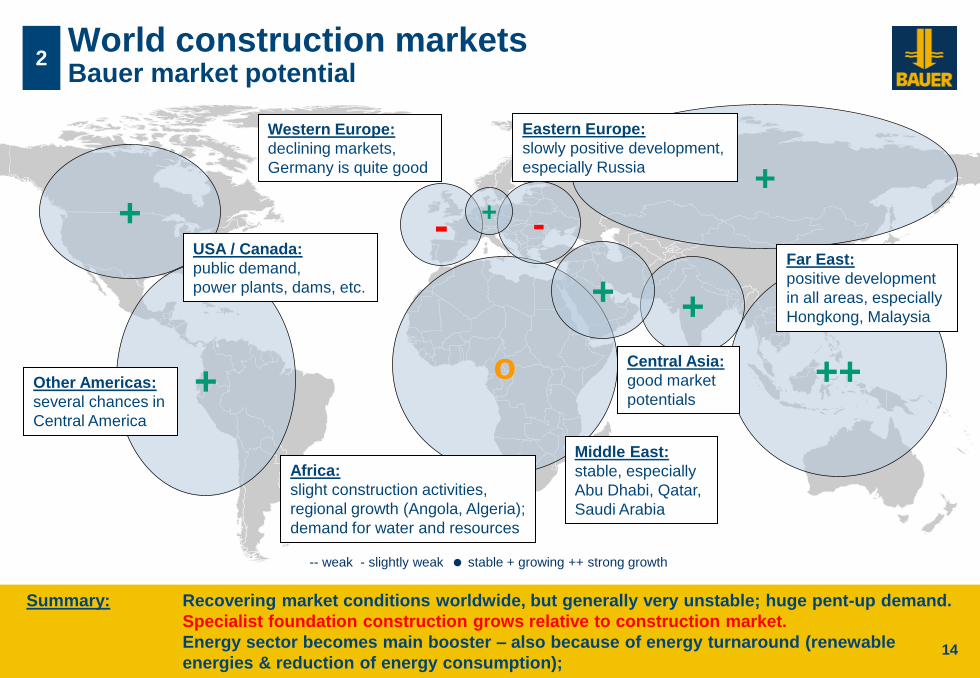
World construction markets Bauer market potential
2
14
-
Western Europe:
declining markets,
Germany is quite good +
+
++
Far East:
positive development
in all areas, especially
Hongkong, Malaysia
+ Other Americas:
several chances in
Central America
o
Africa:
slight construction activities,
regional growth (Angola, Algeria);
demand for water and resources
Summary: Recovering market conditions worldwide, but generally very unstable; huge pent-up demand.
Specialist foundation construction grows relative to construction market.
Energy sector becomes main booster – also because of energy turnaround (renewable
energies & reduction of energy consumption);
Middle East:
stable, especially
Abu Dhabi, Qatar,
Saudi Arabia
Eastern Europe:
slowly positive development,
especially Russia
Central Asia:
good market
potentials
USA / Canada:
public demand,
power plants, dams, etc.
14
-- weak - slightly weak stable + growing ++ strong growth
-
+
+
© BAUER AG, D-86529 Schrobenhausen 13-05-15 IR-Presentation_Q1_2013 15
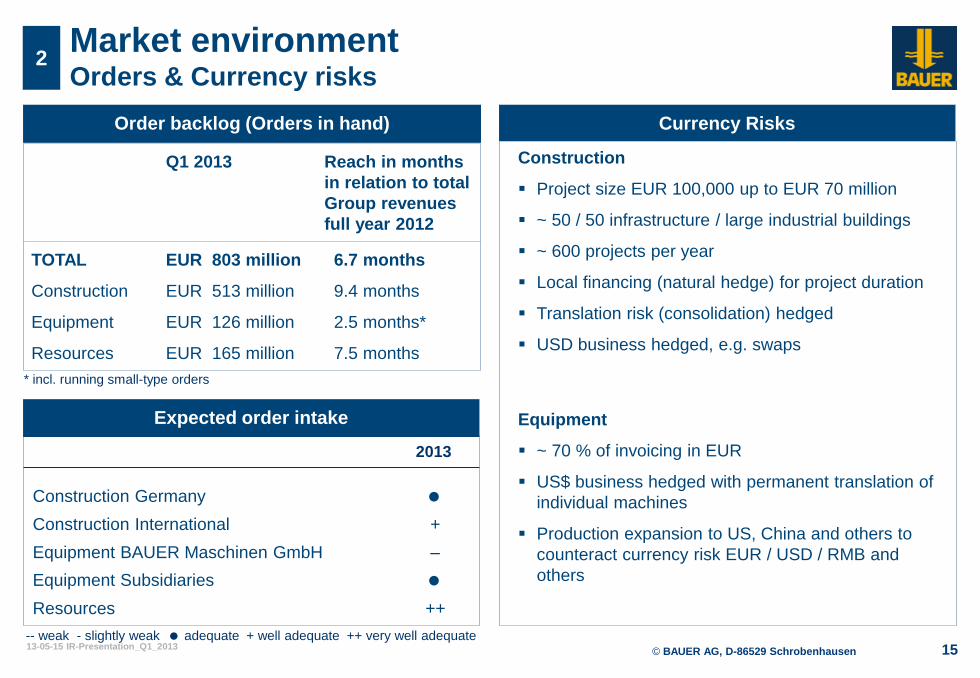
Market environment Orders & Currency risks
2
Order backlog (Orders in hand) Currency Risks
Expected order intake
2013
Construction Germany
Construction International +
Equipment BAUER Maschinen GmbH –
Equipment Subsidiaries
Resources ++
-- weak - slightly weak adequate + well adequate ++ very well adequate
Q1 2013 Reach in months
in relation to total
Group revenues
full year 2012
TOTAL
Construction
Equipment
Resources
EUR 803 million
EUR 513 million
EUR 126 million
EUR 165 million
6.7 months
9.4 months
2.5 months*
7.5 months
* incl. running small-type orders
Construction
Project size EUR 100,000 up to EUR 70 million
~ 50 / 50 infrastructure / large industrial buildings
~ 600 projects per year
Local financing (natural hedge) for project duration
Translation risk (consolidation) hedged
USD business hedged, e.g. swaps
Equipment
~ 70 % of invoicing in EUR
US$ business hedged with permanent translation of
individual machines
Production expansion to US, China and others to
counteract currency risk EUR / USD / RMB and
others
© BAUER AG, D-86529 Schrobenhausen 13-05-15 IR-Presentation_Q1_2013 16
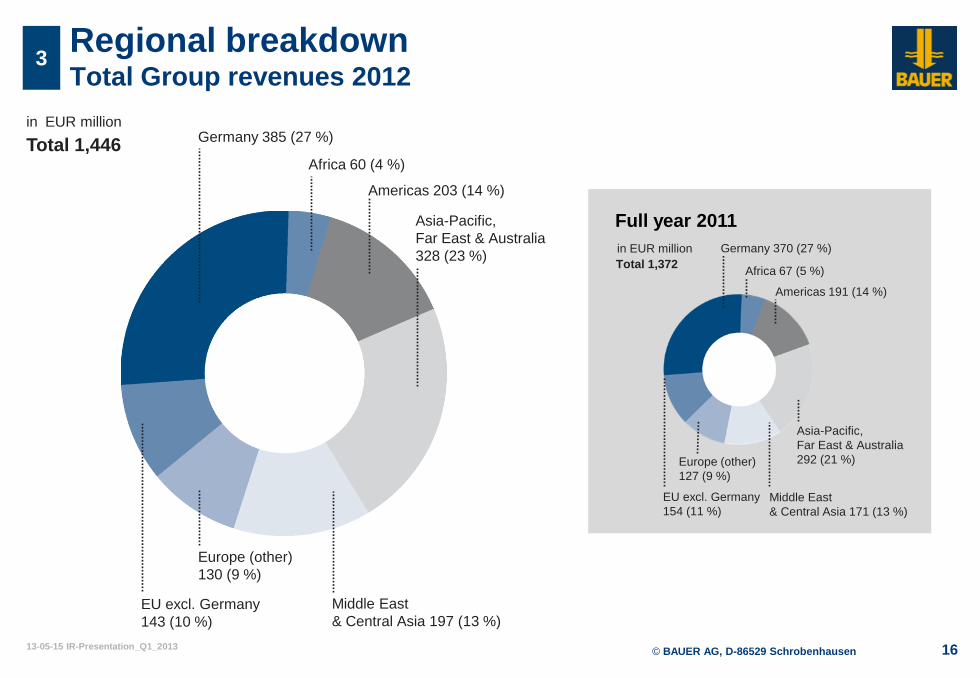
3 Regional breakdown Total Group revenues 2012
in EUR million
Total 1,446
in EUR million
Africa 67 (5 %)
Americas 191 (14 %)
Asia-Pacific,
Far East & Australia
292 (21 %)
Middle East
& Central Asia 171 (13 %)
Germany 370 (27 %)
EU excl. Germany
154 (11 %)
Europe (other)
127 (9 %)
Total 1,372
Full year 2011
Africa 60 (4 %)
Americas 203 (14 %)
Asia-Pacific,
Far East & Australia
328 (23 %)
Middle East
& Central Asia 197 (13 %)
Germany 385 (27 %)
EU excl. Germany
143 (10 %)
Europe (other)
130 (9 %)
© BAUER AG, D-86529 Schrobenhausen 13-05-15 IR-Presentation_Q1_2013 17
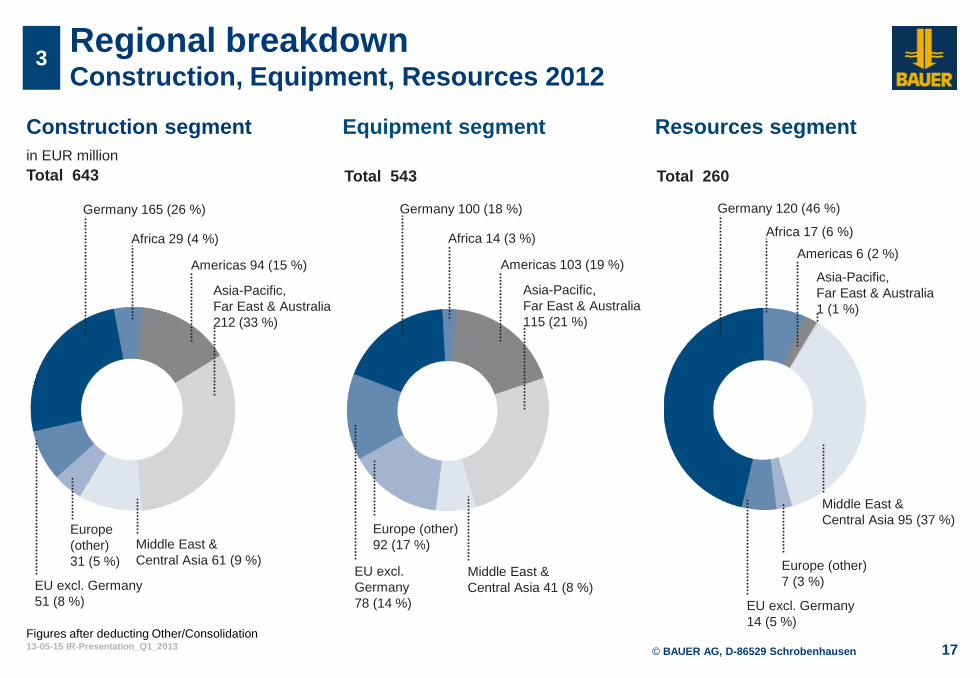
3 Regional breakdown Construction, Equipment, Resources 2012
Figures after deducting Other/Consolidation
in EUR million
Total 643 Total 543 Total 260
Construction segment Equipment segment Resources segment
Africa 29 (4 %)
Americas 94 (15 %)
Asia-Pacific,
Far East & Australia
212 (33 %)
Middle East &
Central Asia 61 (9 %)
Germany 165 (26 %)
EU excl. Germany
51 (8 %)
Europe
(other)
31 (5 %)
Africa 14 (3 %)
Americas 103 (19 %)
Asia-Pacific,
Far East & Australia
115 (21 %)
Middle East &
Central Asia 41 (8 %)
Germany 100 (18 %)
EU excl.
Germany
78 (14 %)
Europe (other)
92 (17 %)
Africa 17 (6 %)
Americas 6 (2 %)
Asia-Pacific,
Far East & Australia
1 (1 %)
Middle East &
Central Asia 95 (37 %)
Germany 120 (46 %)
EU excl. Germany
14 (5 %)
Europe (other)
7 (3 %)
© BAUER AG, D-86529 Schrobenhausen 13-05-15 IR-Presentation_Q1_2013 18
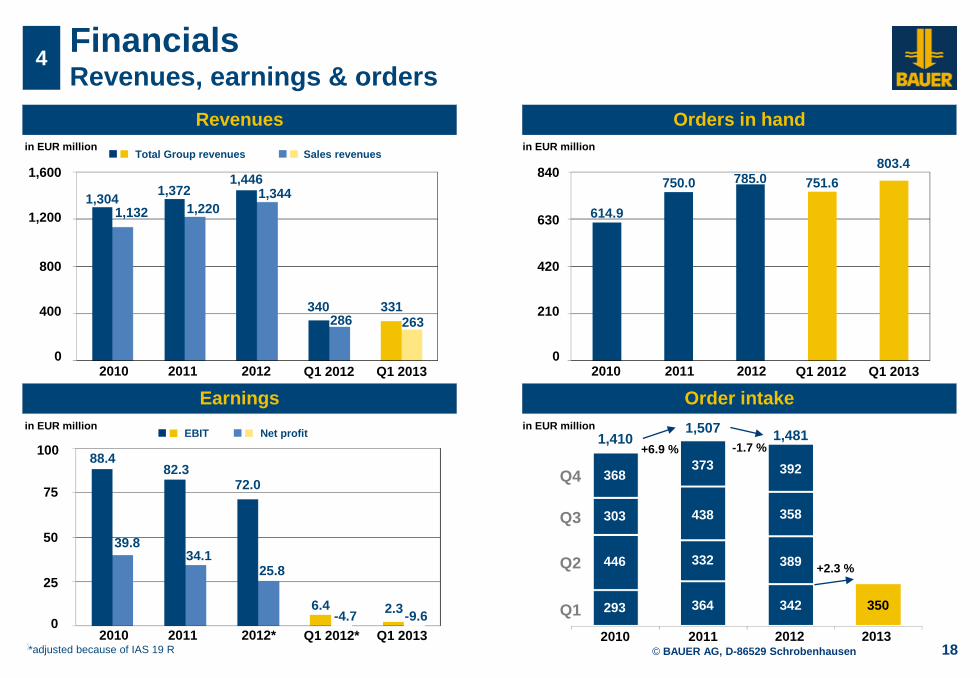
Revenues
Earnings
Financials Revenues, earnings & orders
4
2012 Q1 2012
1,600
1,200
800
400
0
1,304 1,132
100
75
50
25
0
88.4
39.8
Orders in hand
840
630
420
210
0
614.9
Order intake
2012 2013
303
446
293
2011
2011
2010
2010
368
1,410
1,372
1,220
750.0
82.3
34.1
364
332
438
373
1,507
+6.9 %
Q1
Q2
Q3
Q4
1,446 1,344
Q1 2013
2012* Q1 2012* 2011 2010 Q1 2013
72.0
25.8
2012 Q1 2012 2011 2010 Q1 2013
785.0 751.6
350
Total Group revenues Sales revenues
EBIT Net profit
in EUR million
in EUR million in EUR million
in EUR million
340 286
331 263
803.4
6.4 -4.7
2.3 -9.6
342
389
358
392
1,481 -1.7 %
+2.3 %
*adjusted because of IAS 19 R
© BAUER AG, D-86529 Schrobenhausen 13-05-15 IR-Presentation_Q1_2013 19
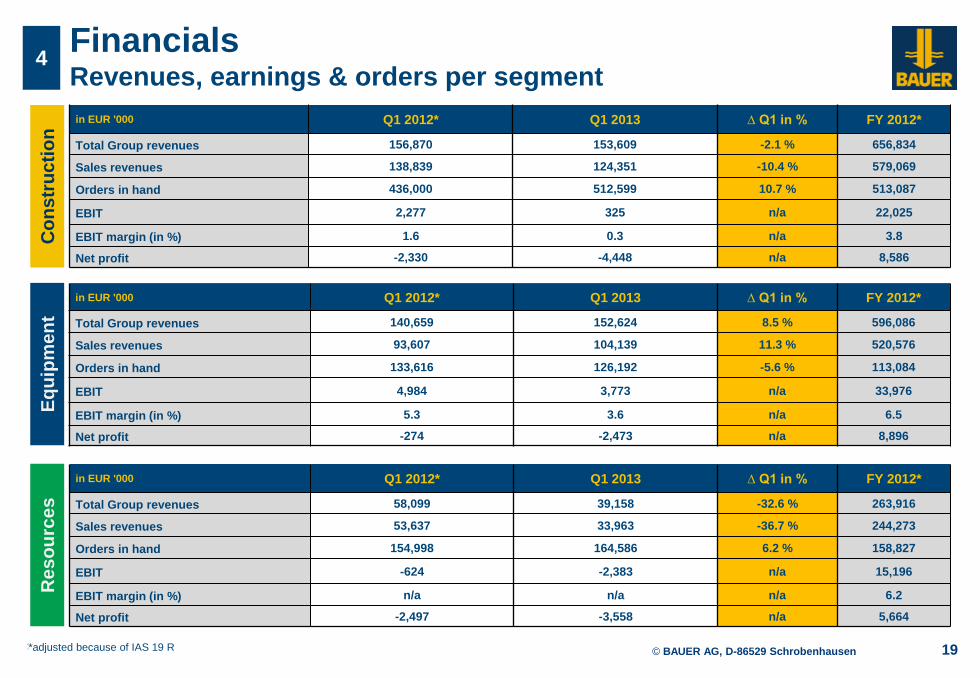
Financials Revenues, earnings & orders per segment
4 C
on
str
uc
tio
n
Eq
uip
me
nt
in EUR '000 Q1 2012* Q1 2013 ∆ Q1 in % FY 2012*
Total Group revenues 140,659 152,624 8.5 % 596,086
Sales revenues 93,607 104,139 11.3 % 520,576
Orders in hand 133,616 126,192 -5.6 % 113,084
EBIT 4,984 3,773 n/a 33,976
EBIT margin (in %) 5.3 3.6 n/a 6.5
Net profit -274 -2,473 n/a 8,896
Re
so
urc
es
in EUR '000 Q1 2012* Q1 2013 ∆ Q1 in % FY 2012*
Total Group revenues 156,870 153,609 -2.1 % 656,834
Sales revenues 138,839 124,351 -10.4 % 579,069
Orders in hand 436,000 512,599 10.7 % 513,087
EBIT 2,277 325 n/a 22,025
EBIT margin (in %) 1.6 0.3 n/a 3.8
Net profit -2,330 -4,448 n/a 8,586
in EUR '000 Q1 2012* Q1 2013 ∆ Q1 in % FY 2012*
Total Group revenues 58,099 39,158 -32.6 % 263,916
Sales revenues 53,637 33,963 -36.7 % 244,273
Orders in hand 154,998 164,586 6.2 % 158,827
EBIT -624 -2,383 n/a 15,196
EBIT margin (in %) n/a n/a n/a 6.2
Net profit -2,497 -3,558 n/a 5,664
*adjusted because of IAS 19 R
© BAUER AG, D-86529 Schrobenhausen 13-05-15 IR-Presentation_Q1_2013 20
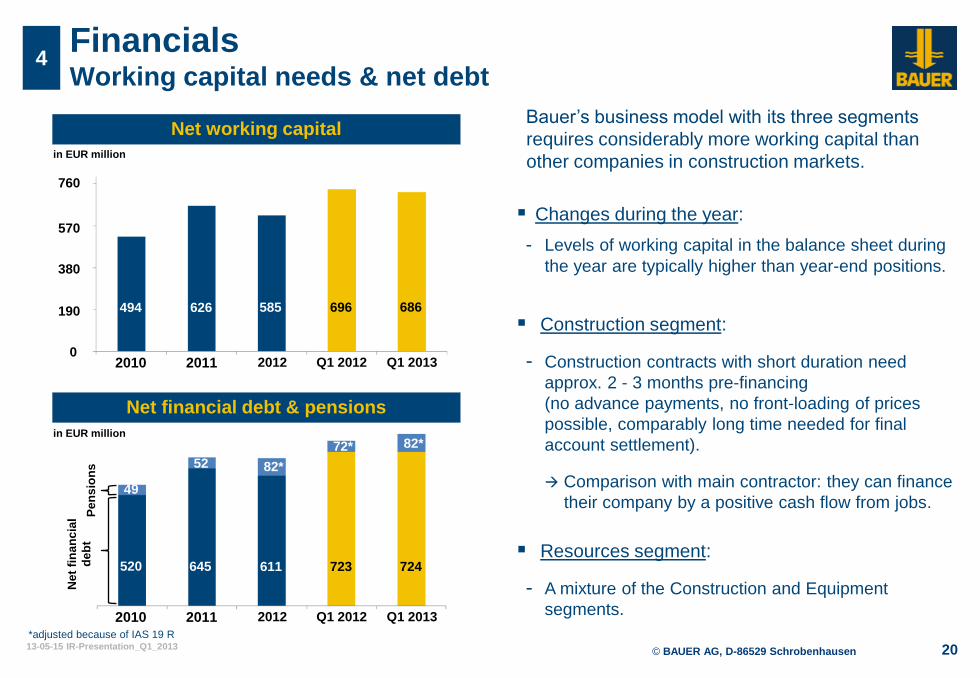
Financials Working capital needs & net debt
4
Net financial debt & pensions
Net
fin
an
cia
l
de
bt
Pe
ns
ion
s
520
49
Net working capital
2010 2011
494
760
570
380
190
0
626
645
52
2012 Q1 2012 Q1 2013
585 696
2010 2011 2012 Q1 2012 Q1 2013
82*
72*
611 723
Bauer’s business model with its three segments
requires considerably more working capital than
other companies in construction markets.
Changes during the year:
- Levels of working capital in the balance sheet during
the year are typically higher than year-end positions.
Construction segment:
- Construction contracts with short duration need
approx. 2 - 3 months pre-financing
(no advance payments, no front-loading of prices
possible, comparably long time needed for final
account settlement).
Comparison with main contractor: they can finance
their company by a positive cash flow from jobs.
Resources segment:
- A mixture of the Construction and Equipment
segments.
724
82*
*adjusted because of IAS 19 R
in EUR million
in EUR million
686
© BAUER AG, D-86529 Schrobenhausen 13-05-15 IR-Presentation_Q1_2013 21
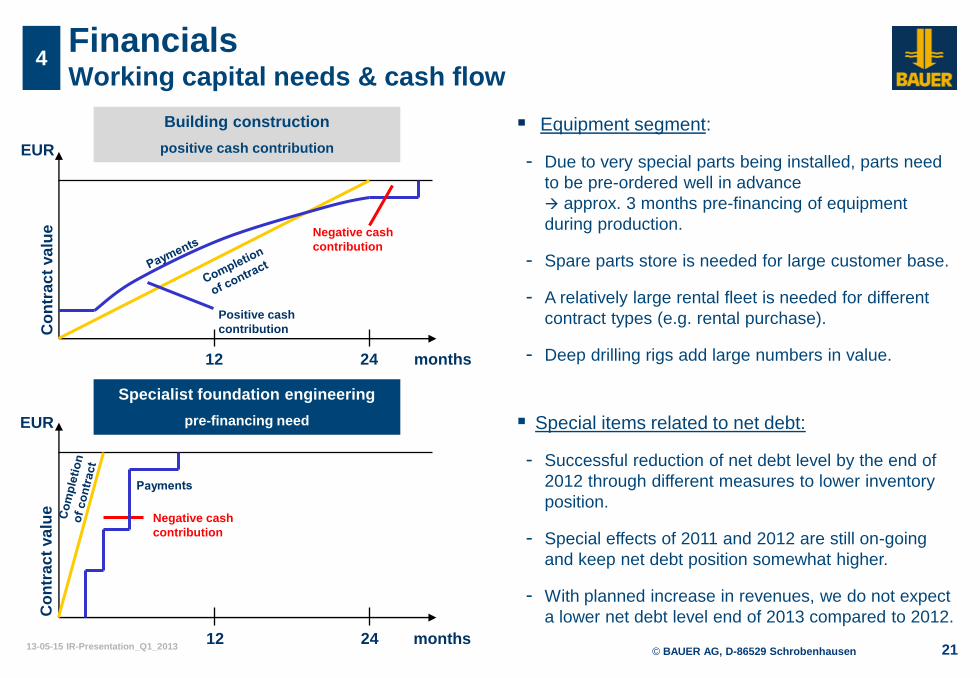
Building construction
positive cash contribution
Specialist foundation engineering
pre-financing need
Financials Working capital needs & cash flow
4
EUR
12 24 months
Positive cash
contribution
Negative cash
contribution
Co
ntr
ac
t va
lue
EUR
Negative cash
contribution
12 24 months
Co
ntr
ac
t va
lue
Equipment segment:
- Due to very special parts being installed, parts need
to be pre-ordered well in advance
approx. 3 months pre-financing of equipment
during production.
- Spare parts store is needed for large customer base.
- A relatively large rental fleet is needed for different
contract types (e.g. rental purchase).
- Deep drilling rigs add large numbers in value.
Special items related to net debt:
- Successful reduction of net debt level by the end of
2012 through different measures to lower inventory
position.
- Special effects of 2011 and 2012 are still on-going
and keep net debt position somewhat higher.
- With planned increase in revenues, we do not expect
a lower net debt level end of 2013 compared to 2012.
© BAUER AG, D-86529 Schrobenhausen 13-05-15 IR-Presentation_Q1_2013 22
Financials Income statement 3M 2013
4
*adjusted because of IAS 19 R
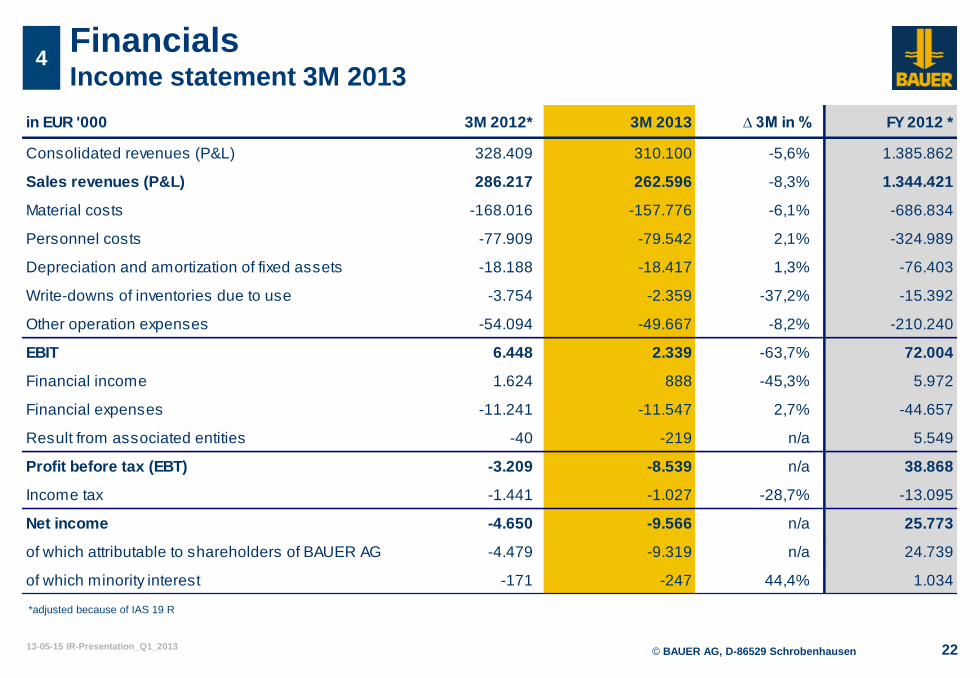
in EUR '000 3M 2012* 3M 2013 ∆ 3M in % FY 2012 *
Consolidated revenues (P&L) 328.409 310.100 -5,6% 1.385.862
Sales revenues (P&L) 286.217 262.596 -8,3% 1.344.421
Material costs -168.016 -157.776 -6,1% -686.834
Personnel costs -77.909 -79.542 2,1% -324.989
Depreciation and amortization of fixed assets -18.188 -18.417 1,3% -76.403
Write-downs of inventories due to use -3.754 -2.359 -37,2% -15.392
Other operation expenses -54.094 -49.667 -8,2% -210.240
EBIT 6.448 2.339 -63,7% 72.004
Financial income 1.624 888 -45,3% 5.972
Financial expenses -11.241 -11.547 2,7% -44.657
Result from associated entities -40 -219 n/a 5.549
Profit before tax (EBT) -3.209 -8.539 n/a 38.868
Income tax -1.441 -1.027 -28,7% -13.095
Net income -4.650 -9.566 n/a 25.773
of which attributable to shareholders of BAUER AG -4.479 -9.319 n/a 24.739
of which minority interest -171 -247 44,4% 1.034
© BAUER AG, D-86529 Schrobenhausen 13-05-15 IR-Presentation_Q1_2013 23
Financials Balance sheet March 31, 2013
4
(a) Other provisions also include short term portion of pension provisions *adjusted because of IAS 19 R
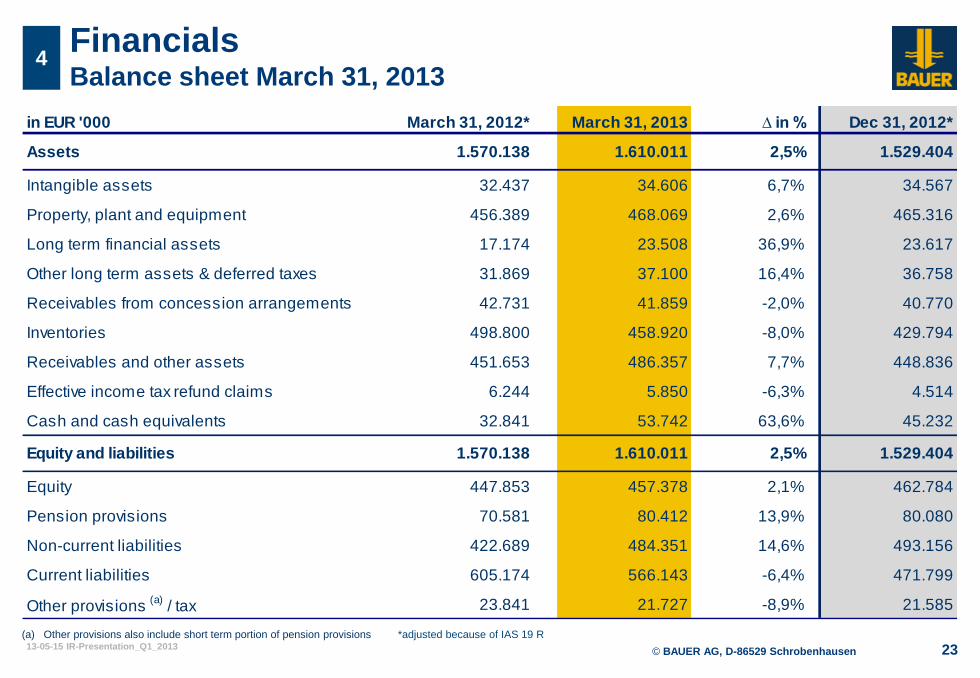
in EUR '000 March 31, 2012* March 31, 2013 ∆ in % Dec 31, 2012*
Assets 1.570.138 1.610.011 2,5% 1.529.404
Intangible assets 32.437 34.606 6,7% 34.567
Property, plant and equipment 456.389 468.069 2,6% 465.316
Long term financial assets 17.174 23.508 36,9% 23.617
Other long term assets & deferred taxes 31.869 37.100 16,4% 36.758
Receivables from concession arrangements 42.731 41.859 -2,0% 40.770
Inventories 498.800 458.920 -8,0% 429.794
Receivables and other assets 451.653 486.357 7,7% 448.836
Effective income tax refund claims 6.244 5.850 -6,3% 4.514
Cash and cash equivalents 32.841 53.742 63,6% 45.232
Equity and liabilities 1.570.138 1.610.011 2,5% 1.529.404
Equity 447.853 457.378 2,1% 462.784
Pension provisions 70.581 80.412 13,9% 80.080
Non-current liabilities 422.689 484.351 14,6% 493.156
Current liabilities 605.174 566.143 -6,4% 471.799
Other provisions (a)
/ tax 23.841 21.727 -8,9% 21.585
© BAUER AG, D-86529 Schrobenhausen 13-05-15 IR-Presentation_Q1_2013 24
Financials Cash flow statement 3M 2013
4
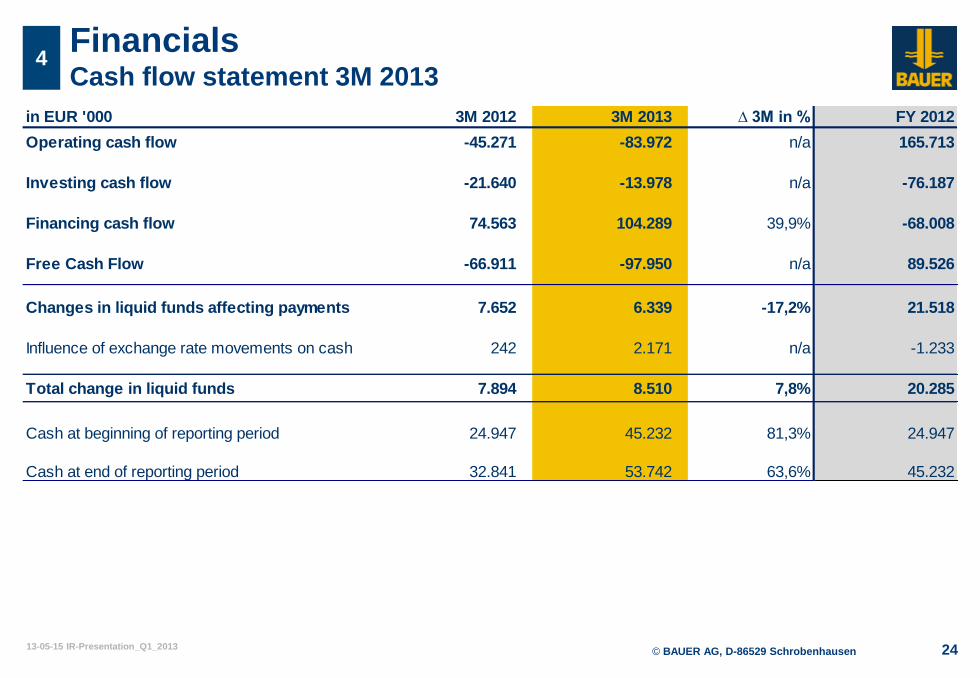
in EUR '000 3M 2012 3M 2013 ∆ 3M in % FY 2012
Operating cash flow -45.271 -83.972 n/a 165.713
Investing cash flow -21.640 -13.978 n/a -76.187
Financing cash flow 74.563 104.289 39,9% -68.008
Free Cash Flow -66.911 -97.950 n/a 89.526
Changes in liquid funds affecting payments 7.652 6.339 -17,2% 21.518
Influence of exchange rate movements on cash 242 2.171 n/a -1.233
Total change in liquid funds 7.894 8.510 7,8% 20.285
Cash at beginning of reporting period 24.947 45.232 81,3% 24.947
Cash at end of reporting period 32.841 53.742 63,6% 45.232
© BAUER AG, D-86529 Schrobenhausen 13-05-15 IR-Presentation_Q1_2013 25
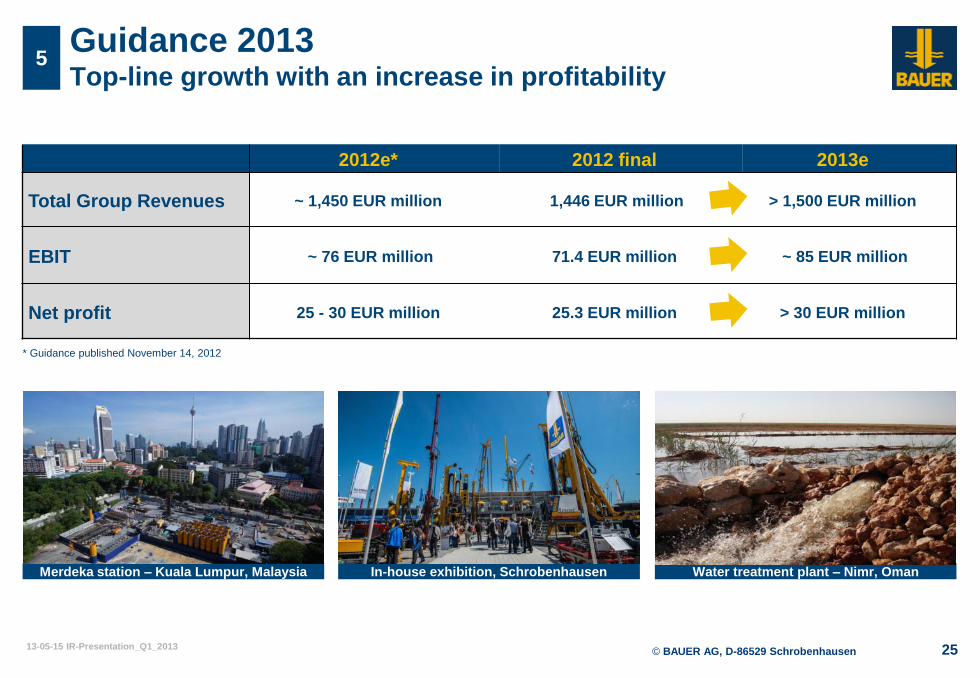
Guidance 2013 Top-line growth with an increase in profitability
5
2012e* 2012 final 2013e
Total Group Revenues ~ 1,450 EUR million 1,446 EUR million > 1,500 EUR million
EBIT ~ 76 EUR million 71.4 EUR million ~ 85 EUR million
Net profit 25 - 30 EUR million 25.3 EUR million > 30 EUR million
Merdeka station – Kuala Lumpur, Malaysia In-house exhibition, Schrobenhausen Water treatment plant – Nimr, Oman
* Guidance published November 14, 2012
© BAUER AG, D-86529 Schrobenhausen 13-05-15 IR-Presentation_Q1_2013 26
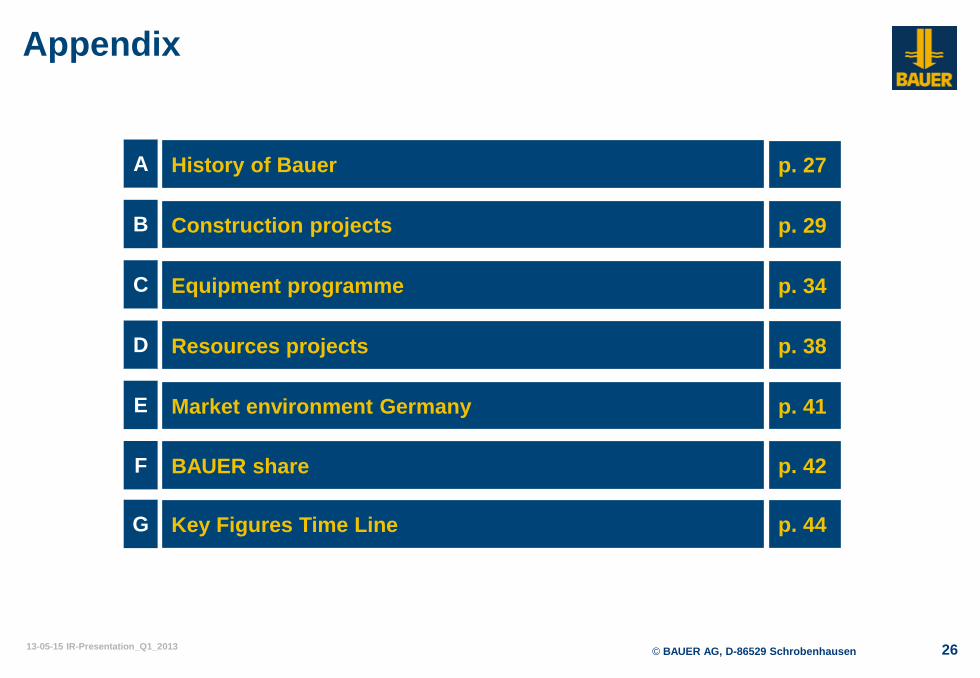
Appendix
Equipment programme C
Resources projects D
History of Bauer A
E Market environment Germany
F BAUER share
Construction projects B
p. 27
p. 29
p. 34
p. 38
p. 41
p. 42
G Key Figures Time Line p. 44
© BAUER AG, D-86529 Schrobenhausen 13-05-15 IR-Presentation_Q1_2013 27
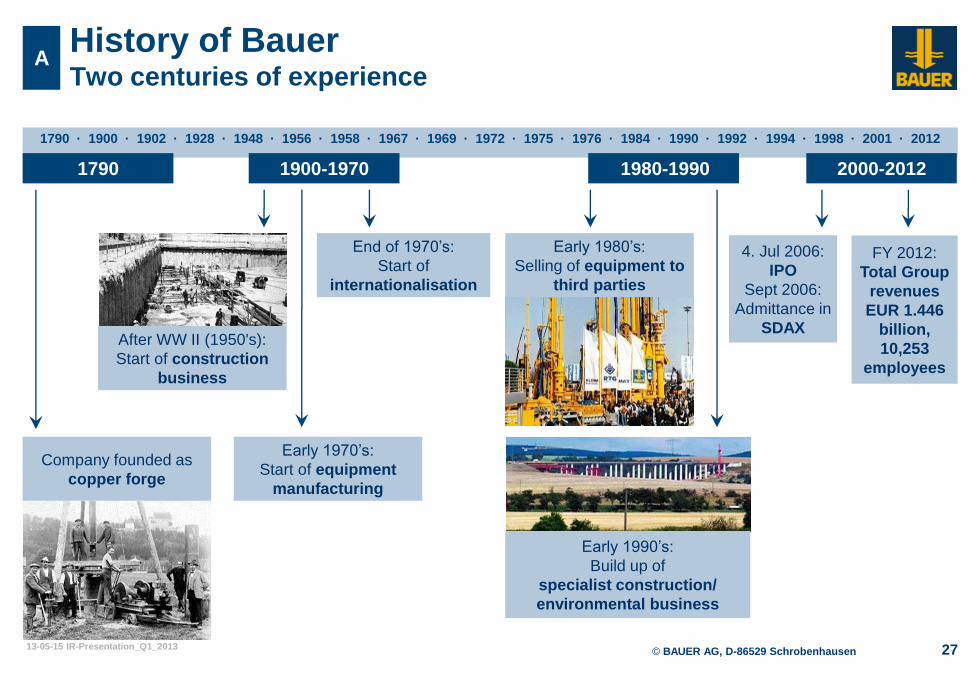
1790 · 1900 · 1902 · 1928 · 1948 · 1956 · 1958 · 1967 · 1969 · 1972 · 1975 · 1976 · 1984 · 1990 · 1992 · 1994 · 1998 · 2001 · 2012
History of Bauer Two centuries of experience
End of 1970’s:
Start of
internationalisation
Early 1990’s:
Build up of
specialist construction/
environmental business
FY 2012:
Total Group
revenues
EUR 1.446
billion,
10,253
employees
4. Jul 2006:
IPO
Sept 2006:
Admittance in
SDAX
A
Early 1970’s:
Start of equipment
manufacturing
Company founded as
copper forge
After WW II (1950's):
Start of construction
business
Early 1980’s:
Selling of equipment to
third parties
1790 1900-1970 1980-1990 2000-2012
© BAUER AG, D-86529 Schrobenhausen 13-05-15 IR-Presentation_Q1_2013 28
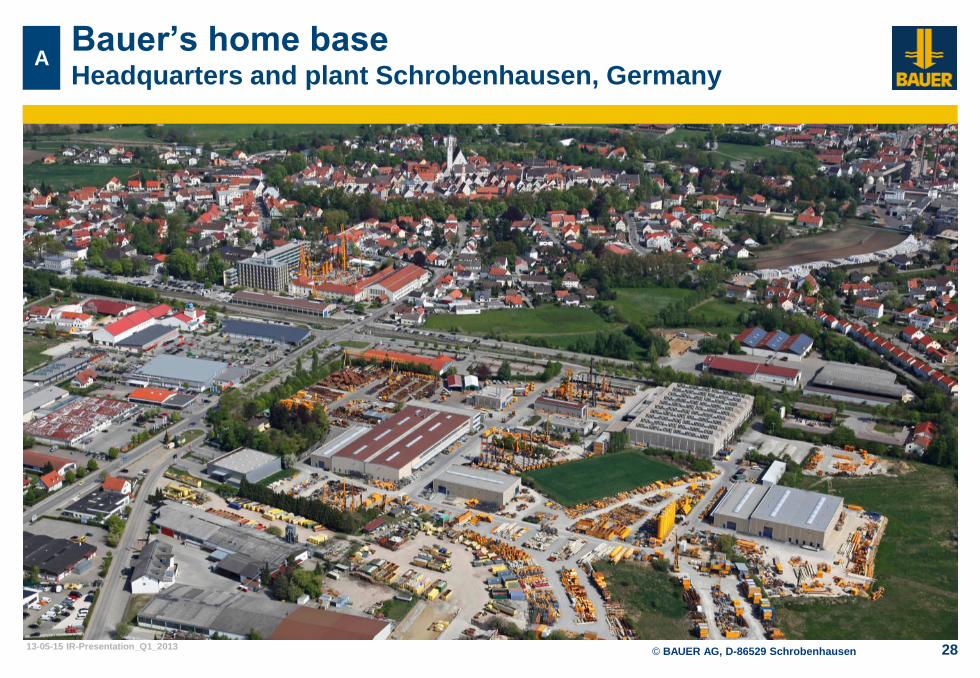
A Bauer’s home base Headquarters and plant Schrobenhausen, Germany
© BAUER AG, D-86529 Schrobenhausen 13-05-15 IR-Presentation_Q1_2013 29
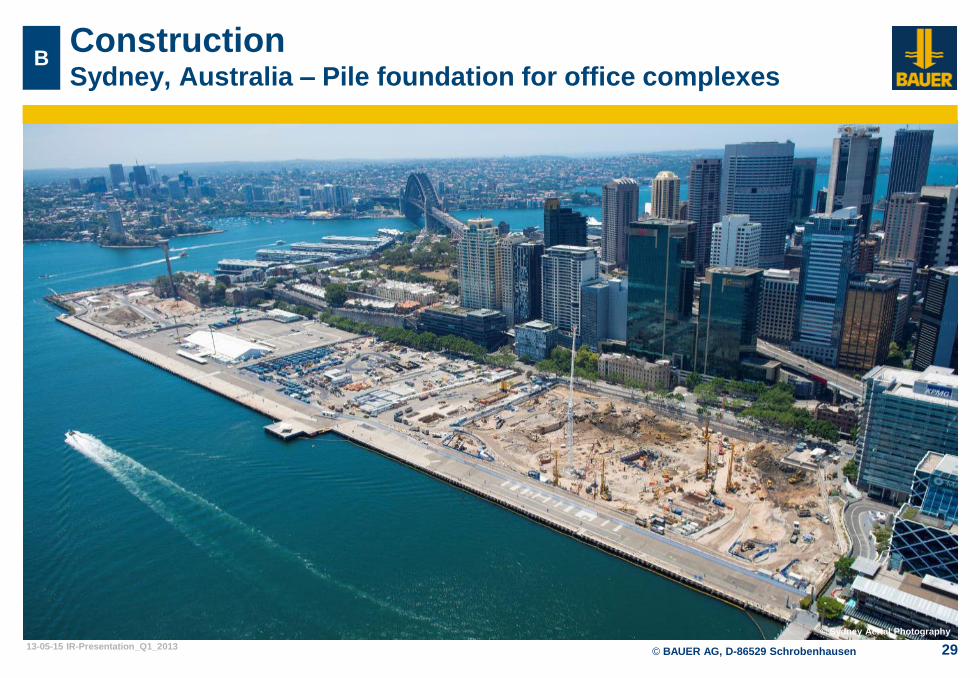
B Construction Sydney, Australia – Pile foundation for office complexes
© Sydney Aerial Photography
© BAUER AG, D-86529 Schrobenhausen 13-05-15 IR-Presentation_Q1_2013 30
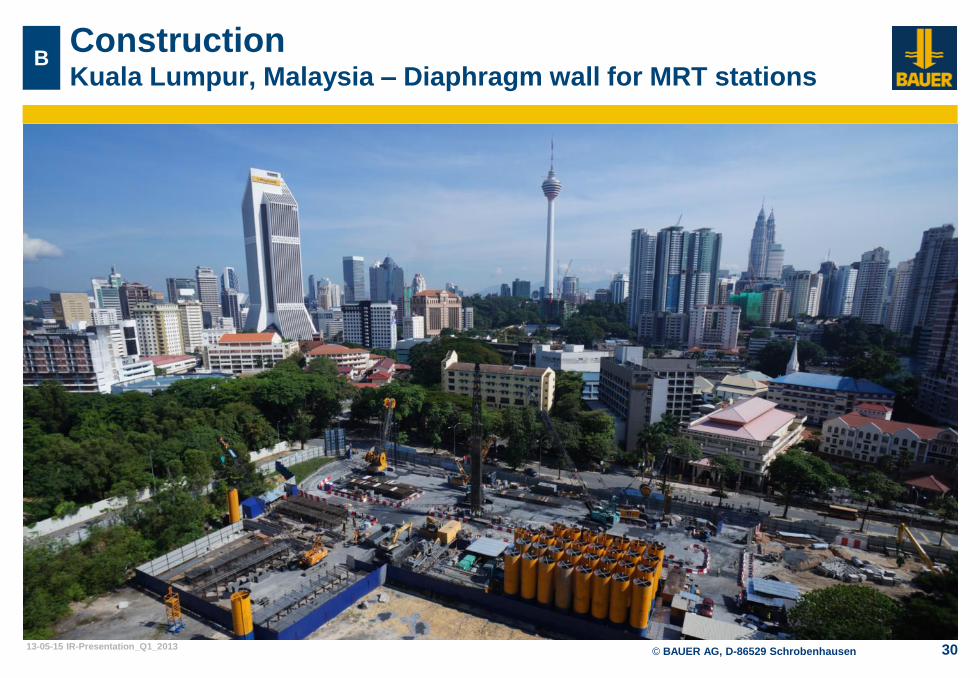
Construction Kuala Lumpur, Malaysia – Diaphragm wall for MRT stations
B
© BAUER AG, D-86529 Schrobenhausen 13-05-15 IR-Presentation_Q1_2013 31
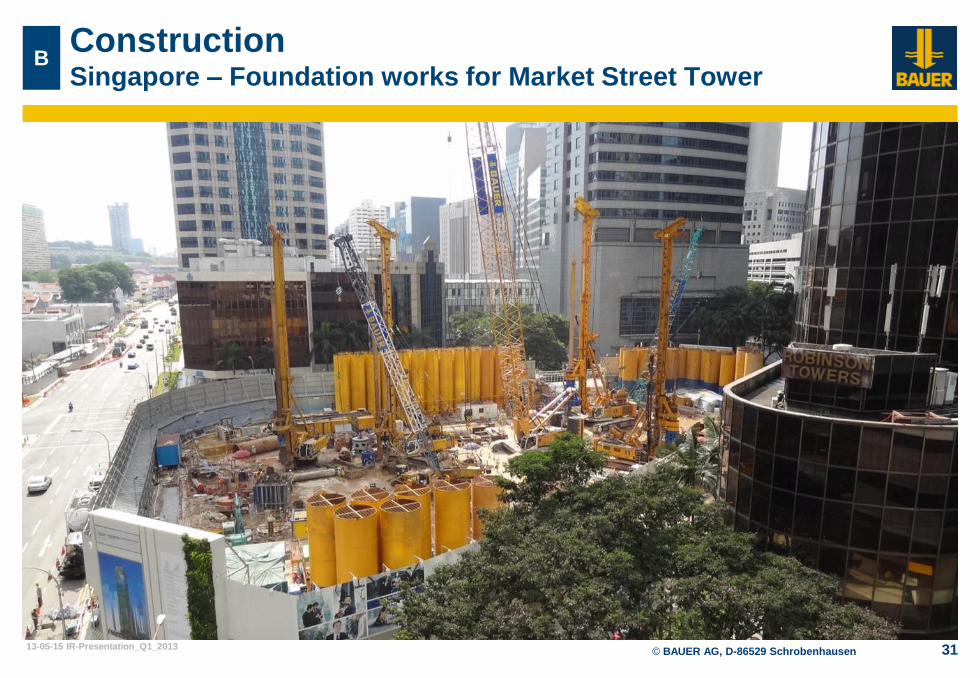
Construction Singapore – Foundation works for Market Street Tower
B
© BAUER AG, D-86529 Schrobenhausen 13-05-15 IR-Presentation_Q1_2013 32
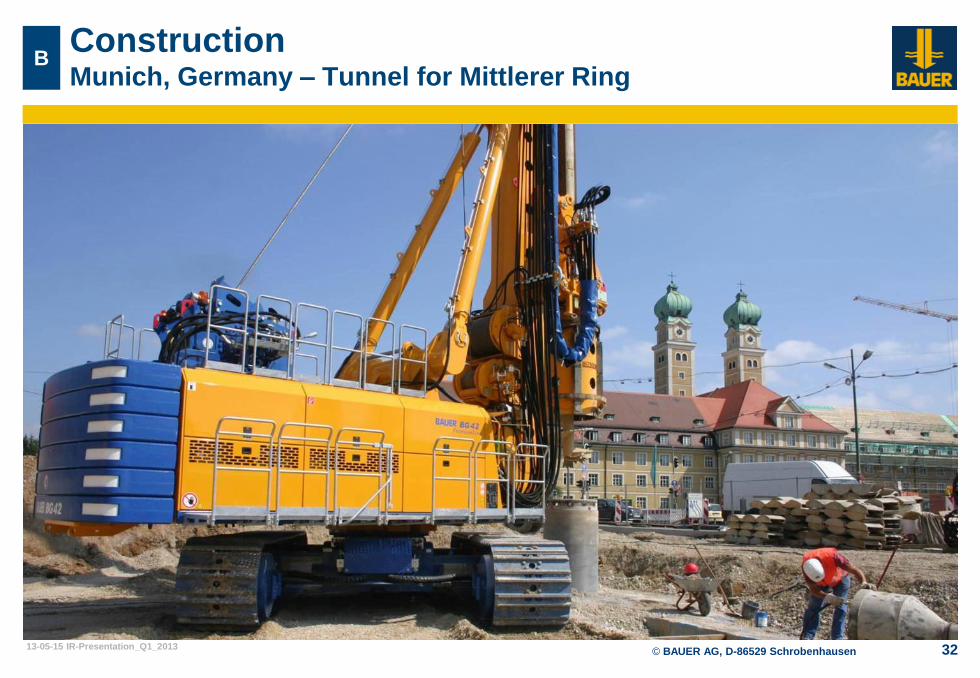
Construction Munich, Germany – Tunnel for Mittlerer Ring
B
© BAUER AG, D-86529 Schrobenhausen 13-05-15 IR-Presentation_Q1_2013 33
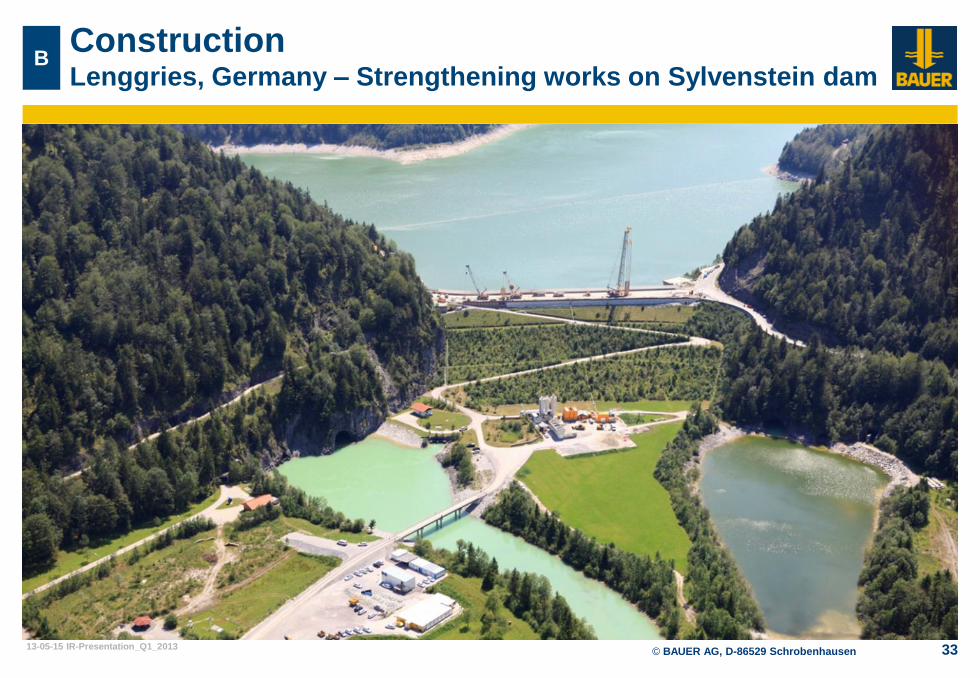
Construction Lenggries, Germany – Strengthening works on Sylvenstein dam
B
© BAUER AG, D-86529 Schrobenhausen 13-05-15 IR-Presentation_Q1_2013 34
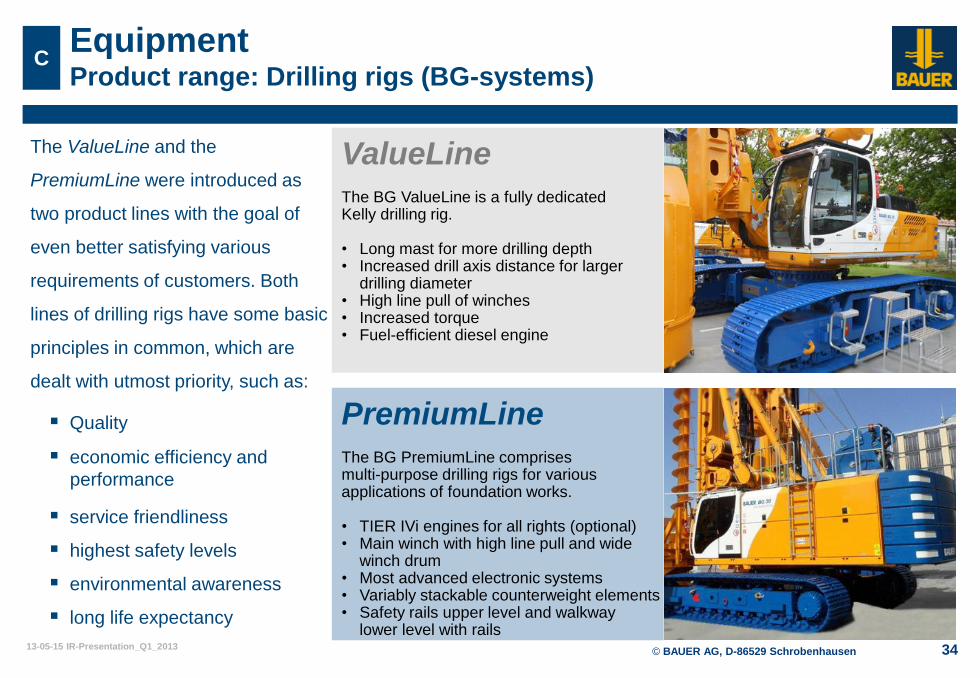
Equipment Product range: Drilling rigs (BG-systems)
C
ValueLine The BG ValueLine is a fully dedicated Kelly drilling rig. • Long mast for more drilling depth • Increased drill axis distance for larger
drilling diameter • High line pull of winches • Increased torque • Fuel-efficient diesel engine
PremiumLine The BG PremiumLine comprises multi-purpose drilling rigs for various applications of foundation works. • TIER IVi engines for all rights (optional) • Main winch with high line pull and wide
winch drum • Most advanced electronic systems • Variably stackable counterweight elements • Safety rails upper level and walkway
lower level with rails
The ValueLine and the
PremiumLine were introduced as
two product lines with the goal of
even better satisfying various
requirements of customers. Both
lines of drilling rigs have some basic
principles in common, which are
dealt with utmost priority, such as:
Quality
economic efficiency and
performance
service friendliness
highest safety levels
environmental awareness
long life expectancy
© BAUER AG, D-86529 Schrobenhausen 13-05-15 IR-Presentation_Q1_2013 35
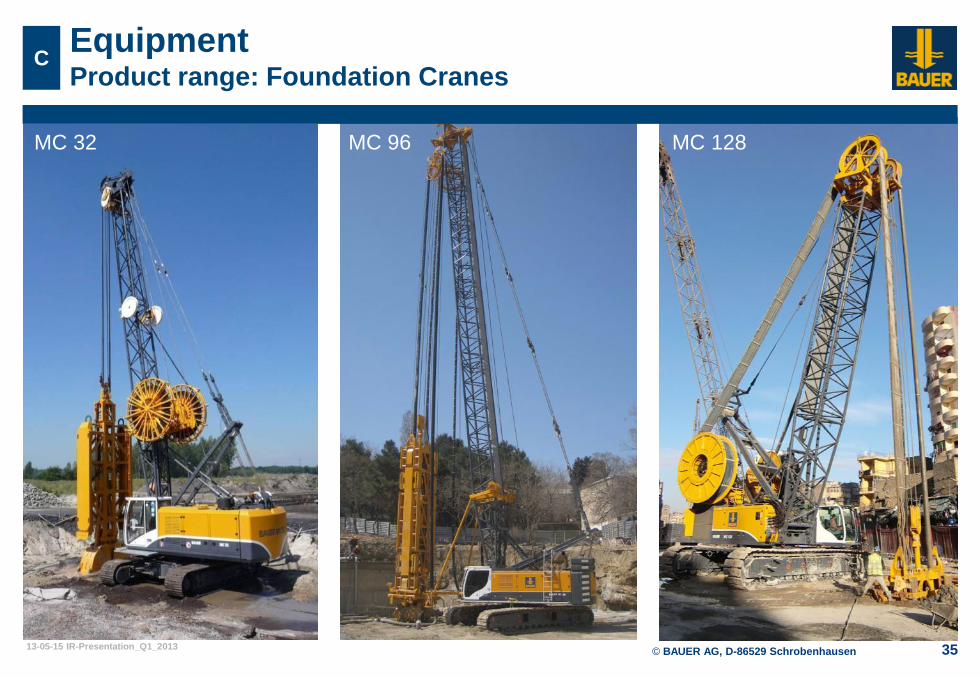
C Equipment Product range: Foundation Cranes
MC 128 MC 96 MC 32
© BAUER AG, D-86529 Schrobenhausen 13-05-15 IR-Presentation_Q1_2013 36
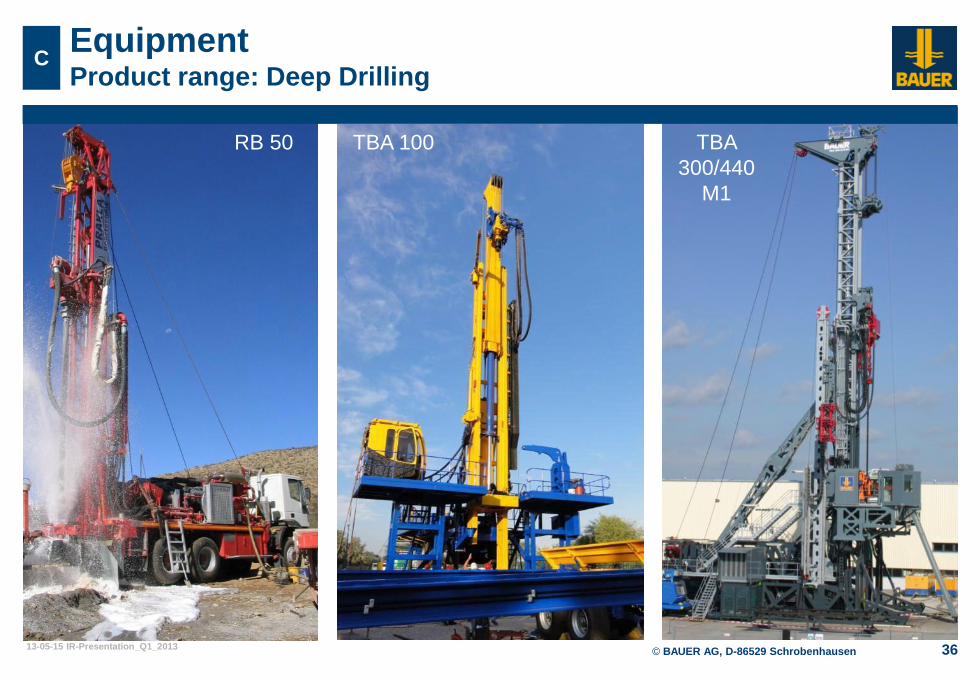
C Equipment Product range: Deep Drilling
RB 50 TBA 100 TBA
300/440
M1
© BAUER AG, D-86529 Schrobenhausen 13-05-15 IR-Presentation_Q1_2013 37
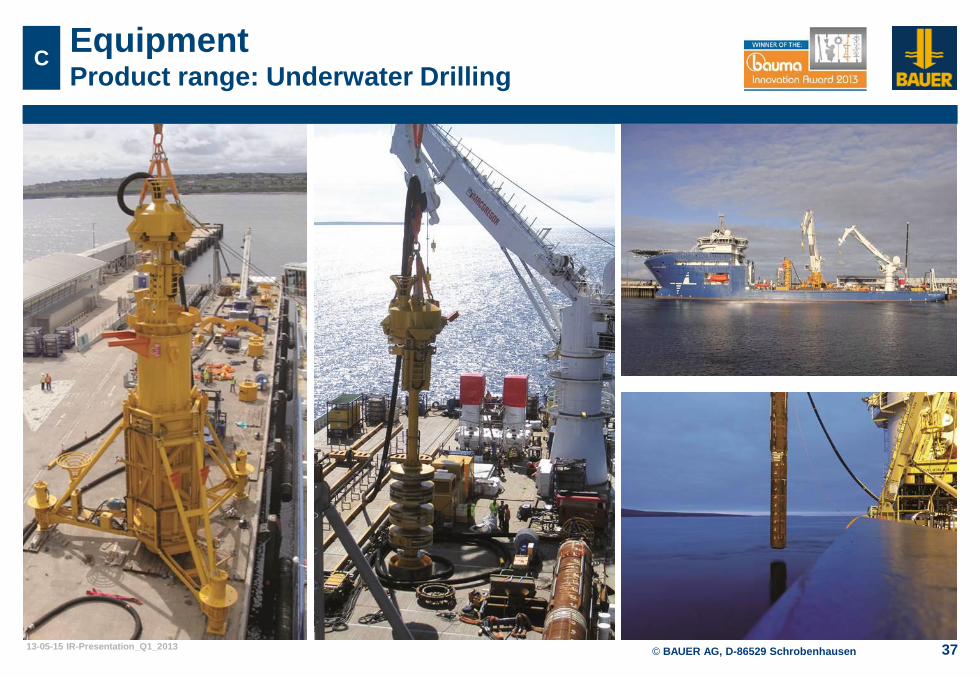
C Equipment Product range: Underwater Drilling
© BAUER AG, D-86529 Schrobenhausen 13-05-15 IR-Presentation_Q1_2013 38
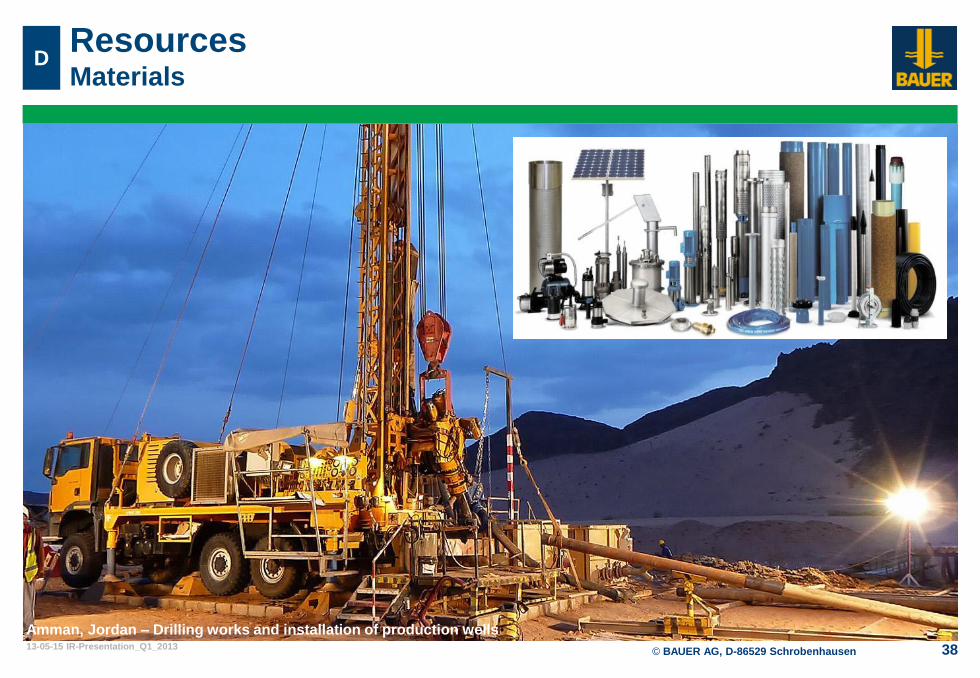
Resources Materials
D
Amman, Jordan – Drilling works and installation of production wells
© BAUER AG, D-86529 Schrobenhausen 13-05-15 IR-Presentation_Q1_2013 39
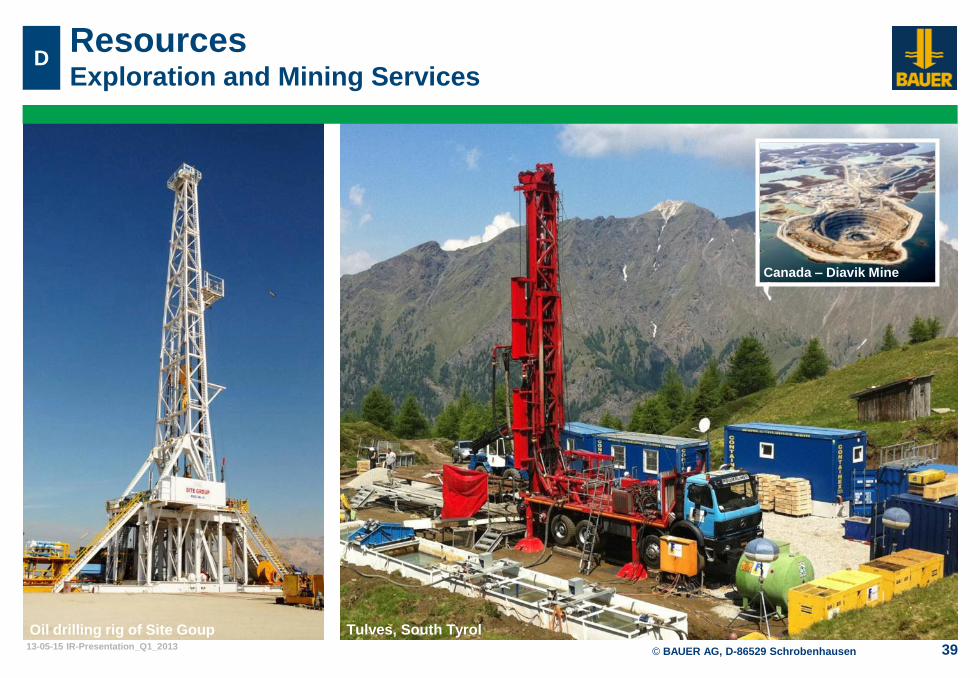
Resources Exploration and Mining Services
D
Oil drilling rig of Site Goup Tulves, South Tyrol
Canada – Diavik Mine
© BAUER AG, D-86529 Schrobenhausen 13-05-15 IR-Presentation_Q1_2013 40
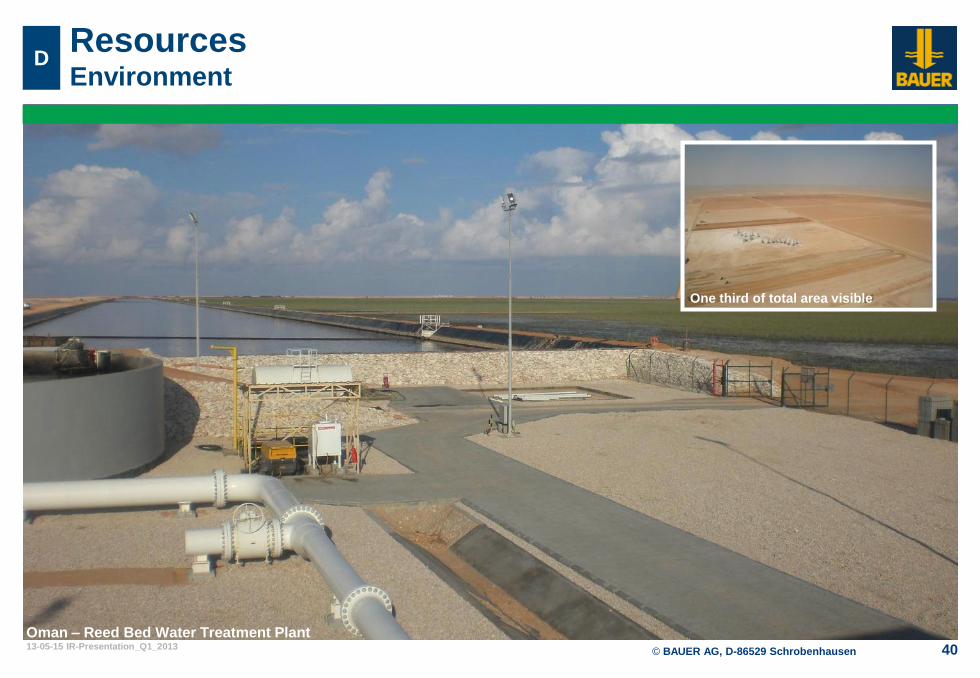
Resources Environment
D
Oman – Reed Bed Water Treatment Plant
One third of total area visible
© BAUER AG, D-86529 Schrobenhausen 13-05-15 IR-Presentation_Q1_2013 41
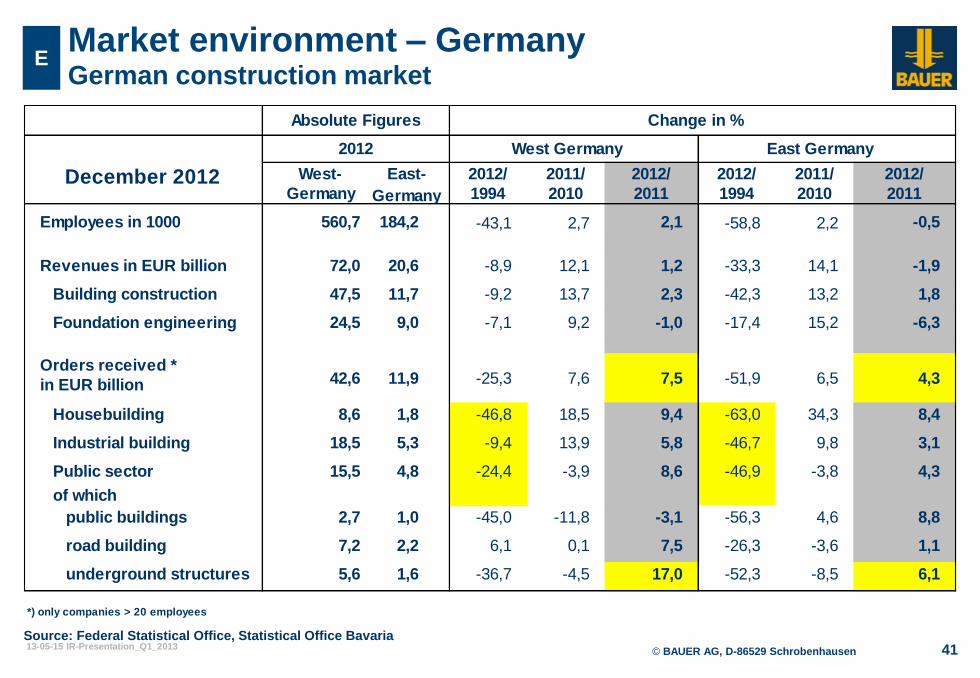
West-
Germany
Employees in 1000 560,7 184,2 -43,1 2,7 2,1 -58,8 2,2 -0,5
Revenues in EUR billion 72,0 20,6 -8,9 12,1 1,2 -33,3 14,1 -1,9
Building construction 47,5 11,7 -9,2 13,7 2,3 -42,3 13,2 1,8
Foundation engineering 24,5 9,0 -7,1 9,2 -1,0 -17,4 15,2 -6,3
Orders received *
in EUR billion
Housebuilding 8,6 1,8 -46,8 18,5 9,4 -63,0 34,3 8,4
Industrial building 18,5 5,3 -9,4 13,9 5,8 -46,7 9,8 3,1
Public sector
of which
public buildings 2,7 1,0 -45,0 -11,8 -3,1 -56,3 4,6 8,8
road building 7,2 2,2 6,1 0,1 7,5 -26,3 -3,6 1,1
underground structures 5,6 1,6 -36,7 -4,5 17,0 -52,3 -8,5 6,1
*) only companies > 20 employees
Absolute Figures
2012
8,6 -46,915,5 4,8 -3,8 4,3-24,4 -3,9
6,5
2011
4,3-25,3
1994
7,5
2010
7,6 -51,942,6 11,9
2011December 2012 2011/ 2012/
1994 2010
East-
Germany
2012/ 2012/
Change in %
West Germany East Germany
2011/2012/
Market environment – Germany German construction market
E
Source: Federal Statistical Office, Statistical Office Bavaria
© BAUER AG, D-86529 Schrobenhausen 13-05-15 IR-Presentation_Q1_2013 42
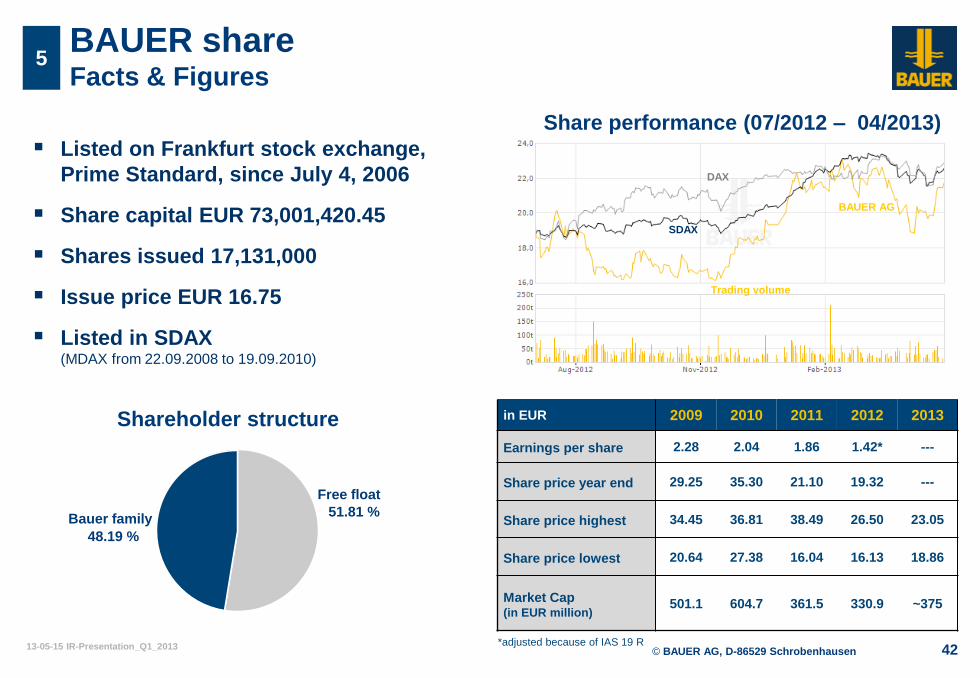
BAUER share Facts & Figures
5
Bauer family
48.19 %
Free float
51.81 %
Listed on Frankfurt stock exchange,
Prime Standard, since July 4, 2006
Share capital EUR 73,001,420.45
Shares issued 17,131,000
Issue price EUR 16.75
Listed in SDAX (MDAX from 22.09.2008 to 19.09.2010)
Shareholder structure
Share performance (07/2012 – 04/2013)
SDAX
DAX
Trading volume
BAUER AG
in EUR 2009 2010 2011 2012 2013
Earnings per share 2.28 2.04 1.86 1.42* ---
Share price year end 29.25 35.30 21.10 19.32 ---
Share price highest 34.45 36.81 38.49 26.50 23.05
Share price lowest 20.64 27.38 16.04 16.13 18.86
Market Cap (in EUR million)
501.1 604.7 361.5 330.9 ~375
*adjusted because of IAS 19 R
© BAUER AG, D-86529 Schrobenhausen 13-05-15 IR-Presentation_Q1_2013 43
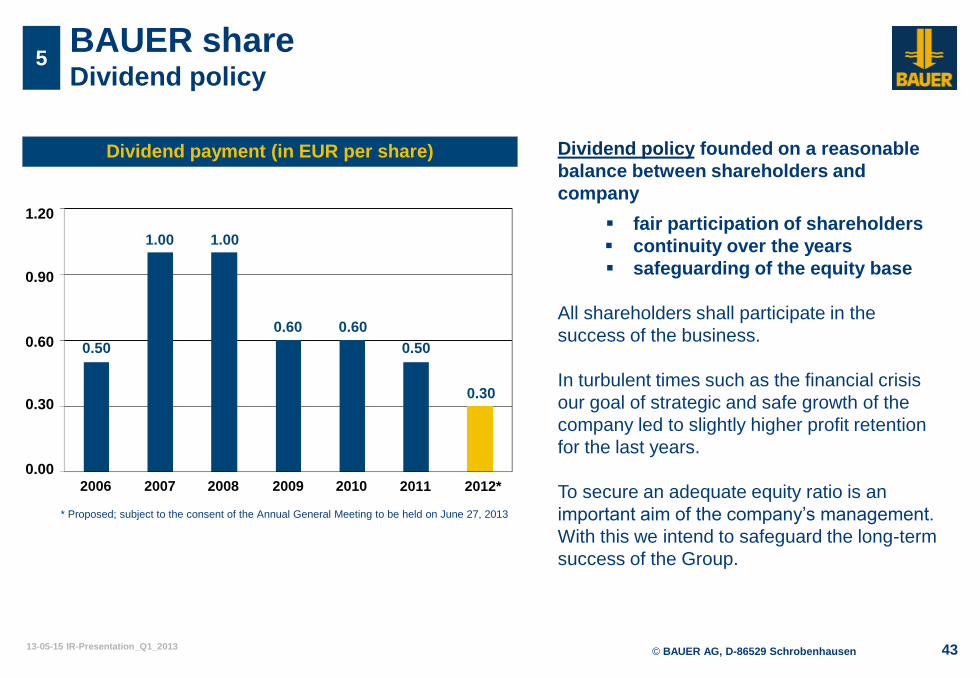
BAUER share Dividend policy
5
2009
Dividend payment (in EUR per share)
2010 2008 2007 2006
0.30
0.00
0.60
0.90
1.20
0.50
1.00 1.00
0.60 0.60
Dividend policy founded on a reasonable
balance between shareholders and
company
fair participation of shareholders
continuity over the years
safeguarding of the equity base
All shareholders shall participate in the
success of the business.
In turbulent times such as the financial crisis
our goal of strategic and safe growth of the
company led to slightly higher profit retention
for the last years.
To secure an adequate equity ratio is an
important aim of the company’s management.
With this we intend to safeguard the long-term
success of the Group.
2011
0.50
2012*
0.30
* Proposed; subject to the consent of the Annual General Meeting to be held on June 27, 2013
© BAUER AG, D-86529 Schrobenhausen 13-05-15 IR-Presentation_Q1_2013 44
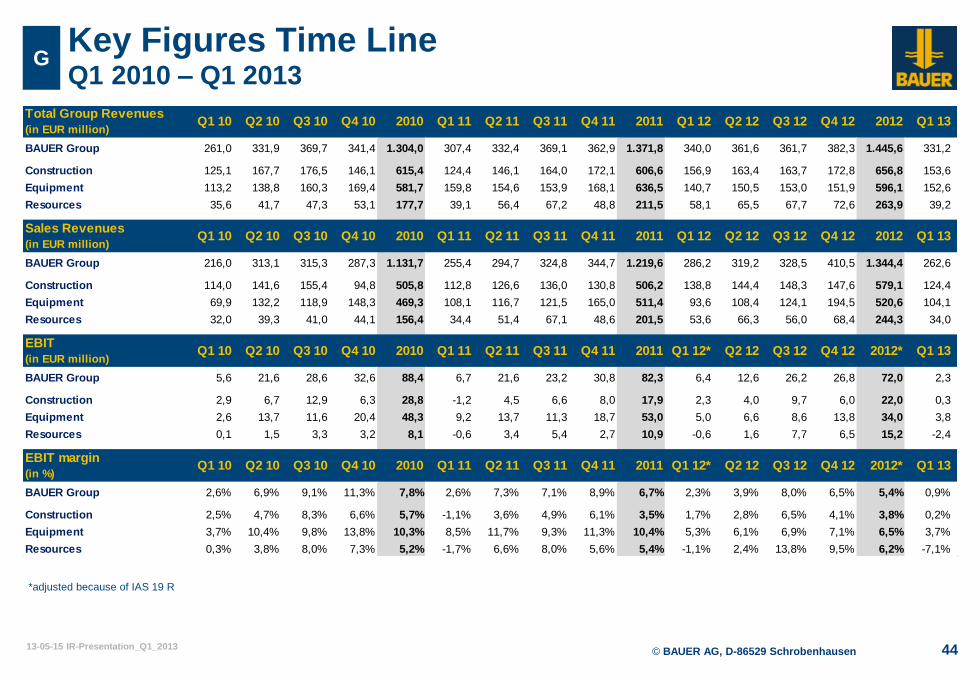
G Key Figures Time Line Q1 2010 – Q1 2013
*adjusted because of IAS 19 R
Total Group Revenues
(in EUR million)
BAUER Group 261,0 331,9 369,7 341,4 1.304,0 307,4 332,4 369,1 362,9 1.371,8 340,0 361,6 361,7 382,3 1.445,6 331,2
Construction 125,1 167,7 176,5 146,1 615,4 124,4 146,1 164,0 172,1 606,6 156,9 163,4 163,7 172,8 656,8 153,6
Equipment 113,2 138,8 160,3 169,4 581,7 159,8 154,6 153,9 168,1 636,5 140,7 150,5 153,0 151,9 596,1 152,6
Resources 35,6 41,7 47,3 53,1 177,7 39,1 56,4 67,2 48,8 211,5 58,1 65,5 67,7 72,6 263,9 39,2
Sales Revenues
(in EUR million)
BAUER Group 216,0 313,1 315,3 287,3 1.131,7 255,4 294,7 324,8 344,7 1.219,6 286,2 319,2 328,5 410,5 1.344,4 262,6
Construction 114,0 141,6 155,4 94,8 505,8 112,8 126,6 136,0 130,8 506,2 138,8 144,4 148,3 147,6 579,1 124,4
Equipment 69,9 132,2 118,9 148,3 469,3 108,1 116,7 121,5 165,0 511,4 93,6 108,4 124,1 194,5 520,6 104,1
Resources 32,0 39,3 41,0 44,1 156,4 34,4 51,4 67,1 48,6 201,5 53,6 66,3 56,0 68,4 244,3 34,0
EBIT
(in EUR million)
BAUER Group 5,6 21,6 28,6 32,6 88,4 6,7 21,6 23,2 30,8 82,3 6,4 12,6 26,2 26,8 72,0 2,3
Construction 2,9 6,7 12,9 6,3 28,8 -1,2 4,5 6,6 8,0 17,9 2,3 4,0 9,7 6,0 22,0 0,3
Equipment 2,6 13,7 11,6 20,4 48,3 9,2 13,7 11,3 18,7 53,0 5,0 6,6 8,6 13,8 34,0 3,8
Resources 0,1 1,5 3,3 3,2 8,1 -0,6 3,4 5,4 2,7 10,9 -0,6 1,6 7,7 6,5 15,2 -2,4
EBIT margin
(in %)
BAUER Group 2,6% 6,9% 9,1% 11,3% 7,8% 2,6% 7,3% 7,1% 8,9% 6,7% 2,3% 3,9% 8,0% 6,5% 5,4% 0,9%
Construction 2,5% 4,7% 8,3% 6,6% 5,7% -1,1% 3,6% 4,9% 6,1% 3,5% 1,7% 2,8% 6,5% 4,1% 3,8% 0,2%
Equipment 3,7% 10,4% 9,8% 13,8% 10,3% 8,5% 11,7% 9,3% 11,3% 10,4% 5,3% 6,1% 6,9% 7,1% 6,5% 3,7%
Resources 0,3% 3,8% 8,0% 7,3% 5,2% -1,7% 6,6% 8,0% 5,6% 5,4% -1,1% 2,4% 13,8% 9,5% 6,2% -7,1%
2012*
Q1 13
Q1 13
Q1 13
Q1 13
2012
Q4 12
Q2 12 Q3 12
Q2 12
Q2 12
Q2 12
Q4 12
Q3 12 Q4 12
Q3 12 Q4 12
2012
2012*
Q4 11
2010 Q4 11
2010 Q4 11
Q2 11
2011
Q3 10
Q3 11
Q3 11
Q3 11
Q3 112010
Q2 11Q1 11
Q1 11
Q2 11
Q3 10 Q4 10
Q1 10
Q1 10
Q1 10 Q2 10
Q1 10 Q2 10
Q1 11
Q1 11Q2 10 Q3 10 Q4 10
2011
2011
Q2 10 Q3 10 Q4 10
2011Q4 10
2010 Q4 11
Q2 11
Q1 12
Q1 12
Q1 12*
Q1 12* Q3 12
© BAUER AG, D-86529 Schrobenhausen 13-05-15 IR-Presentation_Q1_2013 45
Investor Relations
BAUER Aktiengesellschaft
BAUER-Straße 1
86529 Schrobenhausen
Germany
Tel.: +49 8252 97-1218
Fax: +49 8252 97-2900
www.bauer.de
BAUER Aktiengesellschaft
Financial calendar 2013
Publication Annual Report 2012 April 11, 2013
Annual Press Conference April 11, 2013
Analyst Conference April 11, 2013
Annual General Meeting June 27, 2013
Interim Report to March 31, 2013 May 15, 2013
Half-Year Interim Report to June 30, 2013 August 14, 2013
Interim Report to September 30, 2013 November 14, 2013
Listing SDAX, CDAX, GEX,
Classic All Share
Prime All Share
DAXplus Family
Get the
BAUER App
for iPhone
and iPad
Visit us on YouTube:
http://www.youtube.com/Bauergruppe
ISIN DE0005168108
Reuters B5AG.DE
Bloomberg B5A GR
© BAUER AG, D-86529 Schrobenhausen 13-05-15 IR-Presentation_Q1_2013 46
Disclaimer
This presentation contains forward-looking statements. Forward-looking statements
are statements that are not historical facts, including statements about our beliefs,
intentions, expectations, predictions and the assumptions underlying them.
These statements are based on factors as they are currently available to the
management of BAUER AG and therefore speak only as of the date they are made.
We assume no liability to update publicly or conform any of them to future events or
future developments.
Forward-looking information is subject to various known and unknown risks and un-
certainties, which could lead to material differences between the actual future results,
financial situation, development or performance of the BAUER Group and those
factors contained in any forward-looking statement. In view of these uncertainties, no
assurance can be given that these forward-looking statements will prove accurate
and correct, or that anticipated and projected future results will be achieved and we
caution you not to place undue reliance on these forward-looking statements.
Recommended