2010 BASIC EDUCATION PROFILE
NATIONAL & REGIONAL STATISTICS
FACTS AND FIGURES: NORTH CENTRAL REGION
BENUE
FCT-ABUJA
KOGI
KWARA
NASARAWA
NIGER
EDUCATION PLATEAU
EDUCATION FOR ALL IS THE RESPONSIBILITY OF ALL
UNIVERSAL BASIC EDUCATION COMMISSION (UBEC)
UNINN

ii
UNIVERSAL BASIC EDUCATION COMMISSION
Basic Education Profile in Nigeria 2010
Facts and Figures: North Central Zone
The goal of UBE programme is to ensure access to free, compulsory
education from Early Childcare Development (ECD), Primary and
Junior Secondary Schools Education to all Nigerian children.
Statistical facts and figures for the North-Central Zone which
comprises of Benue, FCT, Kogi, Kwara, Nasarawa, Niger and Plateau
States, using the Basic Performance Indicators of access, quality and
equity, are provided in Appendix I. It is on the strength of these that
the following charts have been generated to give meaning to the
Facts and Figures for the Zone.
NUMBER OF ECD CENTRES AND SCHOOLS
From the above chart, Kwara State has the highest number of ECD
centres of 763 in the zone while FCT has the least with 132 centres.
Niger State has the highest number of stand-alone ECD
centres with 36 while Kwara State has the lowest with 2.
Benue and Plateau States have none.
From the above chart, Niger State has the highest number of
Primary School of 2,834 having 646 with ECD while FCT has the least
with 495 Primary Schools with 128 having ECD centers.
From the above diagram, Kogi State has the highest number of JSS
with 555 schools in the zone while FCT has the least with 77 JSS.
PUPIL ENROLMENT IN BASIC EDUCATION SCHOOLS
Niger State has the highest number of gross enrolment while
Plateau State has the least enrolment in the zone.
252 132
606 763
184
682
142
0
200
400
600
800
1000
Nu
mb
er o
f C
entr
e
States in North-Central Zone
Fig.1: Total Number of ECD Centres by States in North-Central Zone
0 4
32
2
20
36
0 0
5
10
15
20
25
30
35
40
Fig.2: Number of Stand-Alone ECD Centres in North Central Zone
Number of Stand-Alone ECD Centres
2,661
495
2,096
1,406 1,278
2,834
2,005
252 128
574 761
164
646
142
0
500
1,000
1,500
2,000
2,500
3,000
Fig. 3: Total Number of Primary Schools and Number of Primary Schools with ECD Centers in North Central Zone
Total Number of Primary SchoolsNumber of Primary Schools with ECD Centres
526
77
555
330
181
381
285
0
100
200
300
400
500
600
Nu
mb
er o
f Ju
nio
r Se
con
dar
y s
cho
ols
State in Norht-Central
Fig. 4: Total number of Junior Secondary Schools in North-Central Zone
12,749 12,766
41,126
28,945
19,351
54,023
12,597
0
10,000
20,000
30,000
40,000
50,000
60,000
Enro
lmen
ts
States in North-Central zone
Fig. 5: ECD Gross Enrolment by State in North-Central zone

iii
The chart shows that Niger State has the highest ECD net enrolment
with 41,417 pupils while Benue has the least net enrolment of 9,926
in the North-Central zone.
In this zone, Kogi State has the highest number of primary gross
enrolment of 1,068,392 pupils while FCT has the least gross
enrolment with 187,010 pupils.
It is also observed here that Kogi State has the highest number of
primary net enrolment of 964,048 pupils while FCT has the least net
enrolment with 159,897 pupils. Next to Kogi are Benue (534,601),
Plateau (500,654), Niger (457,504), Nasarawa (233,844) and Kwara
(167,262) accordingly.
Niger State has the highest number of JSS students with gross
enrolment of 179,883 while Nasarawa State has the least enrolment
with 31,874 students in the zone.
It is also observed here that Niger State has the highest number of
JSS net enrolment of 125,827 Students while Nasarawa has the least
JSS net enrolment with 21,178 Students. Next to Niger in this
presentation are Kogi (74,694) then Benue (64,046), Kwara (63,454),
Plateau (41,522), Niger (457,504), and FCT (38,056).
Kogi State has the highest number of pupil-intake in primary schools
with 194,666 while FCT has the least with 32,611 and other States
figures were captured accordingly in the above chart.
9,926 10,693
32,833
23,697
15,371
41,417
10,472
0
10,000
20,000
30,000
40,000
50,000
Ne
t En
rolm
en
t
States in Norht-Centre Zone
Fig. 6: ECD Net Enrolment by State in North-Central Zone
621,556
187,010
1,068,392
193,673 301,049
536,076 570,626
0
200,000
400,000
600,000
800,000
1,000,000
1,200,000
Gro
ss E
nro
lmen
t
States in North-Centra Zone
Fig. 7: Primary schools Gross Enrolment by State in North-Central Zone
534,601
159,897
964,048
167,262 255,844
457,504 500,654
0
200,000
400,000
600,000
800,000
1,000,000
1,200,000
Ne
t En
rolm
en
t
States in North-Central
Fig. 8:Primary Schools Net Enrolment by States in North-Central Zone
88,439 66,357
94,270 86,081
31,874
179,883
63,233
0
50,000
100,000
150,000
200,000
Gro
ss E
nro
lmen
t
States in North-Central
Fig. 9: JSS Gross Enrolment by States in North-Central
64,046 38,056
74,694 63,454
21,178
125,827
41,522
020,00040,00060,00080,000
100,000120,000140,000
Net
En
rolm
ent
States in North Central Zone
Fig. 10: JSS Net Enrolment by States in North-Central
129,613
32,611
194,666
38,000 59,624
135,165 125,216
0
50,000
100,000
150,000
200,000
250,000
Pu
pils
en
rolm
ent
States in North -Central
Fig. 11: Primary Pupils in-take by States in North-Central

iv
The highest JSS Students in-take of 60,479 for this zone was
observed in Niger State while the least of the students in-take was in
Nasarawa which has 12,979. Other States in –take figures are shown
in the above diagram respectively.
Niger State has the highest number of 4,702 of pupils expected to
from ECD transit to primary schools in this zone while Benue State
has least of 1,288.
Kogi State has the highest number of primary schools pupils
expected to transit from primary to Junior Secondary Schools in the
zone with 168,867 while Kwara State has the least with 27,705.
Other States recorded as follows: Benue (82,315), Plateau (69,684) ,
Niger (58,905), Nasarawa (39,248) and FCT (27,917).
This chart shows the percentage of early and late starters as against
the normal school official age in ECD across the States in North-
Central zone. Benue State recorded highest percentages of Under
Age of 17.2 percent and above while that of lowest under Age figure
was recorded in Plateau with 7.9 percent. In this zone, Nasarawa
State recorded highest percentages of Over Age of 9.9 percent.
While that of lowest over Age figure was recorded in Kogi with 4.7
percent. FCT recorded highest percentages of Normal official Age of
17.2 percent and above. While that of lowest official Age figure was
recorded in Niger with 76.7 percent as presented in the above Chart.
Official primary school age in Nigeria is 6-11. By age 6, most children
(87 percent and above) across the six zones have entered schools.
The highest percentage of early starters is recorded in Niger State
with 8.5 percent while that of late starters is recorded against FCT
with 11.5 percent and Kogi State recorded highest percentage of
official primary school going Age with 90.2 percentage.
30,517 23,877
36,208 28,563
12,979
60,479
17,719
010,00020,00030,00040,00050,00060,00070,000
JSS
in-t
ake
States in North - Central Zone
Fig 12: JSS students in-take by State in North-Central Zone
1,288 1,727
2,966 2,961 2,585
4,702
1,533
0
1,000
2,000
3,000
4,000
5,000
States in North-Central
Fig. 13: Propotion of pupils expected toTransit from ECD to Primary
82,315
27,917
168,867
27,705 39,248 58,905 69,684
0
50,000
100,000
150,000
200,000
pro
po
rtio
n o
f P
rim
ary
pu
pil
States in North-Central Zone
Fig. 14: Proportion of Pupils Expected to Transit from Primary to JSS by State in North-Central Zone
17.2 8
15.5 12.1 10.7 16.8
7.9 4.9 8.2 4.7 6 9.9 6.6 8.9
77.9 83.8 79.8 81.9 79.4 76.7 83.1
0
20
40
60
80
100
Benue FCT Kogi Kwara Nasarawa Niger Plateau
Per
cen
tage
Fig. 15: Percentage Under, Over and Official Age of ECD Pupils by States in North-Central Zone
Percentage of under Age in ECD Percentage of Over Age in ECD
Percentage of Official ECD Age
5.6 3 4.4 4.5 7 8.5 4.1
8.4 11.5 5.4 9.1 8 6.1 8.2
86 85.5 90.2 86.4 85 85.3 87.7
0
20
40
60
80
100
Benue FCT Kogi Kwara Nasarawa Niger Plateau
Pe
rcen
tage
Fig. 16: Percentage of Under, Over and Official age in Primary Schools North-Central
Percentage of UnderAge in Primary Percentage of Over Age in primary
Percentage of official Age in Primary

v
Junior Secondary School has an entry age of 12. By age 12, most
children (70 percent and above) across the zones have entered
schools. There are no significant differences between the
percentages of official school age enrolled across all the States. The
highest percentage of early starters and late starters are recorded in
FCT with 11.2 and 31.5 percent respectively.
In this zone FCT, Kogi and Nasarawa States have the highest in gross
enrolment rate of 11 each while Kogi and Kwara States have the
highest in net enrolment rate of 9 each. Benue has the least in both
gross and net enrolment rate of 3 and 2 respectively.
In this zone, FCT has the highest in both gross and net enrolment
rate of 163 and 147 respectively while Kogi State has the least in
both gross and net Primary enrolment rate of 43 and 37
respectively.
From the above figure, Nasarawa State has the highest in both gross
and net enrolment rate of 55 and 38 respectively while Kwara State
has the least in both gross and net enrolment rate of 21 and 14
respectively.
There is relative parity on pupil enrolment among the category and
States in North-Central zone. Interestingly for ECD in Kogi State, GPI
of 1.08 means higher number of females than males. But the GPI of
primary pupils shows one to one in Kogi and Kwara States. The
highest GPI for JSS was observed in FCT (0.95) while the least was
recorded against Niger (0.58), which means less number of females
than males in JSS.
8.6 11.2 8.8 8.5 8.2 7.2 5.2
19 31.5
12 17.8
25.4 22.8 29.2
72.4
57.4
79.2 73.7
66.4 69.9
65.7
0
20
40
60
80
100
Benue FCT Kogi Kwara Nasarawa Niger Plateau
Per
cen
tage
Fig. 17: Percentage Under, Over and Official Age in JSS by
States in North-Central Zone
Percentage Under Age StudentS in JSSPercentage Over Age Students in JSSPercentage Official Age Students in JSS
3
11 11
9
11
4
7
2
8 9
7 8
3
6
0
2
4
6
8
10
12
Benue FCT Kogi Kwara Nasarawa Niger Plateau
Rat
e
States in North-Central Zone
Fig. 18: Gross Enrolment Rate in ECD by States in North-Central Zone
Gross Enrolment Rate in ECD Net Enrolment Rate in ECD
73
163
43
82 66
92
63 63
147
37
69 57
81 53
0
50
100
150
200
Benue FCT Kogi Kwara Nasarawa Niger Plateau
Fig. 19: Gross and Net Enrolment Rate in Primary schools, North Central
Gross Enrolment Rate in Primary Schools
Net Enrolment Rate in Primary Schools
24
34
44
21
55
24
52
18
27 33
14
38
15
30
0
10
20
30
40
50
60
Benue FCT Kogi Kwara Nasarawa Niger Plateau
Rat
e
States in North-Central zone
Fig. 20: JSS Gross and Net Enrolment Rate by States in North-Central Zone
Gross enrolment rate in JSS Net Enrolment rate in JSS
0.8
9
0.9
6
1.0
8
0.9
7
0.9
4
0.8
8
0.9
6
0.8
8
0.9
6
1.0
0
0.9
0
0.8
3
0.6
8 0
.94
0.7
9
0.9
6
0.9
2
0.9
0.7
9
0.5
8 0
.84
0
0.5
1
1.5
Fig. 21: Gender Parity Index on ECD, Primary and JSS Enrolment by States in North-Central Zone
Gender Parity Index (GPI) on Pupil Enrolment in ECD
Gender Parity Index (GPI) on Pupil Enrolment in Primary
Gender Parity Index (GPI) on Student Enrolment in JSS

vi
TEACHING STAFF IN BASIC EDUCATION SCHOOLS
In this zone Niger State has the highest number of ECD teachers with
1,507 while FCT has the least with 232.
Also, Niger State has the highest number of Primary school teachers
with 22,386 while FCT has the least with 5,941.
Niger State has the highest number of JSS teachers with 3,791 while
Nasarawa State has the least with 939.
In ECD, FCT recorded the highest percentage of qualified teachers
with 88 percent while Nasarawa and Niger States recorded the least
with 55 percent each. Inversely Nasarawa and Niger States recorded
highest unqualified teachers with 45 percent each and FCT recorded
the least with 19 percent.
In Primary, FCT recorded the highest percentage of qualified
teachers with 86 percent while Niger State recorded least with 43
percent. Inversely Niger recorded highest unqualified teachers with
57 percent and FCT recorded the least with 14 percent.
In Junior Secondary Schools, FCT recorded the highest percentage of
qualified teachers with 95 percent while Niger State recorded least
with 85 percent. Inversely Niger recorded highest unqualified
teachers with 15 percent and FCT recorded the least with 5 percent.
446 232
1,167 941 861
1,507
375
0
500
1000
1500
2000
Nu
mb
er o
f Te
ach
ers
States in North-Central
Fig . 22: Number of Teachers in ECD by States in North-Central
18,683
5,941
16,364 14,216 14,352
22,386
18,080
0
5,000
10,000
15,000
20,000
25,000
Benue FCT Kogi Kwara Nasarawa Niger Plateau
Nu
mb
er o
f Te
ach
ers
States in North-Central Zone
Fig. 23: Number of Teachers in Primary Schools by States in North-Central Zone
3,709
2,764
3,440 3,302
939
3,791
1,554
0
500
1,000
1,500
2,000
2,500
3,000
3,500
4,000
Benue FCT Kogi Kwara Nasarawa Niger Plateau
Nu
mb
er o
f Te
ach
ers
States in North-Central Zone
Fig. 24: Number of Teachers in JSS by States in North-Central Zone
81 88
82 84
55 55 63
19 13
18 16
45 45 37
0
20
40
60
80
100
Benue FCT Kogi Kwara Nasarawa Niger Plateau
Pe
rcen
tage
States in Norht-Central
Fig. 25: Percentage of Qualified and Unqualified Teachers in ECD
% of qualified teachers in ECD % of unqualified teachers in ECD
78 86 81 78
51 43
58
22 14
19 22
49 57
42
0
20
40
60
80
100
Benue FCT Kogi Kwara Nasarawa Niger Plateau
Per
cen
tage
States in North-Central
Fig. 26: Percentage Qualified and Unqualified Teachers in Primary Schools by States in North-Central
% Qualified Teachers in Primary % Unqualified Teacher in Primary
94 95 92 91 93 85 89
6 5 8 9 7 15 11
0
20
40
60
80
100
Benue FCT Kogi Kwara Nasarawa Niger Plateau
Per
cen
tage
States in North-Central Zone
Fig. 27: Percentage of Qualified and Unqualified Teacher s in JSS by States in North-Central Zone
%Qualified Teachers in JSS %Unqualified Teachers in JSS

vii
In ECD, Nasarawa recorded the worst pupil/qualified teacher ratio
with 1:65 in the North-Central zone while Benue and Plateau States
have the fairest with 1:35 each.
In Primary, FCT recorded the highest pupil/total teacher ratio with
1:62 and and also the highest in pupil/qualified teacher ratio of 1:81.
Kogi State recoded lowest in pupil/teacher ratio and pupil/qualified
teacher ratio with 1:12 and 1:17 respectively.
In JSS, Nasarawa recorded the worst student/qualified teacher ratio
with 1:47 while Benue and Plateau States stood out better with
1:24.
In ECD, FCT has the highest gender parity index of 16.8 while
Nasarawa and Niger State has the least with 2.0 each.
In primary schools, Kwara State has the highest gender parity index
of 1.5 while Niger State has the least with 0.5.
In JSS, FCT has the highest gender parity index of 1.6 while Benue
has the least with 0.31 each.
29
55
35 31 22
36 34 35
63
43 37 41
65 54
0
20
40
60
80
Fig. 28: Pupils Teacher /Qualified Teacher Ratio in ECD by States in North-Central Zone
Pupil/Teacher Ratio in ECD Pupil/Qualified Teacher Ratio in ECD
33
62
12
30 37
18 15
43
81
17
41
56 55
37
0
20
40
60
80
100
Benue FCT Kogi Kwara Nasarawa Niger Plateau
Rat
io
Fig. 29: Pupil Teacher /Qualified Teacher Ratio in Primary Schools by States in North-Central Zone
Pupil Teacher Ratio in Primary SchoolsPupils Qualified Teacher Ratio in Primary…
22 23 25
24
31
40 36
24 27 26
34
47
41
24
0
10
20
30
40
50
Benue FCT Kogi Kwara Nasarawa Niger Plateau
Rat
io
Fig. 30: Student Teacher/Qualified Teacher Ratio in JSS by States in North-Central Zone
Student Teacher Ratio in JSS Student Qualified Teacher Ratio in JSS
3.2
16.8
2.6
6.7
2.0 2.0
4.6
0
2
4
6
8
10
12
14
16
18
Benue FCT Kogi Kwara Nasarawa Niger Plateau
Par
ity
Ind
ex
States in North-Central
Fig. 31:Gender Parity Index on Teachers in ECD by States in North-Central Zone
0.6
1.1
1.3
1.5
0.6 0.5
0.7
0
0.2
0.4
0.6
0.8
1
1.2
1.4
1.6
Benue FCT Kogi Kwara Nasarawa Niger Plateau
Par
ity
Ind
ex
States in North-Central Zone
Fig. 32: Gender Parity Index on Primary Teacher by States in North-Central
0.31
1.60
0.66
1.29
0.51 0.52 0.43
0
0.2
0.4
0.6
0.8
1
1.2
1.4
1.6
1.8
Par
ity
Ind
ex
States in North - Central
Fig. 33: Gender Parity Index on JSS Teachers by States in North-Central Zone

viii
In ECD level, Kwara and FCT have the highest percentage of teachers with computer literacy with 16 percent while Nasarawa and Plateau States have the lowest with four percent each. In the primary level, Kwara State has the highest with 13 percent while Benue State has the lowest with one percent. In the JSS level, FCT has the highest with 29 percent while Benue State has the lowest with two percent.
In ECD level, FCT has the highest percentage of teachers registered with TRCN with 81 percent while Niger State has the lowest with 14 percent. In the primary level, FCT has the highest with 88 percent while Niger State has the lowest with 32 percent. Similarly, in the JSS level, FCT has the highest with 78 percent while Niger State has the lowest with 25 percent.
Niger State has the highest number of ECD teachers with specialization in ECD with 5,811 while FCT recorded the lowest with 93
NON-TEACHING STAFF IN BASIC EDUCATION SCHOOLS
Kwara State has the highest number of Non-teaching staff in ECD
with 364 while Benue has the least with 11 non-teaching staff.
In primary schools, Plateau State has the highest number of Non-
teaching staff in ECD with 1,731 while Niger has the least with 491
non teaching staff.
In JSS, Niger State has the highest number of Non-teaching staff in
ECD with 671 while Nasarawa has the least with 2 non-teaching staff
only.
5
16
7
16
4 9
4 1
10 5
13
5 5 6 2
29
4 10 9
16 13
0
20
40
Fig. 34: Percentages of Teachers with Computer Literacy in ECD, Primary and JSS in North Central Zone
% of teachers with computer literacy in ECD% of teachers with computer literacy in Primary Schools% of teachers with computer literacy in JSS
66
81
28
50
41
14
37
73
88
55
63
49
32
50
73
78
50
52
59
25
56
0
100
Benue FCT Kogi Kwara Nasarawa Niger Plateau
Fig. 35: Percentages of Teachers Registered with TRCN in ECD, Primary and JSS in North Central Zone
% of teachers registered with TRCN in ECD% of teachers registered with TRCN in Primary Schools% of teachers registered with TRCN in JSS
175 93 313 179 306
5,811 5,699
0
2000
4000
6000
8000
Fig. 36: Number of ECD teachers with Specialization in ECD in North Central Zone
Number of ECD teachers with Specialization in ECD
11 51
146
364 325
127 109
0
50
100
150
200
250
300
350
400
Benue FCT Kogi Kwara Nasarawa Niger Plateau
Nu
mb
er o
f St
aff
States in North-Central Zone
Fig.37: Number of Non-teaching Staff in ECD by States in North-Central Zone
1,236
949
1,290
999 1,070
491
1,731
0
500
1,000
1,500
2,000
Benue FCT Kogi Kwara Nasarawa Niger Plateau
Nu
mb
er S
taff
States North-Central Zone
Fig. 38: Number of Non-teaching in Primary Schools by States in North-Central Zone
131
215 259 282
2
671
215
0
100
200
300
400
500
600
700
800
Benue FCT Kogi Kwara Nasarawa Niger Plateau
Nu
mb
er o
f St
aff
States in North-Central Zone
Fig. 39: Number of Non-Teaching Staff in JSS by States in North-Central Zone

ix
Kogi State has the highest number of total, good and bad classrooms
in this zone while FCT has the least of number of total, good and bad
classrooms as presented on above chart.
FCT has highest number of total classrooms, Kogi have more good
and bad classrooms in this zone with 8,518 and 12,441. as presented
on above chart.
CONDITION OF CLASSROOMS IN BASIC EDUCATION SCHOOLS
Benue State has the highest number of total, good and bad
classrooms in this zone while FCT has the least of number of total,
good and bad classrooms as presented on above chart.
By national standard, pupil/good classroom ratio is 1:25 in ECD. As
shown in the table above, none of the State meets the standard.
This means that large proportion of the classrooms in ECD centres
are not in good condition and as such they are grossly inadequate.
The situation is worse in Niger State having the highest (1:140) than
Plateau being the least with 62 pupils to one good classroom.
The ideal pupil/good classroom ratio in primary schools is 1:35.
Nasarawa has the highest ratio of 135 pupils to a good classroom
while Benue has the least of 80 pupils to one good classroom. This
means that good classrooms in primary schools across all the zones
are grossly inadequate.
37
8
29
6
1,0
48
79
7
50
1
89
9
36
3
15
8
18
6
46
4
40
1
18
3
38
6
20
3
22
0
11
0
58
4
39
6
31
8
51
3
16
0
0
200
400
600
800
1000
1200
Benue FCT Kogi Kwara Nasarawa Niger Plateau
Nu
mb
er o
f cl
asro
om
s Fig. 40: Total Classrooms and Number of Good and Bad
Classrooms by States in North-Central
Total Classrooms in ECDNummber of Good Classrooms in ECDNumber of Bad Classrooms in ECD
20,1
12
20,9
59
7,72
9
7,87
9
12,7
22
14,6
80
3,67
3
7,79
2
2,27
3 8,
518
4,00
8
2,22
3
5,81
1
5,69
9 12
,320
1,40
0
12,4
41
3,72
1
5,65
6
6,91
1
8,98
1
0
10,000
20,000
30,000
Benue FCT Kogi Kwara Nasarawa Niger Plateau
Fig. 41: Total Number of Classrooms,Good and Bad in Primary in North Central Zone
No. of Classrooms in Primary Schools
No. of Good Classrooms in Primary Schools
No. of Bad Classrooms in Primary Schools
2,0
69
67
7
2,0
16
18
29
69
7
2,0
48
13
08
1,1
06
51
2
1,1
33
92
4
37
2
1,1
59
60
2 96
3
16
5
88
3
90
5
32
5
88
9
70
6
0
500
1,000
1,500
2,000
2,500
Fig. 42: Total Number of Classrooms, Good and Bad in JSS North-Central Zone
Number of Classrooms in Junior Secondary SchoolsNumber of Good Classrooms in Junior Secondary SchoolsNumber of Bad Classrooms in Junior Secondary Schools
34 43 39 36 39
60
35
81 69
89 72
106
140
62
0
50
100
150
Benue FCT Kogi Kwara Nasarawa Niger Plateau
Fig. 43: Pupil/Total classroom and Pupil/good classroom ratio in ECD
Pupil/Total Classroom ratio in ECD Pupil/Good Classroom ratio in ECD centres
31
51 51
25 38 42 39
80 82
125
48
135
92 100
0
50
100
150
Benue FCT Kogi Kwara Nasarawa Niger Plateau
Fig. 44: Pupil Total and Good Classrooms Ratio in Primary Schools by States in North-Central Zone
Pupil/Total Classroom ratio in PrimaryPupil/Good classroom ratio in Primary Schools
43 47 47 46
88
48
98 80
130
83 93 86
155
105
0
50
100
150
200
Benue FCT Kogi Kwara Nasarawa Niger Plateau
Fig. 45: Students/total classroom and student/good classroom ratio in JSS in North Central Zone
Student/Total Classroom ratio in Junior Secondary SchoolsStudent/Good Classrooms ratio in Junior Secondary Schools

x
The student/good classroom ratio in JSS is worse in Niger State
having the highest ratio of 155 students to one good classroom in
the North Central than Benue which has the least of 80 students to
one good classroom. All the zones have high ratio of student/good
classroom.
STREAMS/ARMS IN BASIC EDUCATION SCHOOLS
Niger State recorded the highest number of streams in ECD with 1,136 while FCT recorded the least with 366. Kogi has the highest number of streams in primary with 24,421 while FCT has the least with 4,948 streams. Niger has the highest number of streams in JSS with 2,679 while FCT has the least with 665 streams.
PERSONNEL OF STATES UNIVERSAL BASIC EDUCATION
BOARDs (SUBEBs) AND LOCAL GOVERNMENT EDUCATION
AUTHORITIES (LGEAs)
The above chart shows the number of administrative staff in Local
Government Education Authorities (LGEAs) by States. Niger State
recorded the highest number of staff with 3,756 while Kwara
recorded the least with 1,254.
Kwara has the highest percentage of LGEA staff in schools
supervision with 38 percent while Benue has the least with 20
percent.
Kwara State has the highest percentage of LGEA staff with
computer literacy with 59 percent while Nasarawa State has
the lowest with 10 percent
The above chart shows number of administrative staff in States
Universal Basic Education Boards (SUBEBs) by States. Benue
recorded the highest number of staff with 393 while Plateau
recorded the least with 296.
41
5
35
6
1,0
35
1,0
68
55
7
1,1
35
71
2
21
,11
6
4,9
48
24
,42
1
9,6
50
9,9
17
13
,68
0
16
,42
2
2,2
60
66
5
1,9
09
1,5
60
1,3
59
2,6
79
1,5
11
0
5000
10000
15000
20000
25000
30000
Benue FCT Kogi Kwara Nasarawa Niger Plateau
Tota
l Str
eam
s/ar
ms
Fig. 46: Total Streams in ECD, Primary and JSS by States in North-Central Zone
Total Streams in ECD Centres Total Streams in Primary Schools
Total Streams in JSS
2,593
1,437
3,303
1,254
3,152
3,756
2,400
0
500
1,000
1,500
2,000
2,500
3,000
3,500
4,000
Benue FCT Kogi Kwara Nasarawa Niger Plateau
Nu
mb
er o
f St
aff
States in North-Central Zone
Fig. 47: Number of Staff in LGEAs by States in North-Central Zone
20 22
25
38
29
37
24
0
5
10
15
20
25
30
35
40
Benue FCT Kogi Kwara Nasarawa Niger Plateau
Fig. 48: Percentage of LGEA staff in School Supervision
26 36
14
59
10 11 16
010203040506070
Fig 49: Percentage of staff with computer literacy in LGEAs in North Central Zone
Percentage of staff with computer literacy in LGEAs
393 357 342
206 211 167
296
0
100
200
300
400
500
Fig. 50: Number of Staff in SUBEB by State in North-Central Zone
Number of staff in SUBEBs
xi
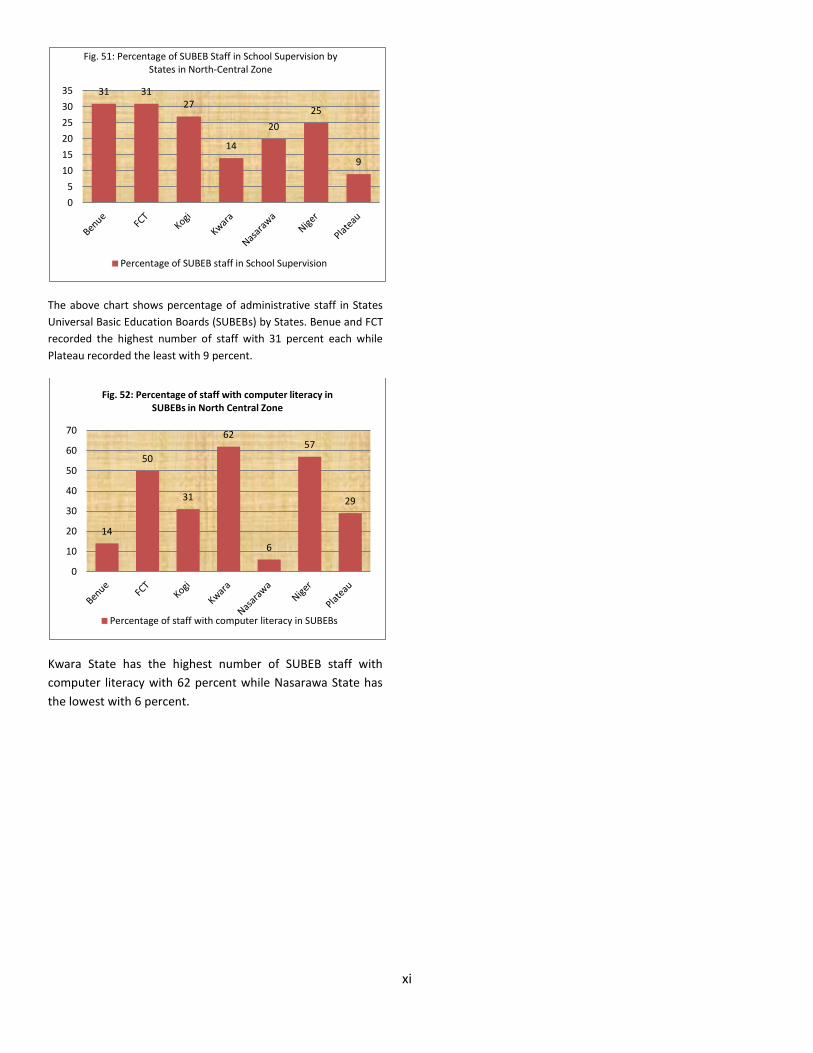
The above chart shows percentage of administrative staff in States
Universal Basic Education Boards (SUBEBs) by States. Benue and FCT
recorded the highest number of staff with 31 percent each while
Plateau recorded the least with 9 percent.
Kwara State has the highest number of SUBEB staff with
computer literacy with 62 percent while Nasarawa State has
the lowest with 6 percent.
31 31 27
14
20
25
9
0
5
10
15
20
25
30
35
Fig. 51: Percentage of SUBEB Staff in School Supervision by States in North-Central Zone
Percentage of SUBEB staff in School Supervision
14
50
31
62
6
57
29
0
10
20
30
40
50
60
70
Fig. 52: Percentage of staff with computer literacy in SUBEBs in North Central Zone
Percentage of staff with computer literacy in SUBEBs

12
UNIVERSAL BASIC EDUCATION COMMISSION
Basic Education Profile in Nigeria, 2010: North Central Zone Appendix 1 SN
Basic Education Indicators Nigeria North Central Zone
State
Benue FCT Kogi Kwara Nasarawa Niger Plateau
1 Schools/Centres
Availability of ECD Centres 23,249 2,761 252 132 606 763 184 682 142
Number of Stand-Alone ECD Centres 223 94 0 4 32 2 20 36 0
Total Number of Primary Schools 59,007 12,775
2,661 495 2,096 1,406 1,278 2,834 2,005
Number of Primary Schools with ECD Centres 23,026 2,667
252 1287 574 761 164 646 142
Total Number of Junior Secondary Schools 11,295 2,335
526 77 555 330 181 381 285
2 Enrolment
Gross Enrolment in ECD centres 1,825,857 181,557 12,749 12,766 41,126 28,945 19,351 54,023 12,597
Net Enrolment in ECD centres 1,529,311 144,409 9,926 10,693 32,833 23,697 15,371 41,417 10,472
Gross Enrolment in Primary Schools 20,291,709 3,478,382 621,556 187,010 1,068,392 193,673 301,049 536,076 570,626
Net Enrolment in Primary Schools 17,984,827 3,039,810 534,601 159,897 964,048 167,262 255,844 457,504 500,654
Gross Enrolment in Junior Secondary Schools 4,313,164 610,137 88,439 66,357 94,270 86,081 31,874 179,883 63,233
Net Enrolment in Junior Secondary Schools 3,109,331 428,777 64,046 38,056 74,694 63,454 21,178 125,827 41,522
Pupil In-take in Primary 4,022,378 714,895 129,613 32,611 194,666 38,000 59,624 135,165 125,216
Pupil In-take in JSS 1,474,523 210,342 30,517 23,877 36,208 28,563 12,979 60,479 17,719
Proportion of Pupil Expected to Transit from ECD to Primary 337,342 17,762 1,288 1,727 2,966 2,961 2,585 4,702 1,533
Proportion of Pupil Expected to Transit from Primary to JSS 2,803,352 474,641 82,315 27,917 168,867 27,705 39,248 58,905 69,684
Percentage of Under Age in ECD 9.7 13.9
17.2 8 15.5 12.1 10.7 16.8 7.9
Percentage of Over Age in ECD 6.5 6.6 4.9 8.2 4.7 6 9.9 6.6 8.9
Percentage of Normal Age in ECD 83.8 79.5 77.9 83.8 79.8 81.9 79.4 76.7 83.1
Percentage of Under Age in Primary 4.3 5.3 5.6 3 4.4 4.5 7 8.5 4.1
Percentage of Over Age in Primary 7.1 7.3 8.4 11.5 5.4 9.1 8.0 6.1 8.2
Percentage of Normal Age in Primary 88.6 87.4 86 85.5 90.2 86.4 85 85.3 87.7
Percentage of Under Age in JSS 8.4 8.1 8.6 11.2 8.8 8.5 8.2 7.2 5.2

13
Percentage of Over Age in JSS 19.5 21.6 19.0 31.5 12.0 17.8 25.4 22.8 29.2
Percentage of Normal Age in JSS 72.1 70.3 72.4 57.4 79.2 73.7 66.4 69.9 65.7
Gross Enrolment Rate in ECD 12 8 3 11 11 9 11 4 7
Net Enrolment Rate in ECD 10 6 2 8 9 7 8 3 6
Gross Enrolment Rate in Primary Schools 77 97 73 163 43 82 66 92 63
Net Enrolment Rate in Primary Schools 68 85 63 147 37 69 57 81 53
Gross Enrolment Rate in Junior Secondary Schools 37 36 24 34 44 21 55 24 52
Net Enrolment Rate in Junior Secondary Schools 27 25 18 27 33 14 38 15 30
Gender Parity Index (GPI) on Pupil Enrolment in ECD 0.96 0.95 0.89 0.96 1.08 0.97 0.94 0.88 0.96
Gender Parity Index (GPI) on Pupil Enrolment in Primary 0.85 0.89 0.88 0.96 1.00 0.90 0.83 0.68 0.94
Gender Parity Index (GPI) on Student Enrolment in JSS 0.79 0.68 0.79 0.96 0.92 0.9 0.79 0.58 0.84
3 Teaching Staff
Teachers in ECD 43,765 5,529 446 232 1,167 941 861 1,507 375
Percentage of qualified teachers in ECD 68 70 81 88 82 84 55 55 63
Percentage of unqualified teachers in ECD 32 30 19 13 18 16 45 45 37
Teachers in Primary Schools 564,569 110,022 18,683 5,941 16,364 14,216 14,352 22,386 18,080
Percentage of qualified teachers in Primary Schools 60 65 78 86 81 78 51 43 58
Percentage of unqualified teachers in Primary Schools 40 35 22 14 19 22 49 57 42
Teachers in Junior Secondary Schools 133,338 21,421 3,709 2,764 3,440 3,302 939 3,791 1,554
Percentage of qualified teachers in Junior Secondary Schools 86 91 94 95 92 91 93 85 89
Percentage of unqualified teachers in Junior Secondary Schools 14 9 6 5 8 9 7 15 11
Pupil/Teacher Ratio in ECD 42 33 29 55 35 31 22 36 34
Pupil/Qualified Teacher Ratio in ECD 62 47 35 63 43 37 41 65 54
Pupil/Teacher Ratio in Primary schools 36 32 33 62 12 30 37 18 15
Pupil/Qualified Teacher Ratio in Primary schools 60 49 43 37 81 17 51 56 55
14
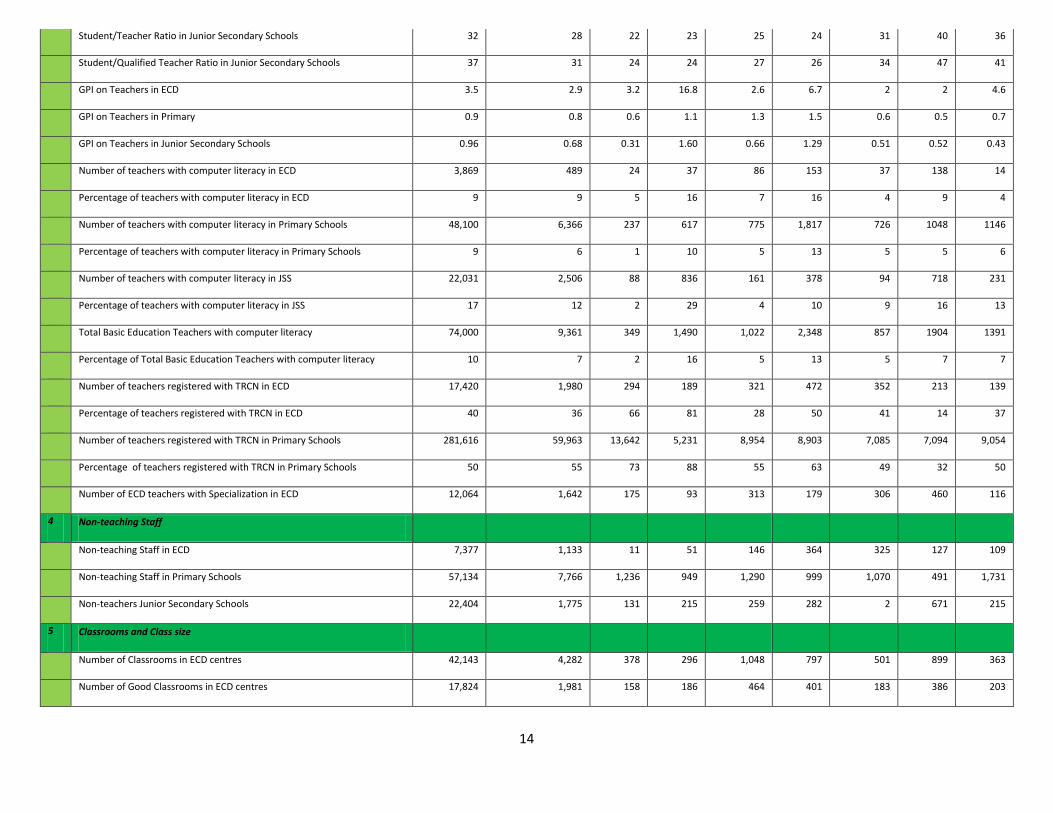
Student/Teacher Ratio in Junior Secondary Schools 32 28 22 23 25 24 31 40 36
Student/Qualified Teacher Ratio in Junior Secondary Schools 37 31 24 24 27 26 34 47 41
GPI on Teachers in ECD 3.5 2.9 3.2 16.8 2.6 6.7 2 2 4.6
GPI on Teachers in Primary 0.9 0.8 0.6 1.1 1.3 1.5 0.6 0.5 0.7
GPI on Teachers in Junior Secondary Schools 0.96 0.68 0.31 1.60 0.66 1.29 0.51 0.52 0.43
Number of teachers with computer literacy in ECD 3,869 489 24 37 86 153 37 138 14
Percentage of teachers with computer literacy in ECD 9 9 5 16 7 16 4 9 4
Number of teachers with computer literacy in Primary Schools 48,100 6,366 237 617 775 1,817 726 1048 1146
Percentage of teachers with computer literacy in Primary Schools 9 6 1 10 5 13 5 5 6
Number of teachers with computer literacy in JSS 22,031 2,506 88 836 161 378 94 718 231
Percentage of teachers with computer literacy in JSS 17 12 2 29 4 10 9 16 13
Total Basic Education Teachers with computer literacy 74,000 9,361 349 1,490 1,022 2,348 857 1904 1391
Percentage of Total Basic Education Teachers with computer literacy 10 7 2 16 5 13 5 7 7
Number of teachers registered with TRCN in ECD 17,420 1,980 294 189 321 472 352 213 139
Percentage of teachers registered with TRCN in ECD 40 36 66 81 28 50 41 14 37
Number of teachers registered with TRCN in Primary Schools 281,616 59,963 13,642 5,231 8,954 8,903 7,085 7,094 9,054
Percentage of teachers registered with TRCN in Primary Schools 50 55 73 88 55 63 49 32 50
Number of ECD teachers with Specialization in ECD 12,064 1,642 175 93 313 179 306 460 116
4 Non-teaching Staff
Non-teaching Staff in ECD 7,377 1,133 11 51 146 364 325 127 109
Non-teaching Staff in Primary Schools 57,134 7,766 1,236 949 1,290 999 1,070 491 1,731
Non-teachers Junior Secondary Schools 22,404 1,775 131 215 259 282 2 671 215
5 Classrooms and Class size
Number of Classrooms in ECD centres 42,143 4,282 378 296 1,048 797 501 899 363
Number of Good Classrooms in ECD centres 17,824 1,981 158 186 464 401 183 386 203

15
Number of Bad Classrooms in ECD centres 24,319 2,301 220 110 584 396 318 513 160
Pupil/Total Classroom ratio in ECD 43 42 34 43 39 36 39 60 35
Pupil/Good Classroom ratio in ECD centres 102 92 81 69 89 72 106 140 62
Number of Classrooms in Primary Schools 416,110 87,754 20,112 20,959 7,729 7,879 12,722 14,680 3,673
Number of Good Classrooms in Primary Schools 186,509 36,324 7,792 2,273 8,518 4,008 2,223 5,811 5,699
Number of Bad Classrooms in Primary Schools 229,601 51,430 12,320 1,400 12,441 3,721 5,656 6,911 8,981
Pupil/Total Classroom ratio in Primary 49 40 31 51 51 25 38 42 39
Pupil/Good classroom ratio in Primary Schools 109 96 80 82 125 48 135 92 100
Number of Classrooms in Junior Secondary Schools 69,610 10,644 2,069 677 2,016 1,829 697 2,048 1,308
Number of Good Classrooms in Junior Secondary Schools 34,574 5,808 1,106 512 1,133 924 372 1,159 602
Number of Bad Classrooms in Junior Secondary Schools 35,036 4,836 963 165 883 905 325 889 706
Pupil/Total Classroom ratio in Junior Secondary Schools 62 57 43 47 47 46 88 48 98
Student/Good Classrooms ratio in Junior Secondary Schools 125 105 80 130 83 93 86 155 105
6 Streams/Arms
Total Streams in ECD centres 59,746 5,278 415 356 1,035 1,068 557 1,135 712
Total Streams in Primary Schools 514,091 100,154 21,116 4,948 24,421 9,650 9,917 13,680 16,422
Total Streams in Junior Secondary Schools 82,646 11,943 2,260 665 1,909 1,560 1,359 2,679 1,511
7 Local Government Education Authorities (LGEAs)
Number of staff in LGEAs 81,895 17,895 2,593 1,437 3,303 1,254 3,152 3,756 2,400
Percentage of LGEA staff in School Supervision 27 28 20 22 25 38 29 37 24
Percentage of staff with computer literacy in LGEAs 18 20 26 36 14 59 10 11 16
8 State Universal Basic Education Boards (SUBEBs)
Number of staff in SUBEBs 8,322 1,972 393 357 342 206 211 167 296
Percentage of SUBEB staff in School Supervision 20 24 31 31 27 14 20 25 9
Percentage of staff with computer literacy in SUBEBs 30 33 14 50 31 62 6 57 29
Recommended