Deriving Knowledge from Data at Scale
Deriving Knowledge from Data at Scale

Deriving Knowledge from Data at Scale
Deriving Knowledge from Data at Scale
Deriving Knowledge from Data at Scale
What is model overfitting?
How would you identify it?
How would you correct it?
Deriving Knowledge from Data at Scale
What is model underfitting?
How would you identify it?
How would you correct it?
Deriving Knowledge from Data at Scale
List methods for dealing with missing values?
But what must you do first?
Deriving Knowledge from Data at Scale
Describe stratification and give an example of when you would use it…
Deriving Knowledge from Data at Scale
Why is feature selection important?
Deriving Knowledge from Data at Scale
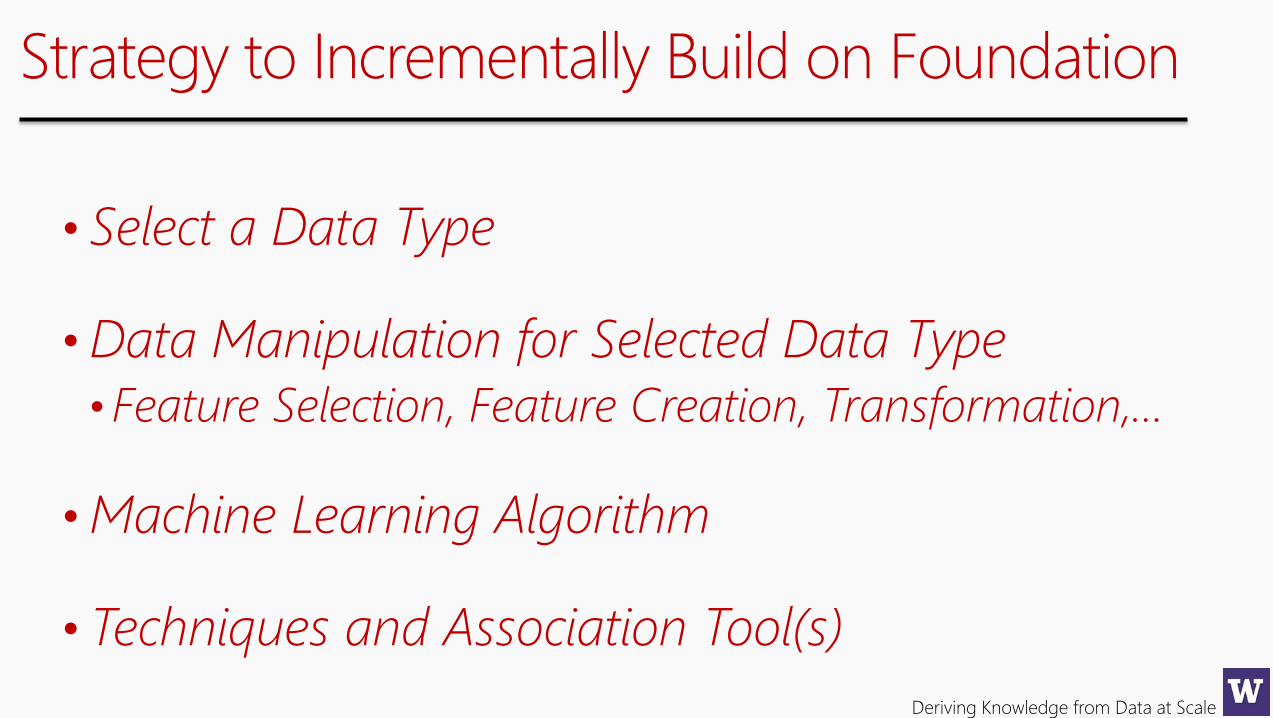
Strategy to Incrementally Build on Foundation
• Select a Data Type
•Data Manipulation for Selected Data Type
• Feature Selection, Feature Creation, Transformation,…
•Machine Learning Algorithm
• Techniques and Association Tool(s)
Deriving Knowledge from Data at Scale
Deriving Knowledge from Data at Scale
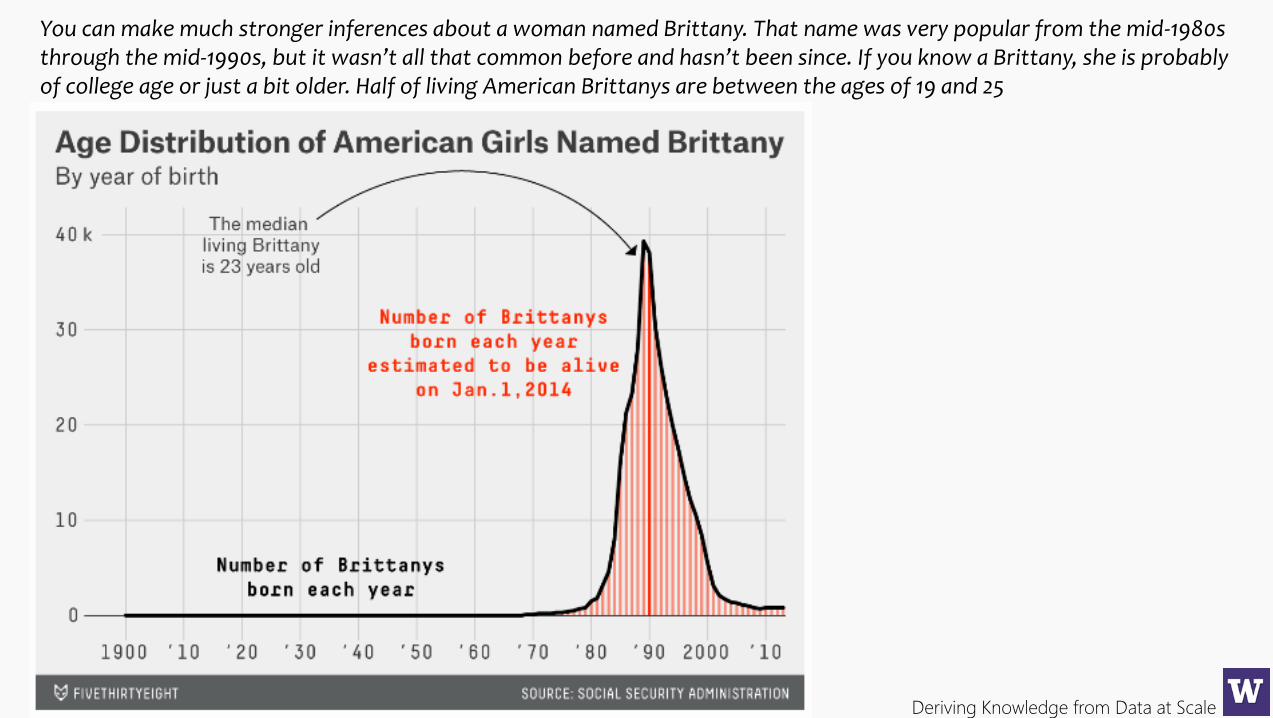
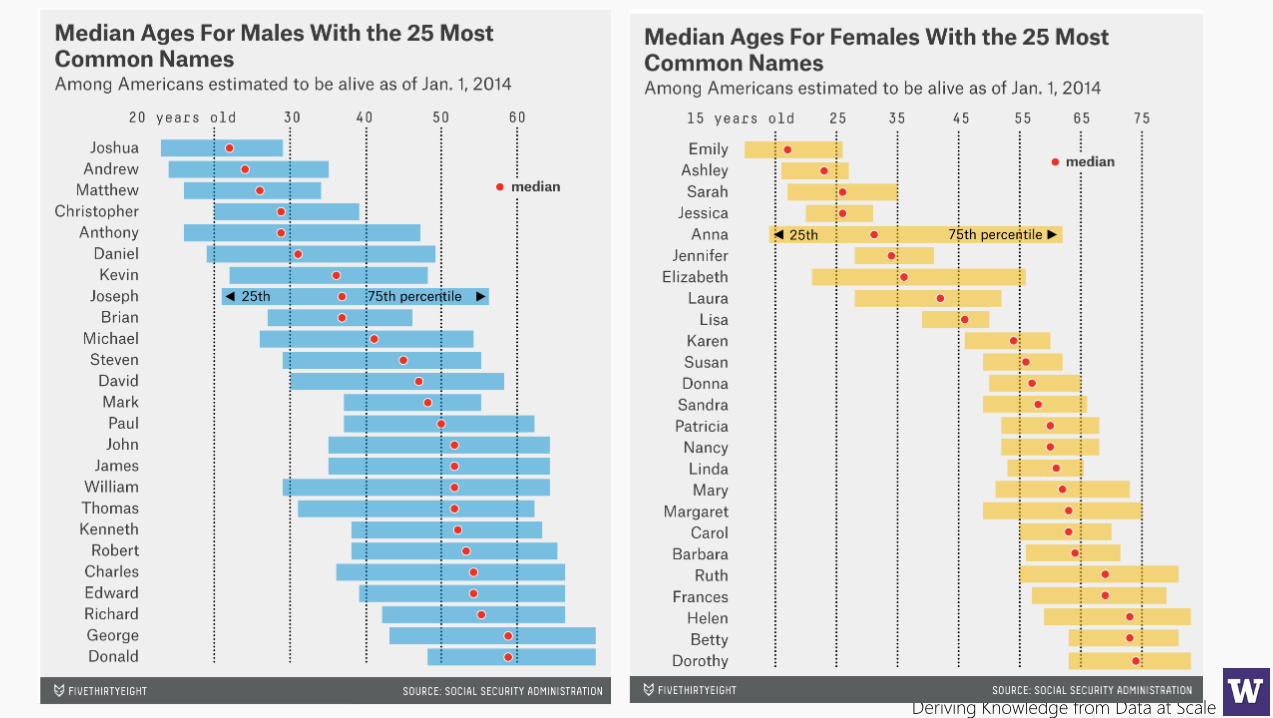
You can make much stronger inferences about a woman named Brittany. That name was very popular from the mid-1980s through the mid-1990s, but it wasn’t all that common before and hasn’t been since. If you know a Brittany, she is probably of college age or just a bit older. Half of living American Brittanys are between the ages of 19 and 25
Deriving Knowledge from Data at Scale

Deriving Knowledge from Data at Scale

Deriving Knowledge from Data at Scale

Deriving Knowledge from Data at Scale
Deriving Knowledge from Data at Scale
Deriving Knowledge from Data at Scale
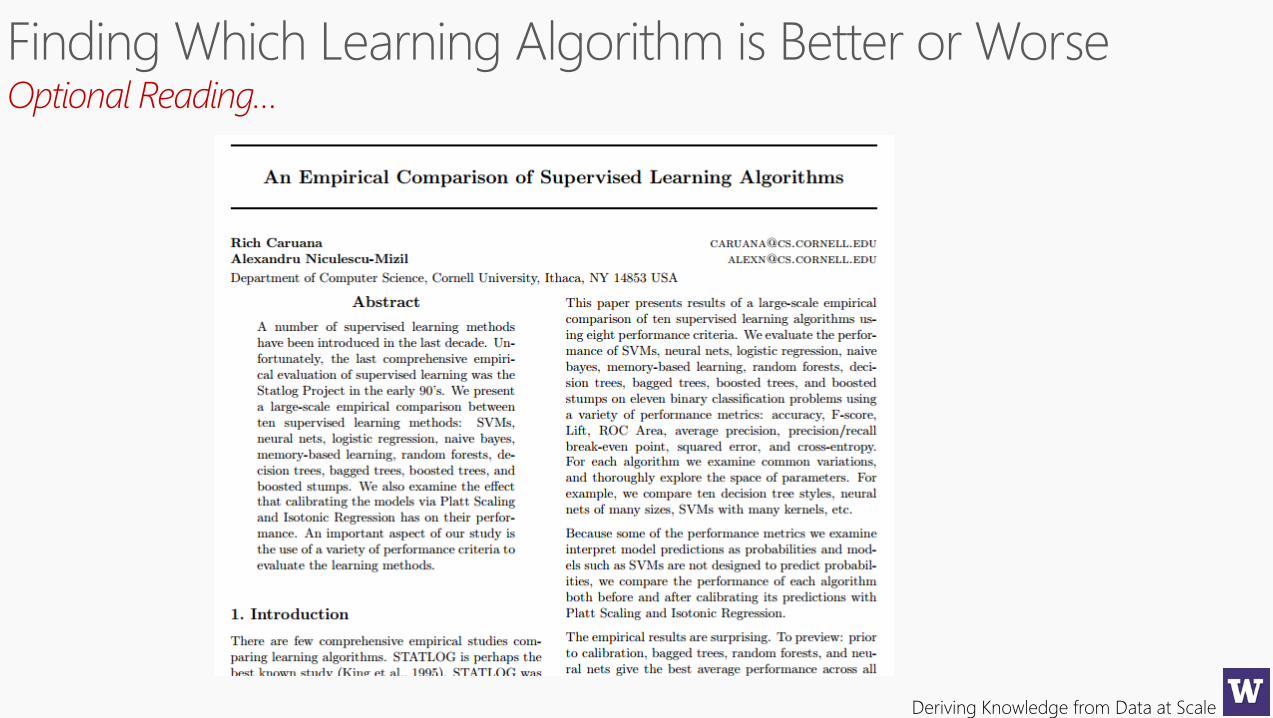
Optional Reading…
Deriving Knowledge from Data at Scale
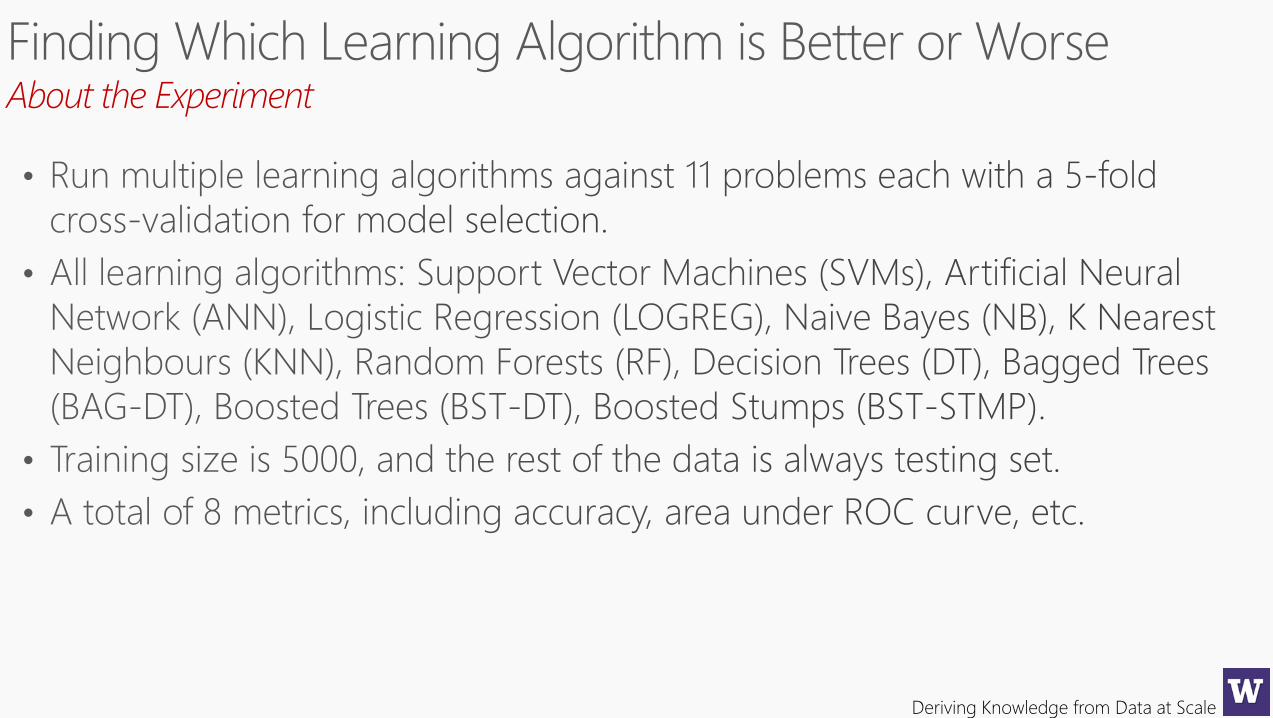
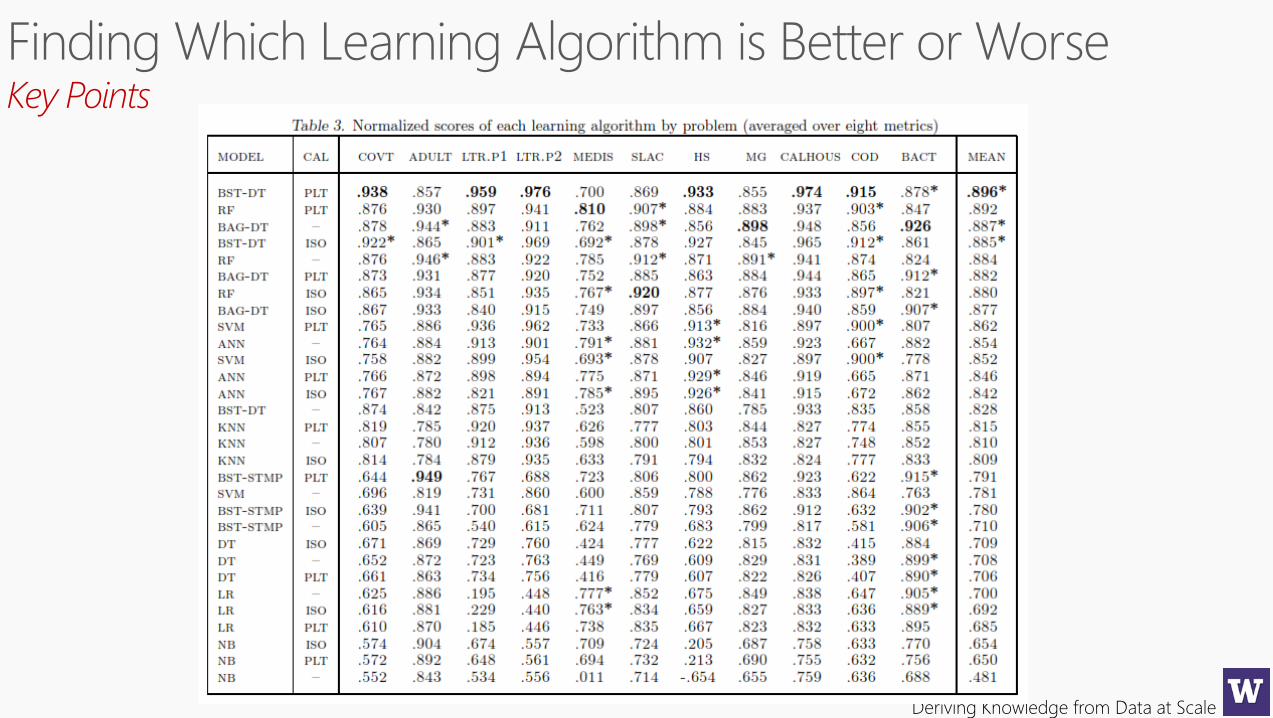
About the Experiment
Deriving Knowledge from Data at Scale
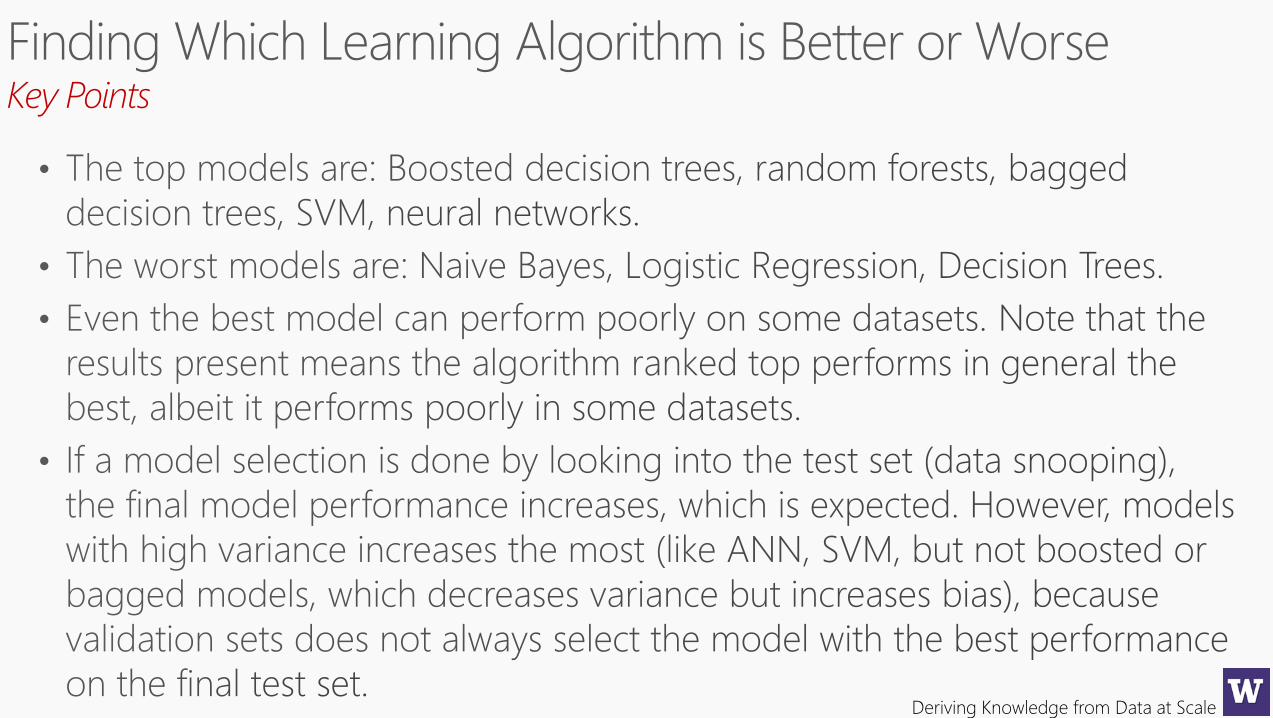
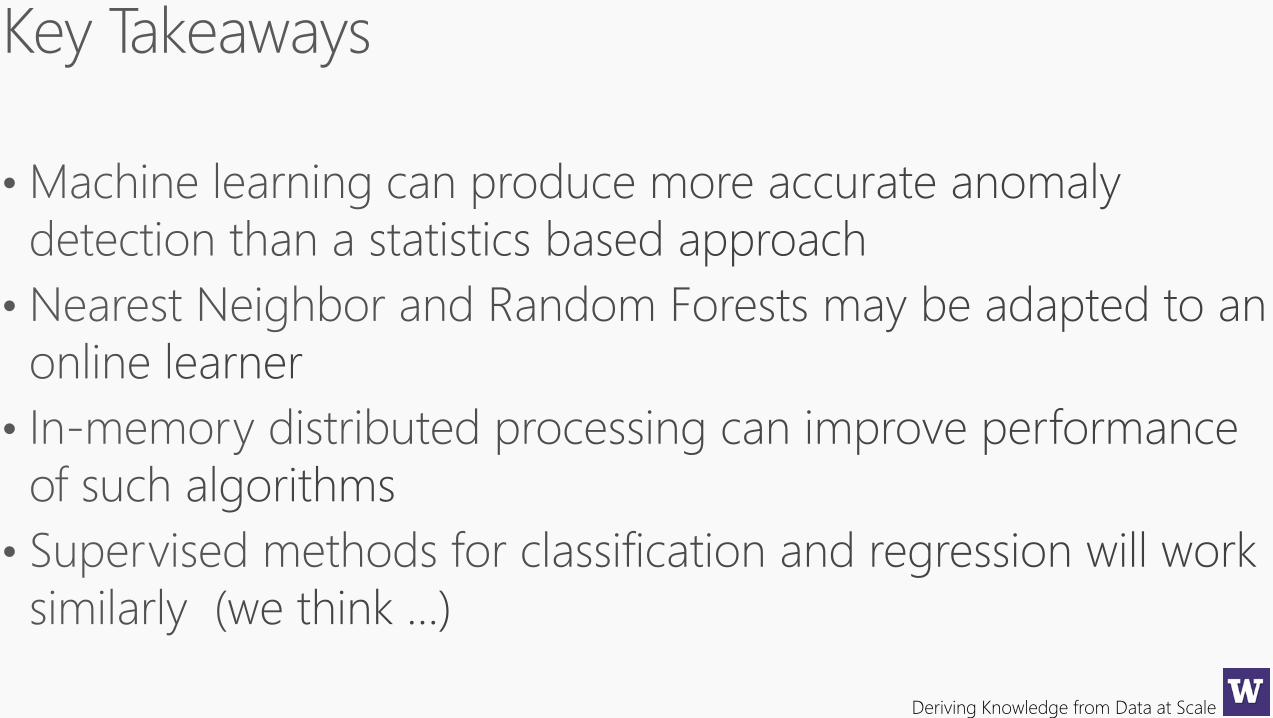
Key Points
Deriving Knowledge from Data at Scale
Key Points
Deriving Knowledge from Data at Scale
Deriving Knowledge from Data at Scale
Read to Hack Your Machine Learning Development
Deriving Knowledge from Data at Scale
Read to Hack Your Machine Learning Development
Deriving Knowledge from Data at Scale
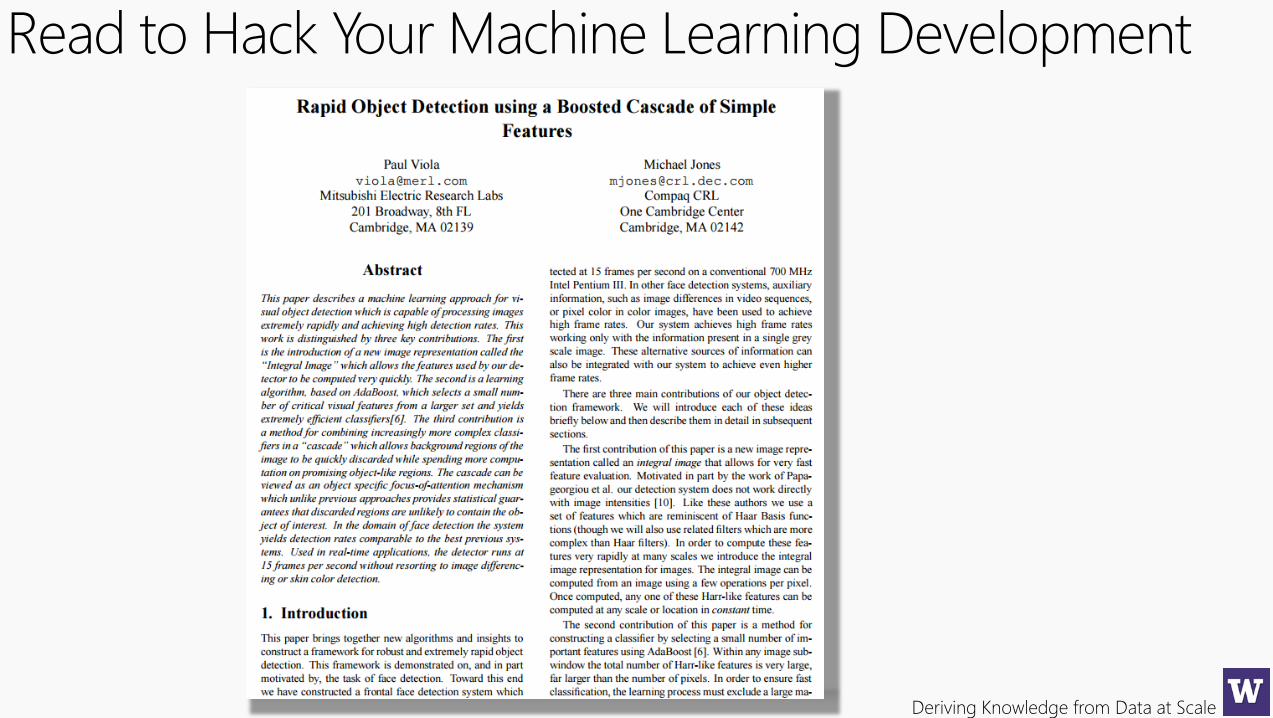
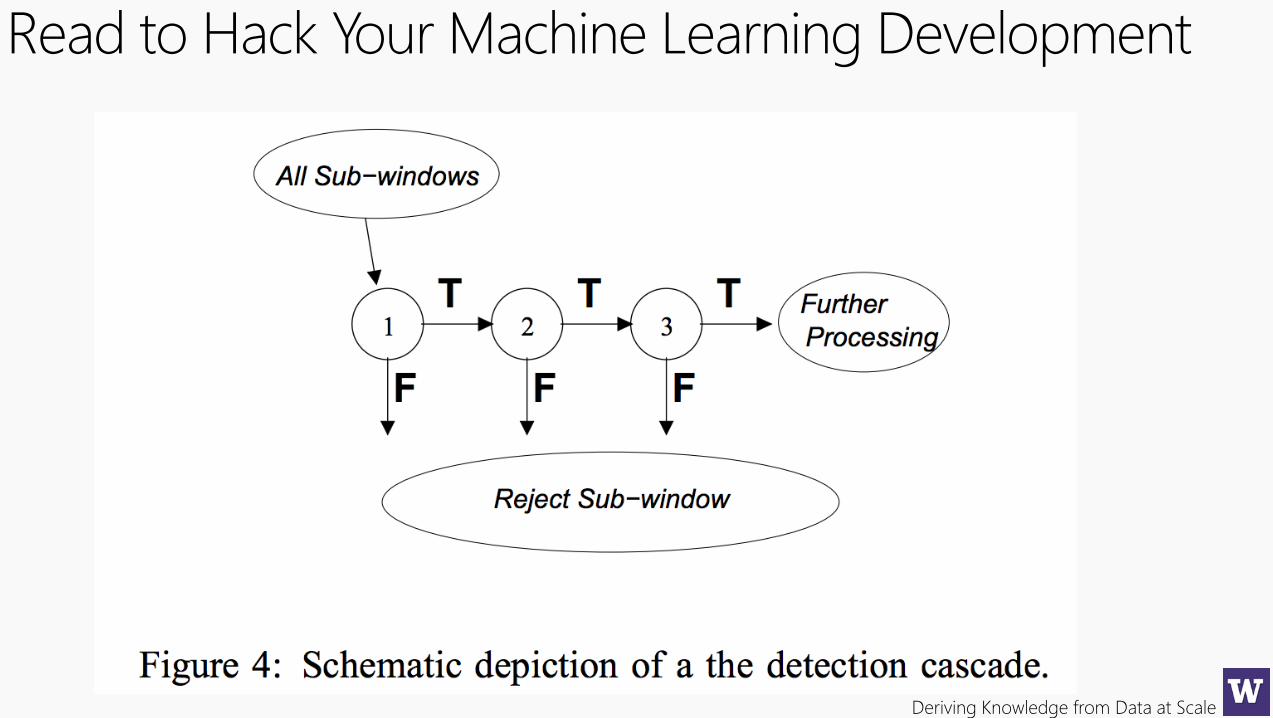
Read to Hack Your Machine Learning DevelopmentCascade Classifier is one of the most popular face detection algorithms and the default choice in OpenCV libraries as well. Highly accurate and very fast…
• 15 times faster than previous work at the time, fast enough for realtime;
• Intuition: Accurate and complex models are computational expensive. The input are subjected to a series of increasing accurate and expensive models, and the most expensive model will be used on only the most promising input. So it asks a series of questions like: 1) Does model one thinks it is a face? If no, stop. If Yes, ask model two. 2) Does model two thinks it is a face? If no, stop. If yes, ask model three. And so on, until the last model also say yes.
• Feature-based then pixel-based. Haar-like features were created for the images. Note working with pixels is generally very computational expensive.
• Haar-like features are basically high-level features over pixels. For example, the feature observation that the region of the eyes is darker than the region of the cheeks. This can be used as a feature input to the model.
Deriving Knowledge from Data at Scale
Better, Best?Simple (single) Classifier, Bagging, or Boosting?
Bagging: Multiple classifiers trained on different under-sampled subsets and allow classifiers to vote on final decision, in contrast to using just one classifier.
Boosting: Series of classifiers to train on the dataset, but gradually putting more emphasis on training examples that the previous classifiers have failed on, in the hope of that the next classifier will focus on these harder examples. So in the end, you will have a series of classifiers who are in general balanced but slightly more focused on the hard training examples.
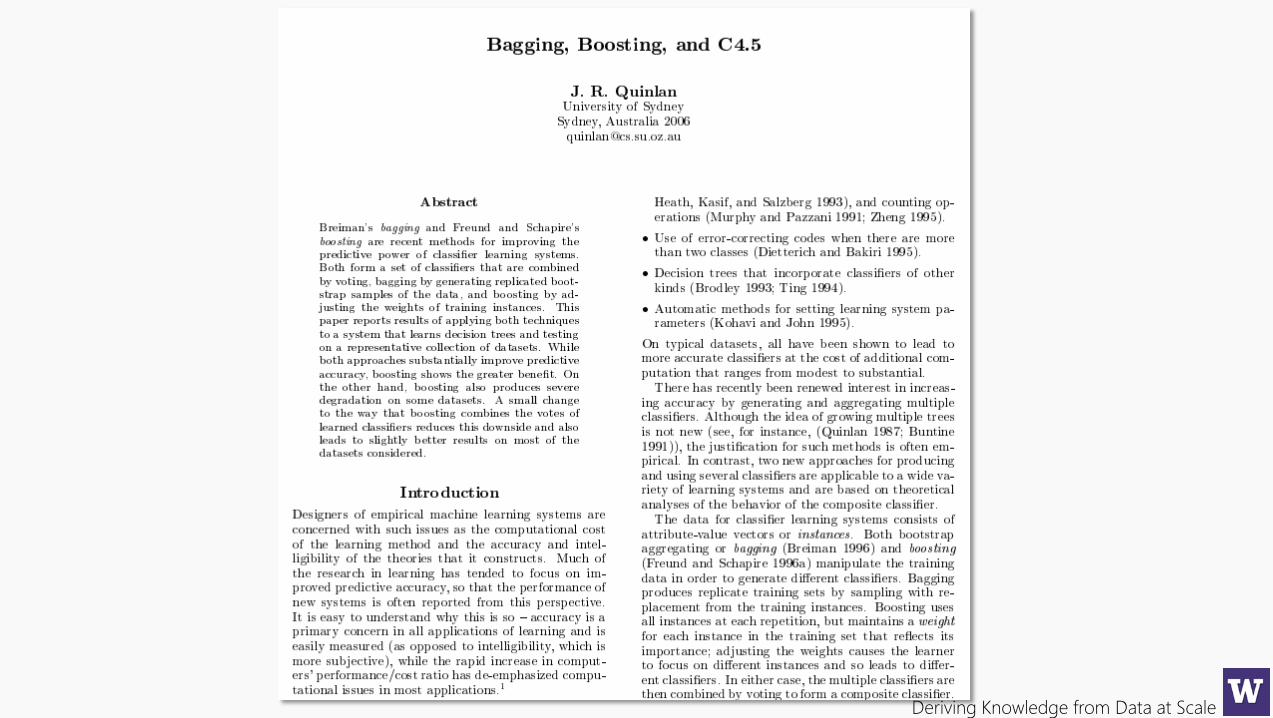
In practice, boosting beats bagging, either bagging and boosting will beat a plain classifier. See ‘Bagging, Boosting and C4.5’ by JR Quinlan. Related work and experience is that Random Forest models are as good as boosting.
Deriving Knowledge from Data at Scale
Deriving Knowledge from Data at Scale
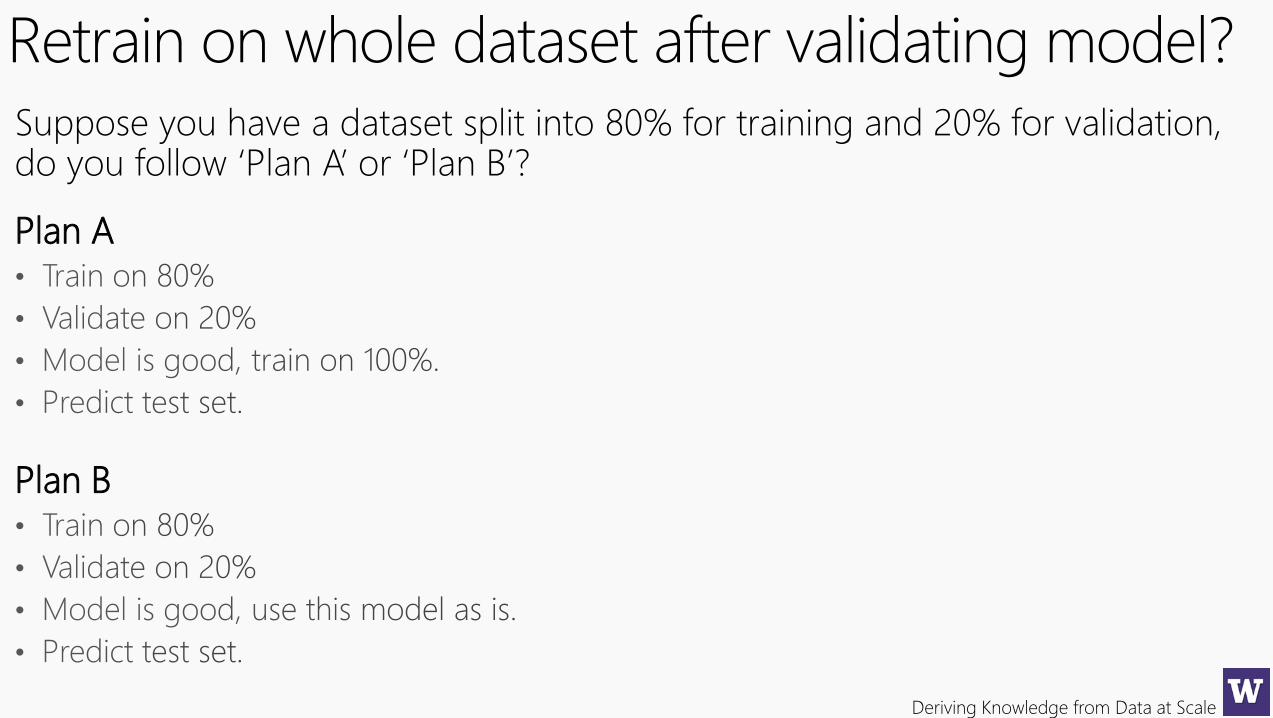
Retrain on whole dataset after validating model?Suppose you have a dataset split into 80% for training and 20% for validation, do you follow ‘Plan A’ or ‘Plan B’?
Plan A
Plan B
Deriving Knowledge from Data at Scale
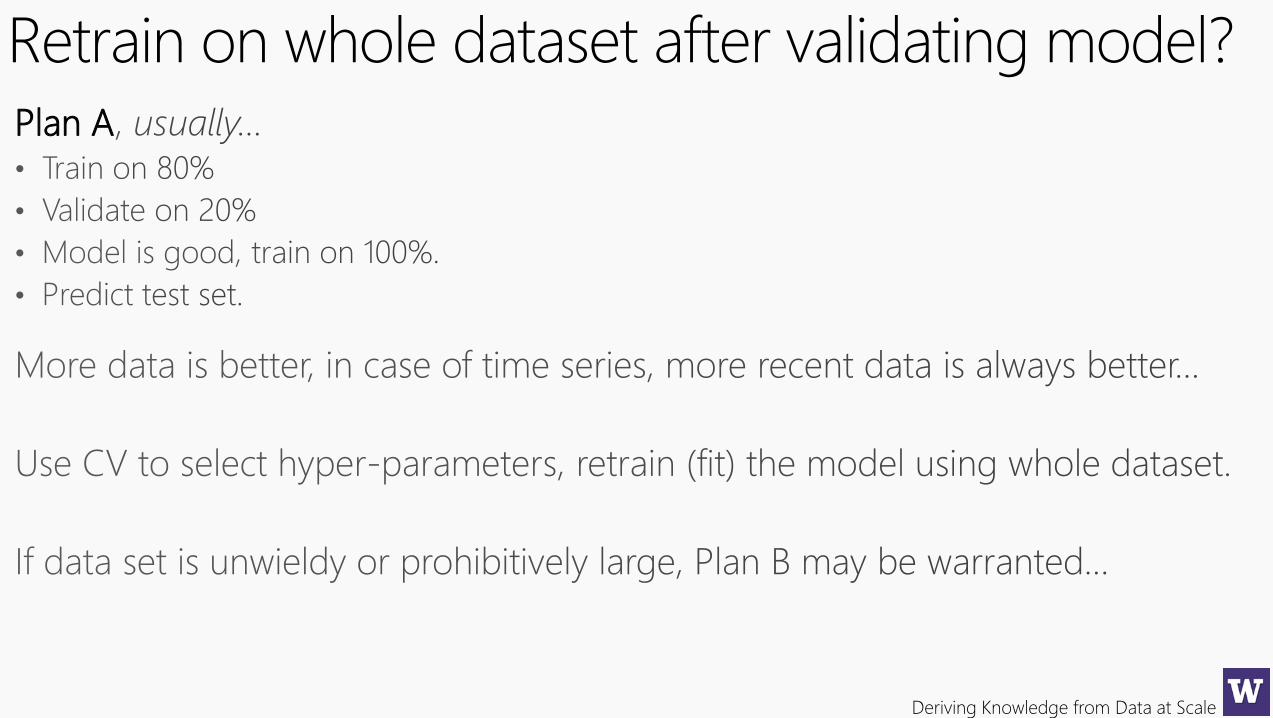
Retrain on whole dataset after validating model?Plan A
Deriving Knowledge from Data at Scale
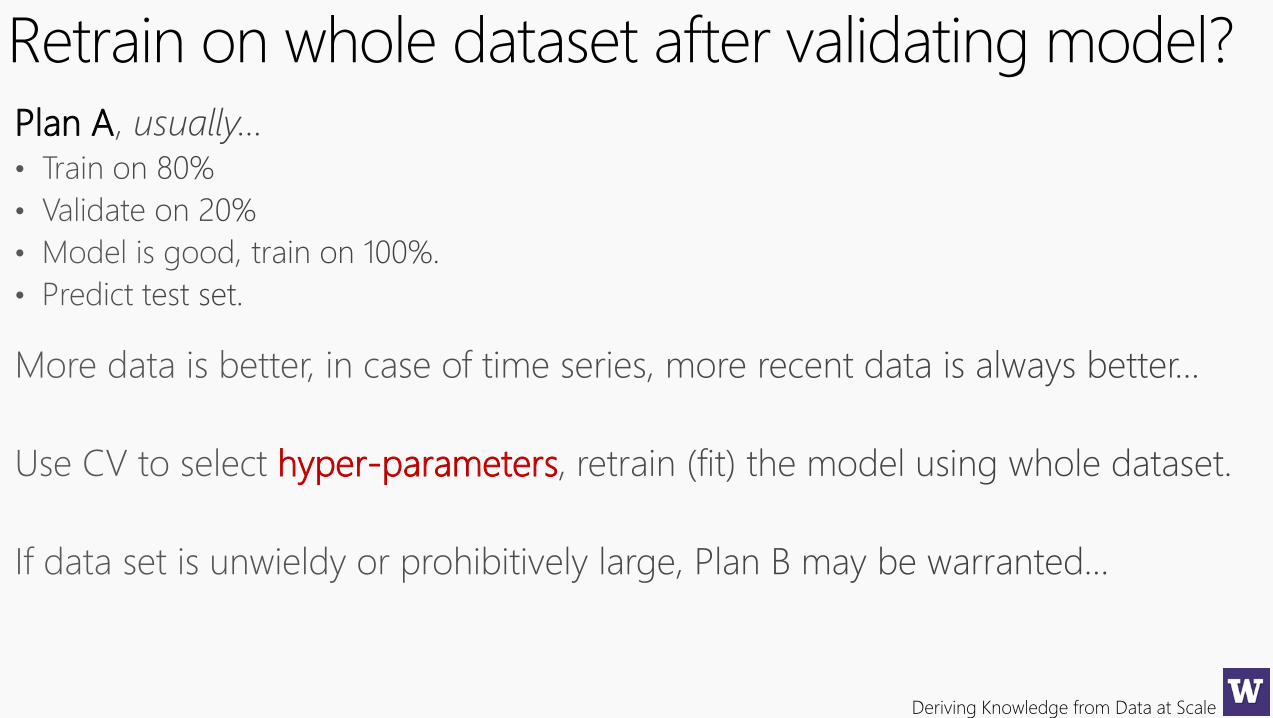
Retrain on whole dataset after validating model?Plan A
hyper-parameters
Deriving Knowledge from Data at Scale
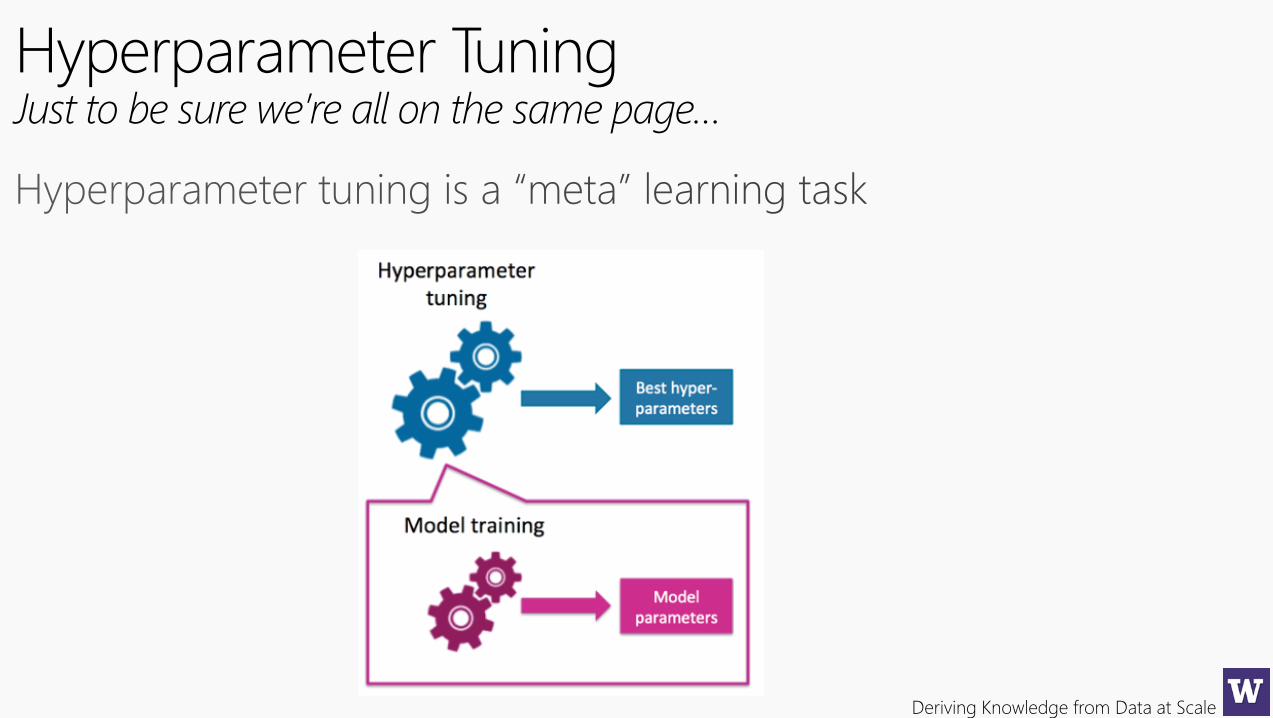
Hyperparameter TuningJust to be sure we’re all on the same page…
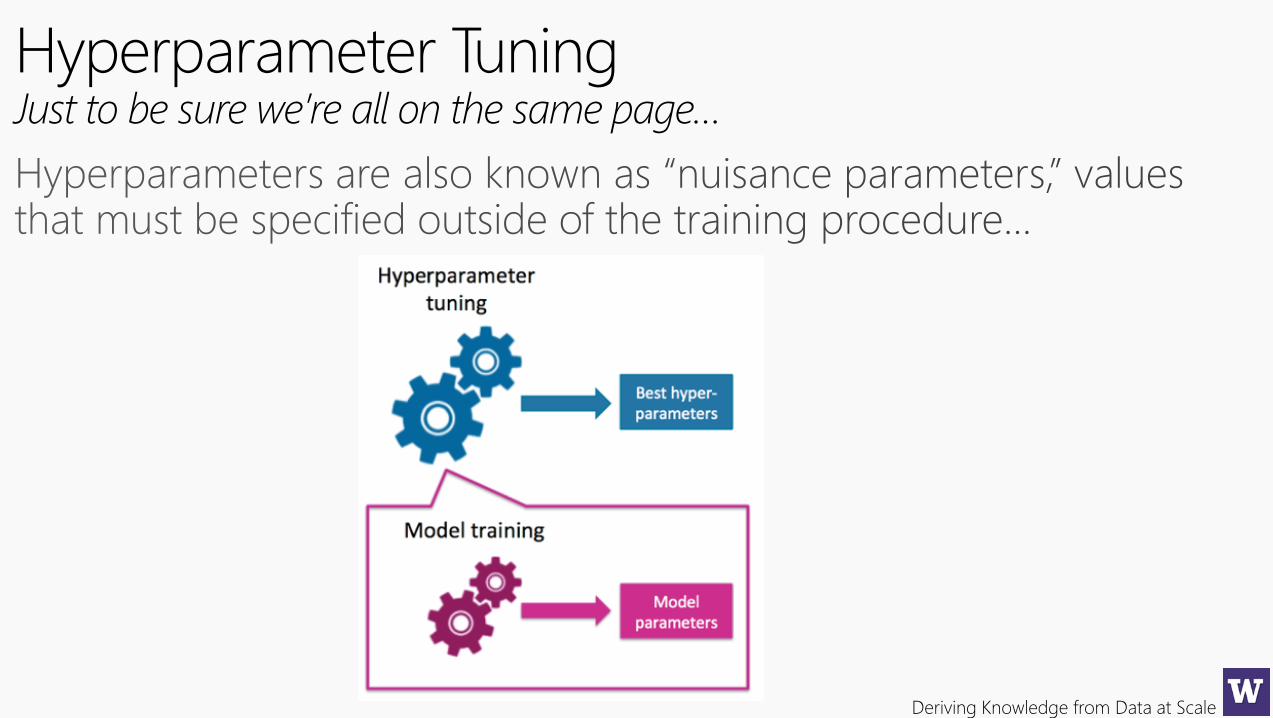
Deriving Knowledge from Data at Scale
Hyperparameter TuningJust to be sure we’re all on the same page…
Deriving Knowledge from Data at Scale
Hyperparameter TuningJust to be sure we’re all on the same page…
Deriving Knowledge from Data at Scale
Hyperparameter TuningJust to be sure we’re all on the same page…
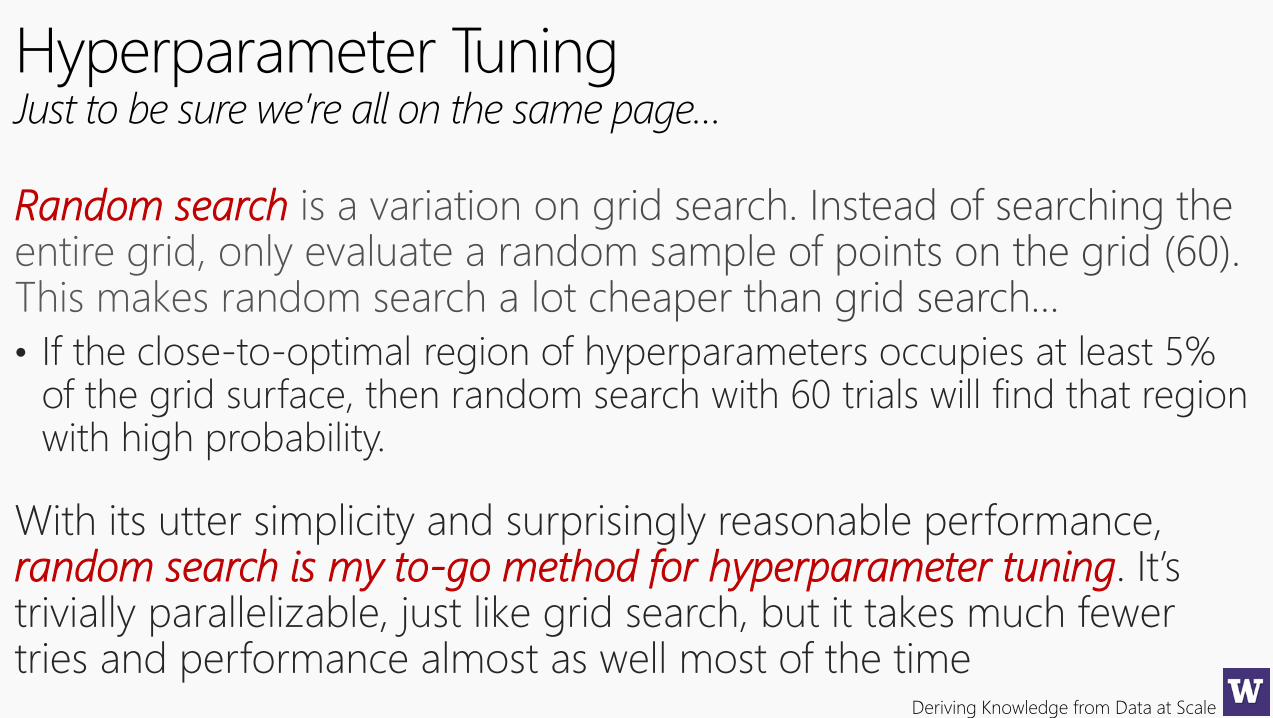
Random search
• If the close-to-optimal region of hyperparameters occupies at least 5% of the grid surface, then random search with 60 trials will find that region with high probability.
With its utter simplicity and surprisingly reasonable performance, random search is my to-go method for hyperparameter tuning. It’s trivially parallelizable, just like grid search, but it takes much fewer tries and performance almost as well most of the time

Deriving Knowledge from Data at Scale
Feature Creation
Deriving Knowledge from Data at Scale
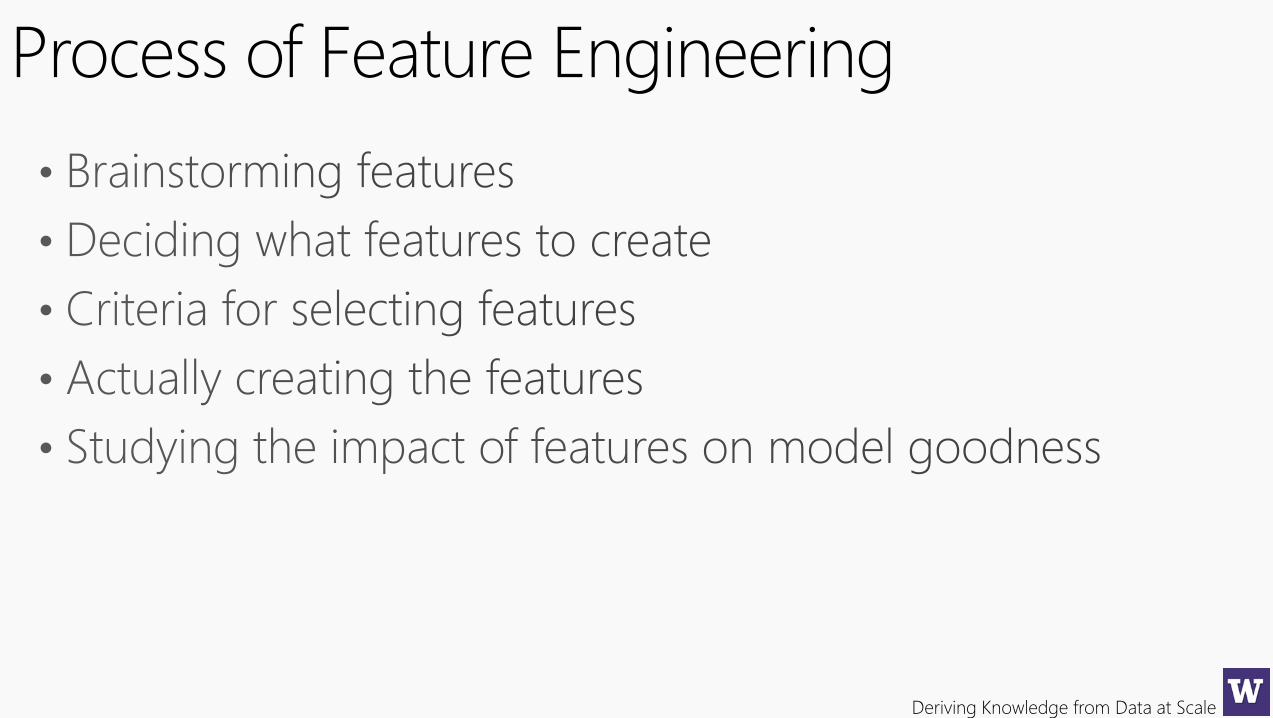
Process of Feature Engineering
Deriving Knowledge from Data at Scale
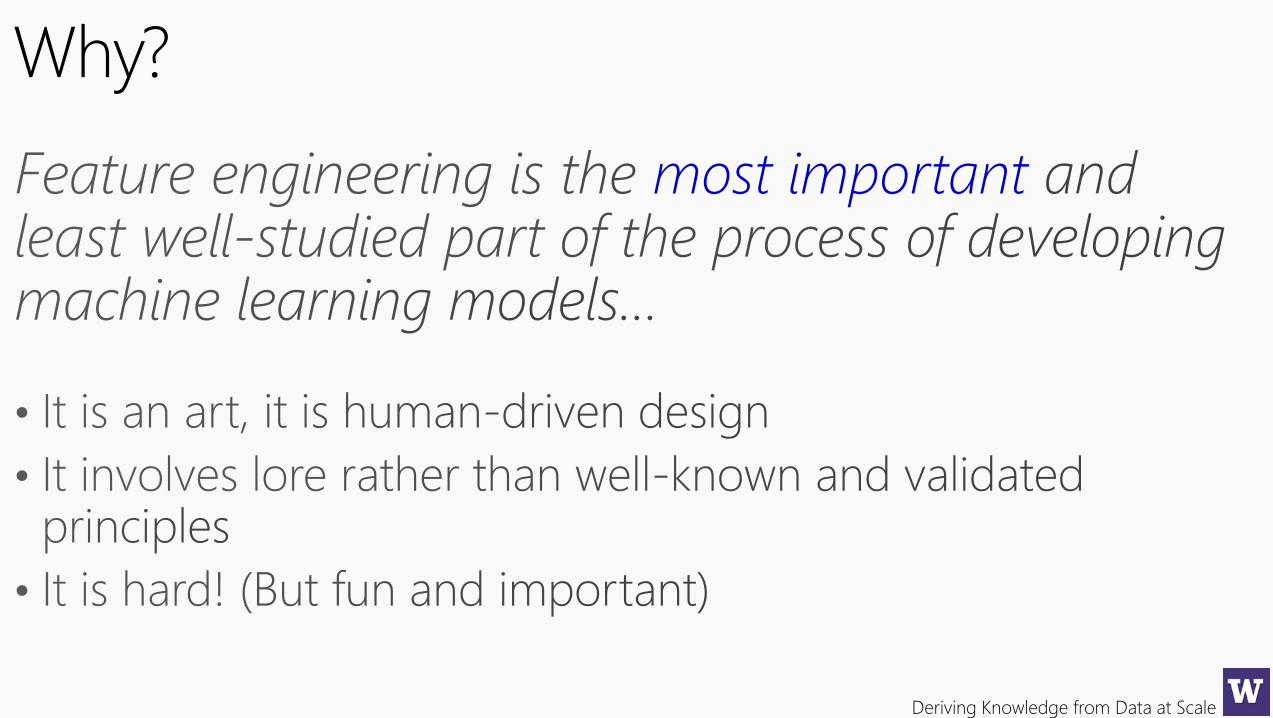
Why?
most important
Deriving Knowledge from Data at Scale
Deriving Knowledge from Data at Scale
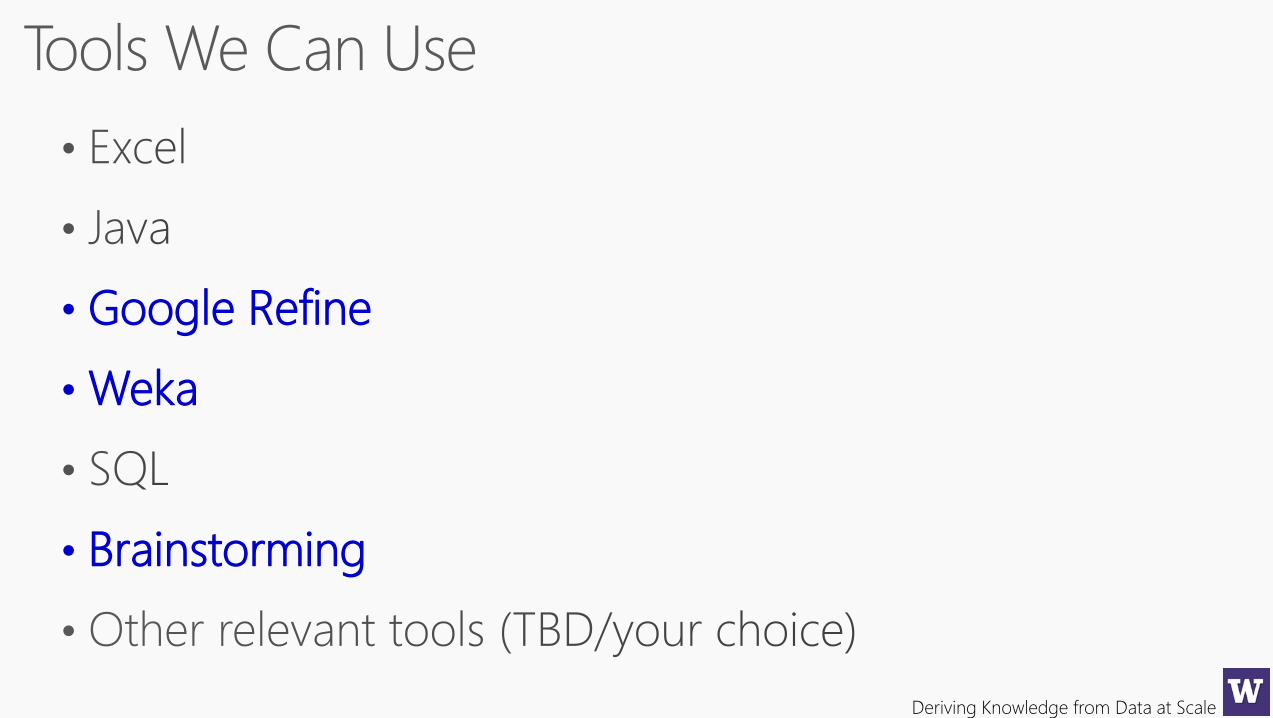
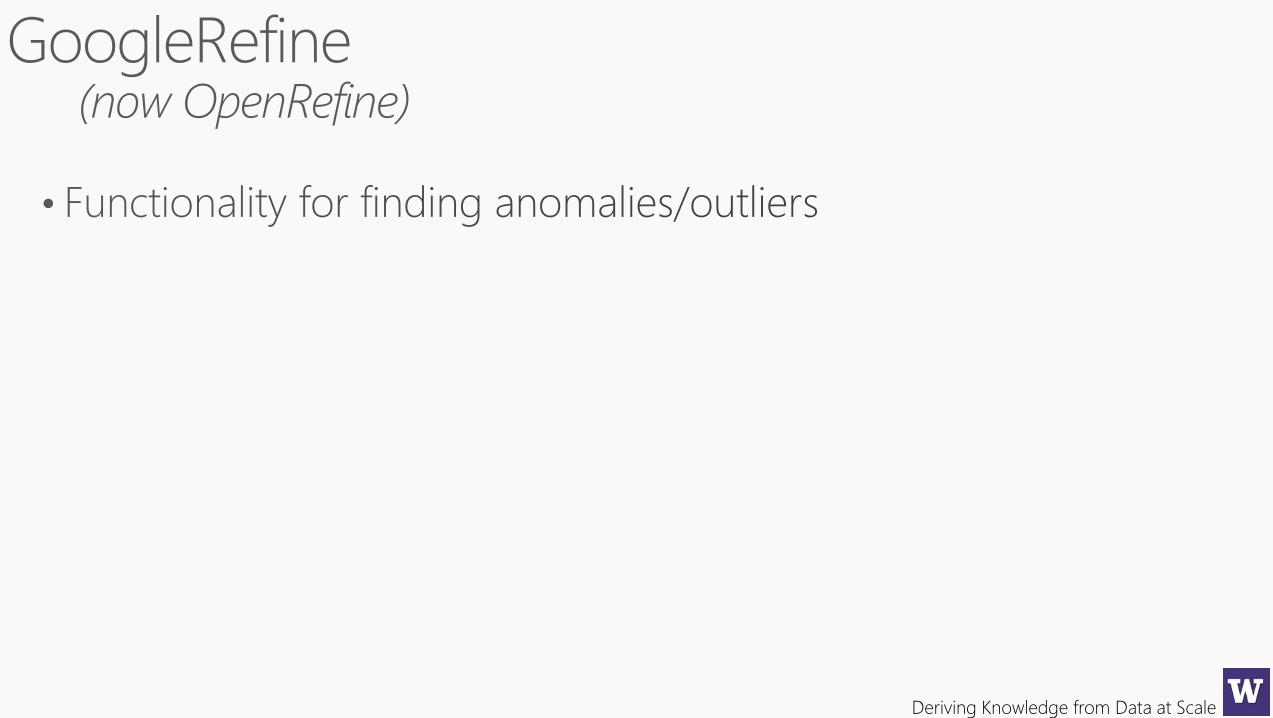
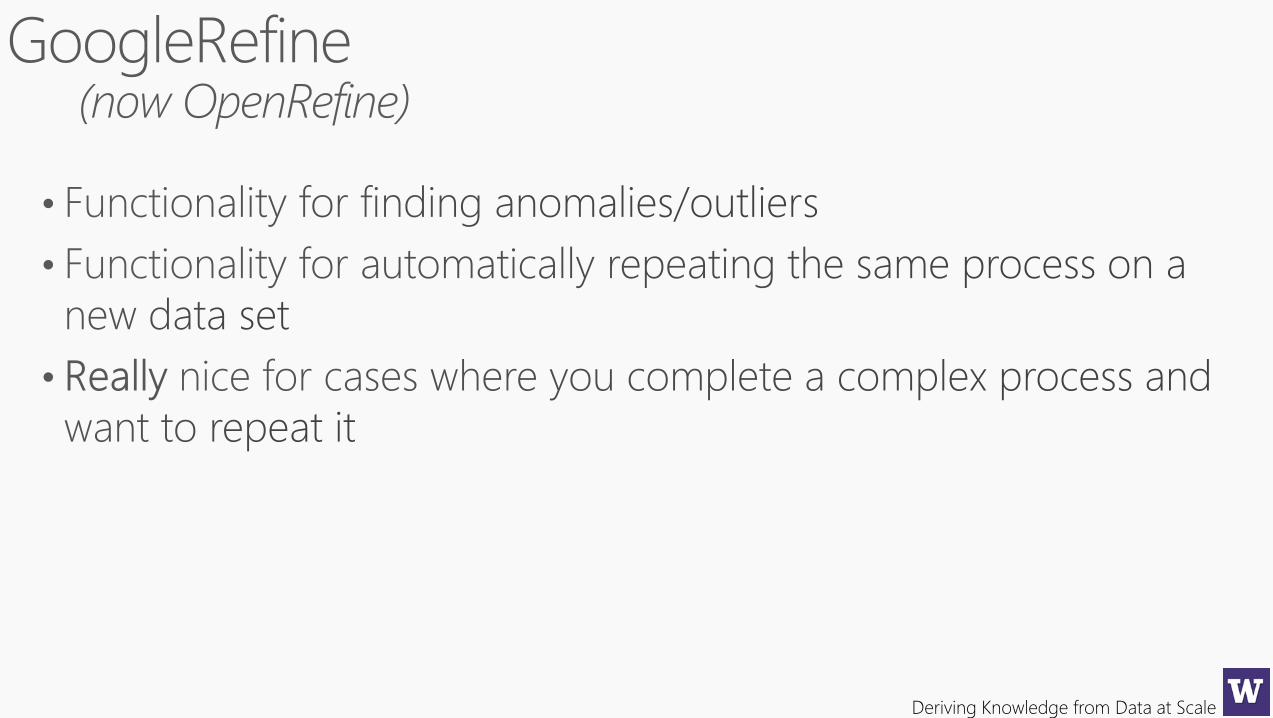
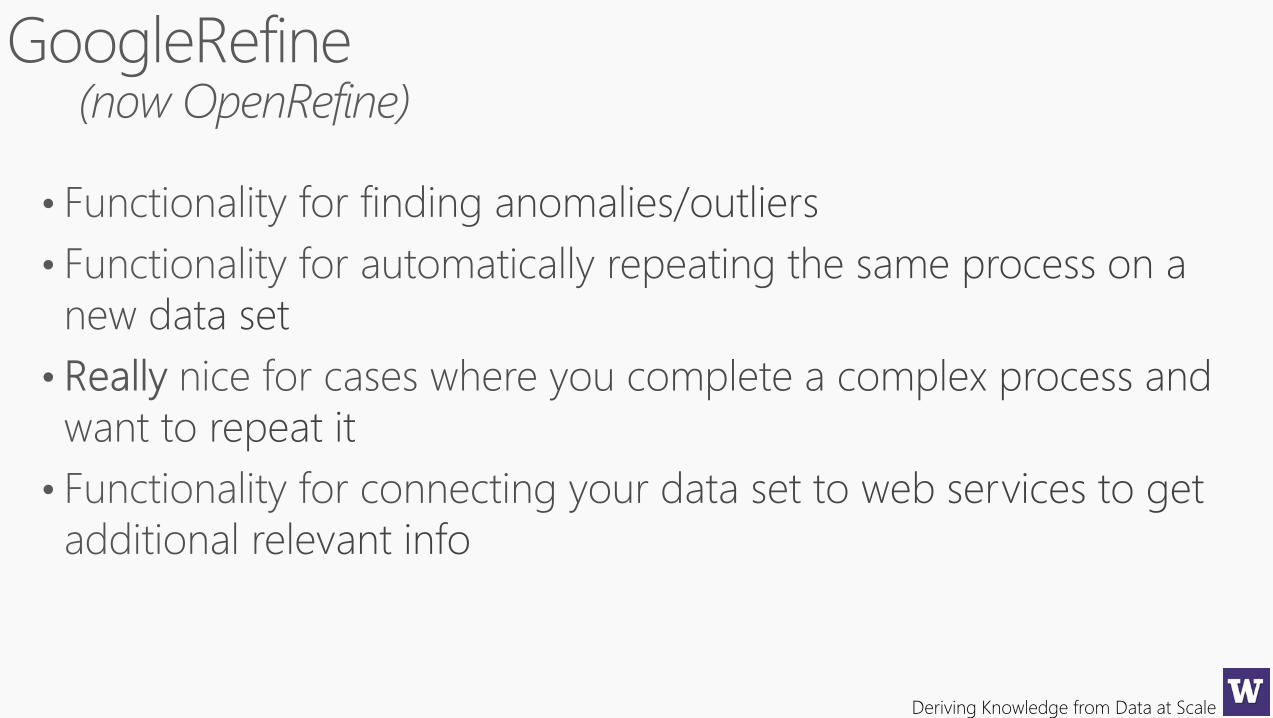
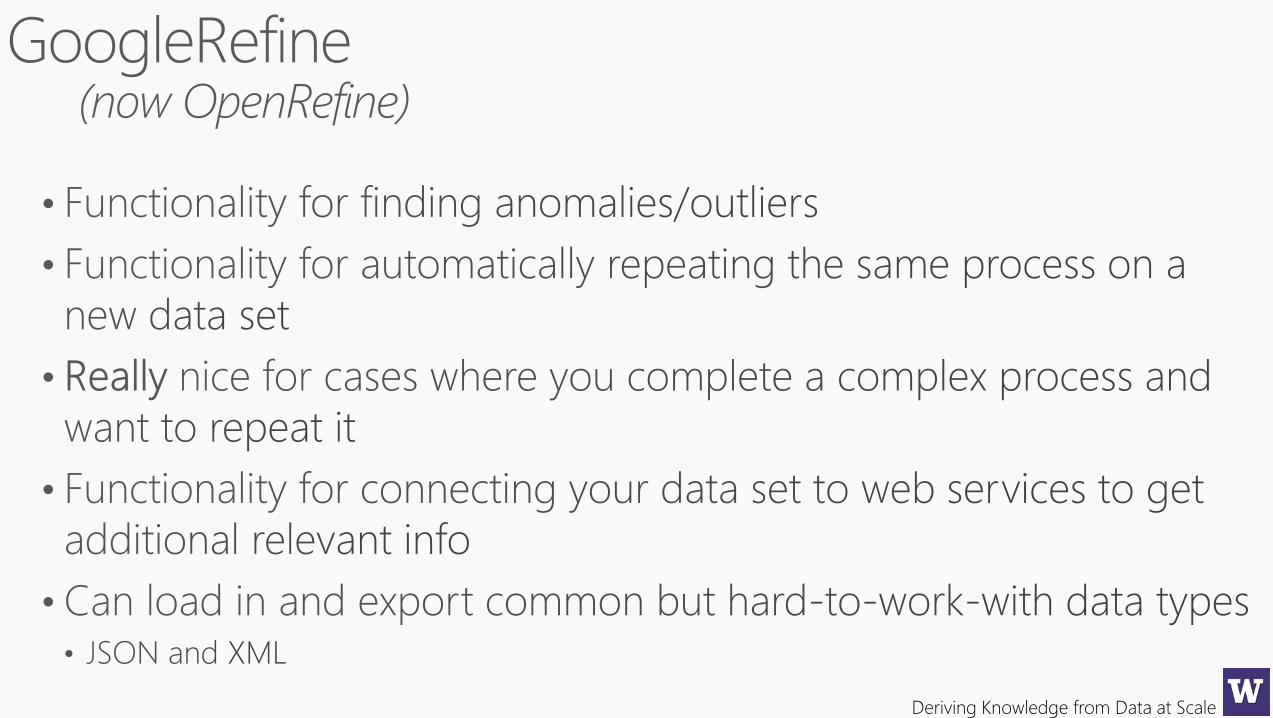
• Google Refine
• Weka
• Brainstorming
Deriving Knowledge from Data at Scale
Deriving Knowledge from Data at Scale
Deriving Knowledge from Data at Scale
Deriving Knowledge from Data at Scale
Deriving Knowledge from Data at Scale

Deriving Knowledge from Data at Scale
https://www.youtube.com/watch?v=yNccGtn3Wb0
https://www.youtube.com/watch?v=cO8NVCs_Ba0
https://www.youtube.com/watch?v=5tsyz3ibYzk

Deriving Knowledge from Data at Scale

Deriving Knowledge from Data at Scale

Deriving Knowledge from Data at Scale
Deriving Knowledge from Data at Scale
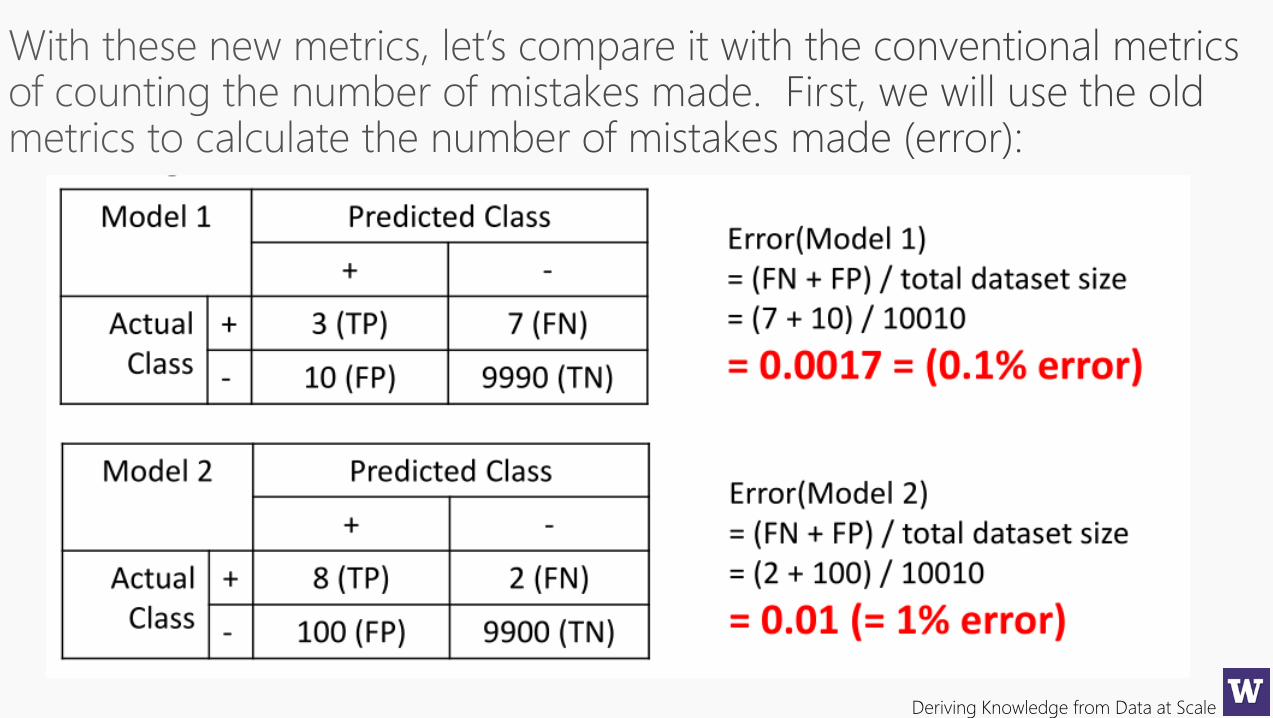
Not all errors are equalWe need better metrics…
Deriving Knowledge from Data at Scale
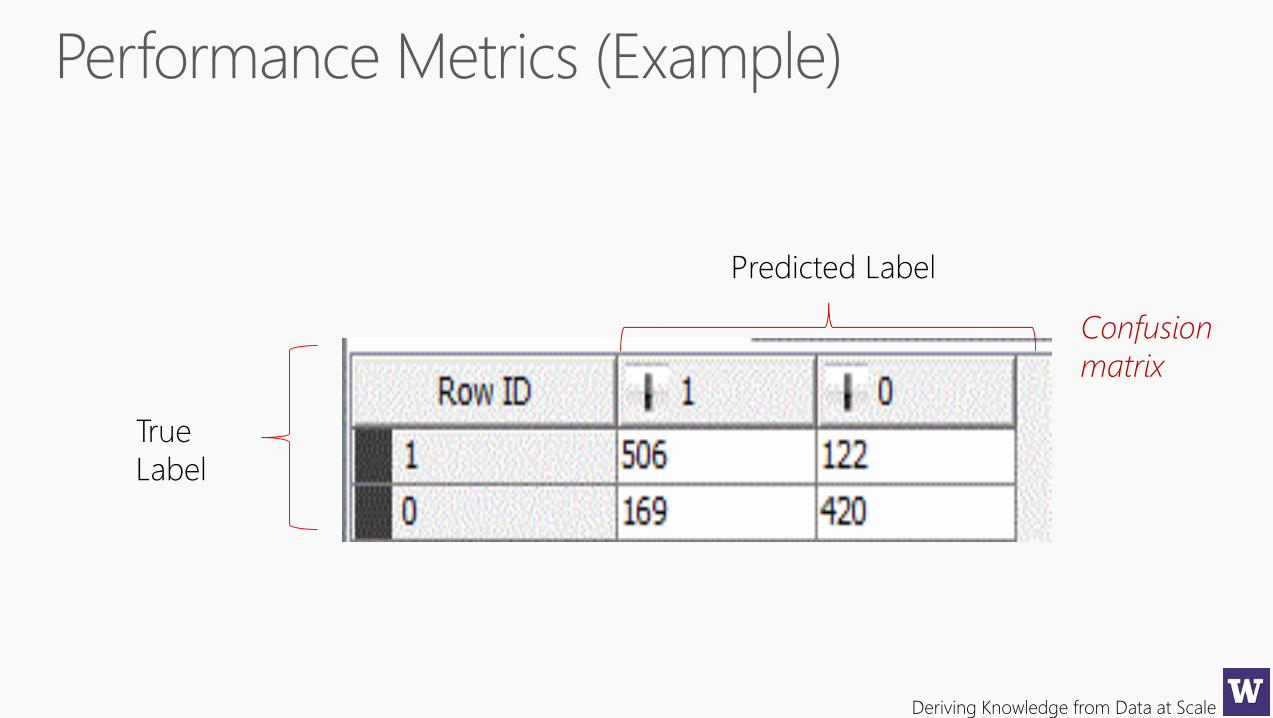
True
Label
Predicted Label
Confusion
matrix
Deriving Knowledge from Data at Scale
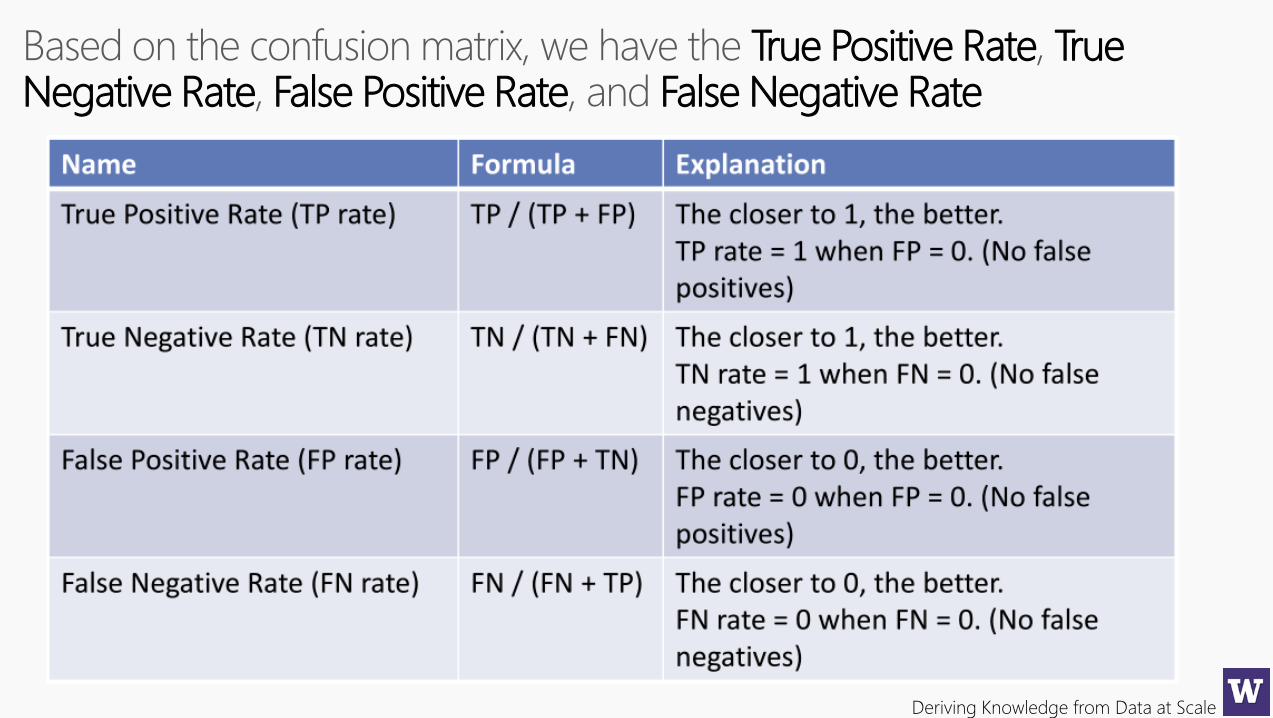
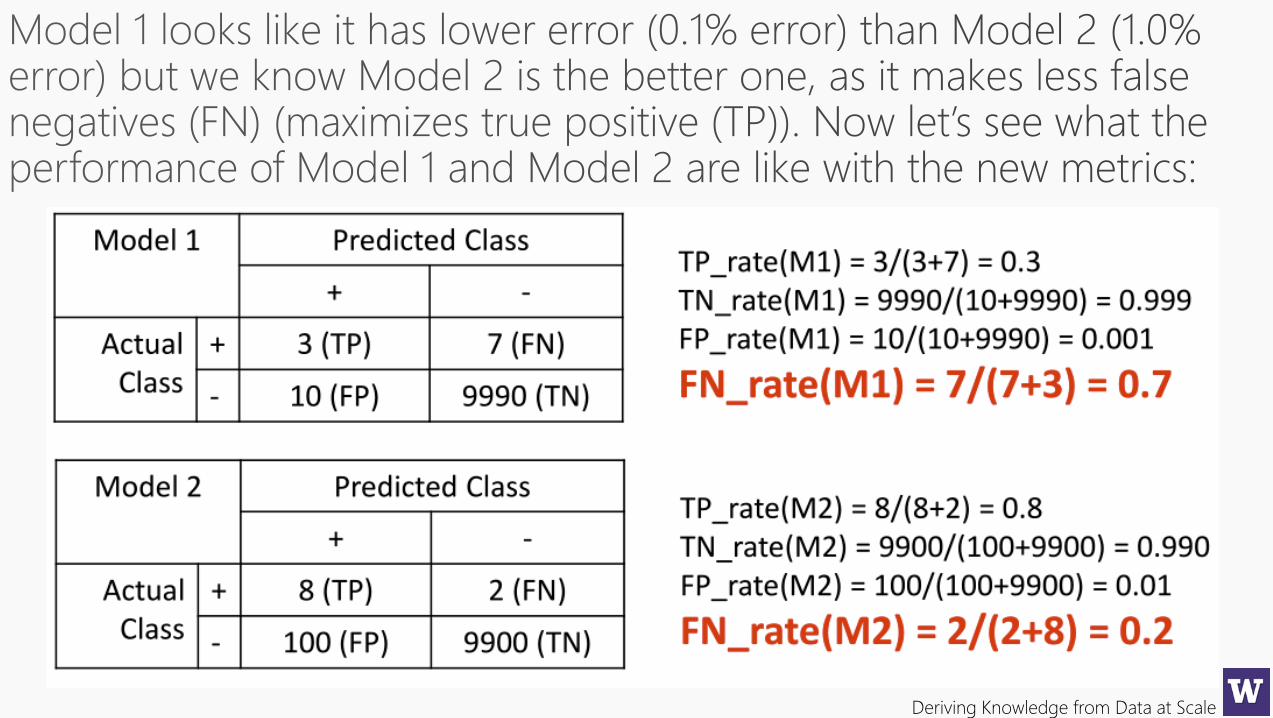
True Positive Rate True Negative Rate False Positive Rate False Negative Rate
Deriving Knowledge from Data at Scale
Deriving Knowledge from Data at Scale
Deriving Knowledge from Data at Scale
Deriving Knowledge from Data at Scale
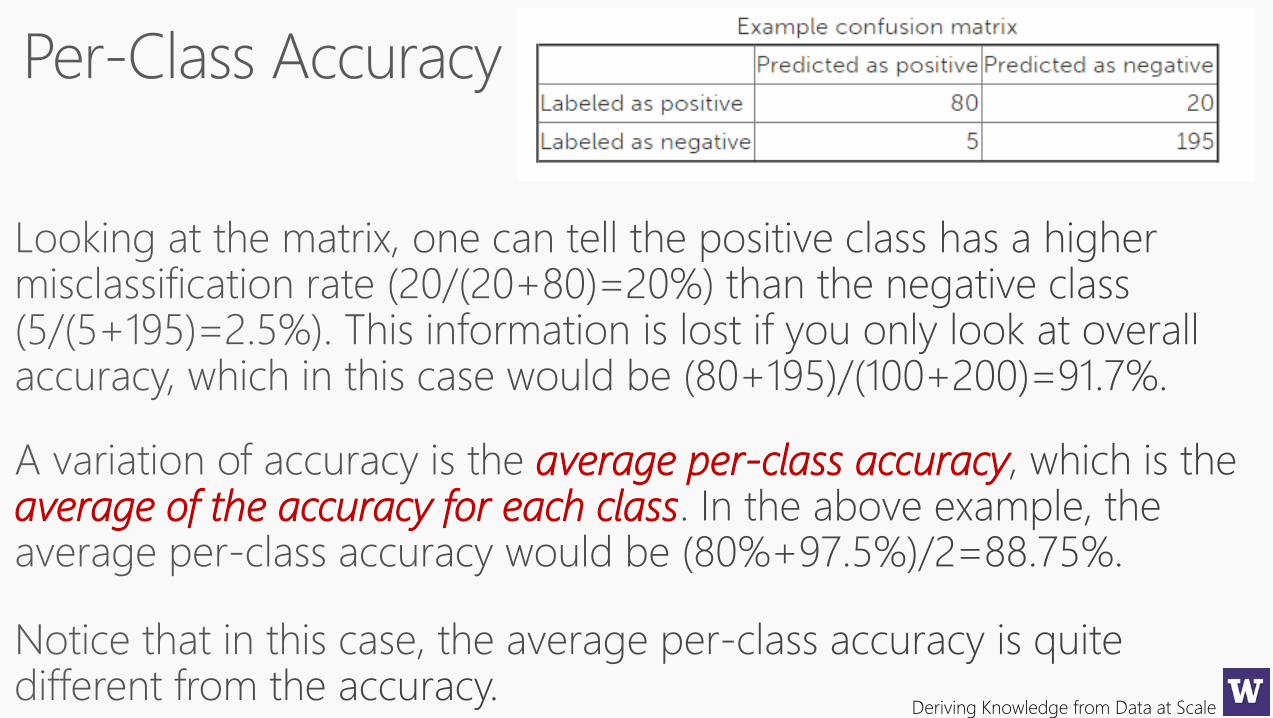
average per-class accuracyaverage of the accuracy for each class
Deriving Knowledge from Data at Scale
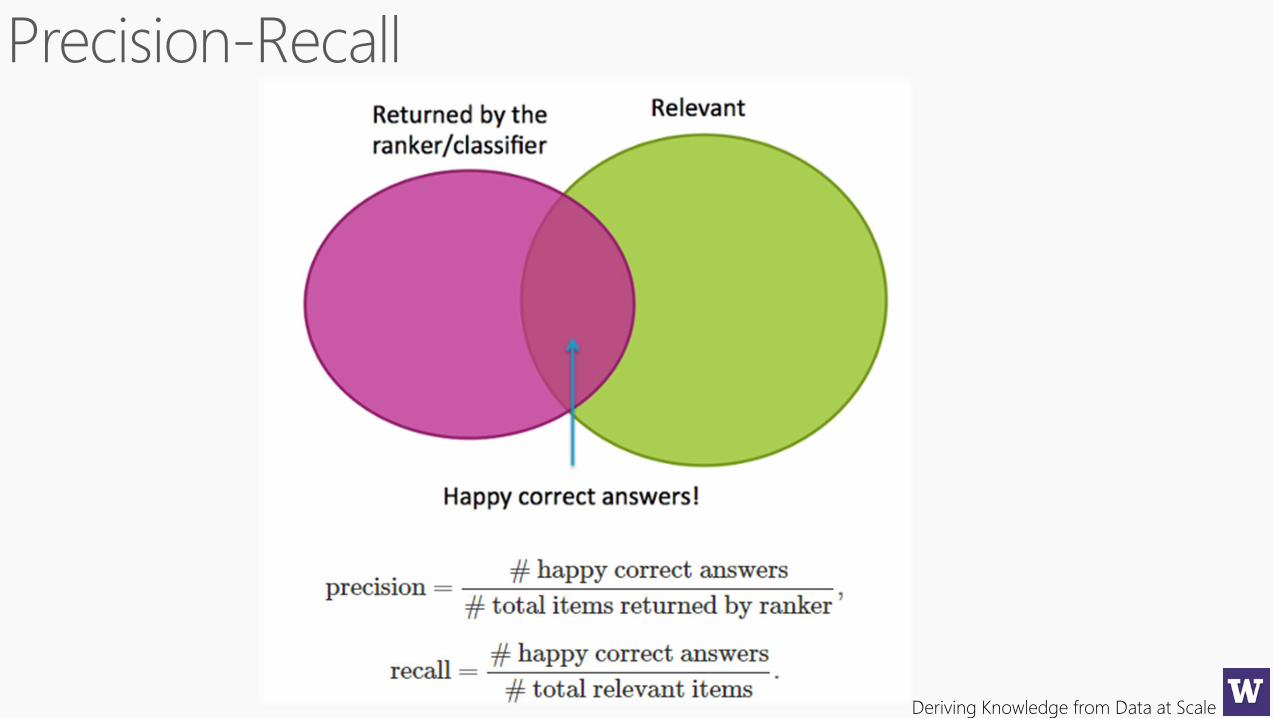
Deriving Knowledge from Data at Scale
Deriving Knowledge from Data at Scale
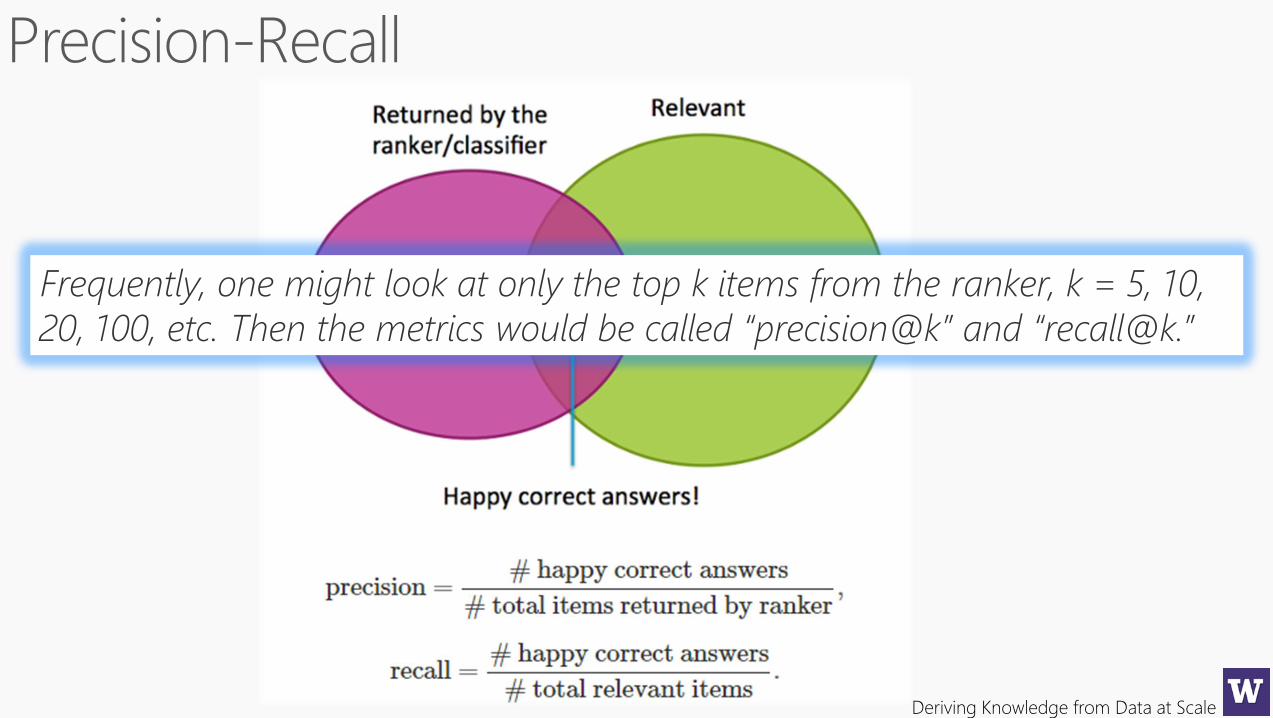
Frequently, one might look at only the top k items from the ranker, k = 5, 10,
20, 100, etc. Then the metrics would be called “precision@k” and “recall@k.”
Deriving Knowledge from Data at Scale
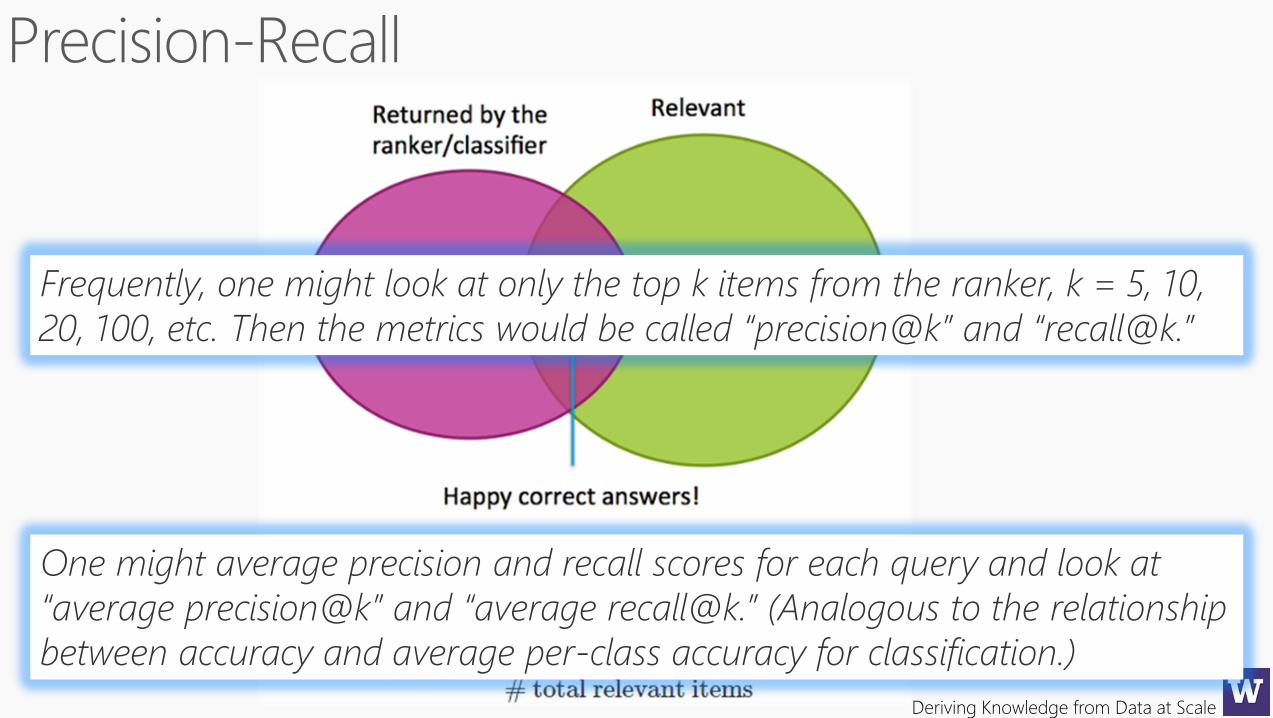
Frequently, one might look at only the top k items from the ranker, k = 5, 10,
20, 100, etc. Then the metrics would be called “precision@k” and “recall@k.”
One might average precision and recall scores for each query and look at
“average precision@k” and “average recall@k.” (Analogous to the relationship
between accuracy and average per-class accuracy for classification.)
Deriving Knowledge from Data at Scale
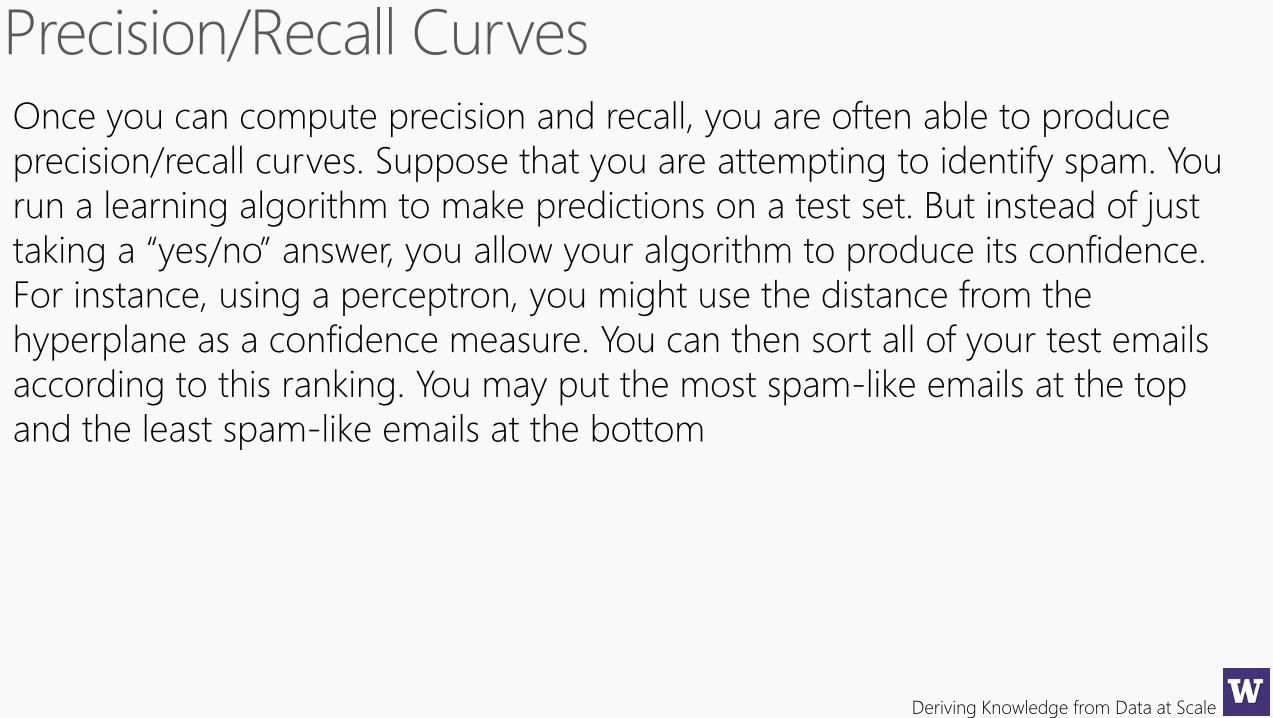
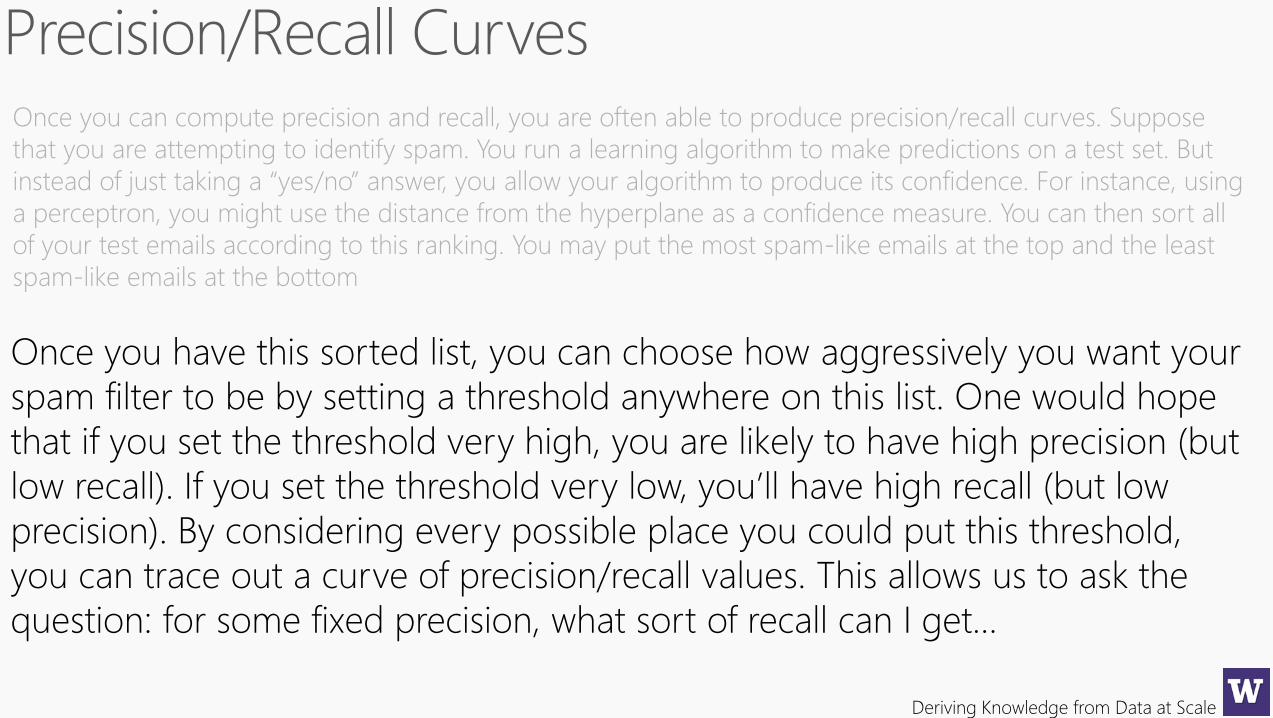
Once you can compute precision and recall, you are often able to produce
precision/recall curves. Suppose that you are attempting to identify spam. You
run a learning algorithm to make predictions on a test set. But instead of just
taking a “yes/no” answer, you allow your algorithm to produce its confidence.
For instance, using a perceptron, you might use the distance from the
hyperplane as a confidence measure. You can then sort all of your test emails
according to this ranking. You may put the most spam-like emails at the top
and the least spam-like emails at the bottom
Deriving Knowledge from Data at Scale
Once you can compute precision and recall, you are often able to produce precision/recall curves. Suppose
that you are attempting to identify spam. You run a learning algorithm to make predictions on a test set. But
instead of just taking a “yes/no” answer, you allow your algorithm to produce its confidence. For instance, using
a perceptron, you might use the distance from the hyperplane as a confidence measure. You can then sort all
of your test emails according to this ranking. You may put the most spam-like emails at the top and the least
spam-like emails at the bottom
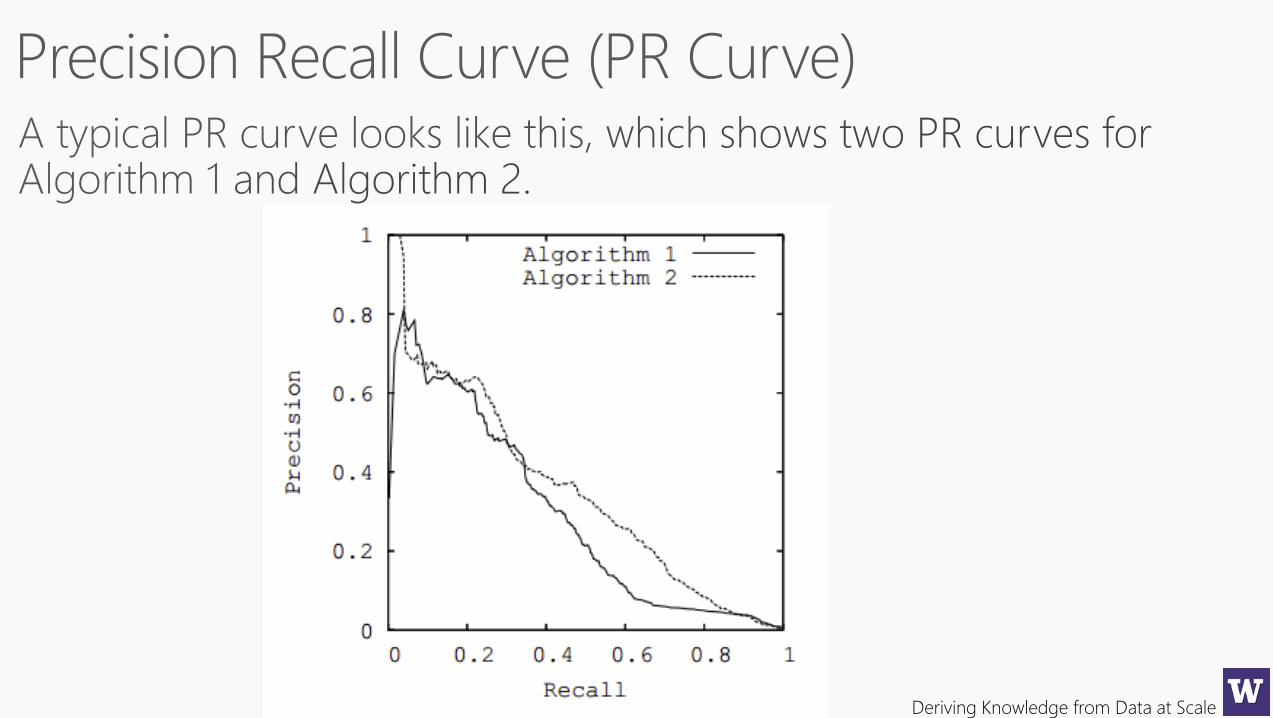
Once you have this sorted list, you can choose how aggressively you want your
spam filter to be by setting a threshold anywhere on this list. One would hope
that if you set the threshold very high, you are likely to have high precision (but
low recall). If you set the threshold very low, you’ll have high recall (but low
precision). By considering every possible place you could put this threshold,
you can trace out a curve of precision/recall values. This allows us to ask the
question: for some fixed precision, what sort of recall can I get…
Deriving Knowledge from Data at Scale
Deriving Knowledge from Data at Scale
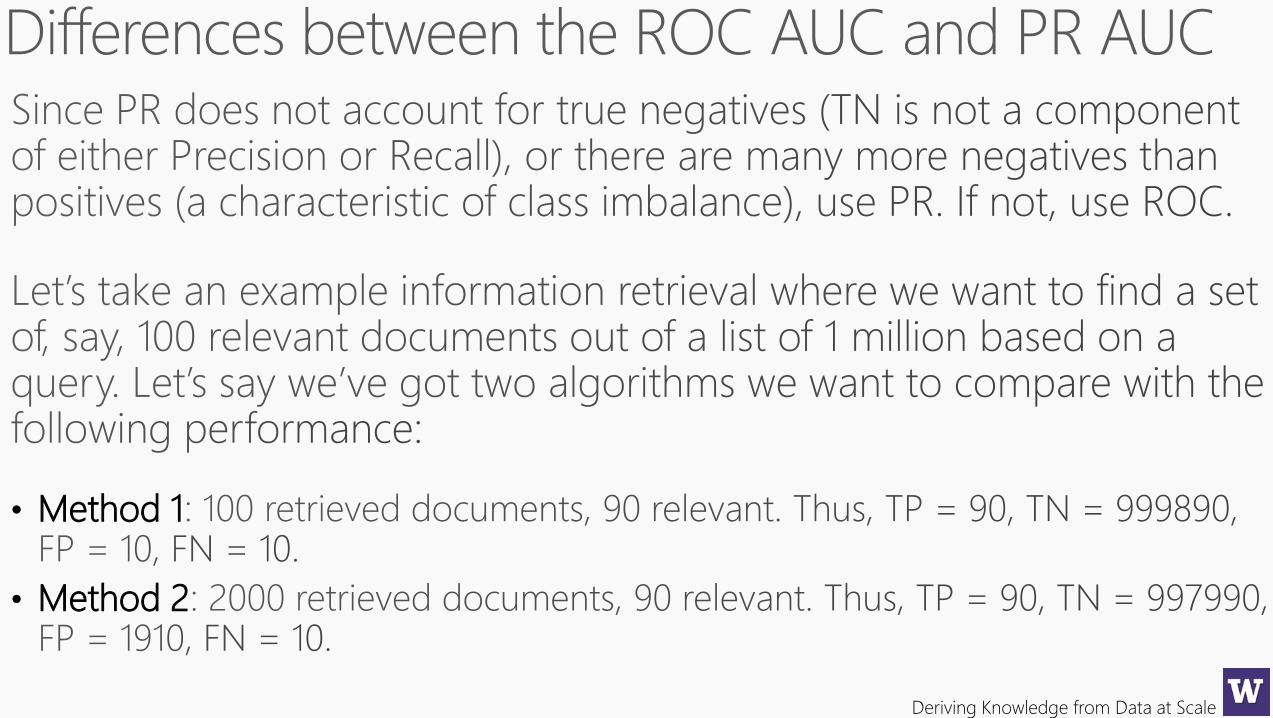
• Method 1
• Method 2
Deriving Knowledge from Data at Scale
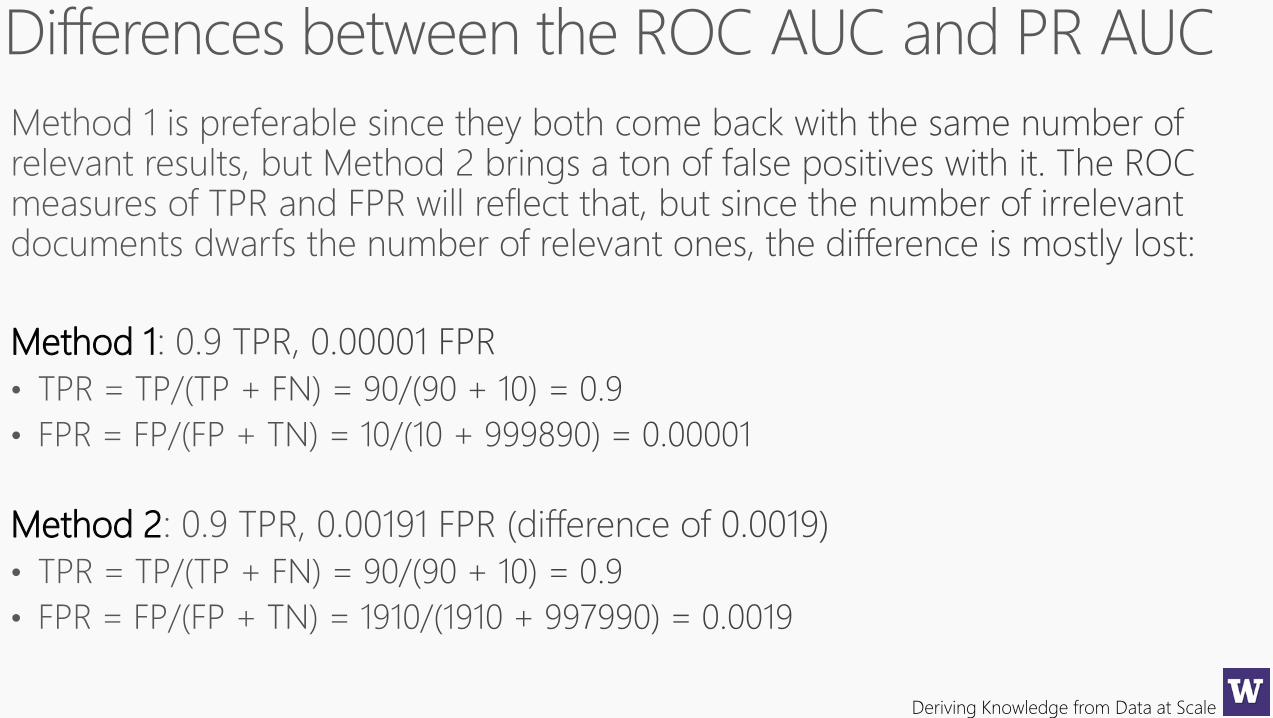
Method 1
Method 2
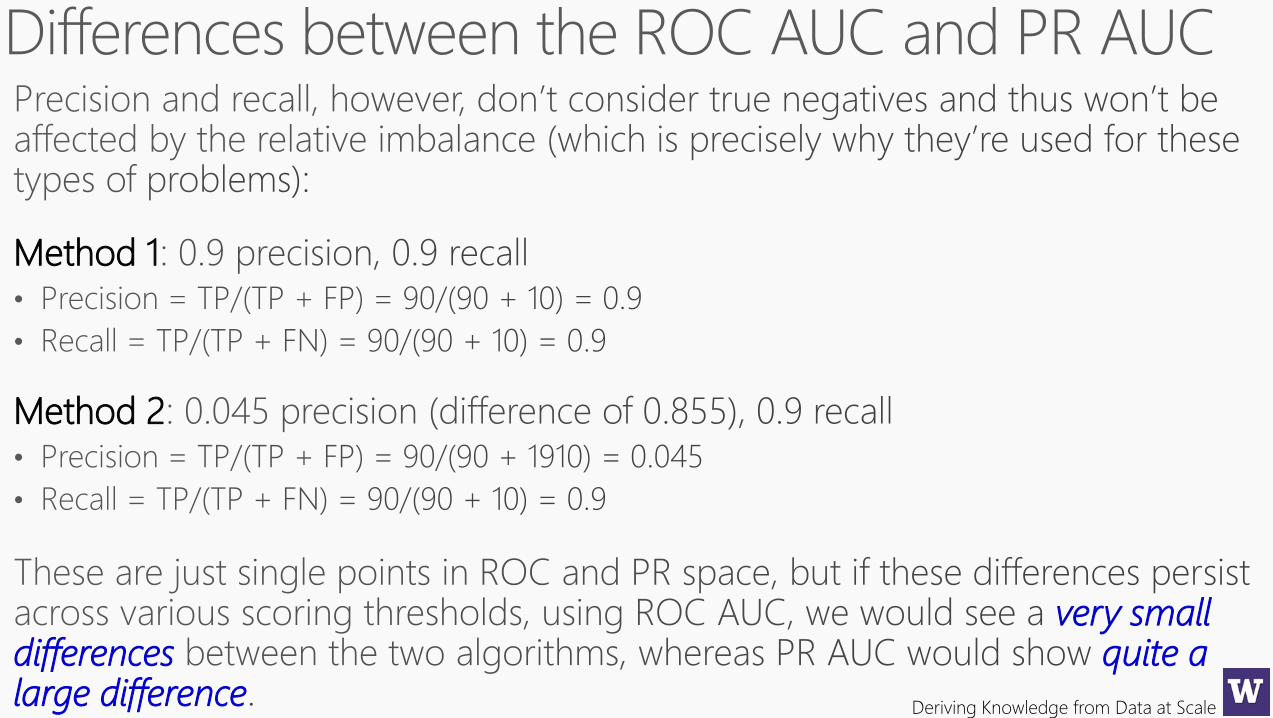
Deriving Knowledge from Data at Scale
Method 1
Method 2
very small differences quite a large difference
Deriving Knowledge from Data at Scale
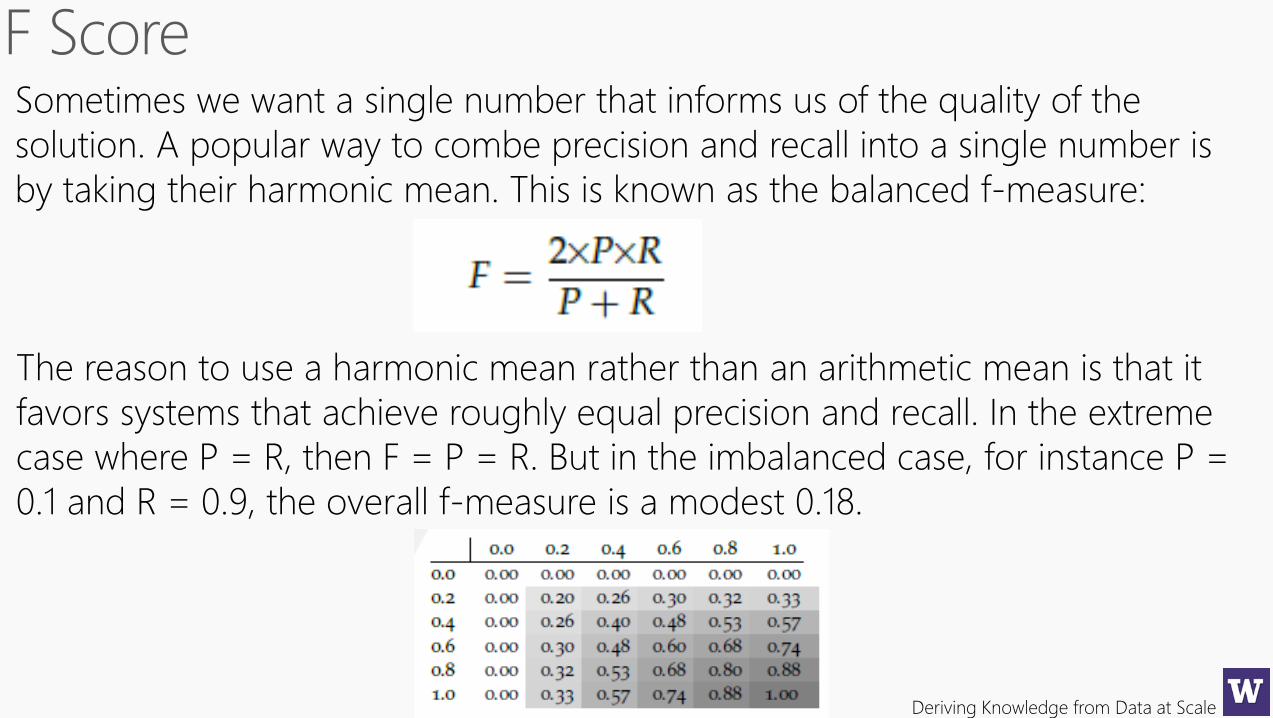
Sometimes we want a single number that informs us of the quality of the
solution. A popular way to combe precision and recall into a single number is
by taking their harmonic mean. This is known as the balanced f-measure:
The reason to use a harmonic mean rather than an arithmetic mean is that it
favors systems that achieve roughly equal precision and recall. In the extreme
case where P = R, then F = P = R. But in the imbalanced case, for instance P =
0.1 and R = 0.9, the overall f-measure is a modest 0.18.
Deriving Knowledge from Data at Scale
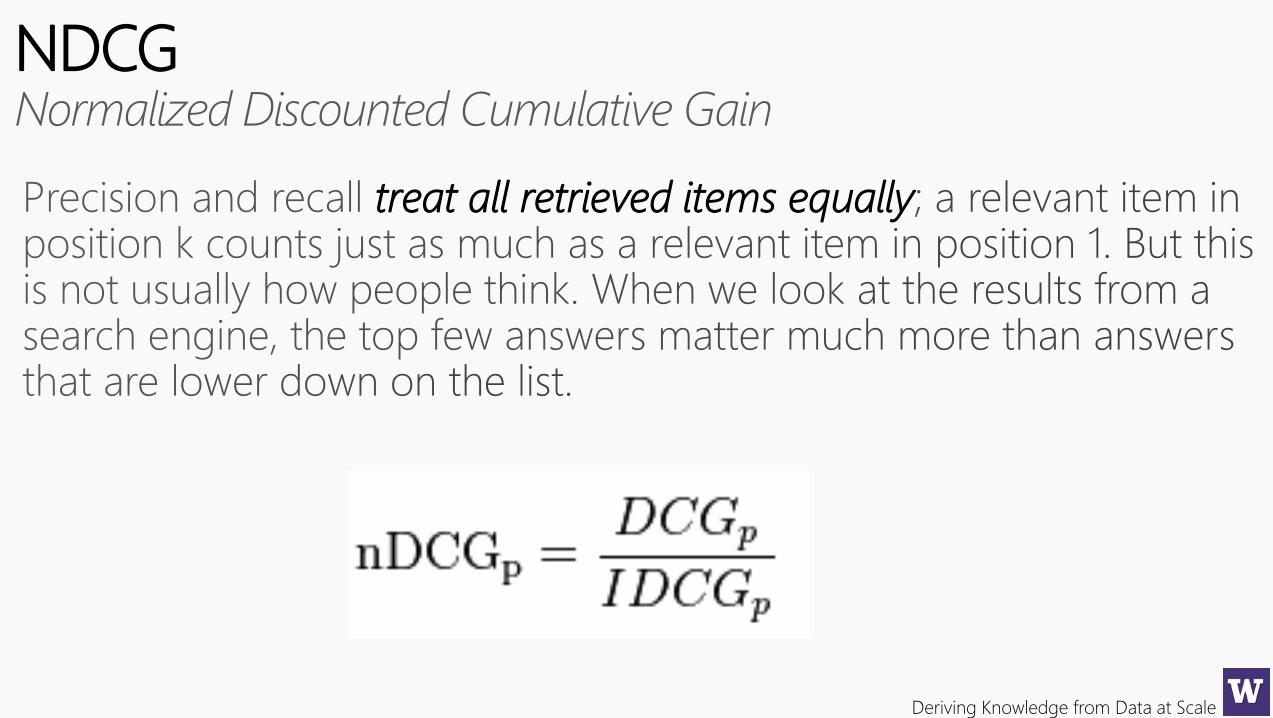
NDCG
treat all retrieved items equally
Deriving Knowledge from Data at Scale
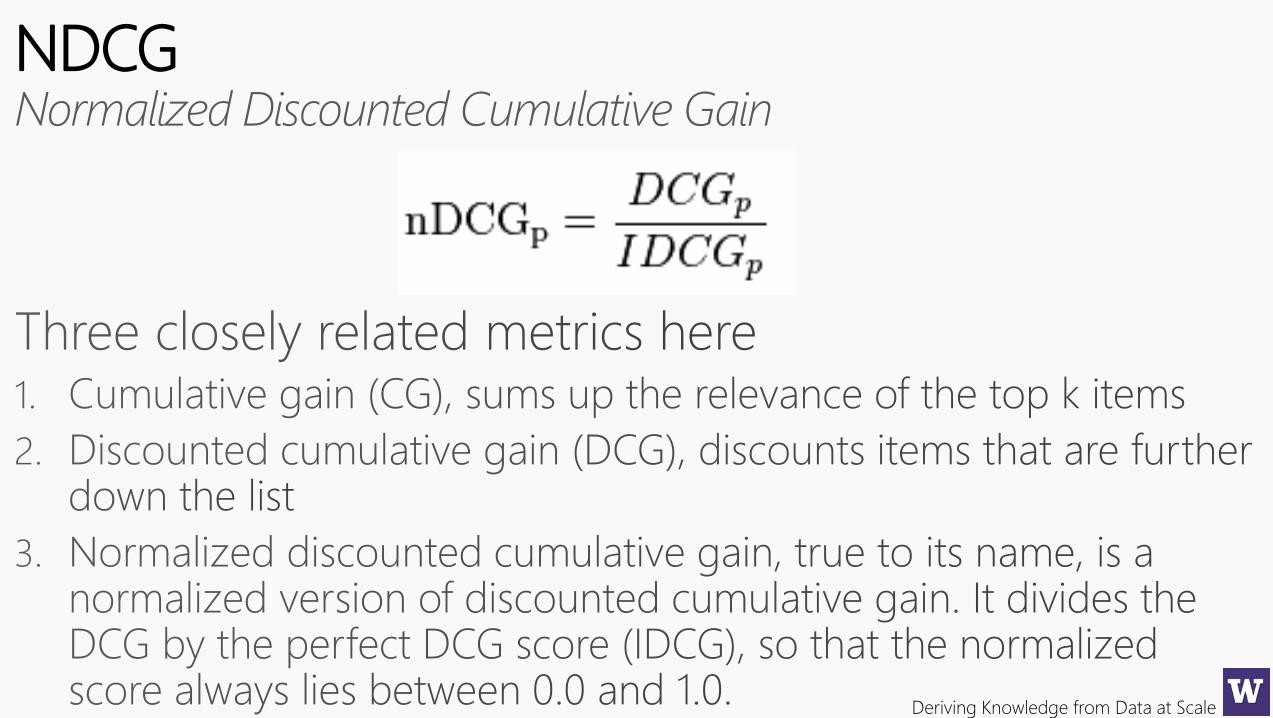
NDCG
Deriving Knowledge from Data at Scale
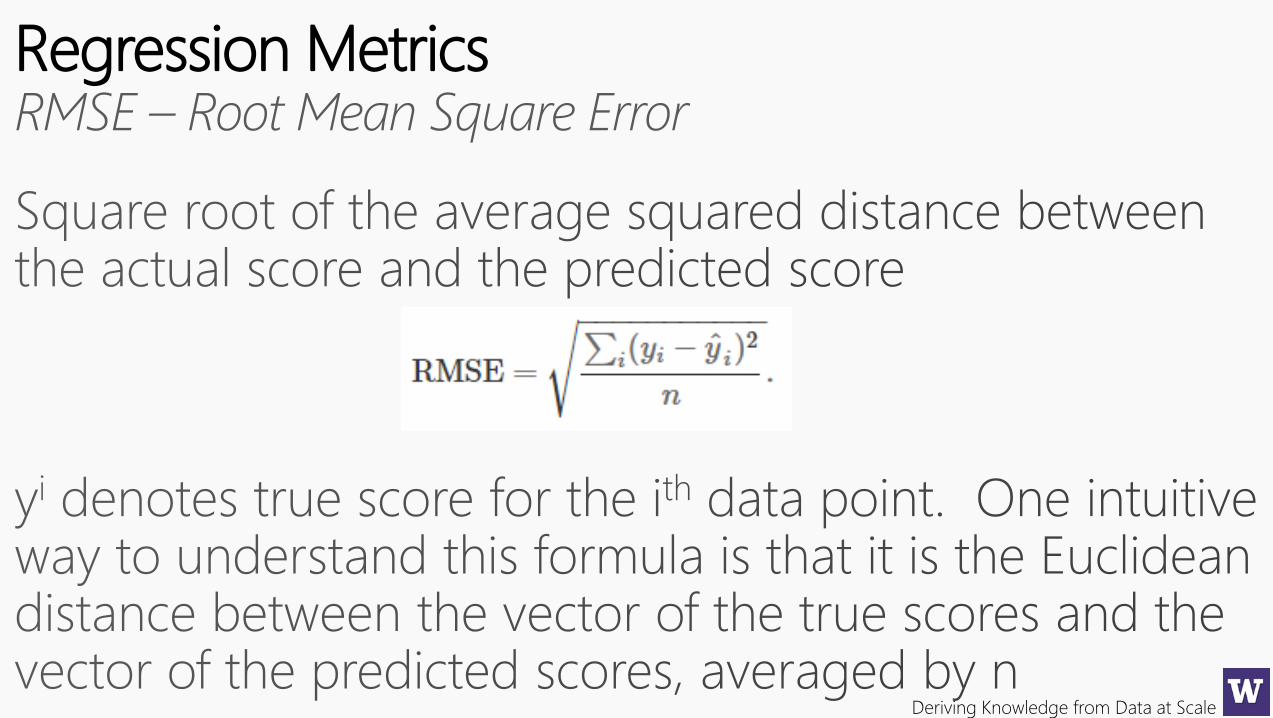
Regression Metrics
Deriving Knowledge from Data at Scale
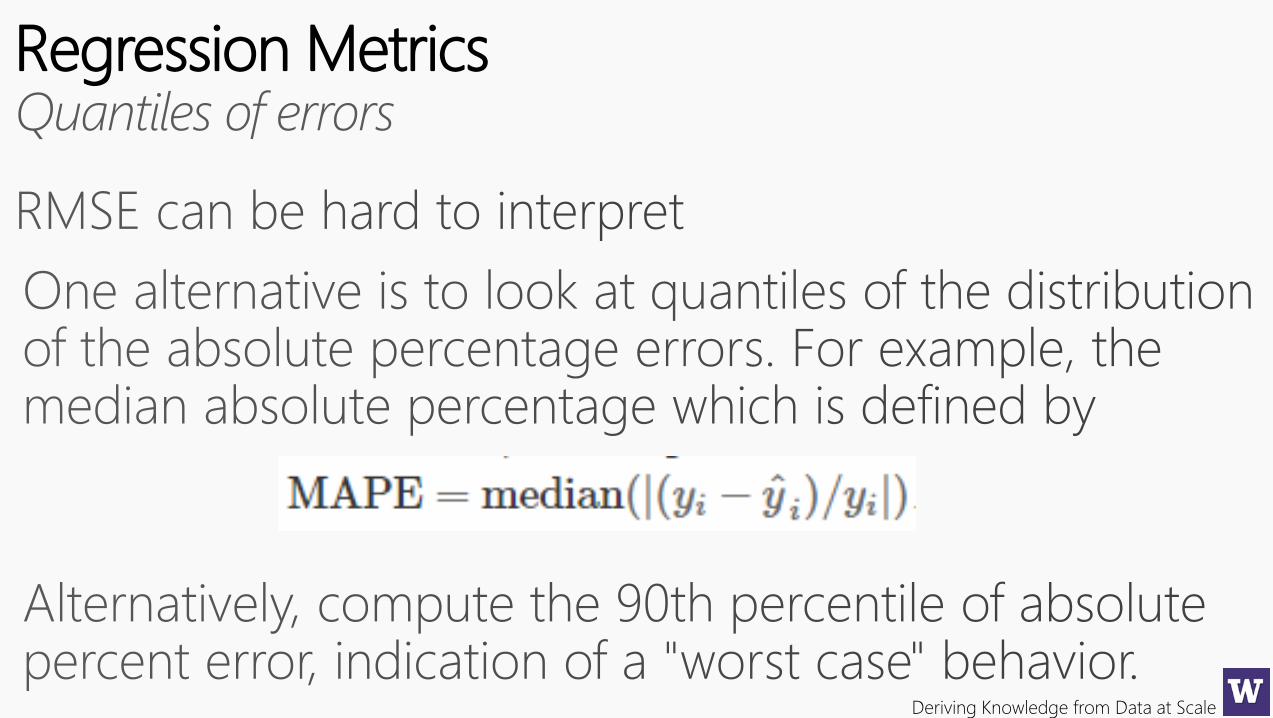
Regression Metrics
Deriving Knowledge from Data at Scale
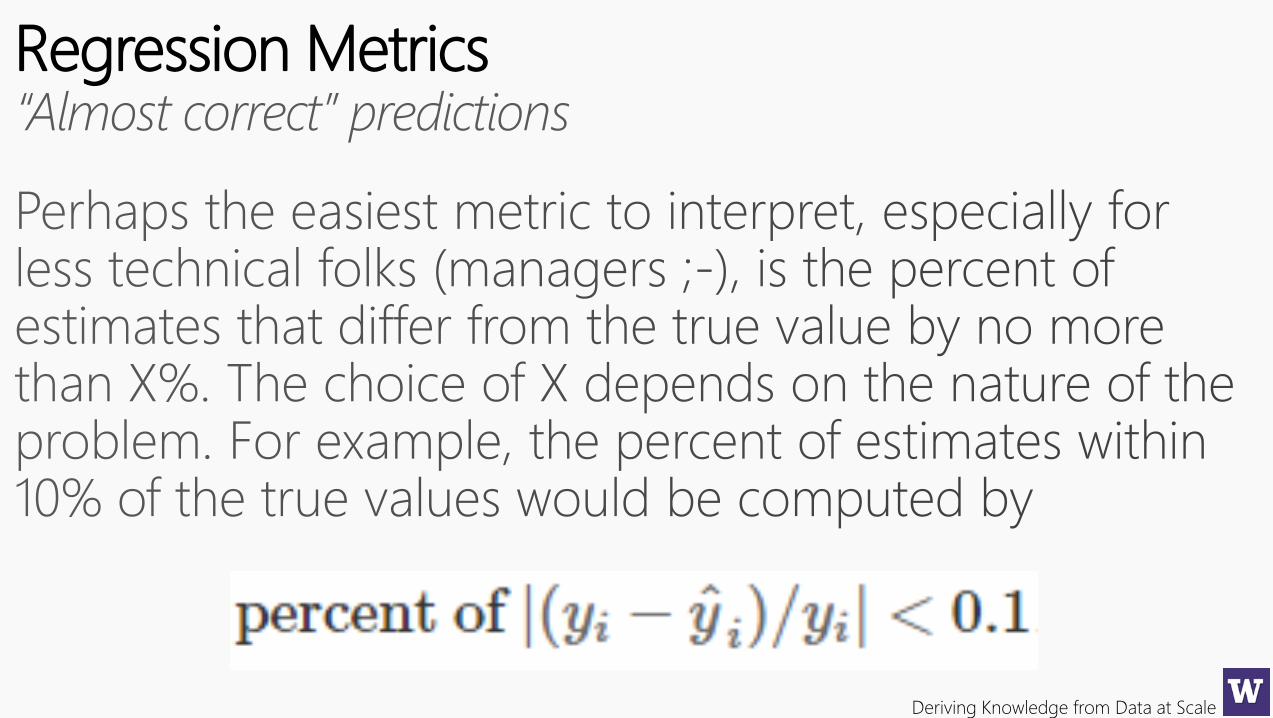
Regression Metrics
Deriving Knowledge from Data at Scale
This was not an exhaustive list or coverage, but I hope the next time you encounter a new evaluation metric you can deconstruct it, identify what is it measuring and why – to align with the business objective or function of the model?

Deriving Knowledge from Data at Scale
10 minutes break…
Deriving Knowledge from Data at Scale
Deriving Knowledge from Data at Scale
Deriving Knowledge from Data at Scale
Deriving Knowledge from Data at Scale
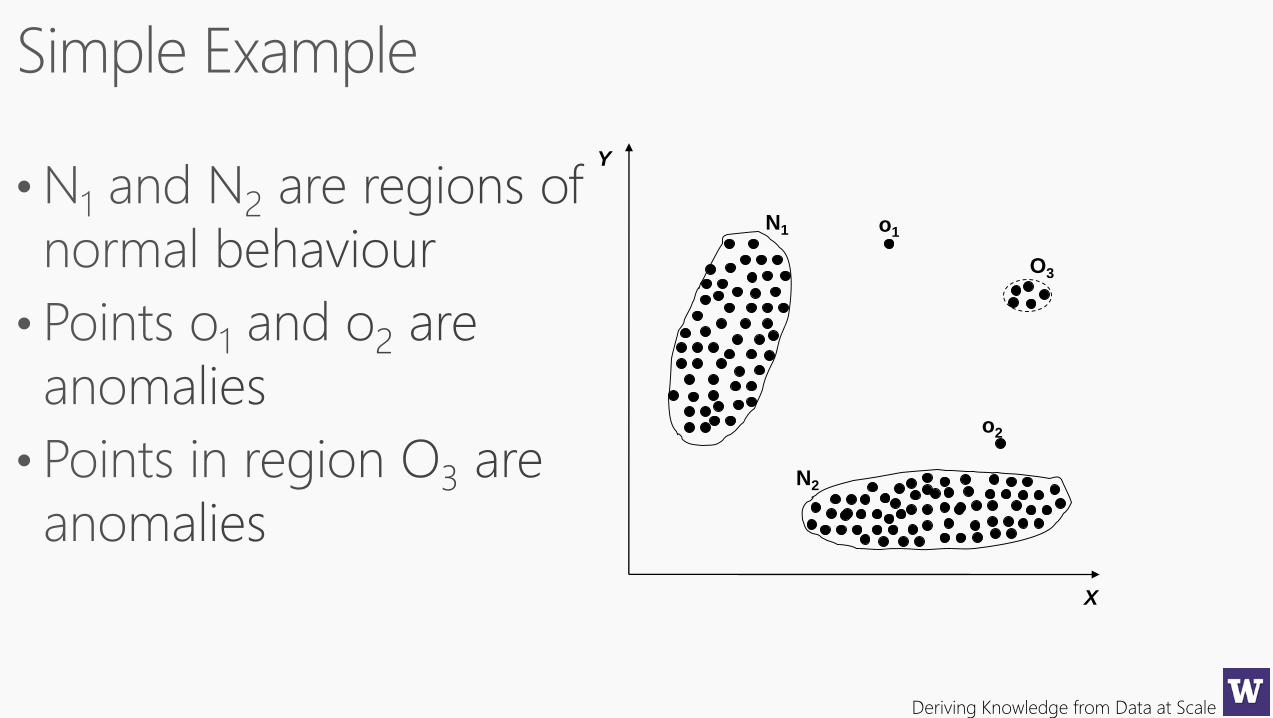
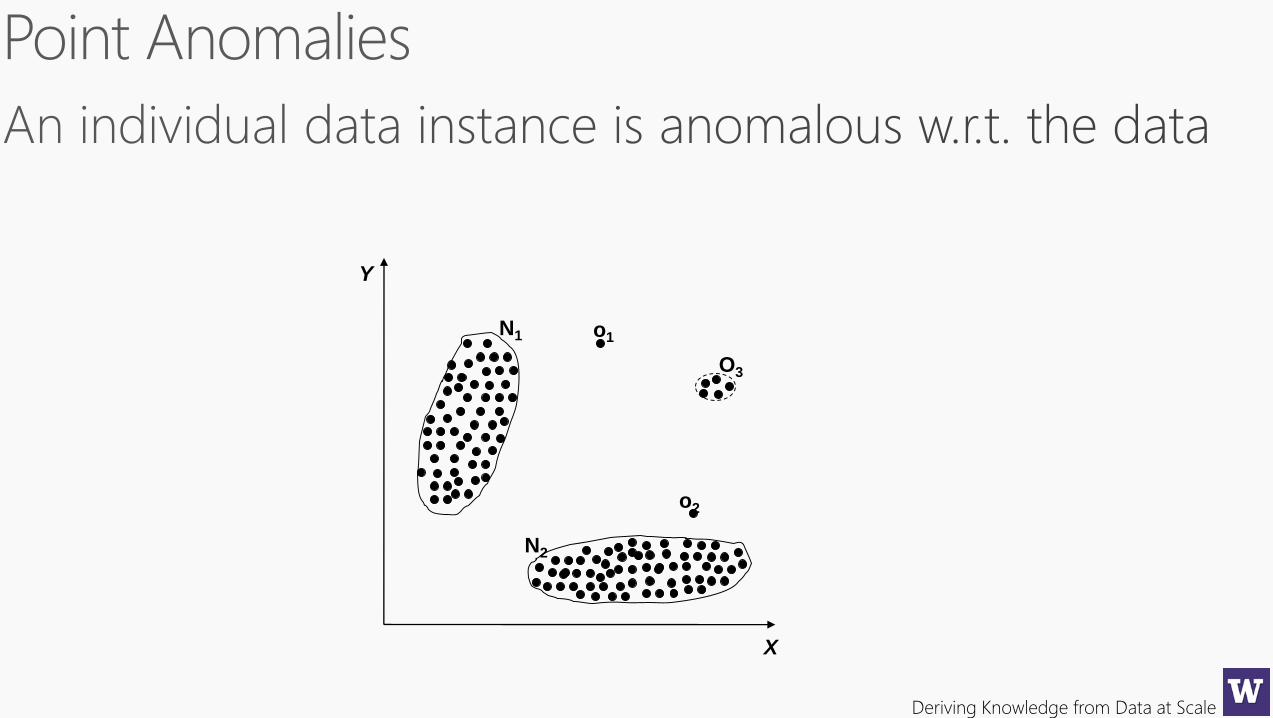
X
Y
N1
N2
o1
o2
O3
Deriving Knowledge from Data at Scale
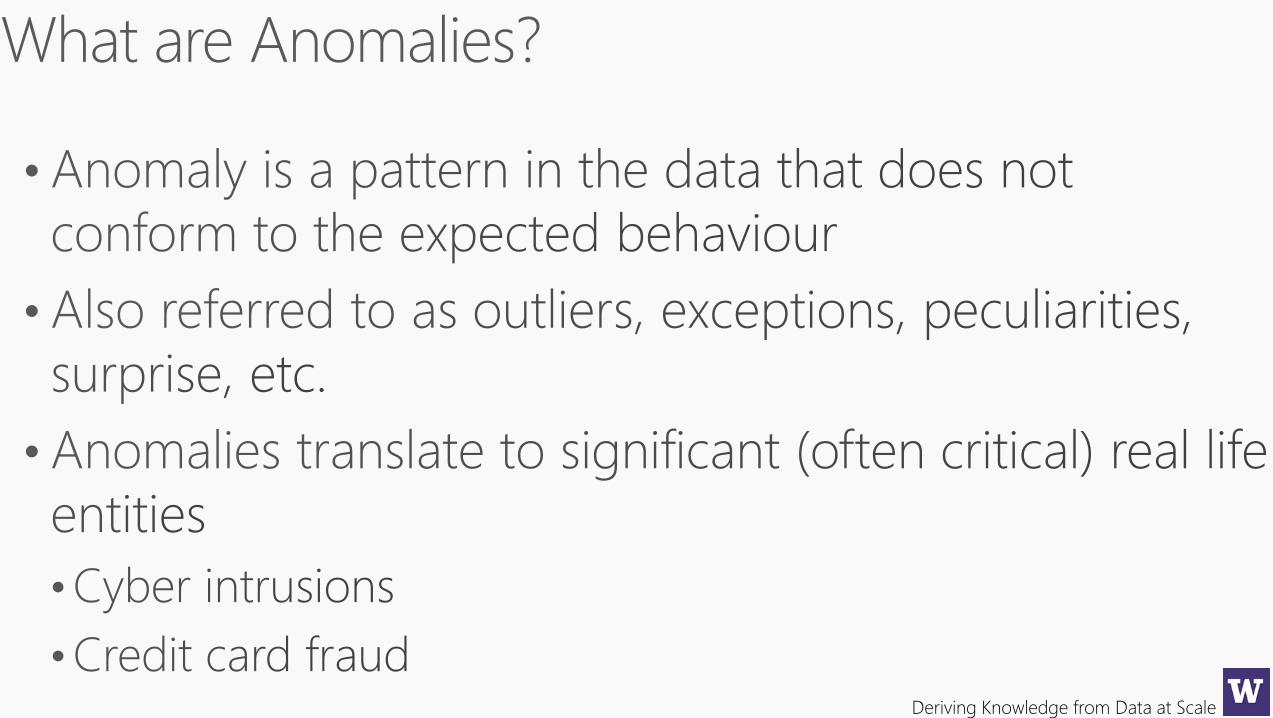
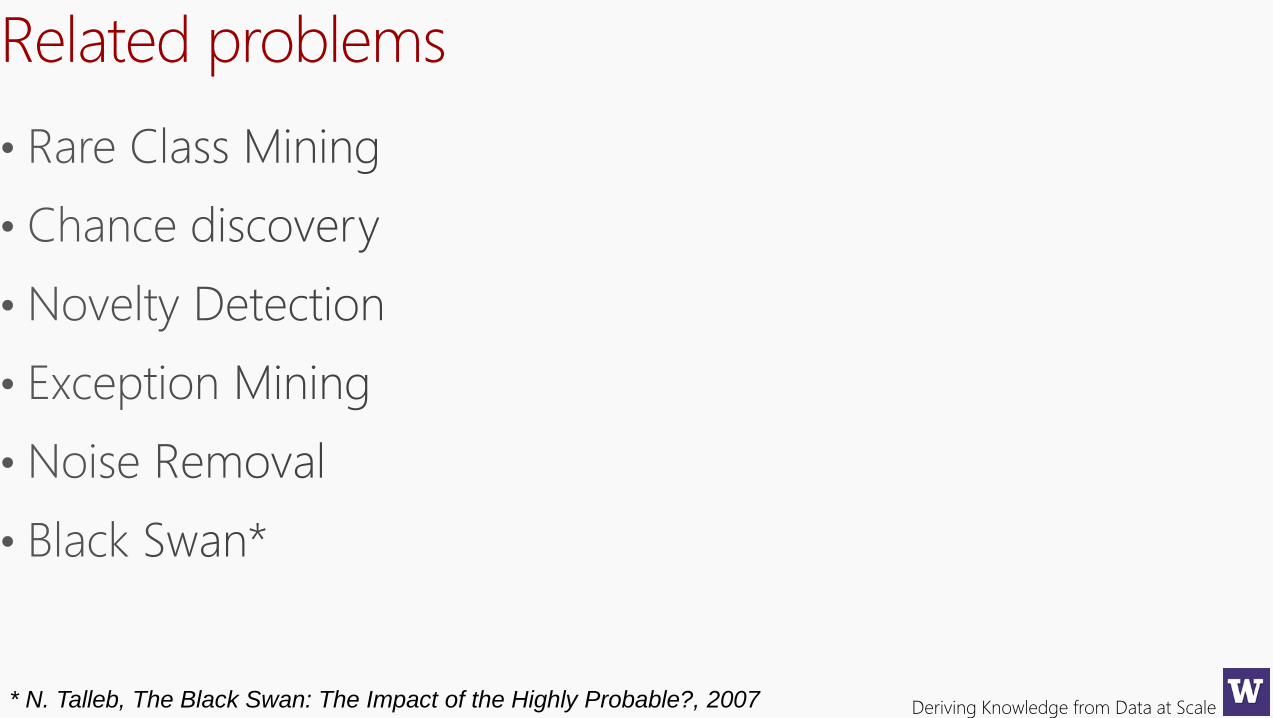
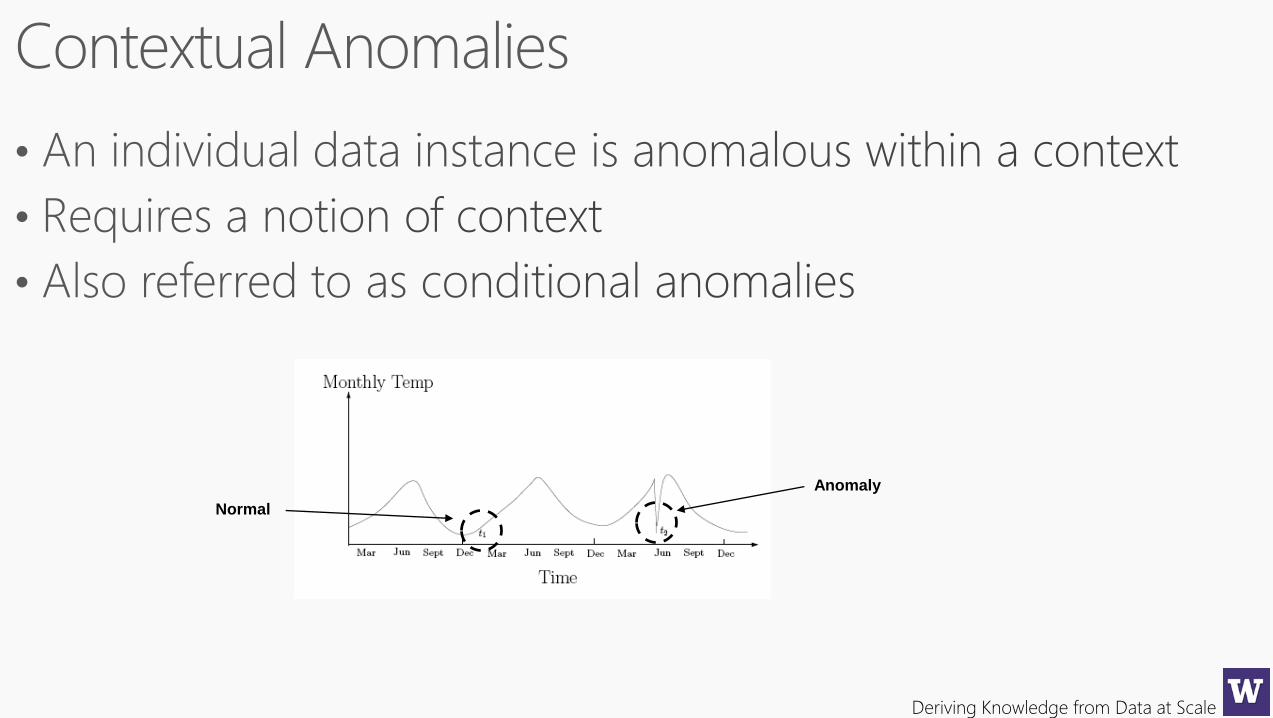
Related problems
* N. Talleb, The Black Swan: The Impact of the Highly Probable?, 2007
Deriving Knowledge from Data at Scale
Deriving Knowledge from Data at Scale
Deriving Knowledge from Data at Scale
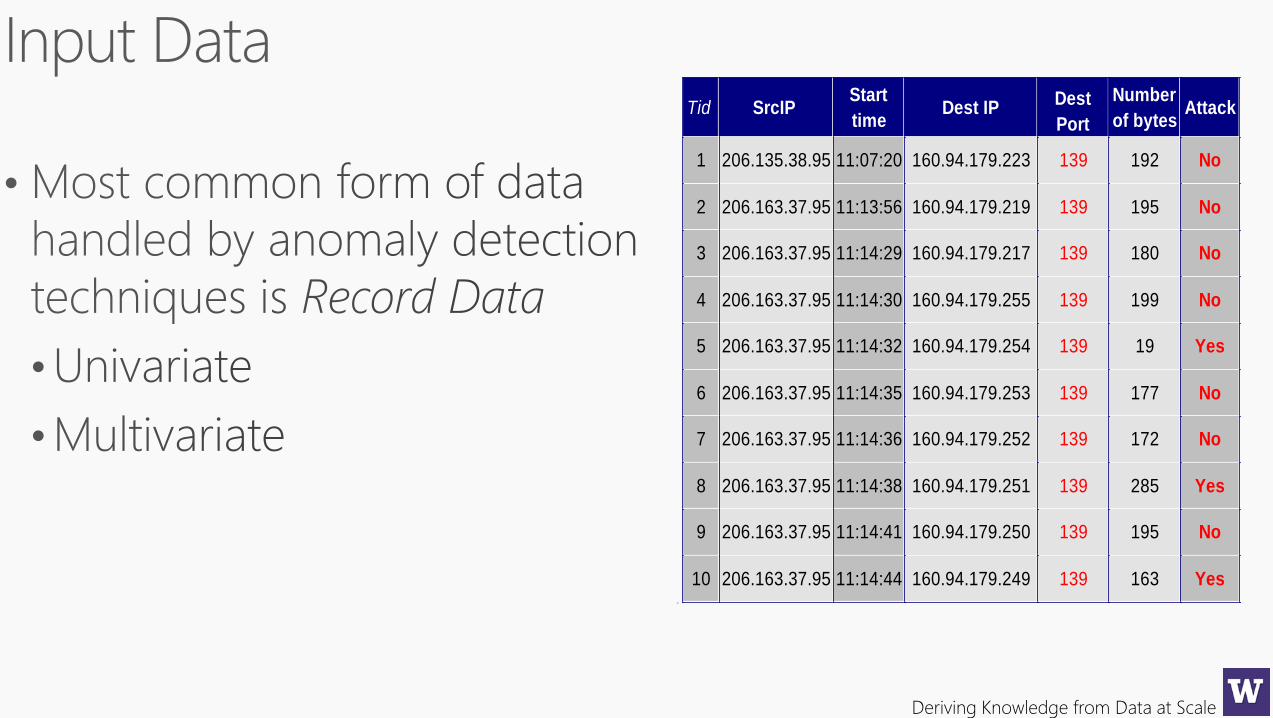
Tid SrcIPStart
timeDest IP
Dest
Port
Number
of bytesAttack
1 206.135.38.95 11:07:20 160.94.179.223 139 192 No
2 206.163.37.95 11:13:56 160.94.179.219 139 195 No
3 206.163.37.95 11:14:29 160.94.179.217 139 180 No
4 206.163.37.95 11:14:30 160.94.179.255 139 199 No
5 206.163.37.95 11:14:32 160.94.179.254 139 19 Yes
6 206.163.37.95 11:14:35 160.94.179.253 139 177 No
7 206.163.37.95 11:14:36 160.94.179.252 139 172 No
8 206.163.37.95 11:14:38 160.94.179.251 139 285 Yes
9 206.163.37.95 11:14:41 160.94.179.250 139 195 No
10 206.163.37.95 11:14:44 160.94.179.249 139 163 Yes10
Deriving Knowledge from Data at Scale
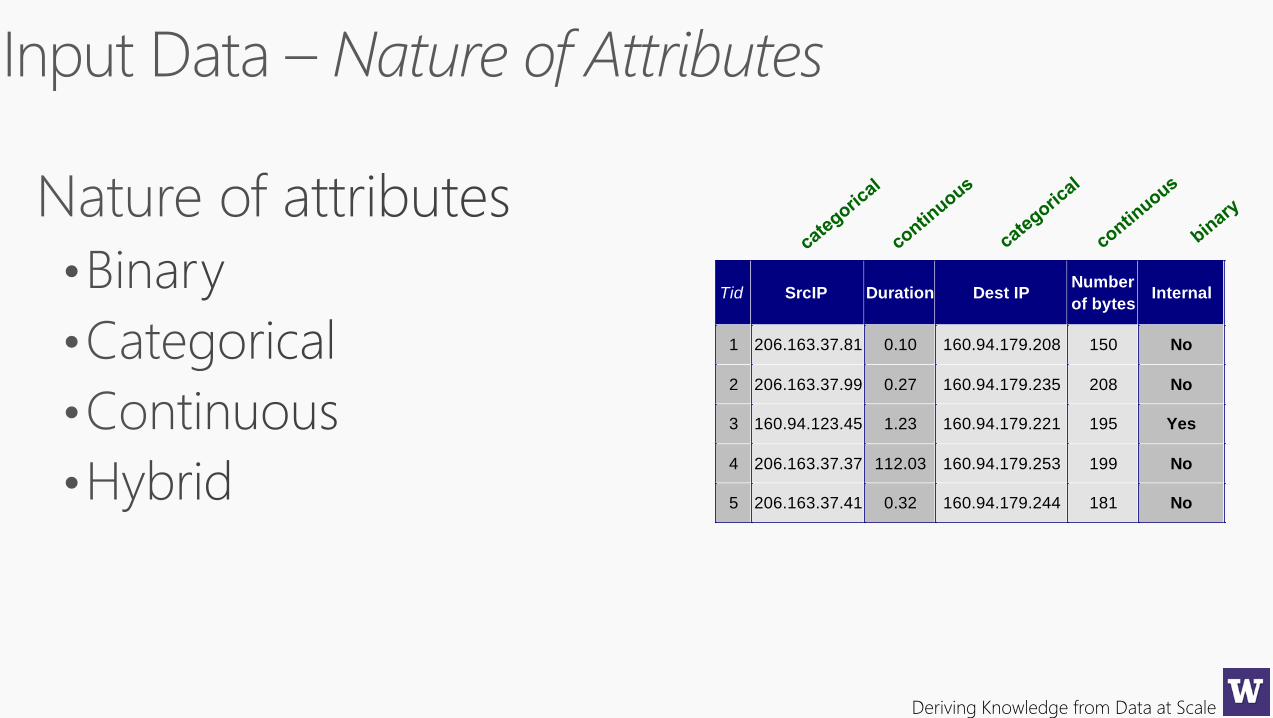
Tid SrcIP Duration Dest IPNumber
of bytesInternal
1 206.163.37.81 0.10 160.94.179.208 150 No
2 206.163.37.99 0.27 160.94.179.235 208 No
3 160.94.123.45 1.23 160.94.179.221 195 Yes
4 206.163.37.37 112.03 160.94.179.253 199 No
5 206.163.37.41 0.32 160.94.179.244 181 No
Deriving Knowledge from Data at Scale
Deriving Knowledge from Data at Scale
Deriving Knowledge from Data at Scale
X
Y
N1
N2
o1
o2
O3
Deriving Knowledge from Data at Scale
Normal
Anomaly
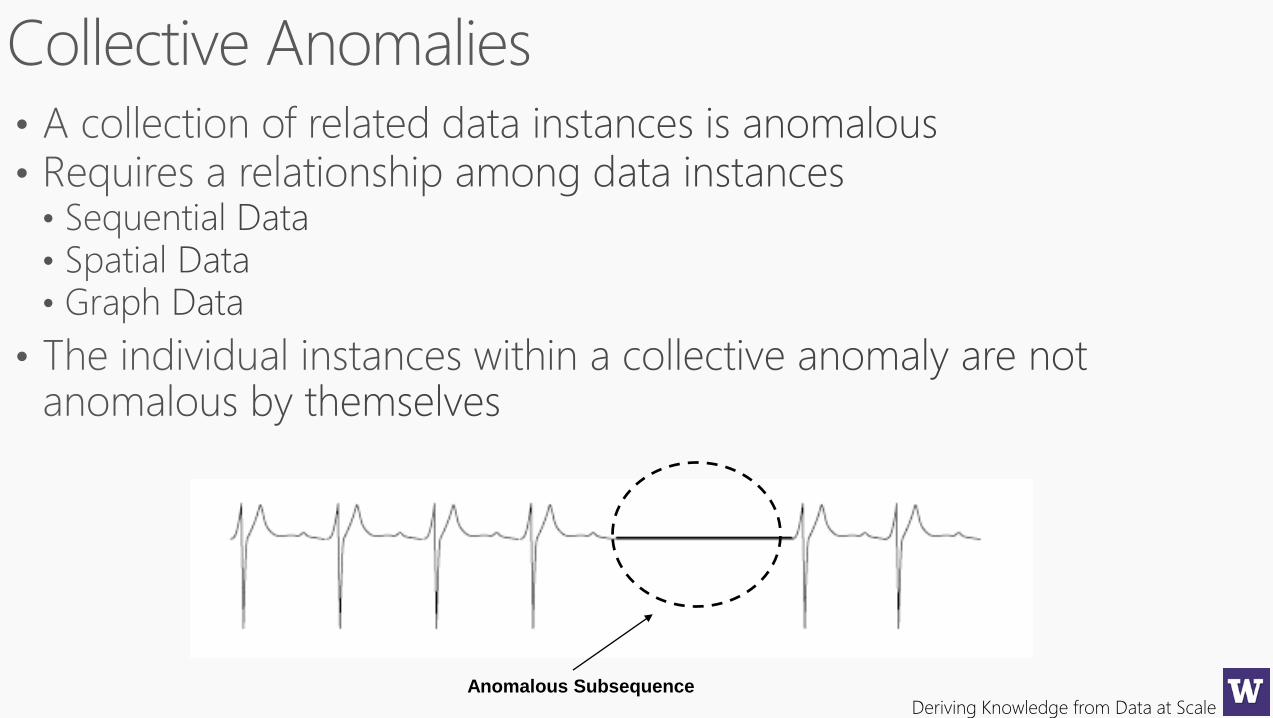
Deriving Knowledge from Data at ScaleAnomalous Subsequence
Deriving Knowledge from Data at Scale
Deriving Knowledge from Data at Scale
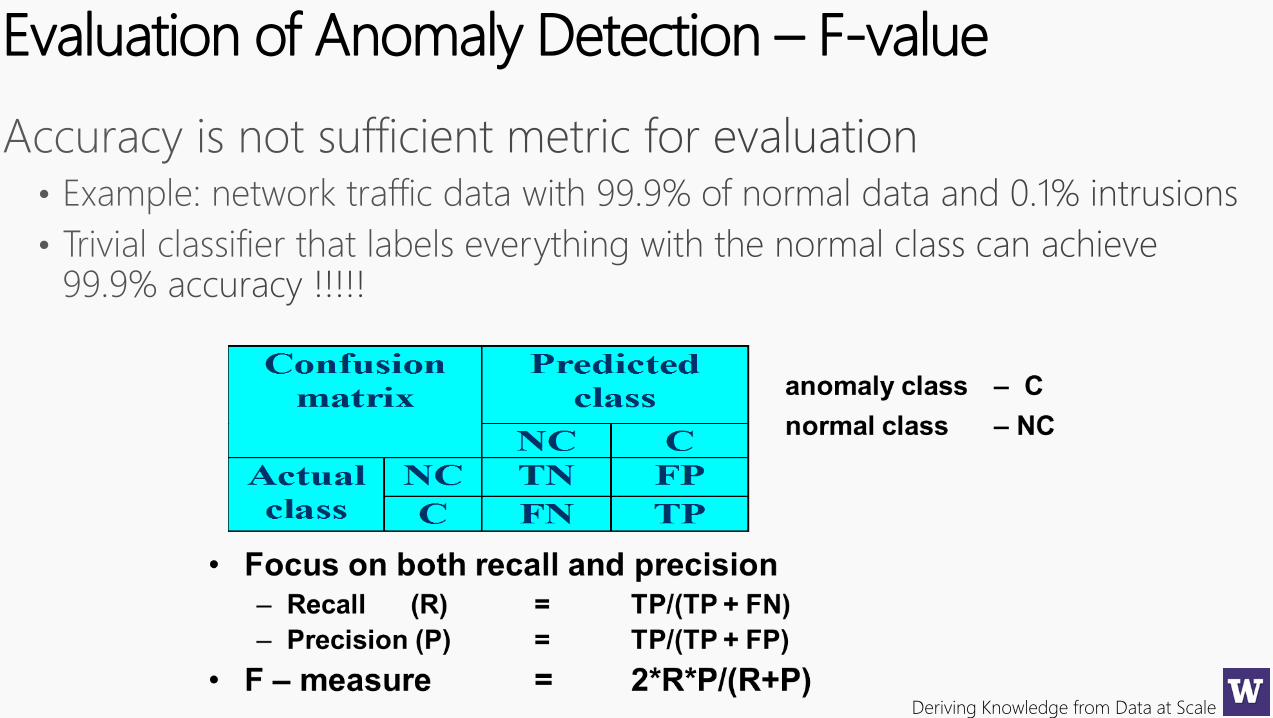
Evaluation of Anomaly Detection – F-value
Deriving Knowledge from Data at Scale
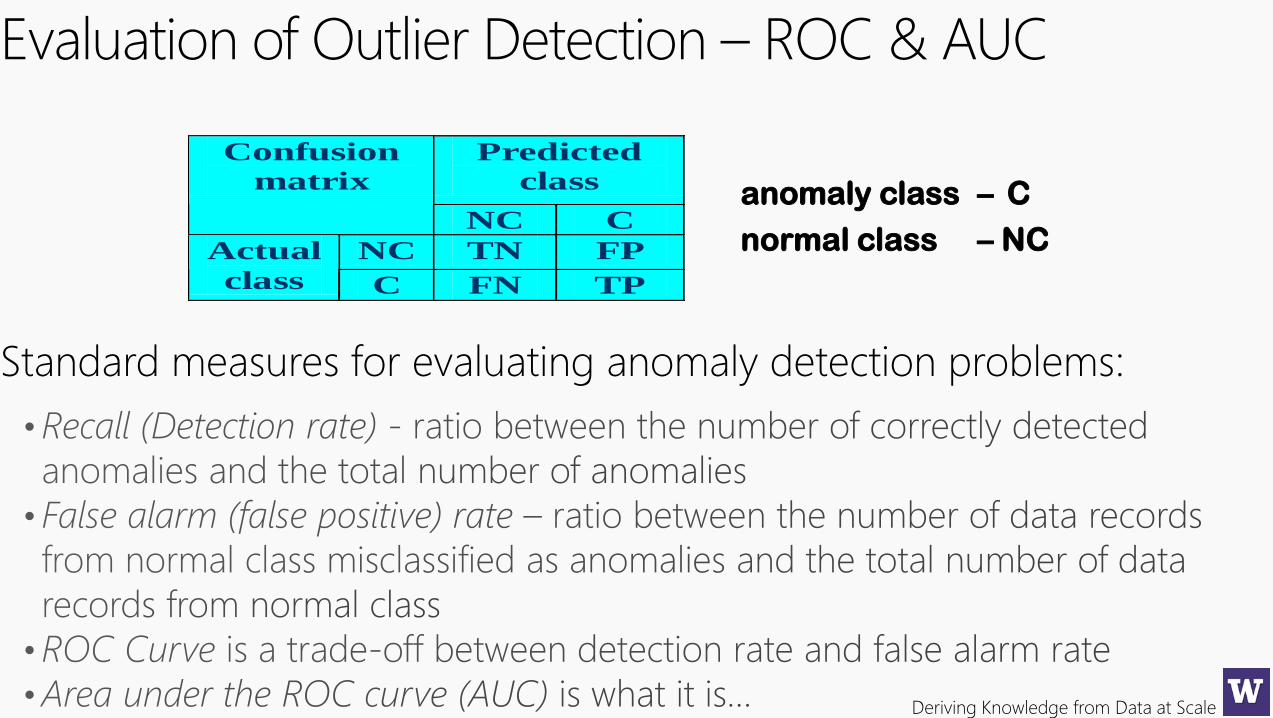
Evaluation of Outlier Detection – ROC & AUC
Standard measures for evaluating anomaly detection problems:
Predicted
class
Confusion
matrix
NC C
NC TN FP Actual
class C FN TP
anomaly class – C
normal class – NC
Deriving Knowledge from Data at Scale
Deriving Knowledge from Data at Scale
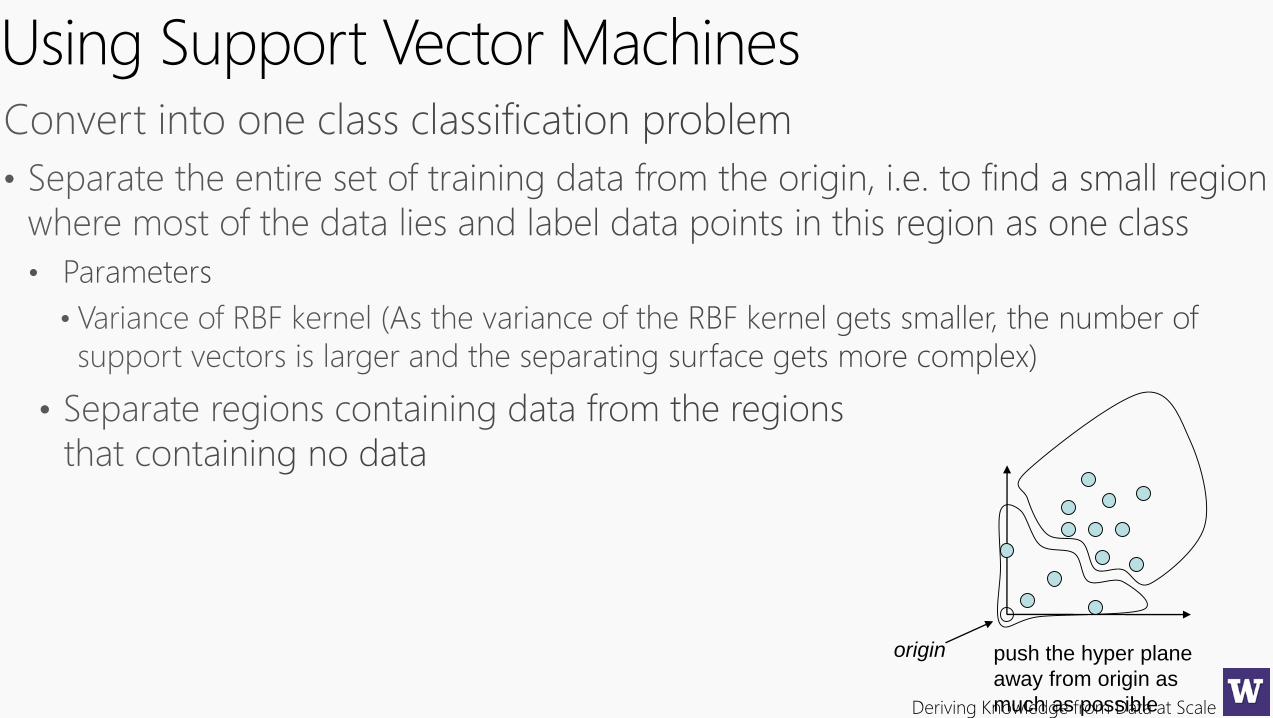
Using Support Vector Machines
SVM Classifiers
• Main idea
• Normal data records belong to high density data regions
• Anomalies belong to low density data regions
• Use unsupervised approach to learn high density and low density data
regions
• Use SVM to classify data density level
• Main idea
• Data records are labelled (normal network behaviour vs. intrusive)
• Use standard SVM for classification
Deriving Knowledge from Data at Scale
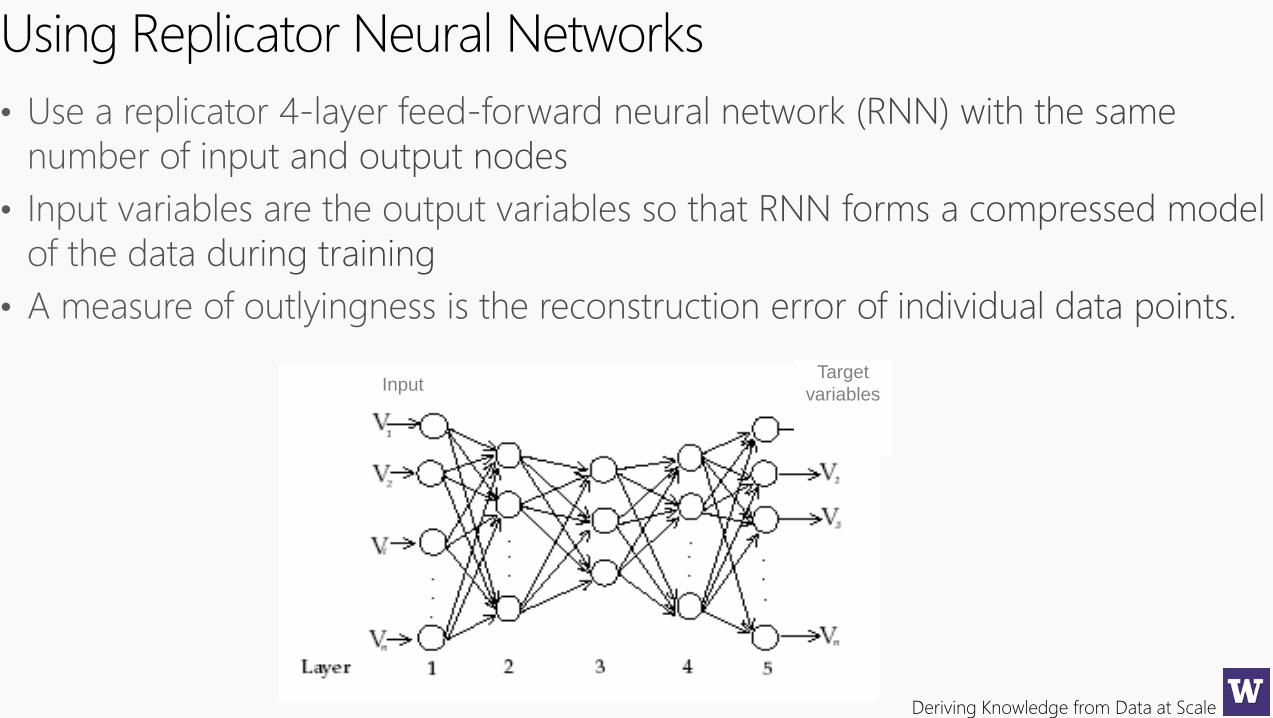
Using Replicator Neural Networks
Target
variablesInput
Deriving Knowledge from Data at Scale
Using Support Vector Machines
origin push the hyper plane
away from origin as
much as possible
Deriving Knowledge from Data at Scale
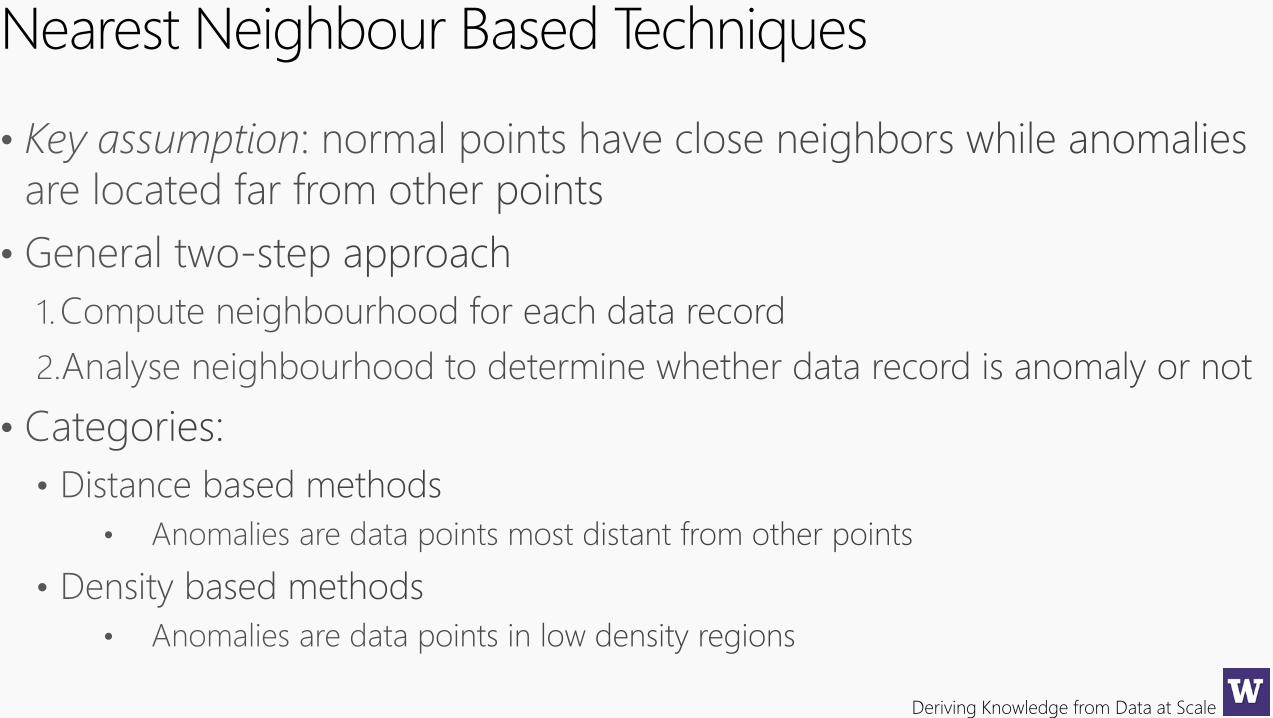
Nearest Neighbour Based Techniques
Deriving Knowledge from Data at Scale
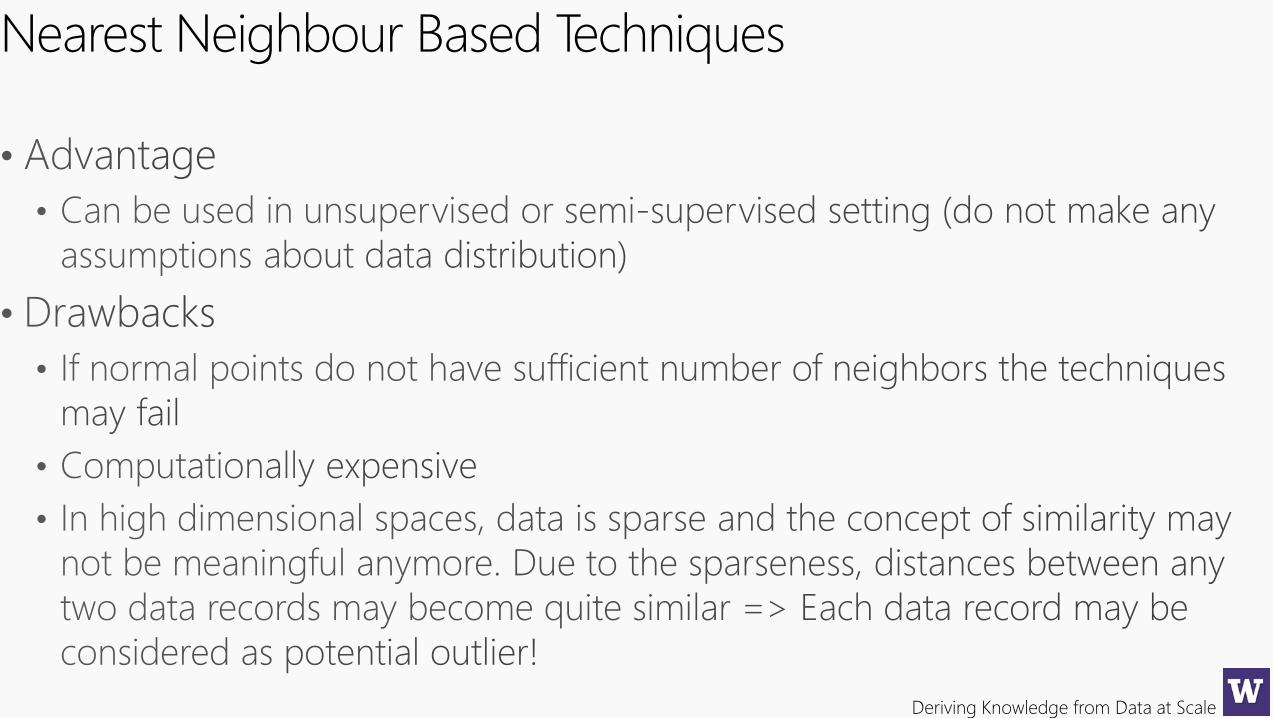
Nearest Neighbour Based Techniques
Deriving Knowledge from Data at Scale
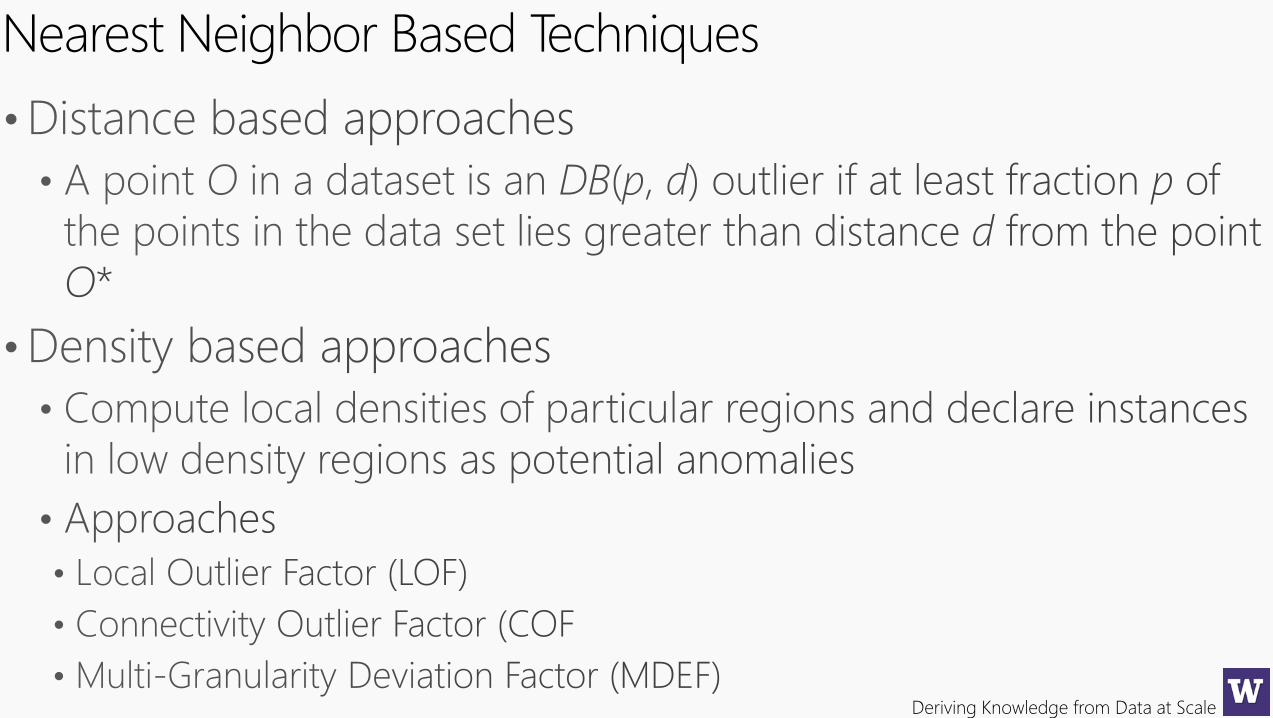
Nearest Neighbor Based Techniques
Deriving Knowledge from Data at Scale
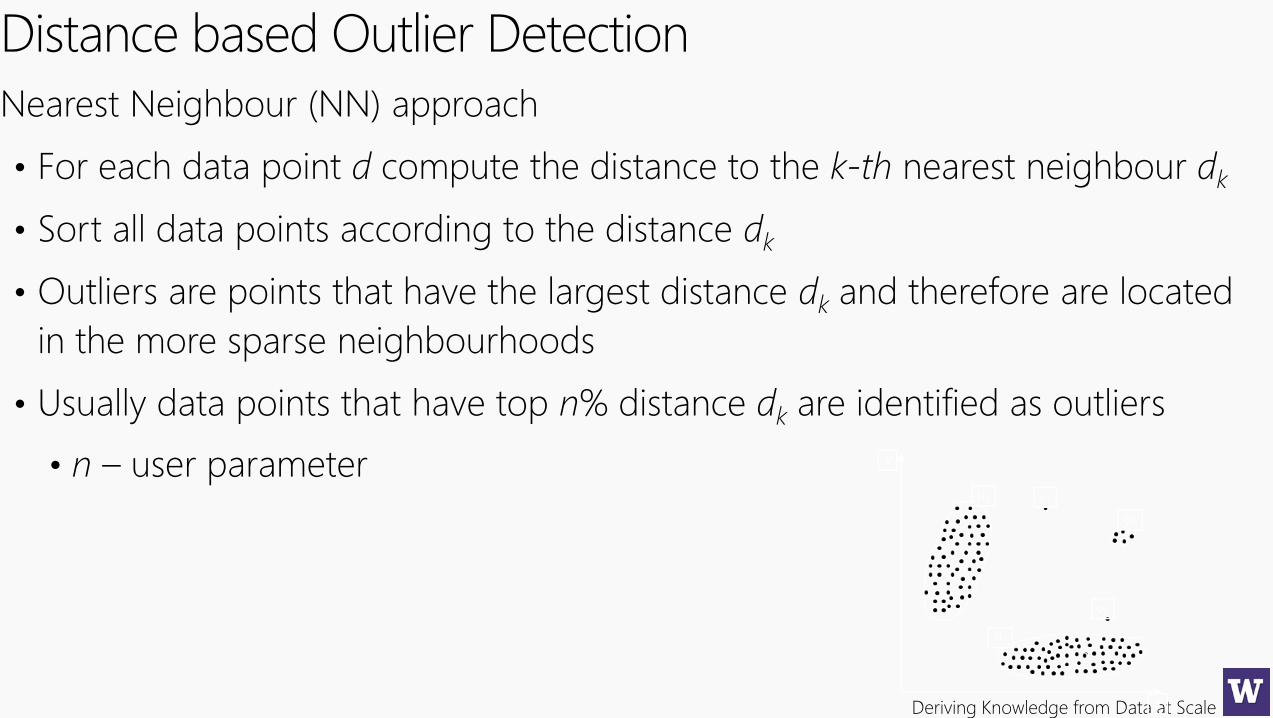
Distance based Outlier Detection
Nearest Neighbour (NN) approach
• For each data point d compute the distance to the k-th nearest neighbour dk
• Sort all data points according to the distance dk
• Outliers are points that have the largest distance dk and therefore are located
in the more sparse neighbourhoods
• Usually data points that have top n% distance dk are identified as outliers
• n – user parameter
Deriving Knowledge from Data at Scale
Model-based approaches to anomaly detection construct a profile of normal
instances, then identify instances that do not conform to this profile as anomalies.
Isolation Forrest is a fundamentally different model-based method that explicitly
isolates anomalies instead of profiles normal points. iForests create an algorithm
which has a linear time complexity with a low constant and a low memory
requirement.
Empirical evaluations shows that iForest performs favorably to OCSVM a near-
linear time complexity distance-based method, NN and random forests in terms
of AUC and processing time, and especially in large data sets. iForest also works
well in high dimensional problems which have a large number of irrelevant
attributes, and in situations where training set does not contain any anomalies.
Deriving Knowledge from Data at Scale
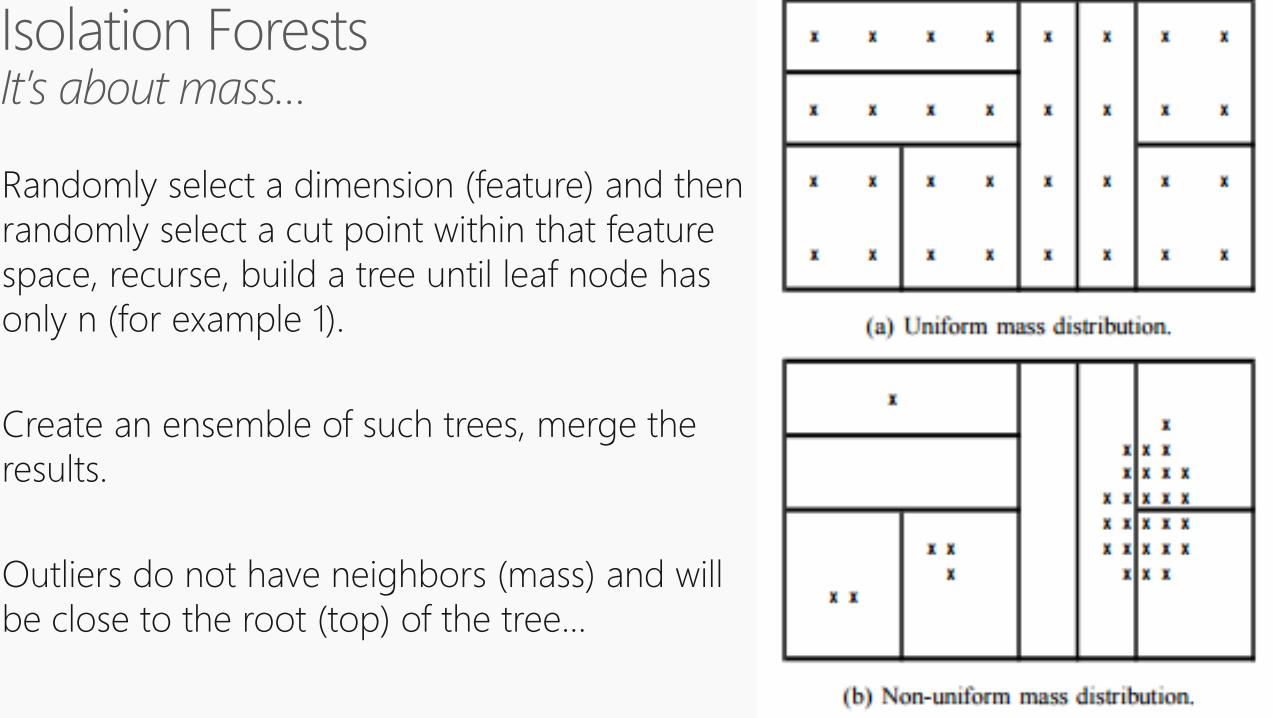
Randomly select a dimension (feature) and then
randomly select a cut point within that feature
space, recurse, build a tree until leaf node has
only n (for example 1).
Create an ensemble of such trees, merge the
results.
Outliers do not have neighbors (mass) and will
be close to the root (top) of the tree…
Deriving Knowledge from Data at Scale
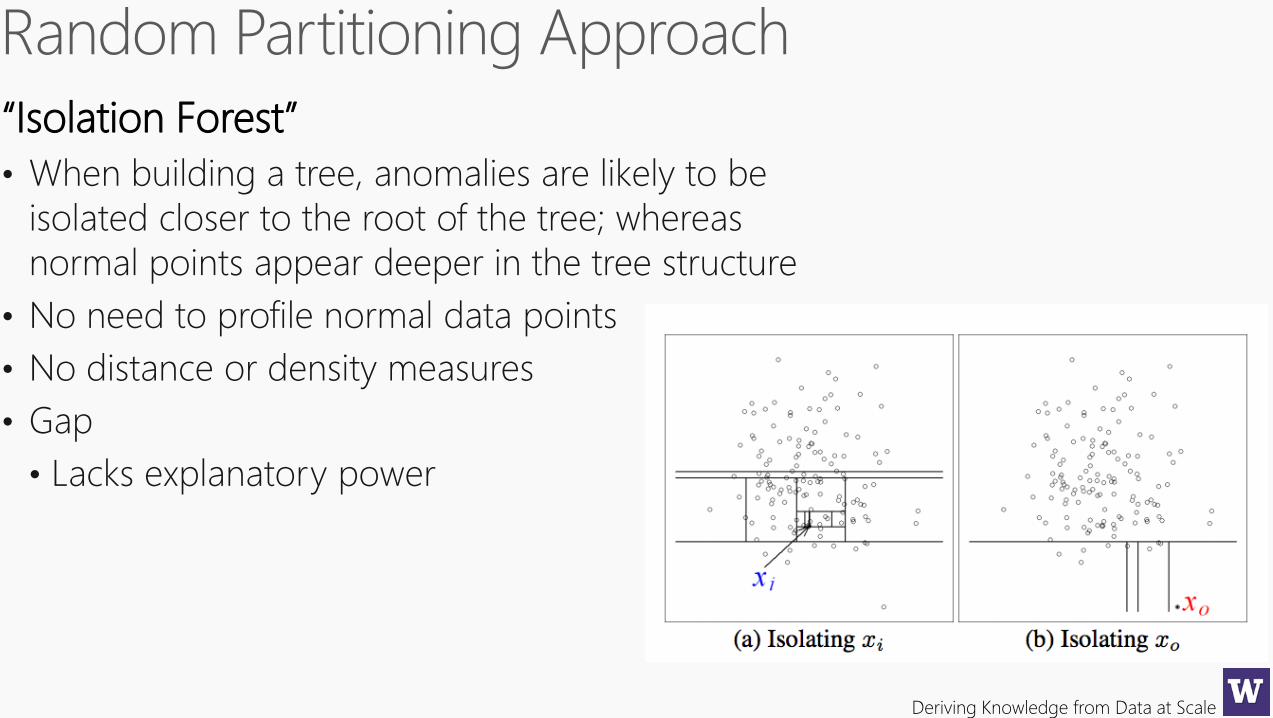
“Isolation Forest”
• When building a tree, anomalies are likely to be
isolated closer to the root of the tree; whereas
normal points appear deeper in the tree structure
• No need to profile normal data points
• No distance or density measures
• Gap
• Lacks explanatory power
Deriving Knowledge from Data at Scale
Deriving Knowledge from Data at Scale
Neural Networks
http://www.youtube.com/watch?v=GrugzF0-V3I
Deriving Knowledge from Data at Scale
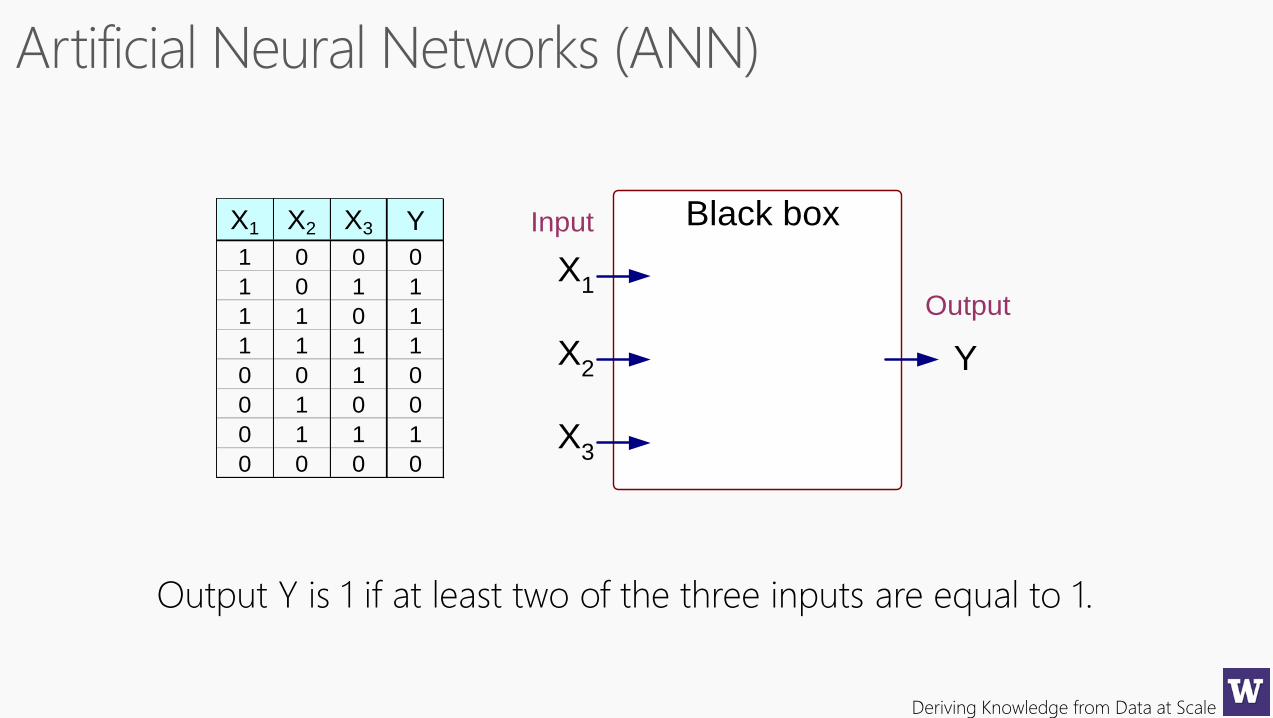
X1 X2 X3 Y
1 0 0 0
1 0 1 1
1 1 0 1
1 1 1 1
0 0 1 0
0 1 0 0
0 1 1 1
0 0 0 0
X1
X2
X3
Y
Black box
Output
Input
Output Y is 1 if at least two of the three inputs are equal to 1.
Deriving Knowledge from Data at Scale
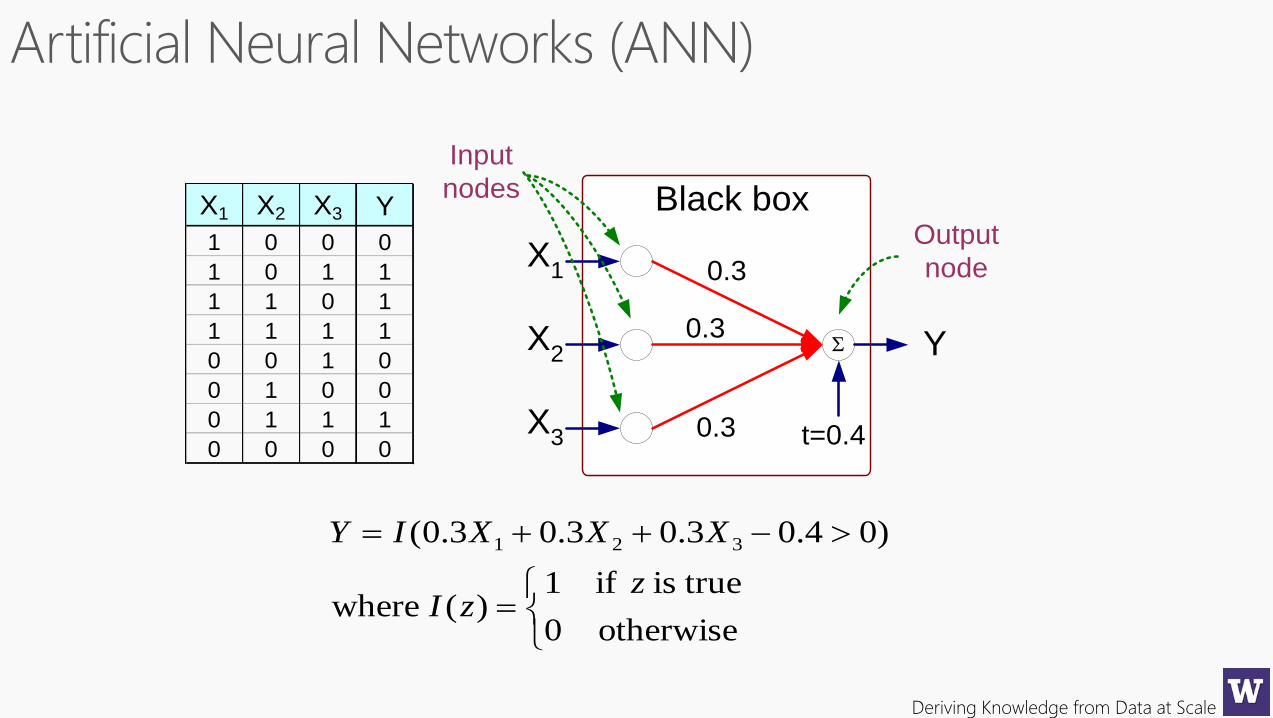
X1 X2 X3 Y
1 0 0 0
1 0 1 1
1 1 0 1
1 1 1 1
0 0 1 0
0 1 0 0
0 1 1 1
0 0 0 0
X1
X2
X3
Y
Black box
0.3
0.3
0.3 t=0.4
Output
node
Input
nodes
otherwise0
trueis if1)( where
)04.03.03.03.0( 321
zzI
XXXIY
Deriving Knowledge from Data at Scale
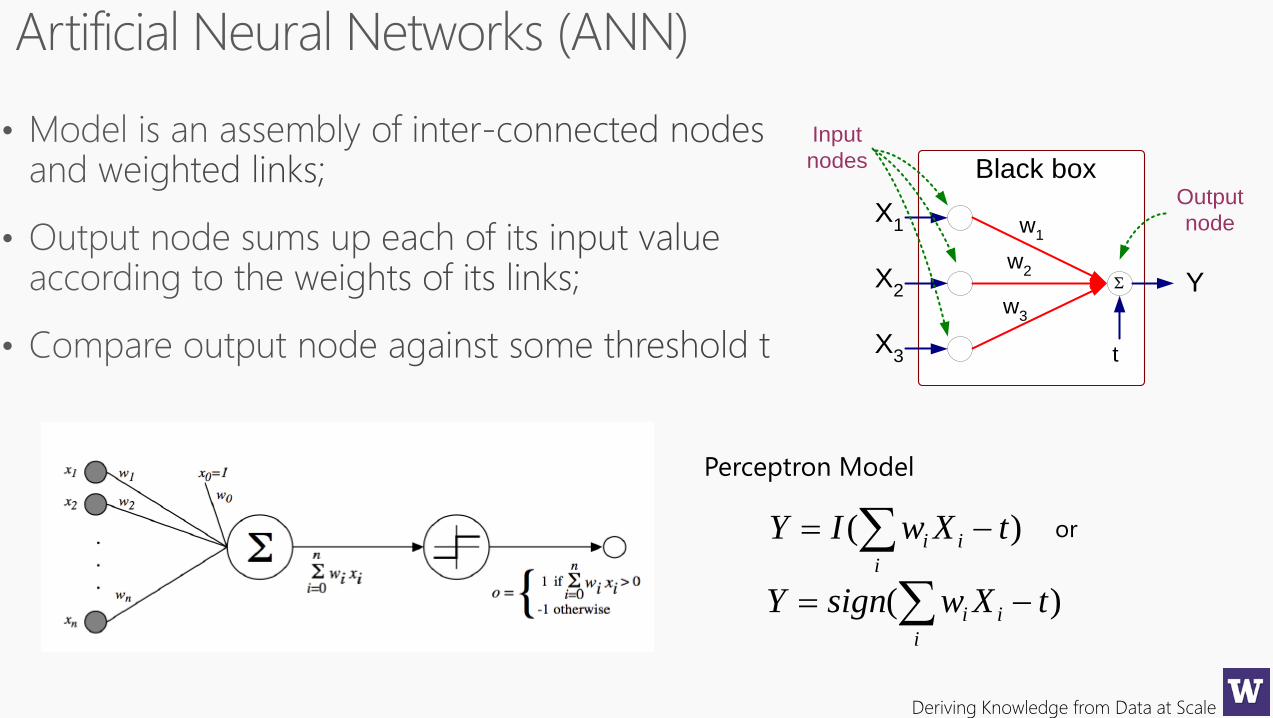
X1
X2
X3
Y
Black box
w1
t
Output
node
Input
nodes
w2
w3
)( tXwIYi
ii
Perceptron Model
)( tXwsignYi
ii
or
Deriving Knowledge from Data at Scale
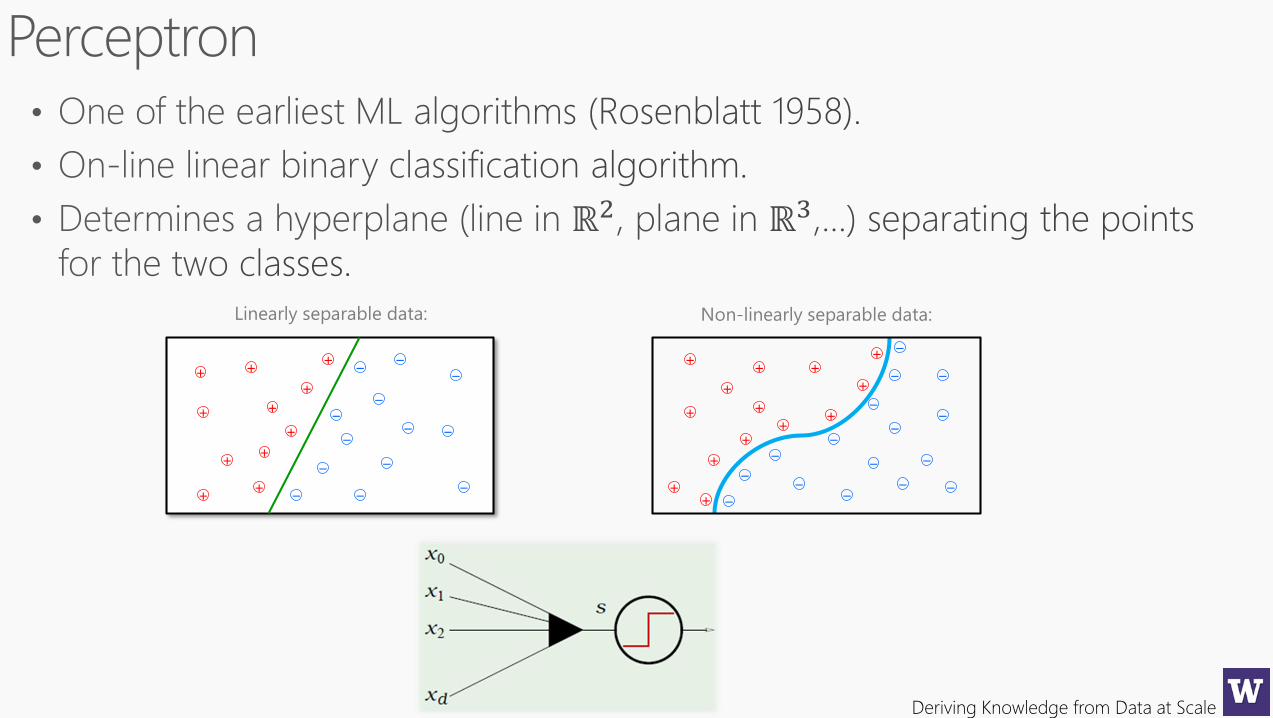
−
++
+
+
+
++
+ +
+
+ −−
−
−
−
−
−
−
− −
−
−
−
+
+
+
+
+
++
+ +
+
+−
−
−
−
−
−
−
−
−
−
−
−
Linearly separable data: Non-linearly separable data:
+
+
+
−
−
−
Deriving Knowledge from Data at Scale
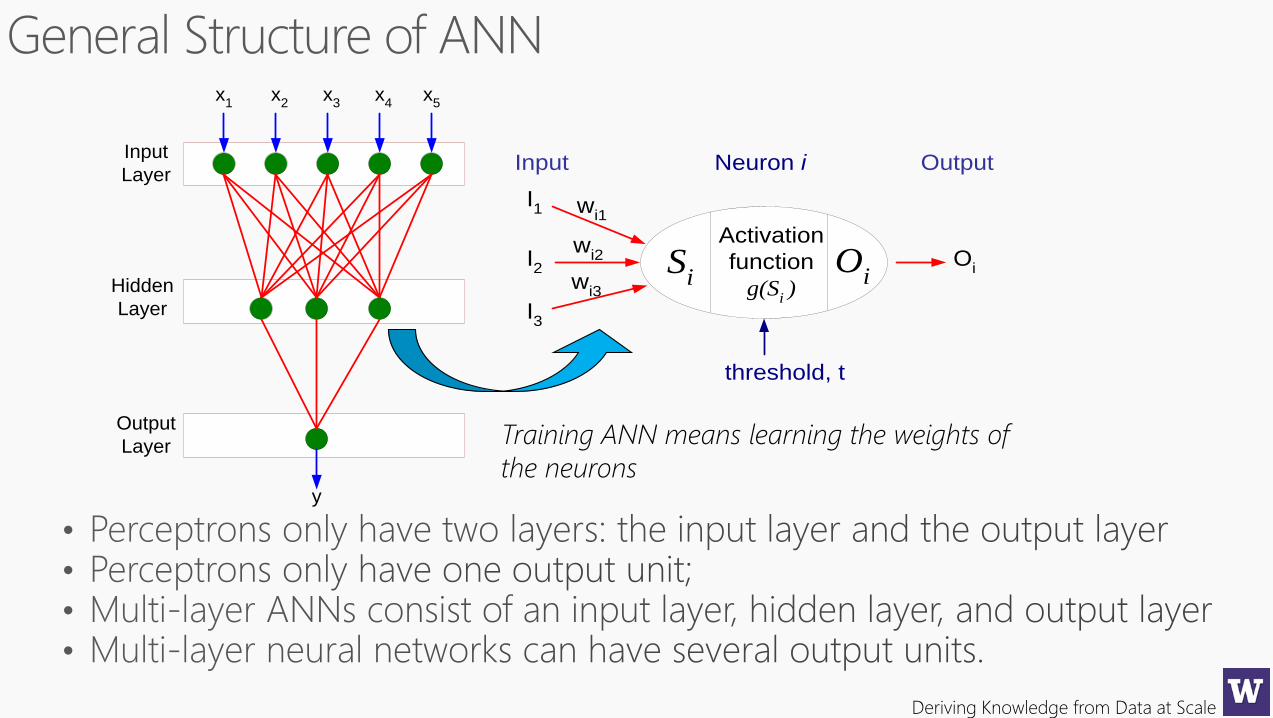
Activation
function
g(Si )
Si
Oi
I1
I2
I3
wi1
wi2
wi3
Oi
Neuron iInput Output
threshold, t
Input
Layer
Hidden
Layer
Output
Layer
x1
x2
x3
x4
x5
y
Training ANN means learning the weights of
the neurons

Deriving Knowledge from Data at Scale
Deriving Knowledge from Data at Scale
Deriving Knowledge from Data at Scale
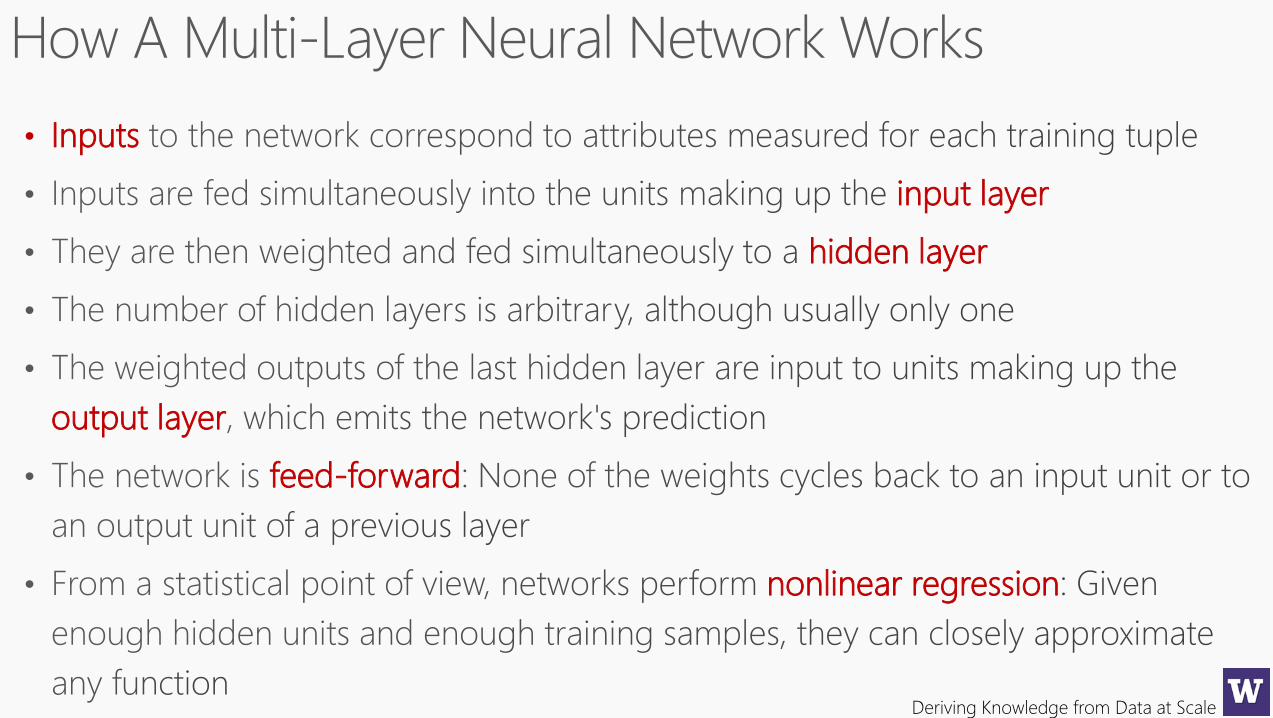
• Inputs
input layer
hidden layer
output layer
feed-forward
nonlinear regression
Deriving Knowledge from Data at Scale
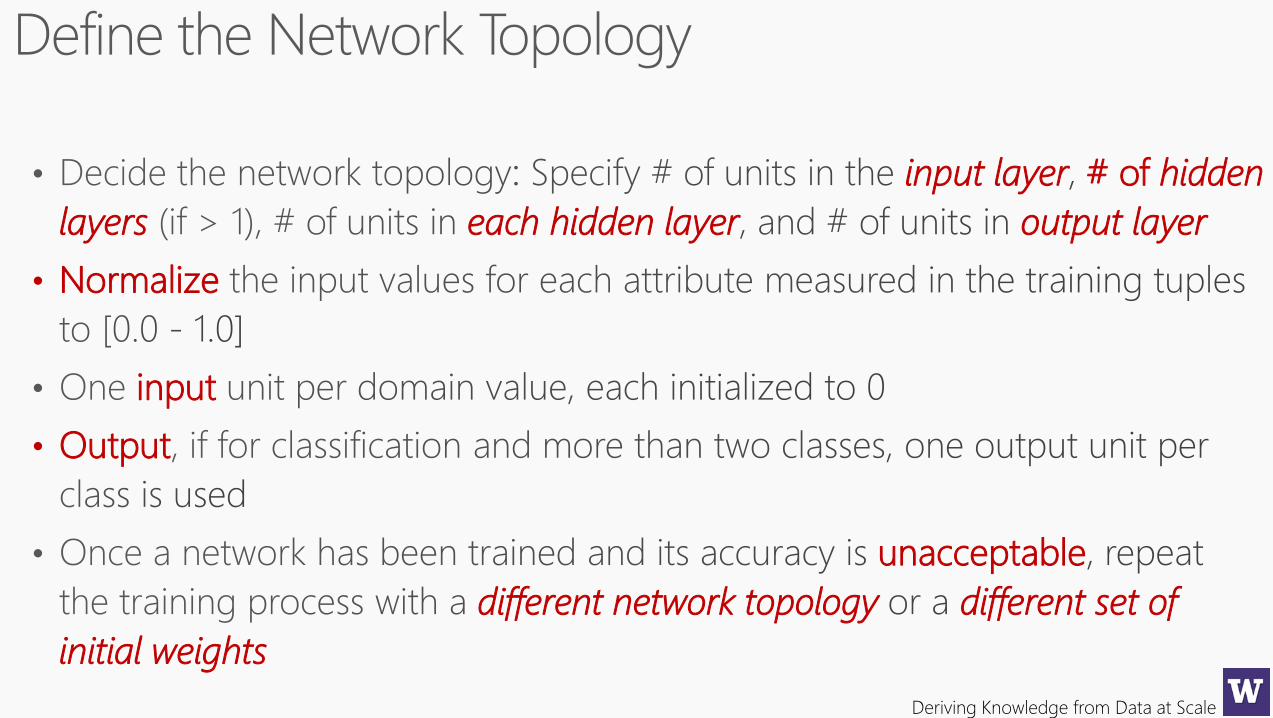
input layer # of hidden
layers each hidden layer output layer
• Normalize
input
• Output
unacceptable
different network topology different set of
initial weights
Deriving Knowledge from Data at Scale
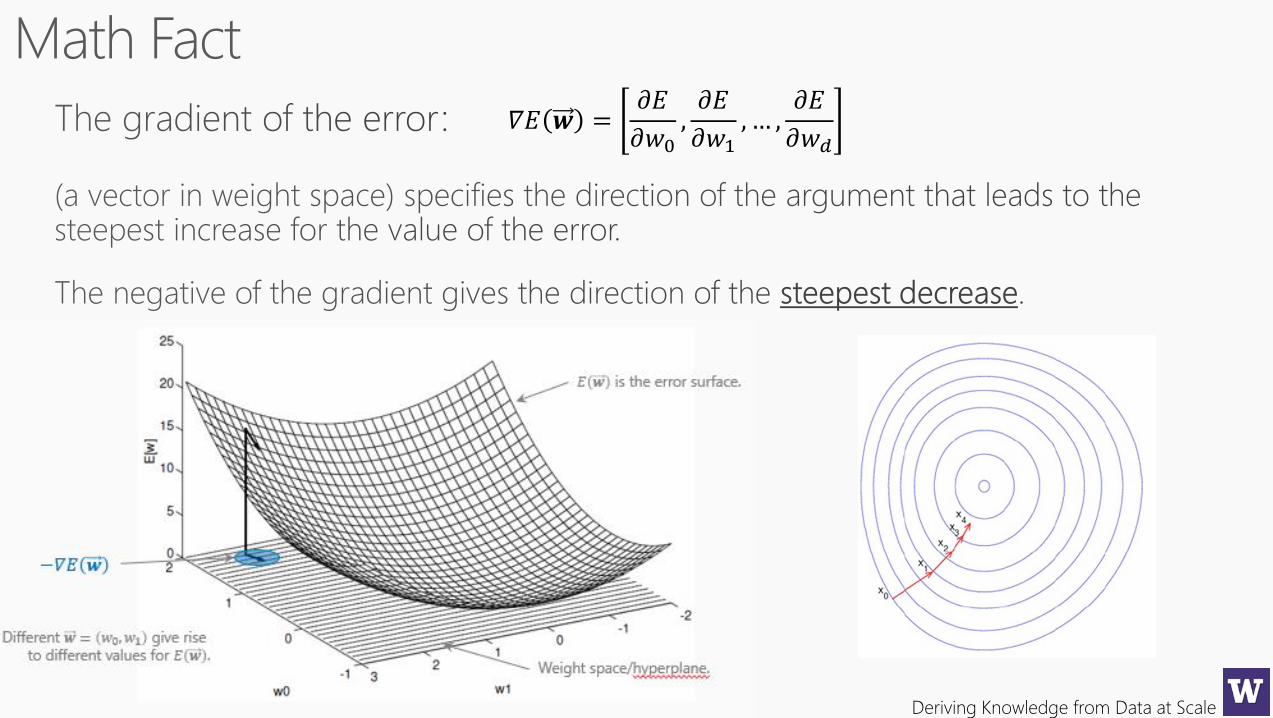
𝛻𝐸 𝒘 =𝜕𝐸
𝜕𝑤0,𝜕𝐸
𝜕𝑤1, … ,
𝜕𝐸
𝜕𝑤𝑑
Deriving Knowledge from Data at Scale
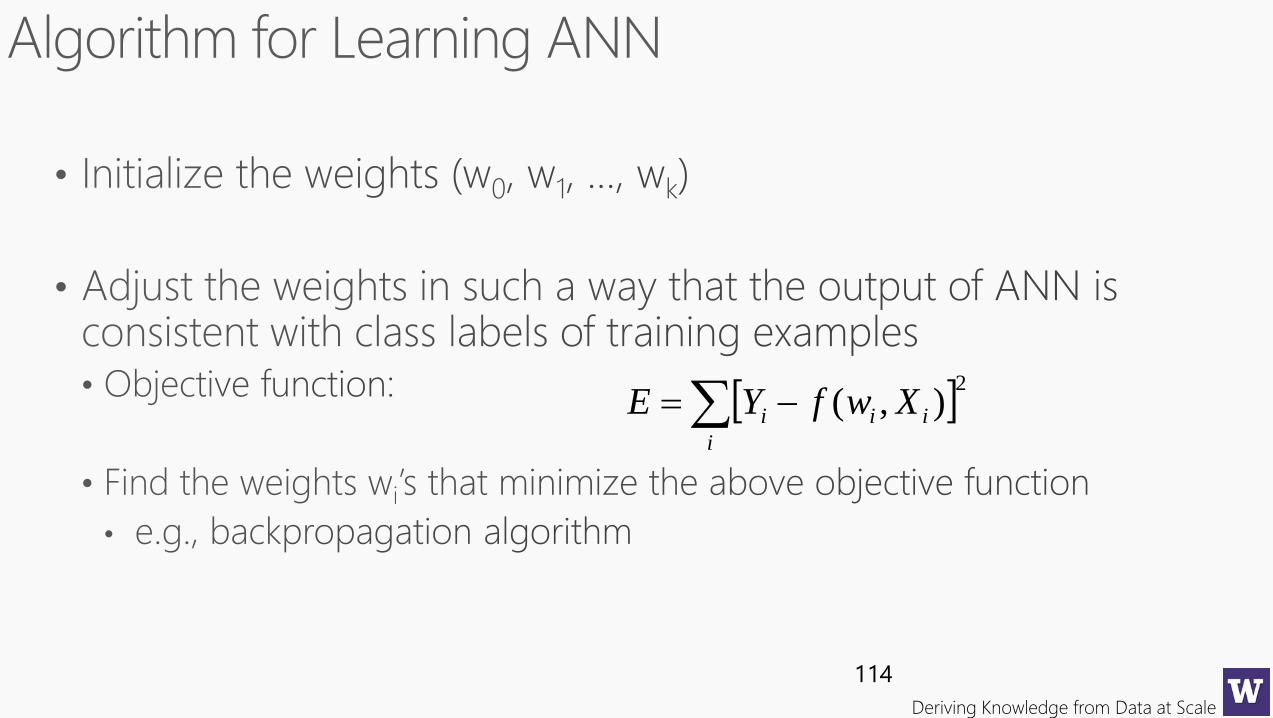
114
2
),( i
iii XwfYE
Deriving Knowledge from Data at Scale
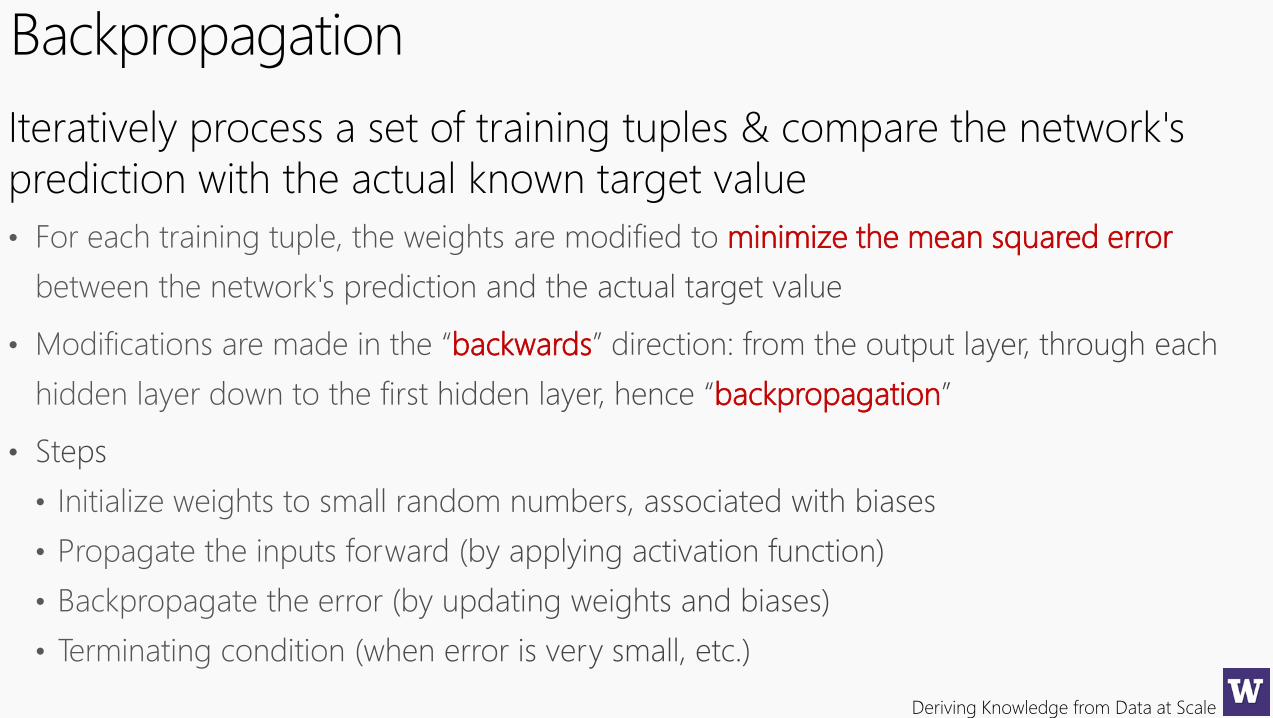
Backpropagation
Iteratively process a set of training tuples & compare the network's
prediction with the actual known target value
minimize the mean squared error
backwards
backpropagation
Deriving Knowledge from Data at Scale
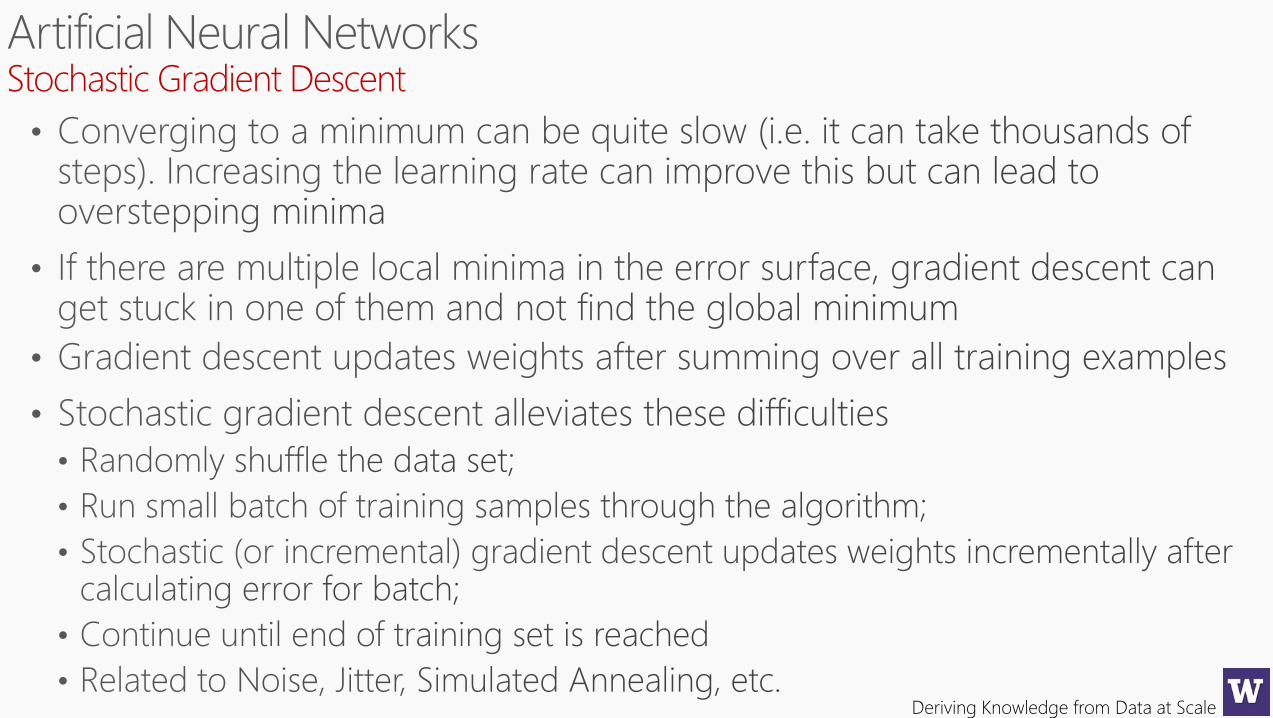
Stochastic Gradient Descent
Deriving Knowledge from Data at Scale
Deriving Knowledge from Data at Scale
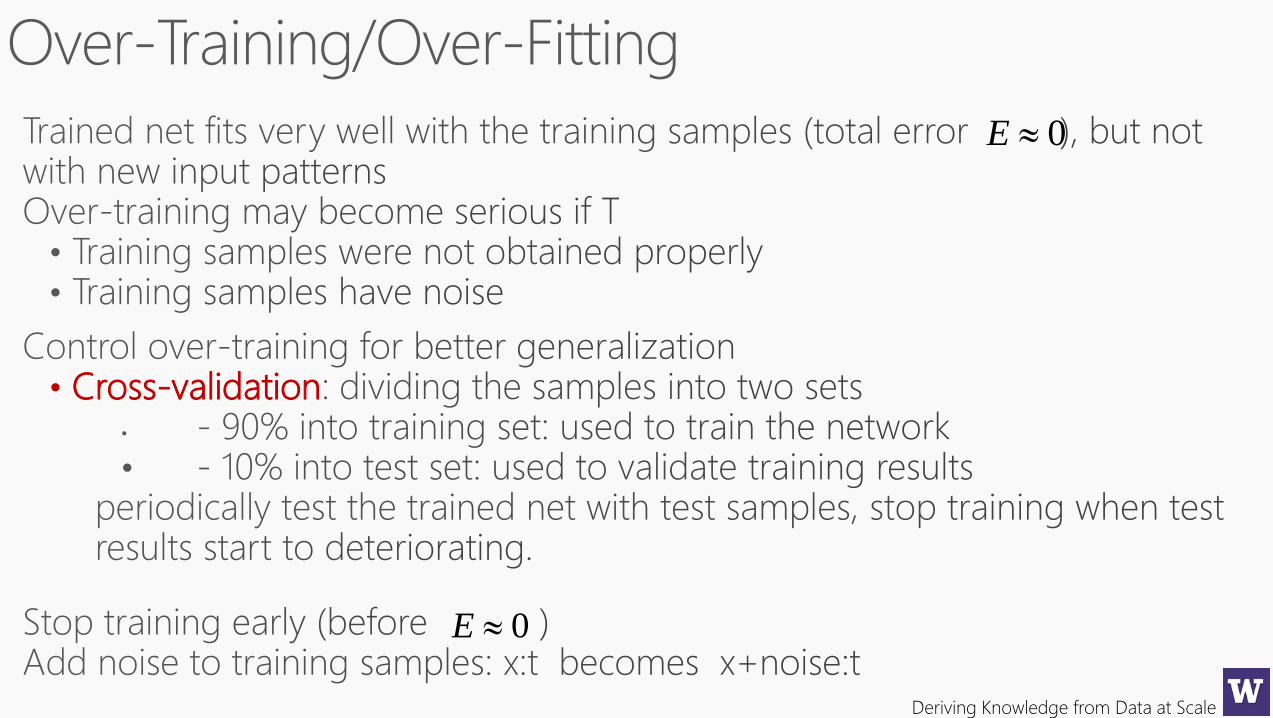
• Cross-validation
0E
0E
Deriving Knowledge from Data at Scale
Deriving Knowledge from Data at Scale
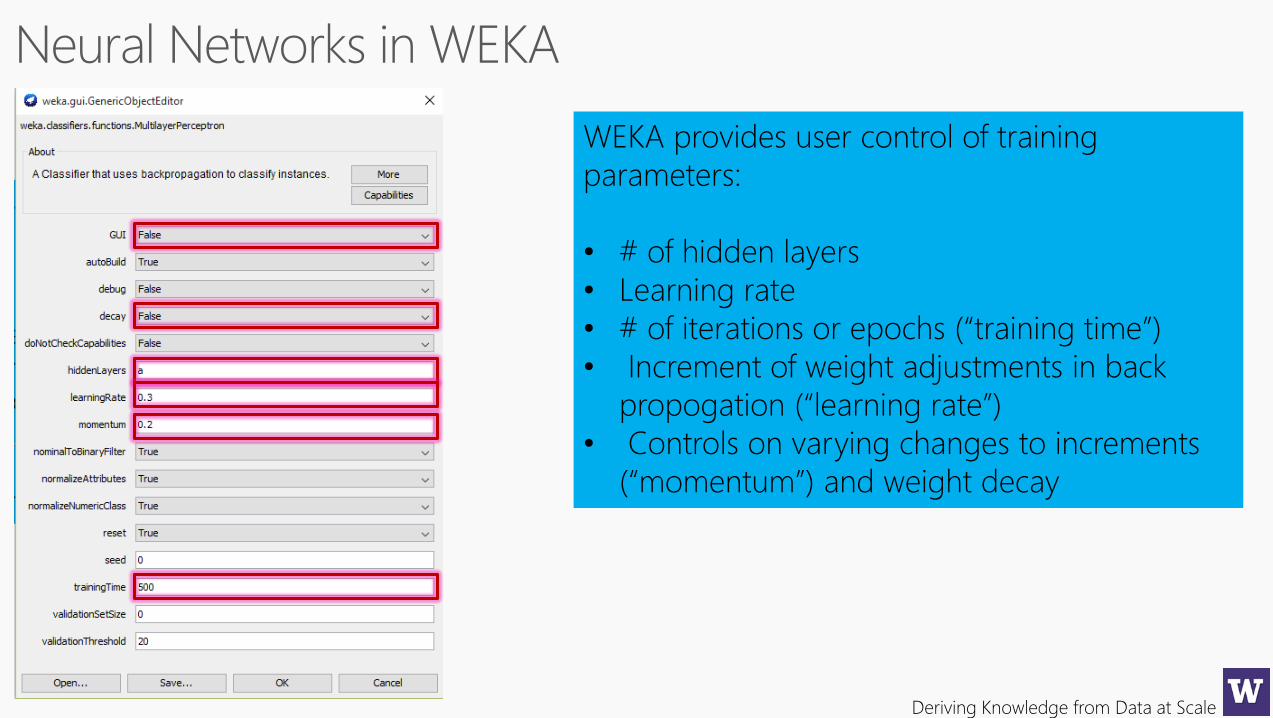
WEKA provides user control of training
parameters:
• # of hidden layers
• Learning rate
• # of iterations or epochs (“training time”)
• Increment of weight adjustments in back
propogation (“learning rate”)
• Controls on varying changes to increments
(“momentum”) and weight decay
Deriving Knowledge from Data at Scale
Deriving Knowledge from Data at Scale
Multilayered Neural Networks require a lot of experimentation to get right…
a lot…
I’m serious…
Deriving Knowledge from Data at Scale
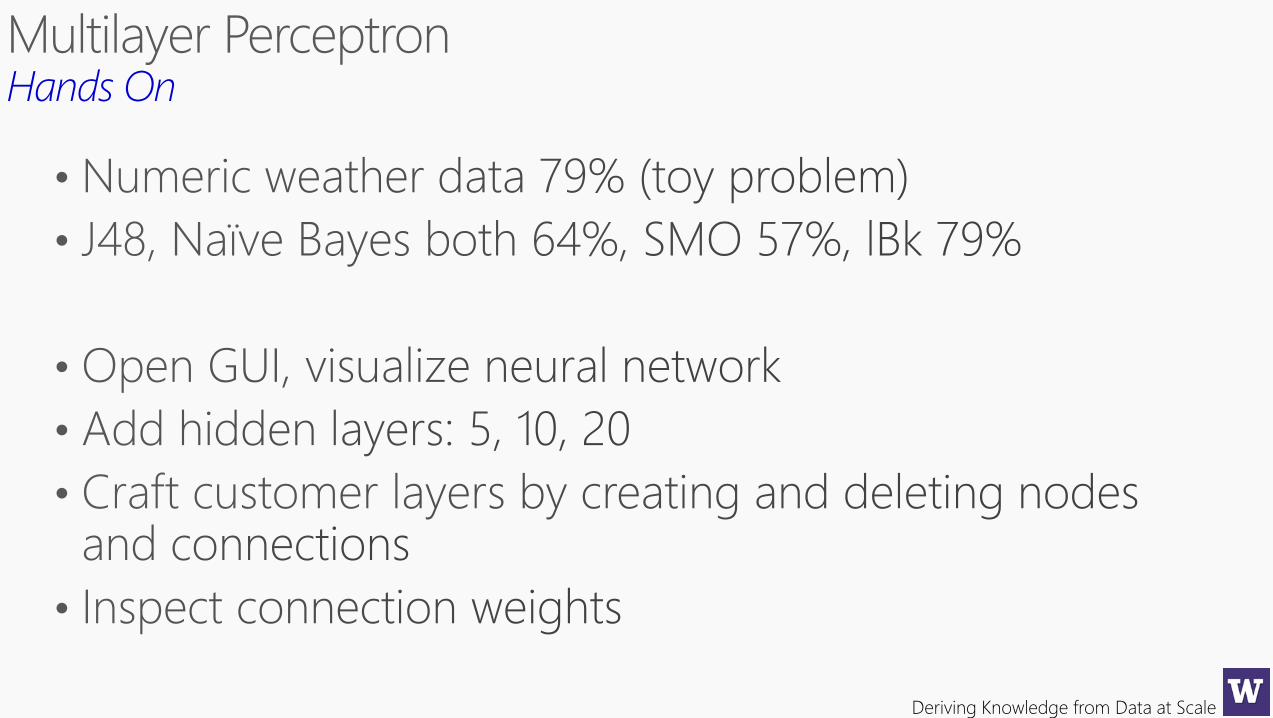
Hands On
Deriving Knowledge from Data at Scale
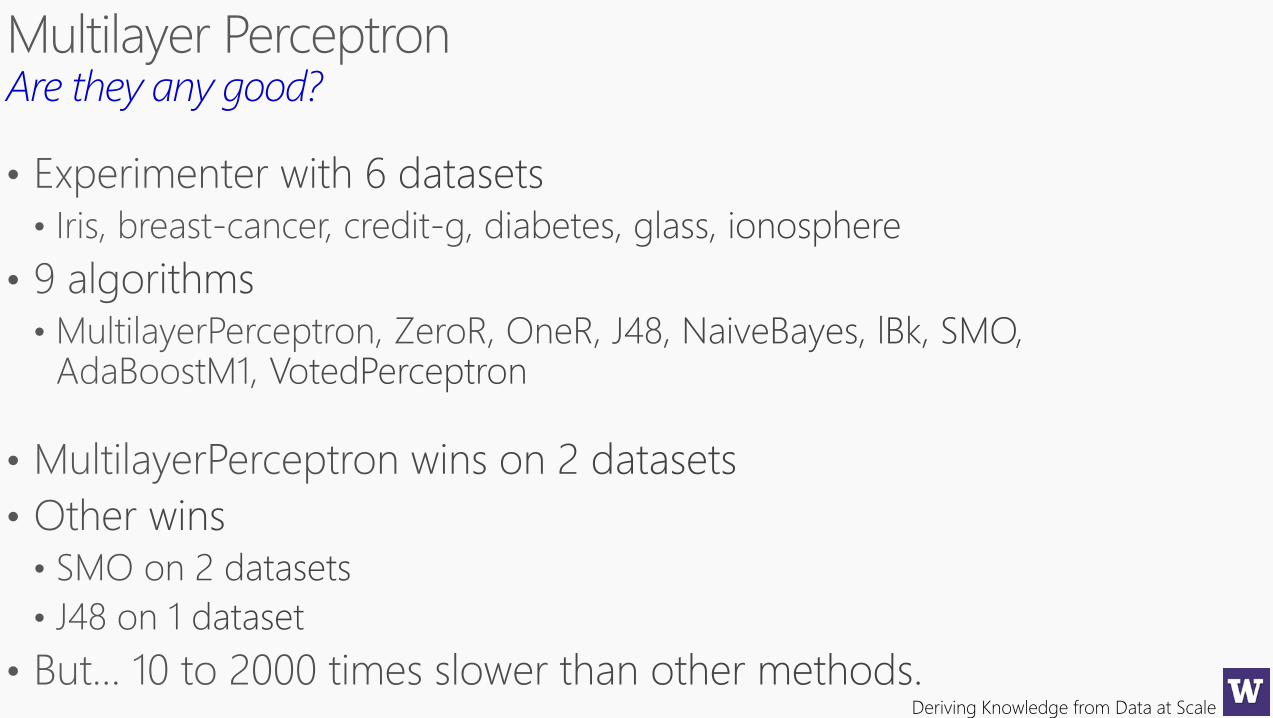
Are they any good?
Deriving Knowledge from Data at Scale
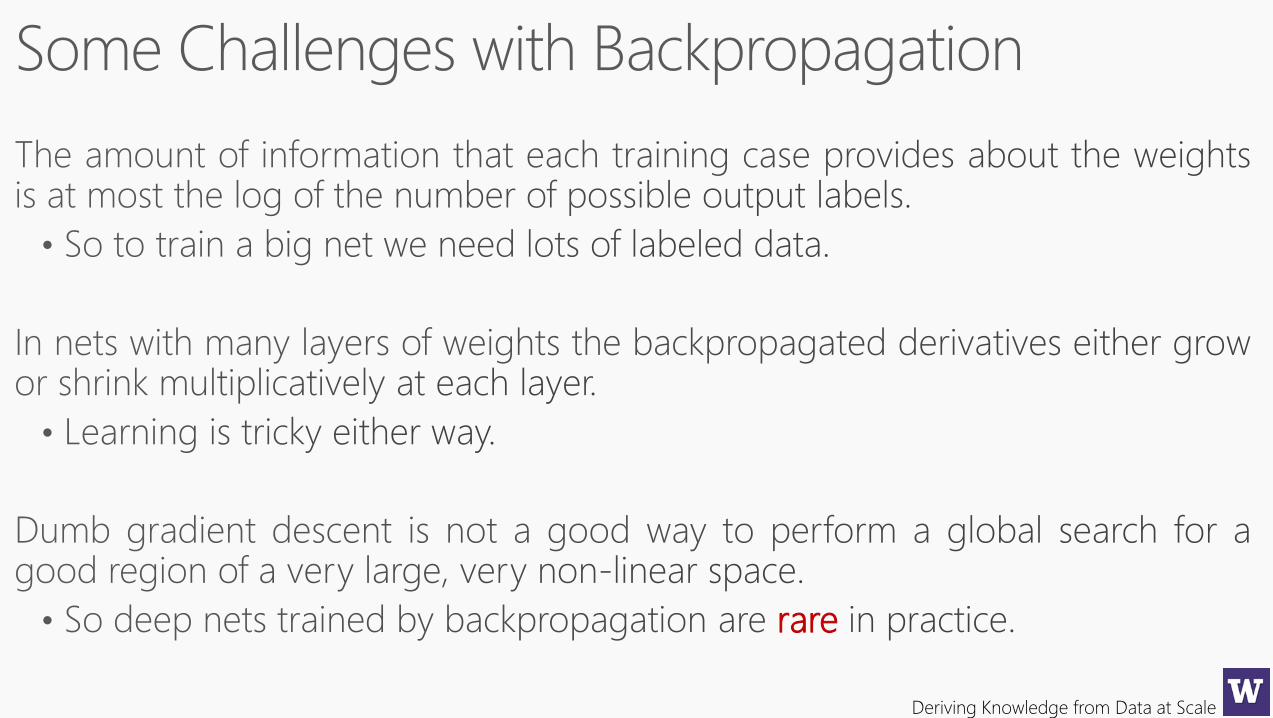
rare
Deriving Knowledge from Data at Scale
Deriving Knowledge from Data at Scale
That’s all for tonight….
Recommended