© 2016, Amazon Web Services, Inc. or its Affiliates. All rights reserved.
Puneet Agarwal, Solutions Architect, AWS
June 29, 2016
Amazon Aurora Deep Dive
MySQL-compatible relational database
Performance and availability of commercial databases
Simplicity and cost-effectiveness of open-source databases
What is Amazon Aurora?
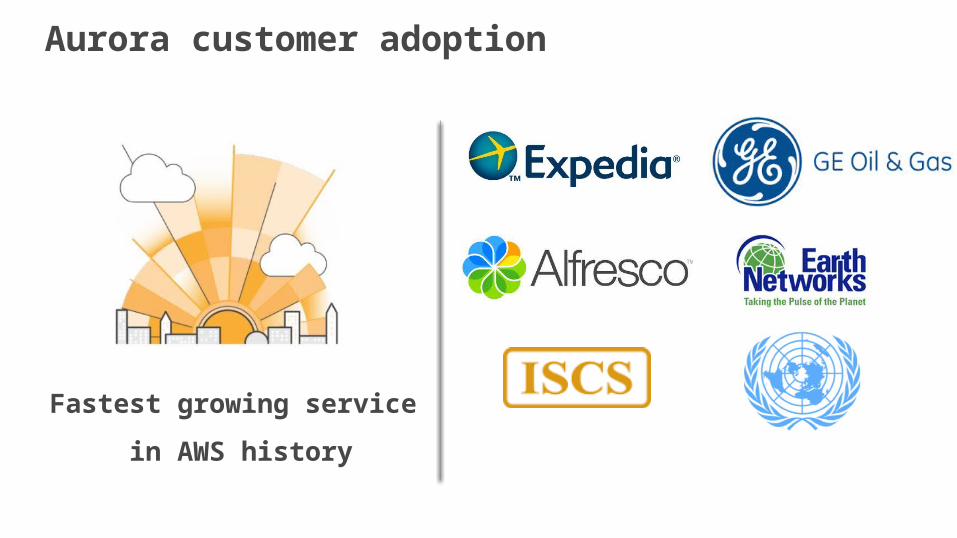
Fastest growing service
in AWS history
Aurora customer adoption

Expedia: Online travel marketplace Real-time business intelligence and
analytics on a growing corpus of online travel marketplace data.
Current Microsoft SQL Server–based architecture is too expensive. Performance degrades as data volume grows.
Cassandra with Solr index requires large memory footprint and hundreds of nodes, adding cost.
Aurora benefits: Aurora meets scale and performance
requirements with much lower cost. 25,000 inserts/sec with peak up to 70,000.
30 millisecond average response time for write and 17 millisecond for read, with 1 month of data.
World’s leading online travel company, with a portfolio that includes 150+
travel sites in 70 countries.
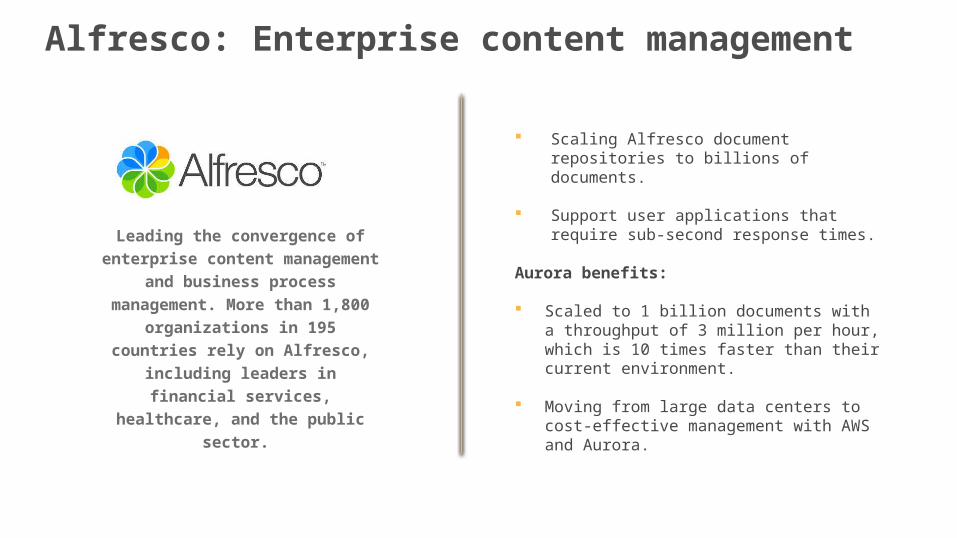
Alfresco: Enterprise content management
Scaling Alfresco document repositories to billions of documents.
Support user applications that require sub-second response times.
Aurora benefits:
Scaled to 1 billion documents with a throughput of 3 million per hour, which is 10 times faster than their current environment.
Moving from large data centers to cost-effective management with AWS and Aurora.
Leading the convergence of enterprise content management and
business process management. More than 1,800 organizations in 195
countries rely on Alfresco, including leaders in financial services,
healthcare, and the public sector.
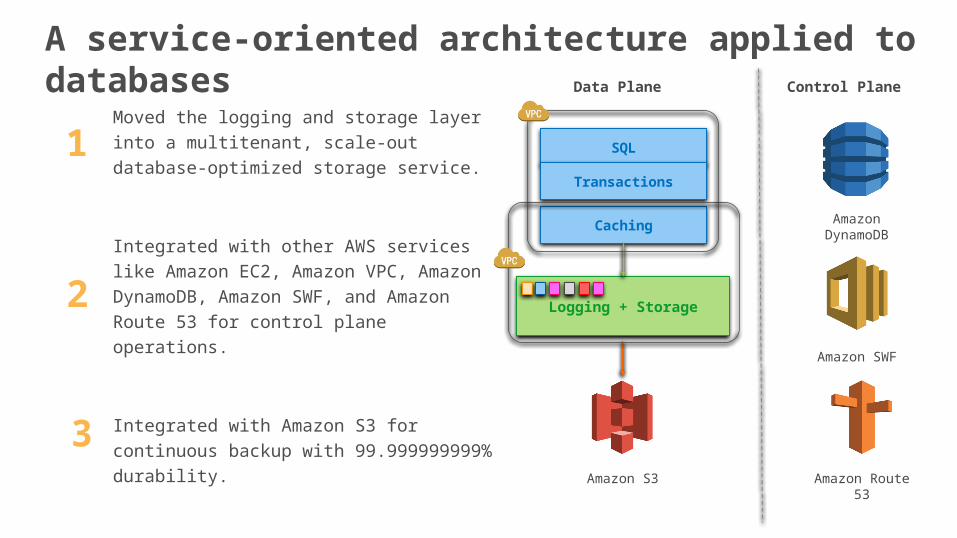
A service-oriented architecture applied to databases
Moved the logging and storage layer into a multitenant, scale-out database-optimized storage service.
Integrated with other AWS services like Amazon EC2, Amazon VPC, Amazon DynamoDB, Amazon SWF, and Amazon Route 53 for control plane operations.
Integrated with Amazon S3 for continuous backup with 99.999999999% durability.
Control PlaneData Plane
Amazon DynamoDB
Amazon SWF
Amazon Route 53
Logging + Storage
SQL
Transactions
Caching
Amazon S3
1
2
3
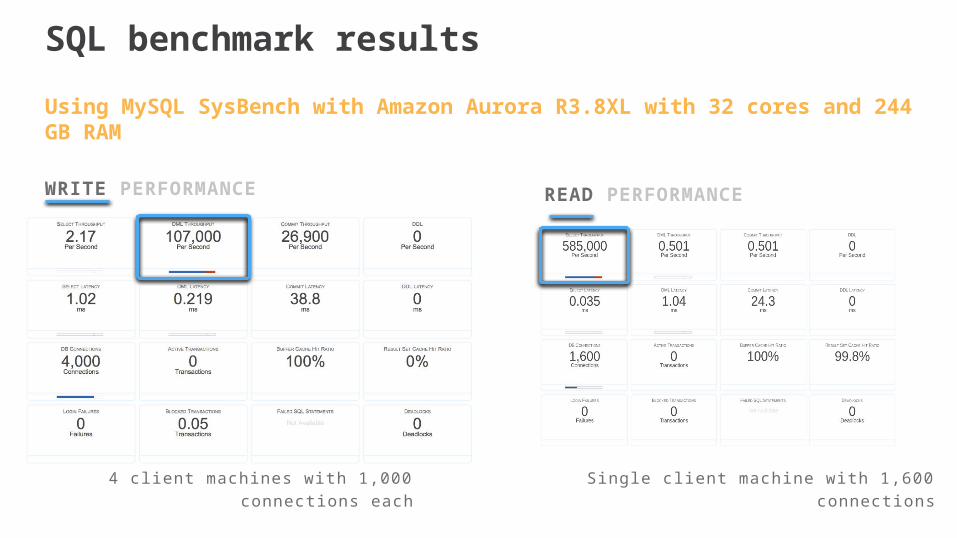
SQL benchmark results
4 cl ient machines with 1,000 connections each
WRITE PERFORMANCE READ PERFORMANCE
Single client machine with 1,600 connections
Using MySQL SysBench with Amazon Aurora R3.8XL with 32 cores and 244 GB RAM
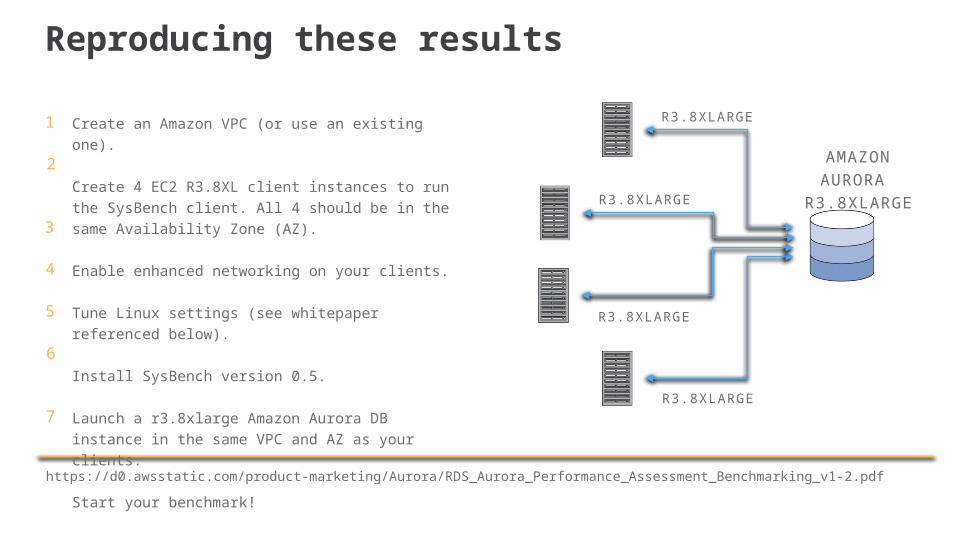
Reproducing these results
https://d0.awsstatic.com/product-marketing/Aurora/RDS_Aurora_Performance_Assessment_Benchmarking_v1-2.pdf
AMAZON AURORA
R3.8XLARGE
R3.8XLARGE
R3.8XLARGE
R3.8XLARGE
R3.8XLARGE
Create an Amazon VPC (or use an existing one).
Create 4 EC2 R3.8XL client instances to run the SysBench client. All 4 should be in the same Availability Zone (AZ).
Enable enhanced networking on your clients.
Tune Linux settings (see whitepaper referenced below).
Install SysBench version 0.5.
Launch a r3.8xlarge Amazon Aurora DB instance in the same VPC and AZ as your clients.
Start your benchmark!
1
2
3
4
5
6
7
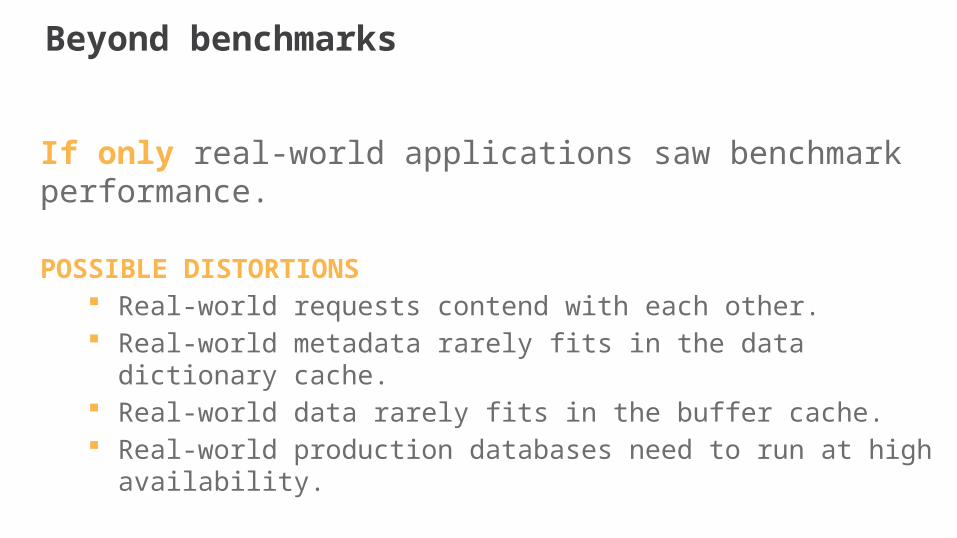
Beyond benchmarks
If only real-world applications saw benchmark performance.
POSSIBLE DISTORTIONS Real-world requests contend with each other. Real-world metadata rarely fits in the data dictionary cache. Real-world data rarely fits in the buffer cache. Real-world production databases need to run at high availability.
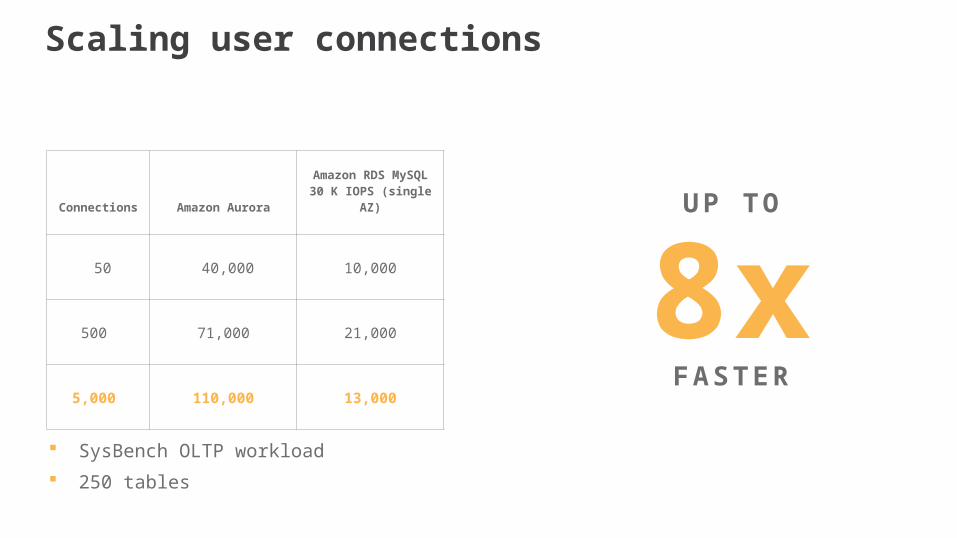
Scaling user connections
SysBench OLTP workload 250 tables
Connections Amazon AuroraAmazon RDS MySQL30 K IOPS (single AZ)
50 40,000 10,000
500 71,000 21,000
5,000 110,000 13,000
8xU P TO
FA S T E R
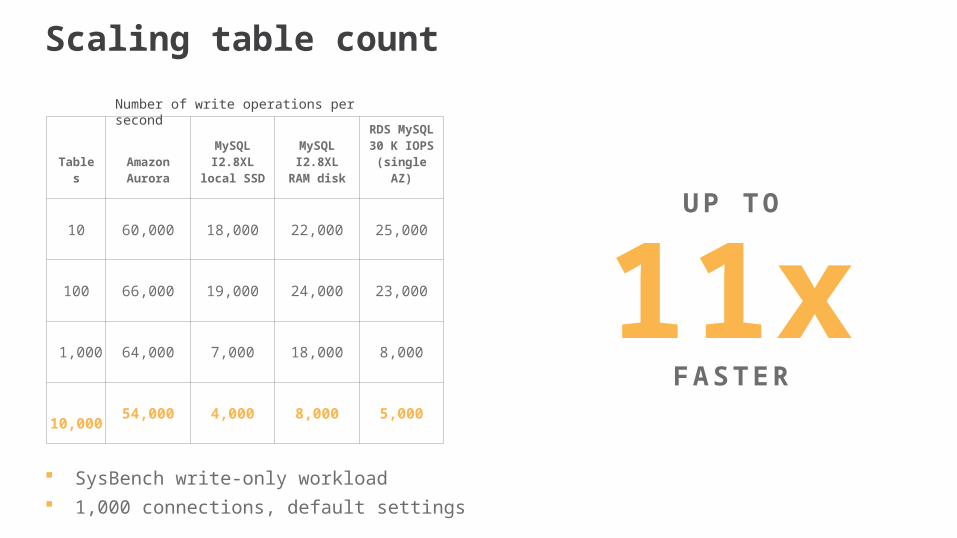
Scaling table count
SysBench write-only workload 1,000 connections, default settings
TablesAmazon Aurora
MySQLI2.8XL
local SSD
MySQLI2.8XL
RAM disk
RDS MySQL
30 K IOPS (single AZ)
10 60,000 18,000 22,000 25,000
100 66,000 19,000 24,000 23,000
1,000 64,000 7,000 18,000 8,000
10,000 54,000 4,000 8,000 5,000
Number of write operations per second
11xU P TO
FA S T E R
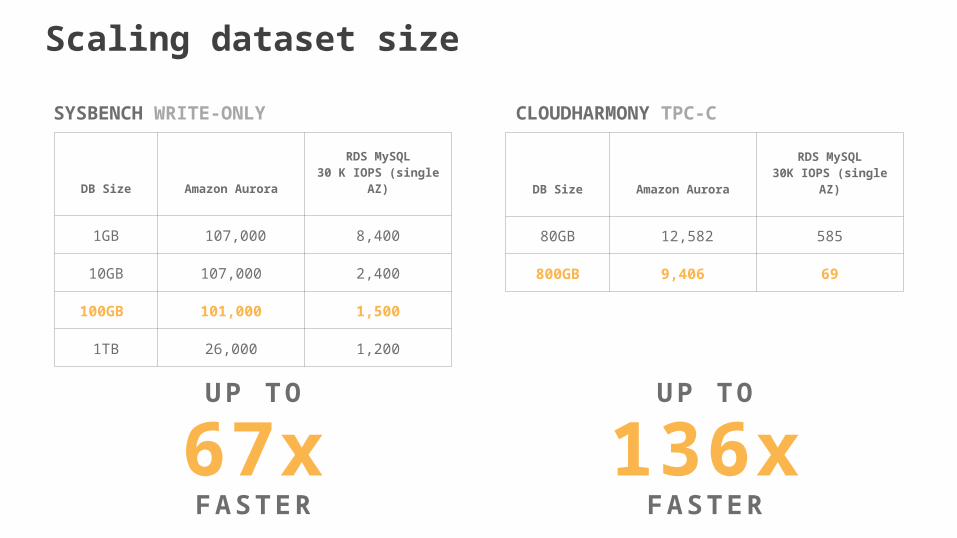
Scaling dataset size
SYSBENCH WRITE-ONLY
DB Size Amazon AuroraRDS MySQL
30 K IOPS (single AZ)
1GB 107,000 8,400
10GB 107,000 2,400
100GB 101,000 1,500
1TB 26,000 1,200
67xU P TO
FA S T E R
DB Size Amazon AuroraRDS MySQL
30K IOPS (single AZ)
80GB 12,582 585
800GB 9,406 69
CLOUDHARMONY TPC-C
136xU P TO
FA S T E R
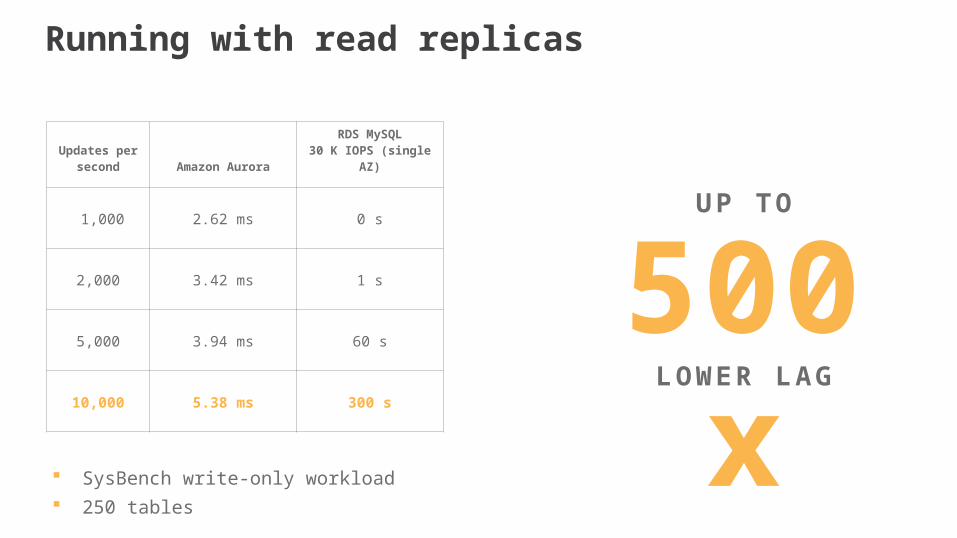
Running with read replicas
SysBench write-only workload 250 tables
Updates persecond Amazon Aurora
RDS MySQL30 K IOPS (single AZ)
1,000 2.62 ms 0 s
2,000 3.42 ms 1 s
5,000 3.94 ms 60 s
10,000 5.38 ms 300 s
500xU P TO
L O W E R L A G
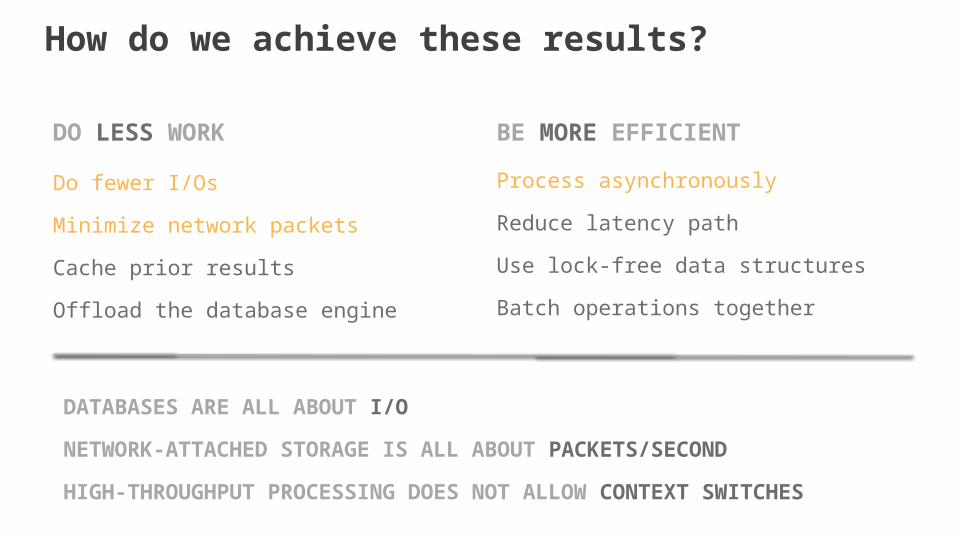
Do fewer I/Os
Minimize network packets
Cache prior results
Offload the database engine
DO LESS WORK
Process asynchronously
Reduce latency path
Use lock-free data structures
Batch operations together
BE MORE EFFICIENT
How do we achieve these results?
DATABASES ARE ALL ABOUT I/O
NETWORK-ATTACHED STORAGE IS ALL ABOUT PACKETS/SECOND
HIGH-THROUGHPUT PROCESSING DOES NOT ALLOW CONTEXT SWITCHES
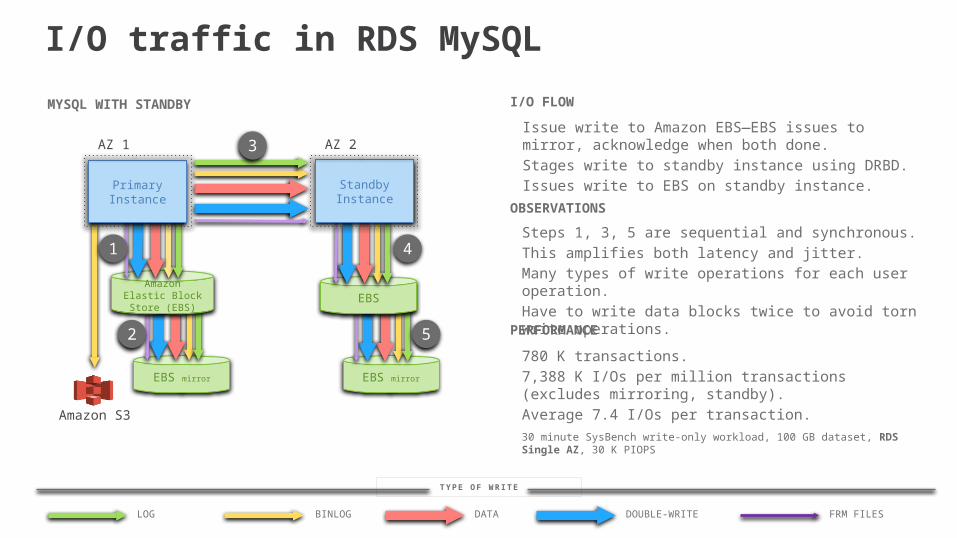
I/O traffic in RDS MySQL
BINLOG DATA DOUBLE-WRITELOG FRM FILES
T Y P E O F W R I T E
MYSQL WITH STANDBY
EBS mirrorEBS mirror
AZ 1 AZ 2
Amazon S3
EBSAmazon Elastic
Block Store (EBS)
PrimaryInstance
StandbyInstance
1
2
3
4
5
Issue write to Amazon EBS—EBS issues to mirror, acknowledge when both done.Stages write to standby instance using DRBD.Issues write to EBS on standby instance.
I/O FLOW
Steps 1, 3, 5 are sequential and synchronous.This amplifies both latency and jitter.Many types of write operations for each user operation.Have to write data blocks twice to avoid torn write operations.
OBSERVATIONS
780 K transactions.7,388 K I/Os per million transactions (excludes mirroring, standby).Average 7.4 I/Os per transaction.
PERFORMANCE
30 minute SysBench write-only workload, 100 GB dataset, RDS Single AZ, 30 K PIOPS
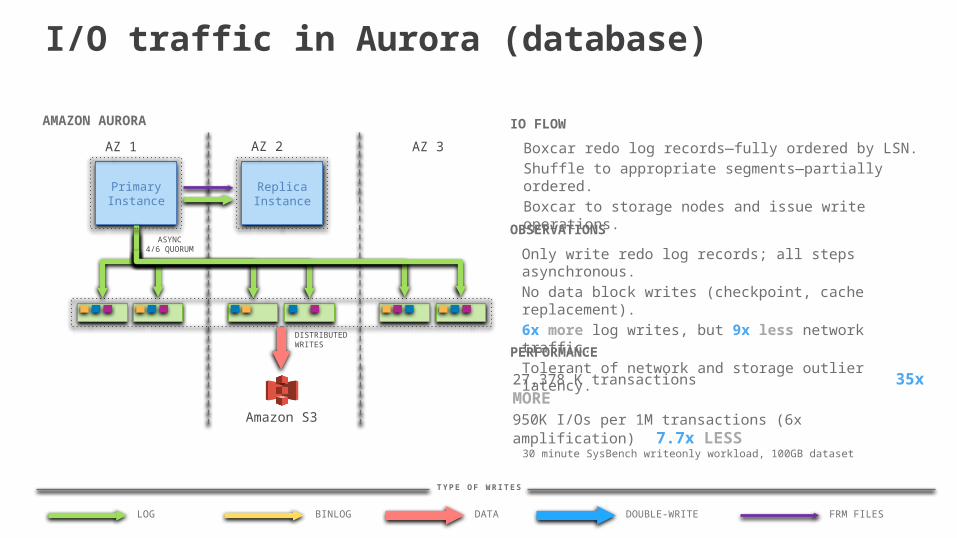
I/O traffic in Aurora (database)
AZ 1 AZ 3
PrimaryInstance
Amazon S3
AZ 2
ReplicaInstance
AMAZON AURORA
ASYNC4/6 QUORUM
DISTRIBUTED WRITES
BINLOG DATA DOUBLE-WRITELOG FRM FILES
T Y P E O F W R I T E S
30 minute SysBench writeonly workload, 100GB dataset
IO FLOW
Only write redo log records; all steps asynchronous.No data block writes (checkpoint, cache replacement).6x more log writes, but 9x less network traffic.Tolerant of network and storage outlier latency.
OBSERVATIONS
27,378 K transactions 35x MORE
950K I/Os per 1M transactions (6x amplification) 7.7x LESS
PERFORMANCE
Boxcar redo log records—fully ordered by LSN.Shuffle to appropriate segments—partially ordered.Boxcar to storage nodes and issue write operations.
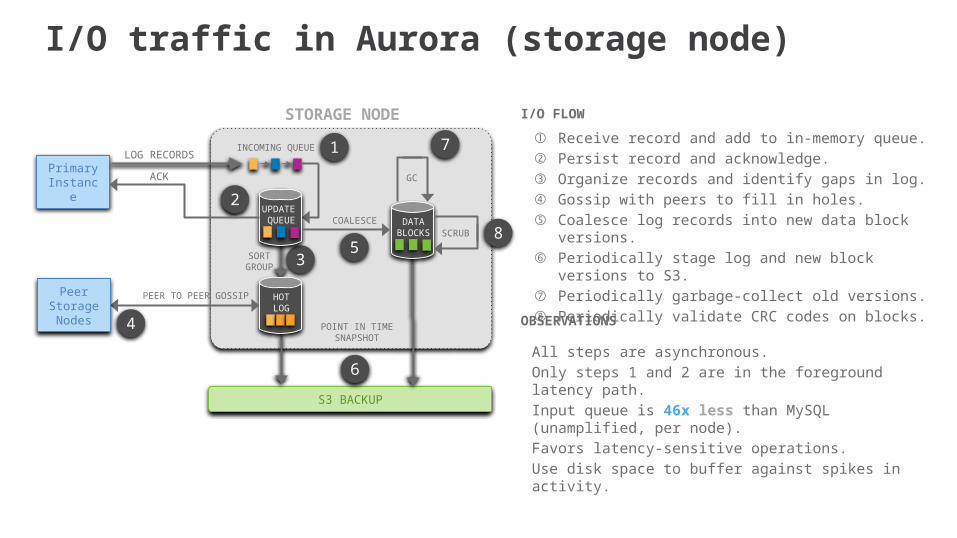
I/O traffic in Aurora (storage node)
LOG RECORDS
Primary Instance
INCOMING QUEUE
STORAGE NODE
S3 BACKUP
1
2
3
4
5
6
7
8
UPDATE QUEUE
ACK
HOTLOG
DATABLOCKS
POINT IN TIMESNAPSHOT
GC
SCRUBCOALESCE
SORTGROUP
PEER TO PEER GOSSIPPeerStorageNodes
All steps are asynchronous.Only steps 1 and 2 are in the foreground latency path.Input queue is 46x less than MySQL (unamplified, per node).Favors latency-sensitive operations.Use disk space to buffer against spikes in activity.
OBSERVATIONS
I/O FLOW
① Receive record and add to in-memory queue.② Persist record and acknowledge. ③ Organize records and identify gaps in log.④ Gossip with peers to fill in holes.⑤ Coalesce log records into new data block versions.⑥ Periodically stage log and new block versions to S3.⑦ Periodically garbage-collect old versions.⑧ Periodically validate CRC codes on blocks.
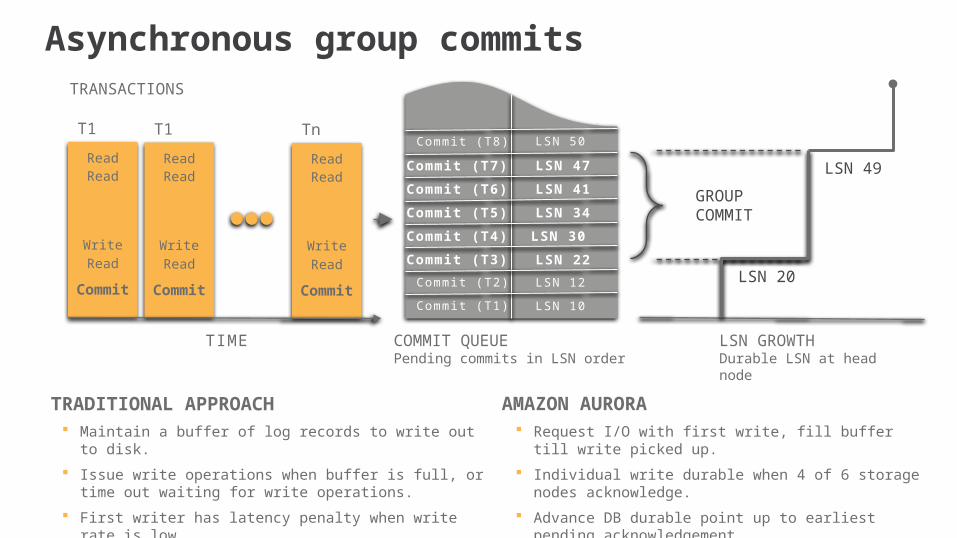
Asynchronous group commits
Read
Write
Commit
Read
Read
T1
Commi t (T1)
Commi t (T2)
Commit (T3)
LSN 10
LSN 12
LSN 22
LSN 50
LSN 30
LSN 34
LSN 41
LSN 47
LSN 20
LSN 49
Commit (T4)
Commit (T5)
Commit (T6)Commit (T7)
Commi t (T8)
LSN GROWTHDurable LSN at head node
COMMIT QUEUEPending commits in LSN order
TIME
GROUPCOMMIT
TRANSACTIONS
Read
Write
Commit
Read
Read
T1
Read
Write
Commit
Read
Read
Tn
TRADITIONAL APPROACH AMAZON AURORA Maintain a buffer of log records to write out to disk. Issue write operations when buffer is full, or time out waiting for
write operations. First writer has latency penalty when write rate is low.
Request I/O with first write, fill buffer till write picked up. Individual write durable when 4 of 6 storage nodes
acknowledge. Advance DB durable point up to earliest pending
acknowledgement.
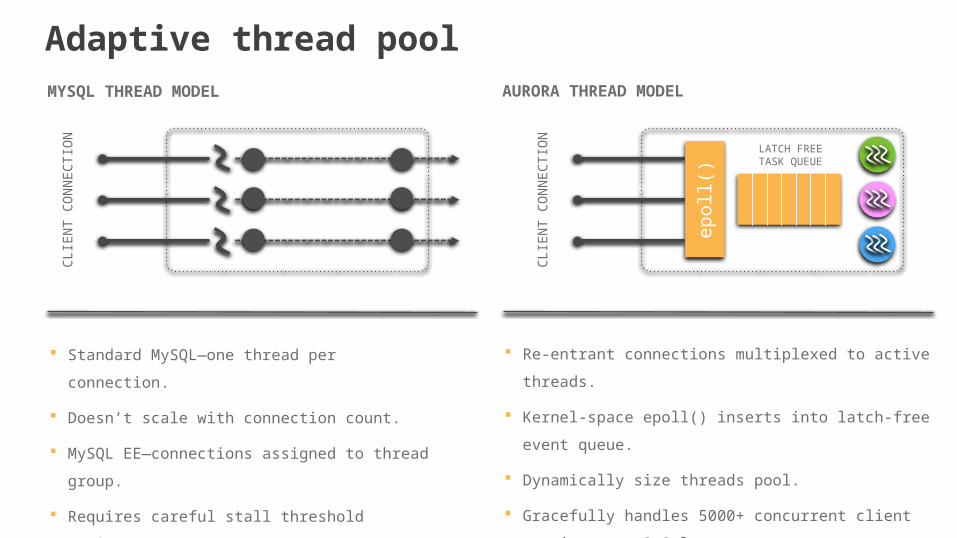
Re-entrant connections multiplexed to active threads.
Kernel-space epoll() inserts into latch-free event queue.
Dynamically size threads pool.
Gracefully handles 5000+ concurrent client sessions on r3.8xl.
Standard MySQL—one thread per connection.
Doesn’t scale with connection count.
MySQL EE—connections assigned to thread group.
Requires careful stall threshold tuning.
CLI
EN
T C
ON
NE
CTI
ON
CLI
EN
T C
ON
NE
CTI
ON
LATCH FREETASK QUEUE
epol
l()
MYSQL THREAD MODEL AURORA THREAD MODEL
Adaptive thread pool
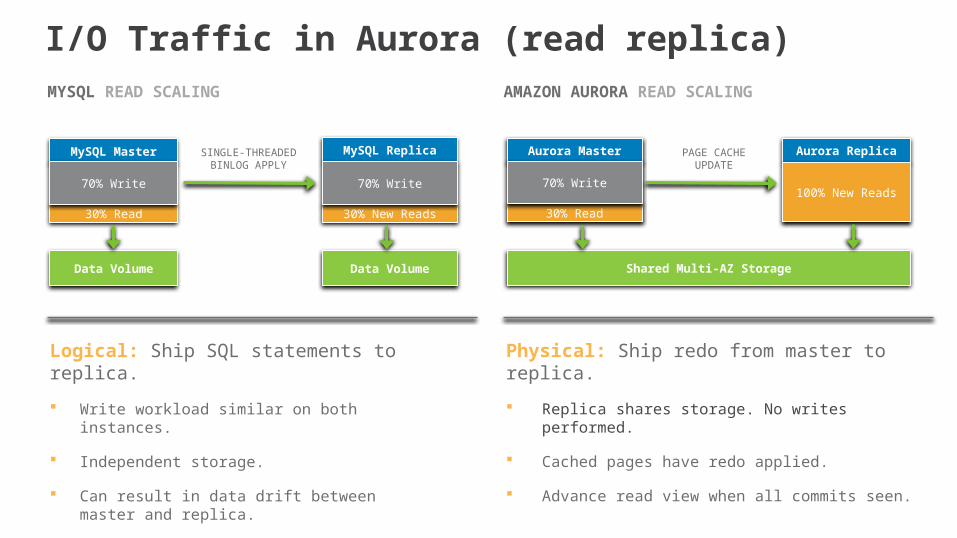
I/O Traffic in Aurora (read replica)
PAGE CACHEUPDATE
Aurora Master
30% Read
70% Write
Aurora Replica
100% New Reads
Shared Multi-AZ Storage
MySQL Master
30% Read
70% Write
MySQL Replica
30% New Reads
70% Write
SINGLE-THREADEDBINLOG APPLY
Data Volume Data Volume
Logical: Ship SQL statements to replica.
Write workload similar on both instances.
Independent storage.
Can result in data drift between master and replica.
Physical: Ship redo from master to replica.
Replica shares storage. No writes performed.
Cached pages have redo applied.
Advance read view when all commits seen.
MYSQL READ SCALING AMAZON AURORA READ SCALING
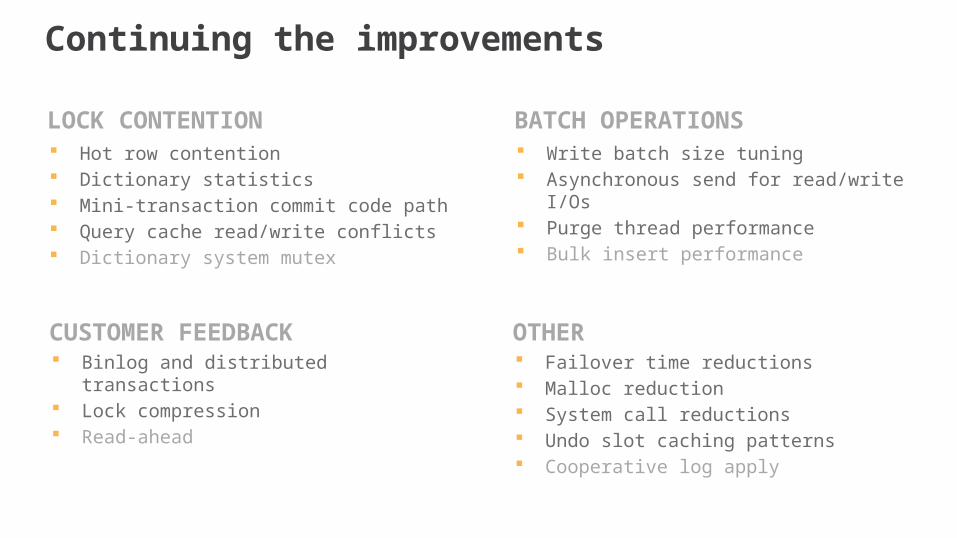
Hot row contention Dictionary statistics Mini-transaction commit code path Query cache read/write conflicts Dictionary system mutex
Continuing the improvements
Write batch size tuning Asynchronous send for read/write I/Os Purge thread performance Bulk insert performance
BATCH OPERATIONS
Failover time reductions Malloc reduction System call reductions Undo slot caching patterns Cooperative log apply
OTHER Binlog and distributed transactions Lock compression Read-ahead
CUSTOMER FEEDBACK
LOCK CONTENTION
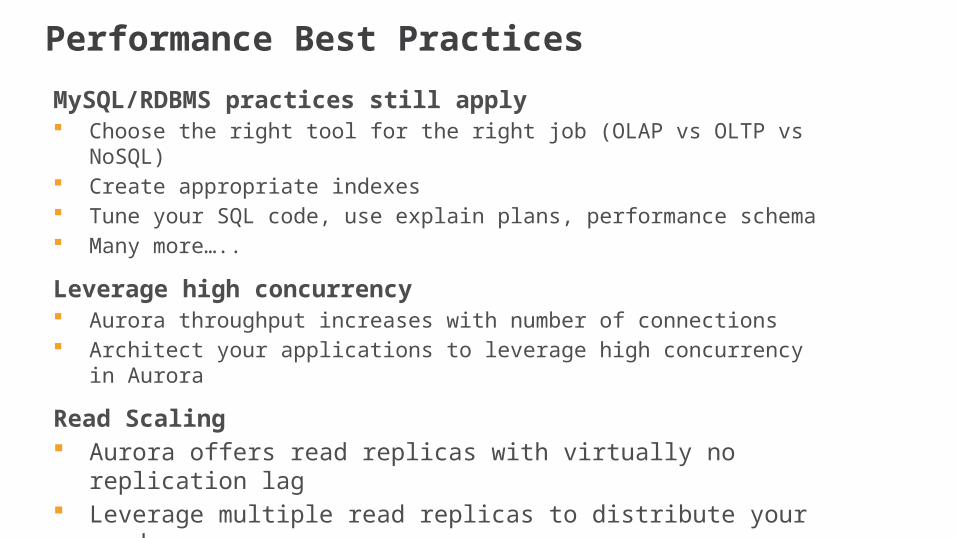
Performance Best PracticesMySQL/RDBMS practices still apply Choose the right tool for the right job (OLAP vs OLTP vs NoSQL) Create appropriate indexes Tune your SQL code, use explain plans, performance schema Many more…..
Leverage high concurrency Aurora throughput increases with number of connections Architect your applications to leverage high concurrency in Aurora
Read Scaling Aurora offers read replicas with virtually no replication lag Leverage multiple read replicas to distribute your reads
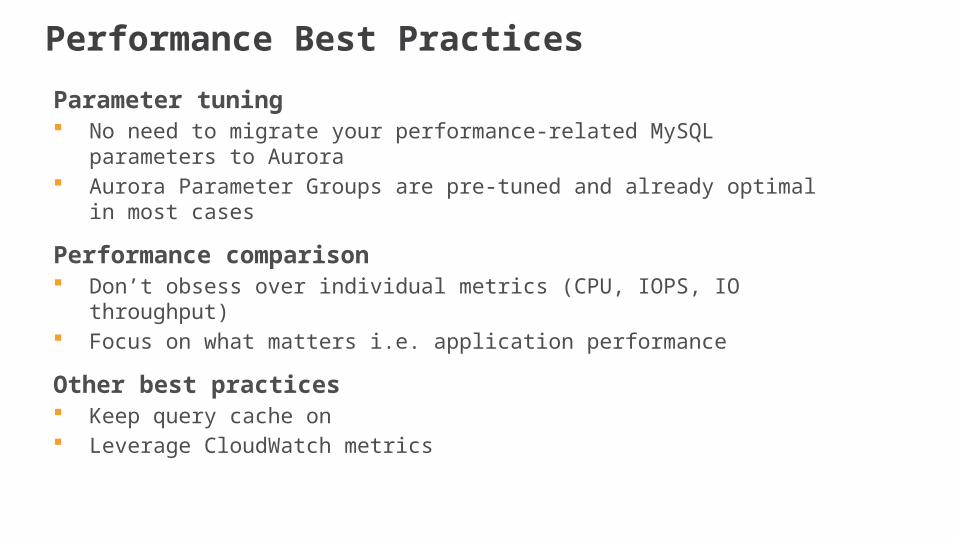
Performance Best PracticesParameter tuning No need to migrate your performance-related MySQL parameters to Aurora Aurora Parameter Groups are pre-tuned and already optimal in most cases
Performance comparison Don’t obsess over individual metrics (CPU, IOPS, IO throughput) Focus on what matters i.e. application performance
Other best practices Keep query cache on Leverage CloudWatch metrics
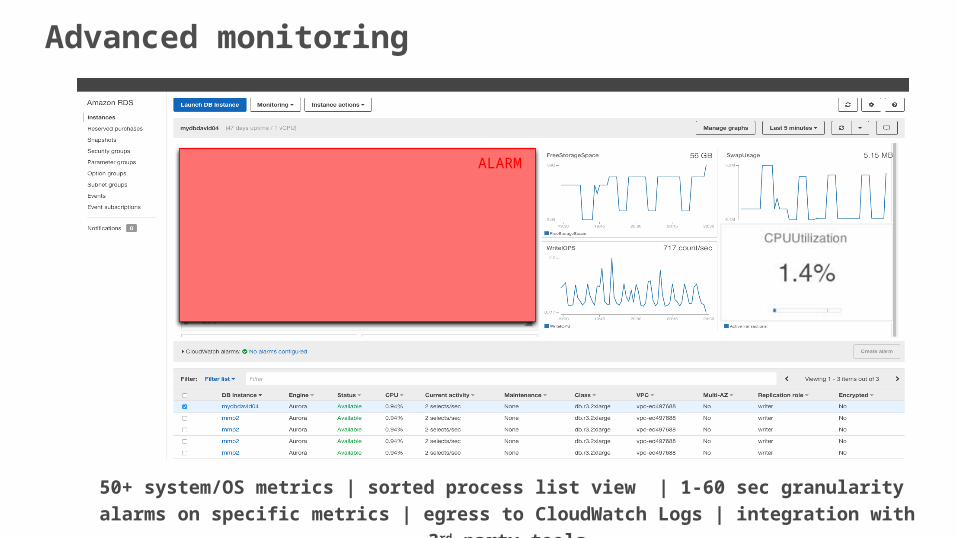
Advanced monitoring
50+ system/OS metrics | sorted process list view | 1-60 sec granularity alarms on specific metrics | egress to CloudWatch Logs | integration with 3rd-party tools
ALARM
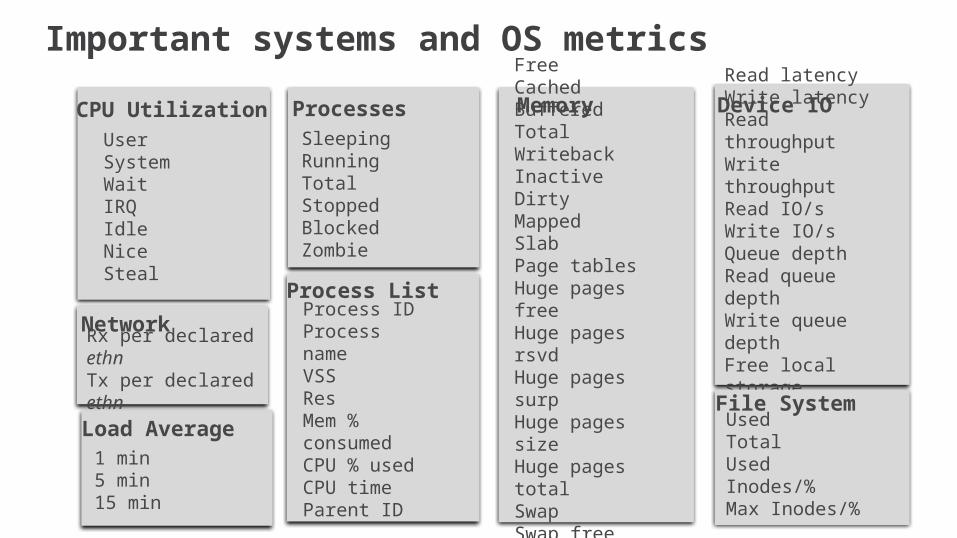
Important systems and OS metrics
User System Wait IRQ IdleNiceSteal
CPU Utilization
Rx per declared ethn Tx per declared ethn
Network
SleepingRunningTotalStoppedBlockedZombie
Processes
Process ID Process name VSS Res Mem % consumed CPU % used CPU time Parent ID
Process List
FreeCachedBufferedTotalWritebackInactiveDirty MappedSlabPage tablesHuge pages free Huge pages rsvdHuge pages surpHuge pages size Huge pages totalSwapSwap freeSwap committed
MemoryRead latencyWrite latencyRead throughputWrite throughputRead IO/sWrite IO/sQueue depthRead queue depthWrite queue depthFree local storage
Device IO
UsedTotalUsed Inodes/%Max Inodes/%
File System
1 min5 min 15 min
Load Average
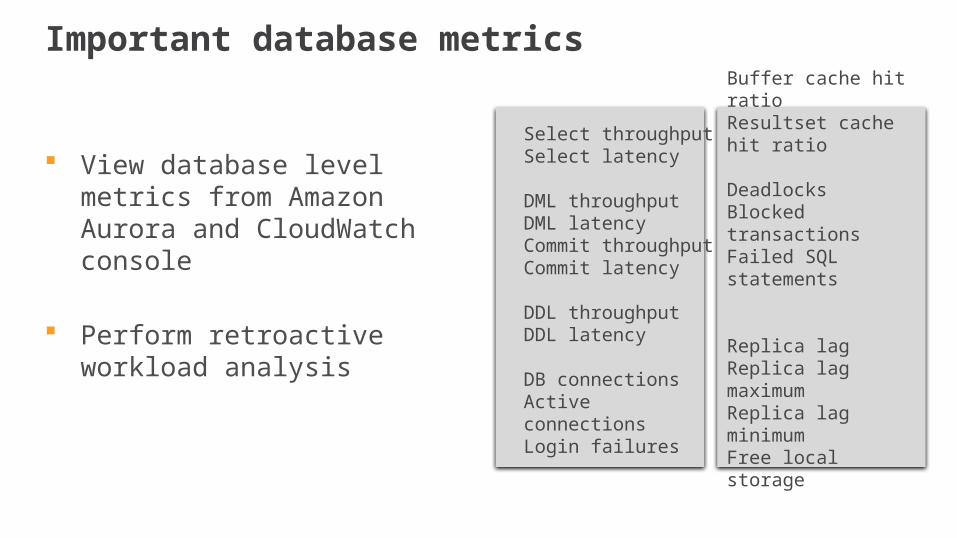
Important database metrics
View database level metrics from Amazon Aurora and CloudWatch console
Perform retroactive workload analysis
Select throughputSelect latency
DML throughputDML latencyCommit throughputCommit latency
DDL throughputDDL latency
DB connectionsActive connectionsLogin failures
Buffer cache hit ratioResultset cache hit ratio
DeadlocksBlocked transactionsFailed SQL statements
Replica lagReplica lag maximumReplica lag minimumFree local storage
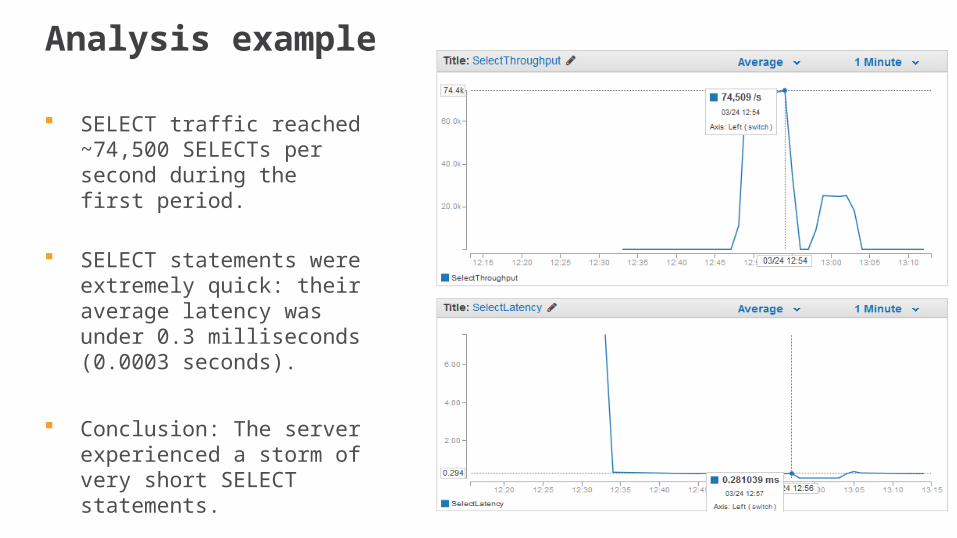
Analysis example
SELECT traffic reached ~74,500 SELECTs per second during the first period.
SELECT statements were extremely quick: their average latency was under 0.3 milliseconds (0.0003 seconds).
Conclusion: The server experienced a storm of very short SELECT statements.
Availability
“Performance only matters if your database is up”
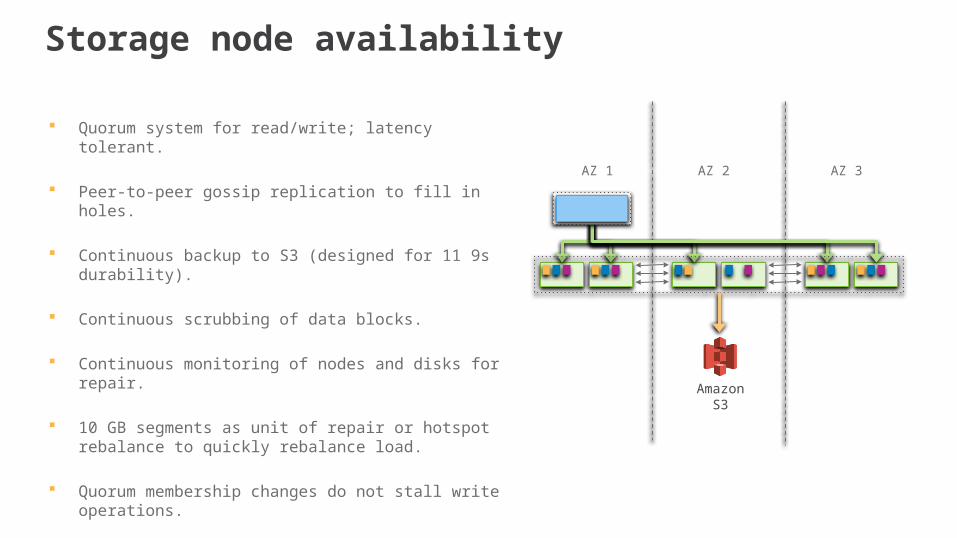
Storage node availability
Quorum system for read/write; latency tolerant.
Peer-to-peer gossip replication to fill in holes.
Continuous backup to S3 (designed for 11 9s durability).
Continuous scrubbing of data blocks.
Continuous monitoring of nodes and disks for repair.
10 GB segments as unit of repair or hotspot rebalance to quickly rebalance load.
Quorum membership changes do not stall write operations.
AZ 1 AZ 2 AZ 3
Amazon S3
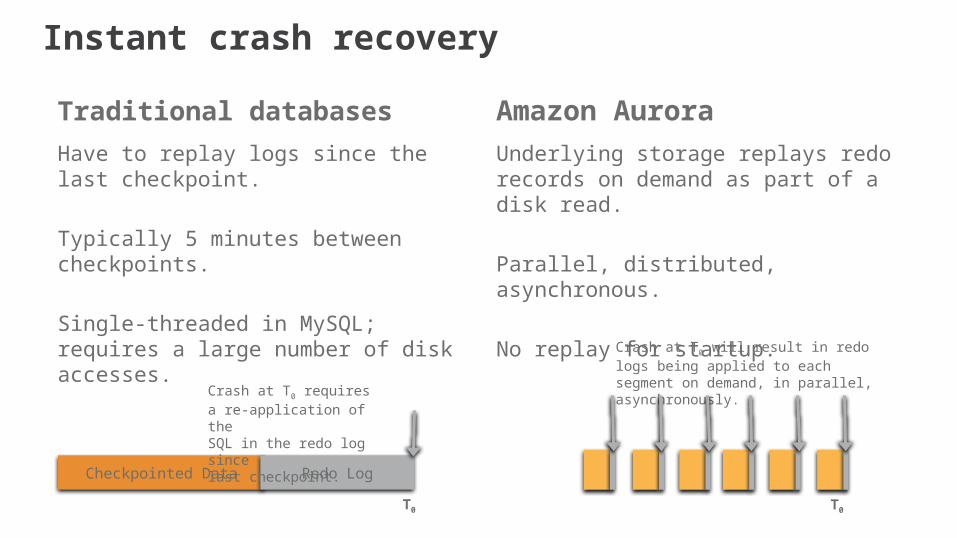
Traditional databasesHave to replay logs since the last checkpoint.
Typically 5 minutes between checkpoints.
Single-threaded in MySQL; requires a large number of disk accesses.
Amazon AuroraUnderlying storage replays redo records on demand as part of a disk read.
Parallel, distributed, asynchronous.
No replay for startup.
Checkpointed Data Redo Log
Crash at T0 requiresa re-application of theSQL in the redo log sincelast checkpoint.
T0 T0
Crash at T0 will result in redo logs being applied to each segment on demand, in parallel, asynchronously.
Instant crash recovery
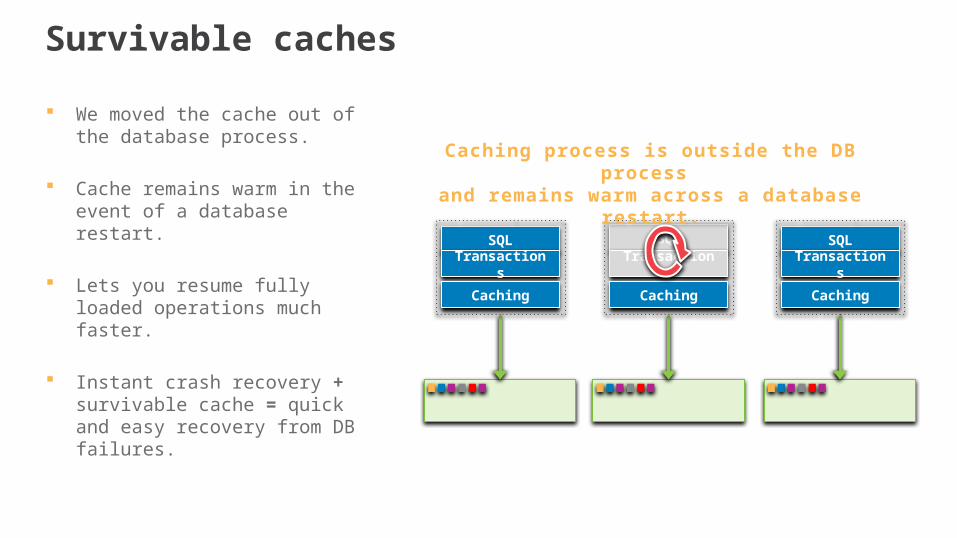
Survivable caches
We moved the cache out of the database process.
Cache remains warm in the event of a database restart.
Lets you resume fully loaded operations much faster.
Instant crash recovery + survivable cache = quick and easy recovery from DB failures.
SQLTransactions
Caching
SQL
Transactions
Caching
SQLTransactions
Caching
Caching process is outside the DB process and remains warm across a database restart.
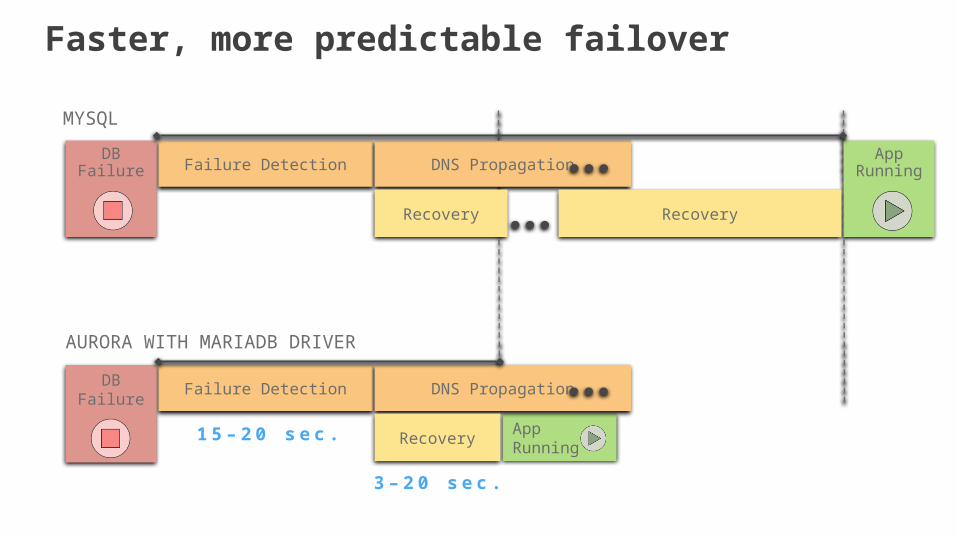
Faster, more predictable failover
AppRunningFailure Detection DNS Propagation
Recovery Recovery
DBFailure
MYSQL
AppRunning
Failure Detection DNS Propagation
Recovery
DBFailure
AURORA WITH MARIADB DRIVER
1 5 – 2 0 s e c .
3 – 2 0 s e c .
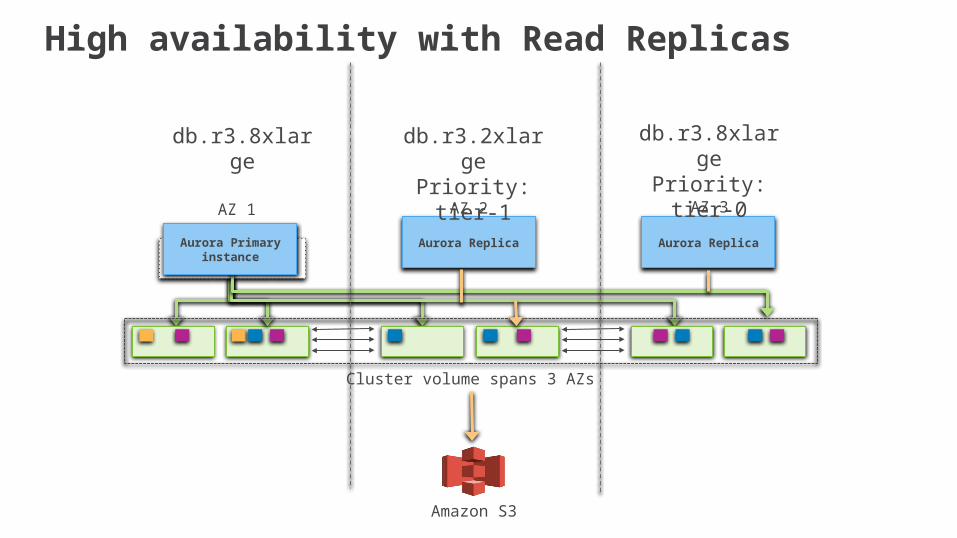
High availability with Read Replicas
Amazon S3
AZ 1 AZ 2 AZ 3
Aurora Primary instance
Cluster volume spans 3 AZs
Aurora Replica Aurora Replica
db.r3.8xlarge db.r3.2xlargePriority: tier-1
db.r3.8xlargePriority: tier-0
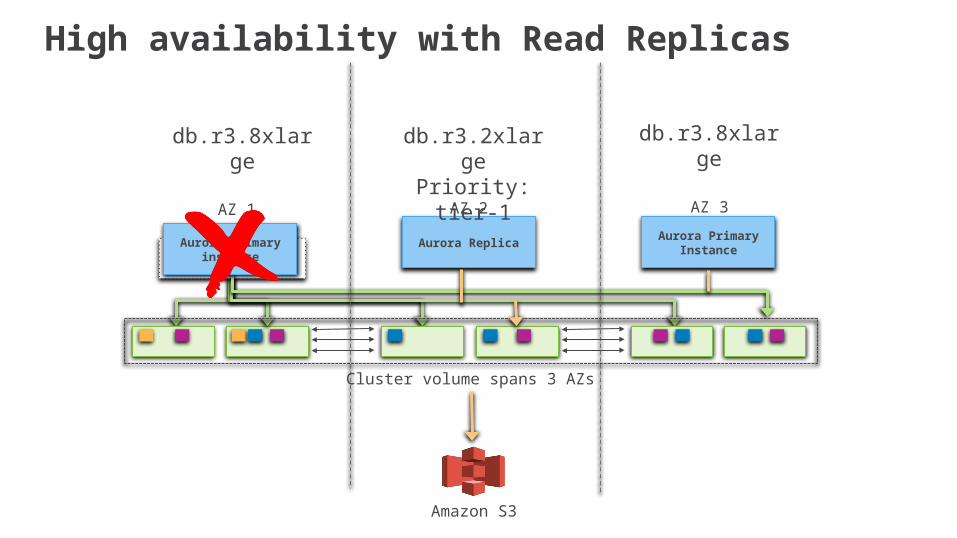
High availability with Read Replicas
Amazon S3
AZ 1 AZ 2 AZ 3
Aurora Primary instance
Cluster volume spans 3 AZs
Aurora Replica Aurora PrimaryInstance
db.r3.8xlarge db.r3.2xlargePriority: tier-1
db.r3.8xlarge
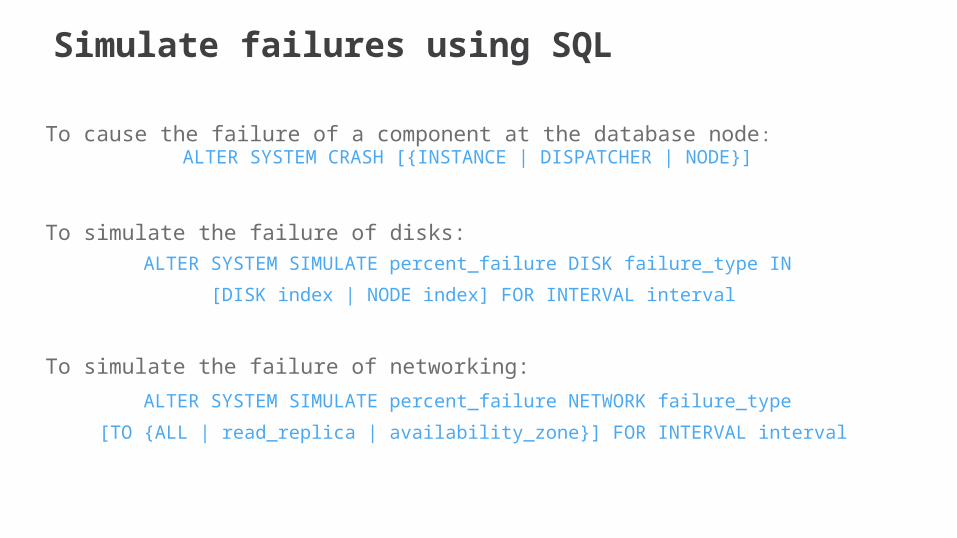
ALTER SYSTEM CRASH [{INSTANCE | DISPATCHER | NODE}]
ALTER SYSTEM SIMULATE percent_failure DISK failure_type IN
[DISK index | NODE index] FOR INTERVAL interval
ALTER SYSTEM SIMULATE percent_failure NETWORK failure_type
[TO {ALL | read_replica | availability_zone}] FOR INTERVAL interval
Simulate failures using SQL
To cause the failure of a component at the database node:
To simulate the failure of disks:
To simulate the failure of networking:

Q & A

Thank you!
Recommended