Carl ZulaufAg. Economist, Ohio State University
Updated: October 3, 2008
2008 FARM BILL: FOCUS ON ACRE (Average Crop Revenue Election)
October 6, 2008, Presented to USDA Economists Group 1 Carl Zulauf, Ohio State University
October 6, 2008 Carl Zulauf, Ohio State University
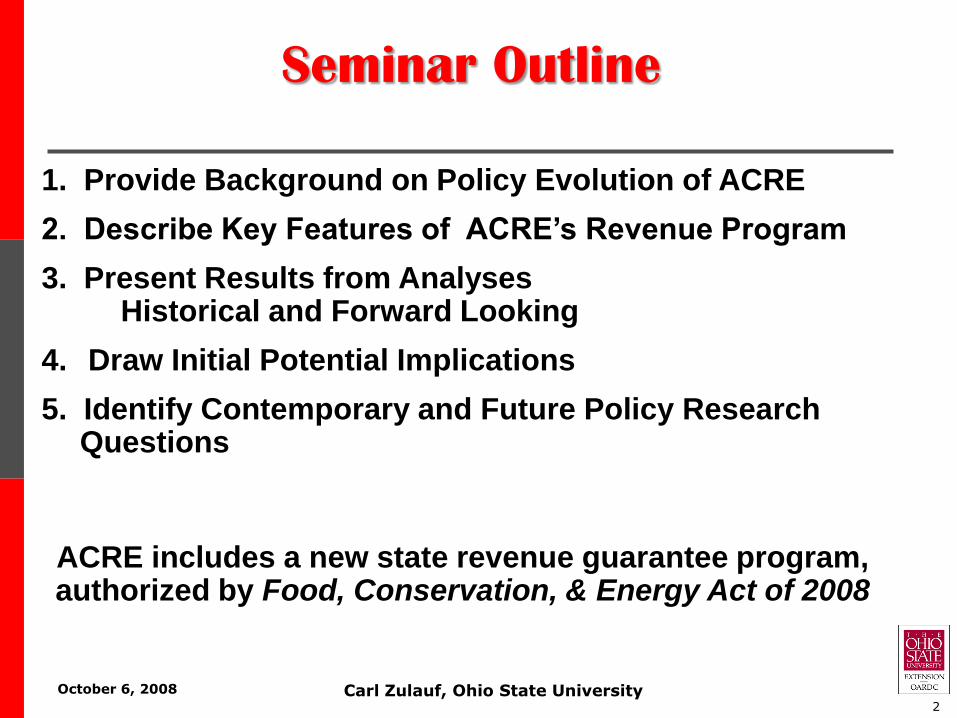
1. Provide Background on Policy Evolution of ACRE
2. Describe Key Features of ACRE’s Revenue Program
3. Present Results from AnalysesHistorical and Forward Looking
4. Draw Initial Potential Implications
5. Identify Contemporary and Future Policy Research Questions
ACRE includes a new state revenue guarantee program, authorized by Food, Conservation, & Energy Act of 2008
Seminar Outline
2
October 6, 2008 Carl Zulauf, Ohio State University
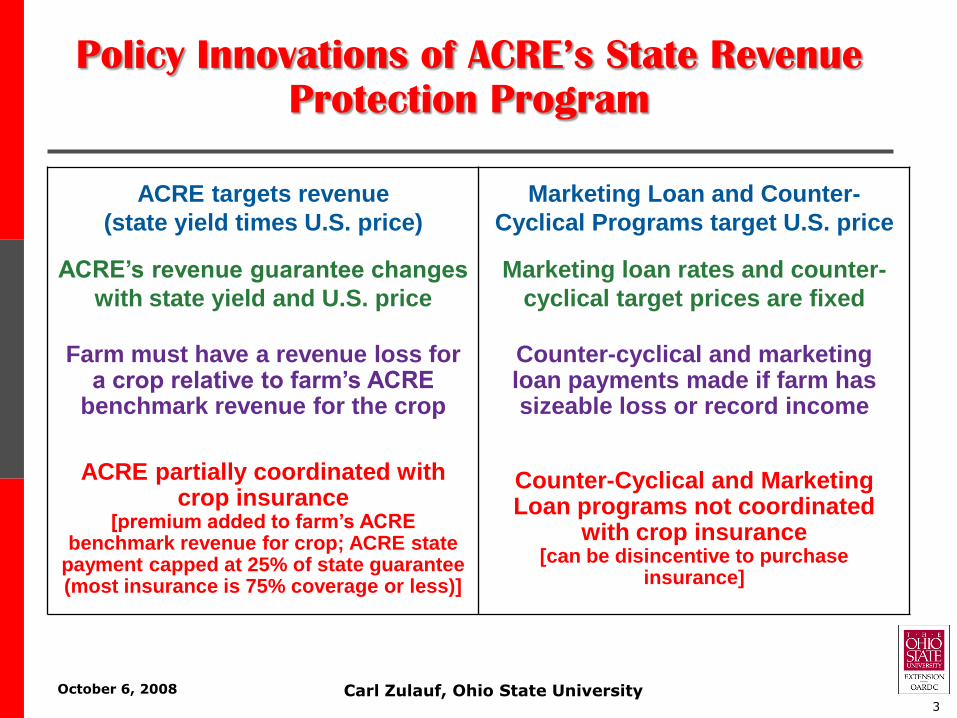
Policy Innovations of ACRE’s State Revenue
Protection Program
3
ACRE targets revenue
(state yield times U.S. price)
Marketing Loan and Counter-
Cyclical Programs target U.S. price
ACRE’s revenue guarantee changes
with state yield and U.S. price
Marketing loan rates and counter-
cyclical target prices are fixed
Farm must have a revenue loss for a crop relative to farm’s ACRE
benchmark revenue for the crop
Counter-cyclical and marketing loan payments made if farm has sizeable loss or record income
ACRE partially coordinated with crop insurance
[premium added to farm’s ACRE benchmark revenue for crop; ACRE state
payment capped at 25% of state guarantee (most insurance is 75% coverage or less)]
Counter-Cyclical and Marketing Loan programs not coordinated
with crop insurance[can be disincentive to purchase
insurance]
October 6, 2008 Carl Zulauf, Ohio State University4
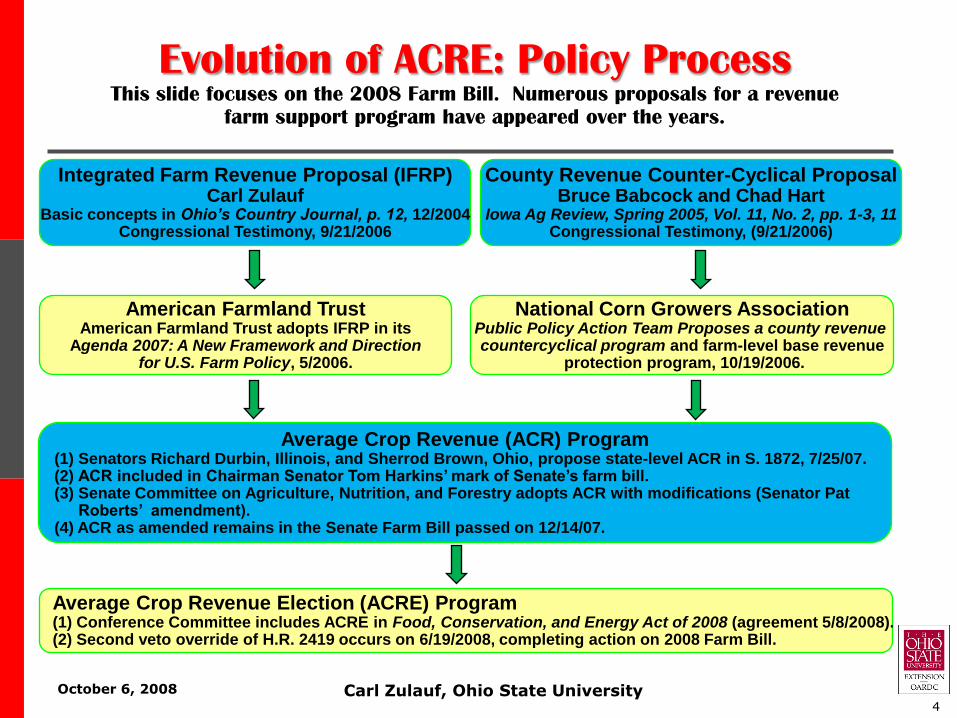
Evolution of ACRE: Policy ProcessThis slide focuses on the 2008 Farm Bill. Numerous proposals for a revenue
farm support program have appeared over the years.
Integrated Farm Revenue Proposal (IFRP)Carl Zulauf
Basic concepts in Ohio’s Country Journal, p. 12, 12/2004Congressional Testimony, 9/21/2006
American Farmland TrustAmerican Farmland Trust adopts IFRP in its
Agenda 2007: A New Framework and Directionfor U.S. Farm Policy, 5/2006.
Average Crop Revenue (ACR) Program(1) Senators Richard Durbin, Illinois, and Sherrod Brown, Ohio, propose state-level ACR in S. 1872, 7/25/07.(2) ACR included in Chairman Senator Tom Harkins’ mark of Senate’s farm bill.(3) Senate Committee on Agriculture, Nutrition, and Forestry adopts ACR with modifications (Senator Pat
Roberts’ amendment).(4) ACR as amended remains in the Senate Farm Bill passed on 12/14/07.
Average Crop Revenue Election (ACRE) Program(1) Conference Committee includes ACRE in Food, Conservation, and Energy Act of 2008 (agreement 5/8/2008).(2) Second veto override of H.R. 2419 occurs on 6/19/2008, completing action on 2008 Farm Bill.
National Corn Growers AssociationPublic Policy Action Team Proposes a county revenue countercyclical program and farm-level base revenue
protection program, 10/19/2006.
County Revenue Counter-Cyclical ProposalBruce Babcock and Chad Hart
Iowa Ag Review, Spring 2005, Vol. 11, No. 2, pp. 1-3, 11Congressional Testimony, (9/21/2006)
October 6, 2008 Carl Zulauf, Ohio State University
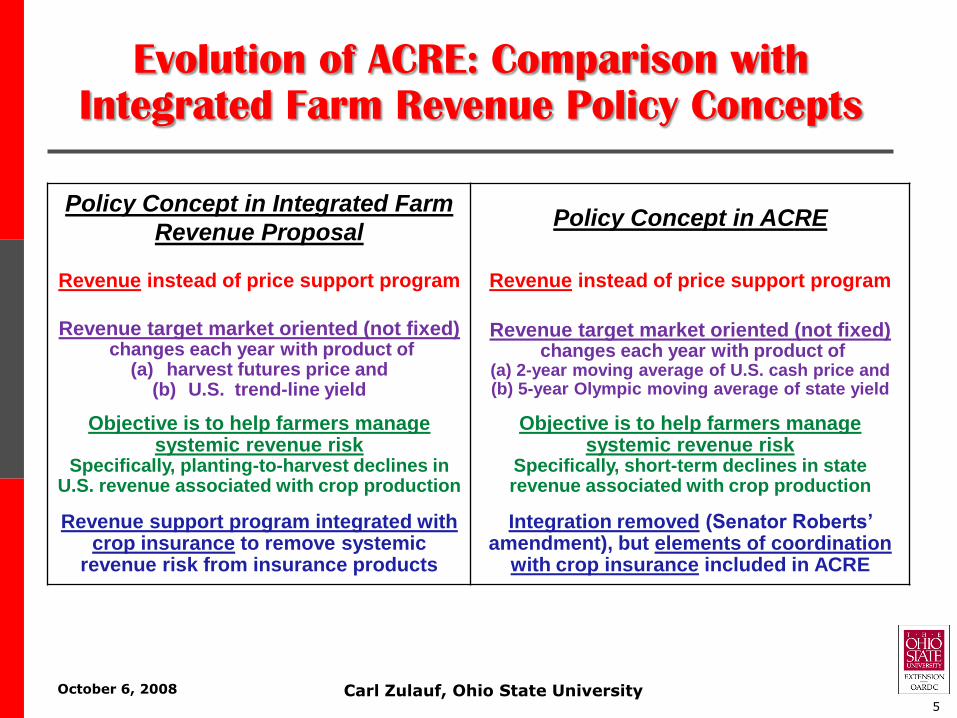
Evolution of ACRE: Comparison with
Integrated Farm Revenue Policy Concepts
5
Policy Concept in Integrated Farm
Revenue ProposalPolicy Concept in ACRE
Revenue instead of price support program Revenue instead of price support program
Revenue target market oriented (not fixed)changes each year with product of
(a) harvest futures price and (b) U.S. trend-line yield
Revenue target market oriented (not fixed)changes each year with product of
(a) 2-year moving average of U.S. cash price and (b) 5-year Olympic moving average of state yield
Objective is to help farmers manage systemic revenue risk
Specifically, planting-to-harvest declines in U.S. revenue associated with crop production
Objective is to help farmers manage systemic revenue risk
Specifically, short-term declines in state revenue associated with crop production
Revenue support program integrated with crop insurance to remove systemic
revenue risk from insurance products
Integration removed (Senator Roberts’ amendment), but elements of coordination
with crop insurance included in ACRE
October 6, 2008 Carl Zulauf, Ohio State University
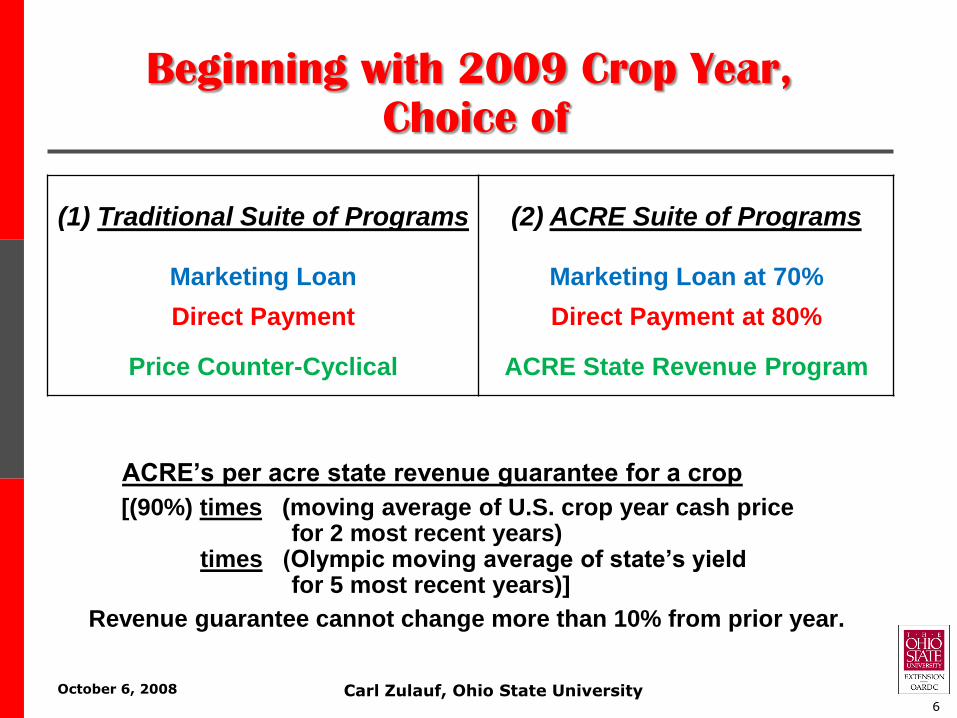
Beginning with 2009 Crop Year,
Choice of
6
(1) Traditional Suite of Programs (2) ACRE Suite of Programs
Marketing Loan Marketing Loan at 70%
Direct Payment Direct Payment at 80%
Price Counter-Cyclical ACRE State Revenue Program
ACRE’s per acre state revenue guarantee for a crop
[(90%) times (moving average of U.S. crop year cash pricefor 2 most recent years)
times (Olympic moving average of state’s yieldfor 5 most recent years)]
Revenue guarantee cannot change more than 10% from prior year.
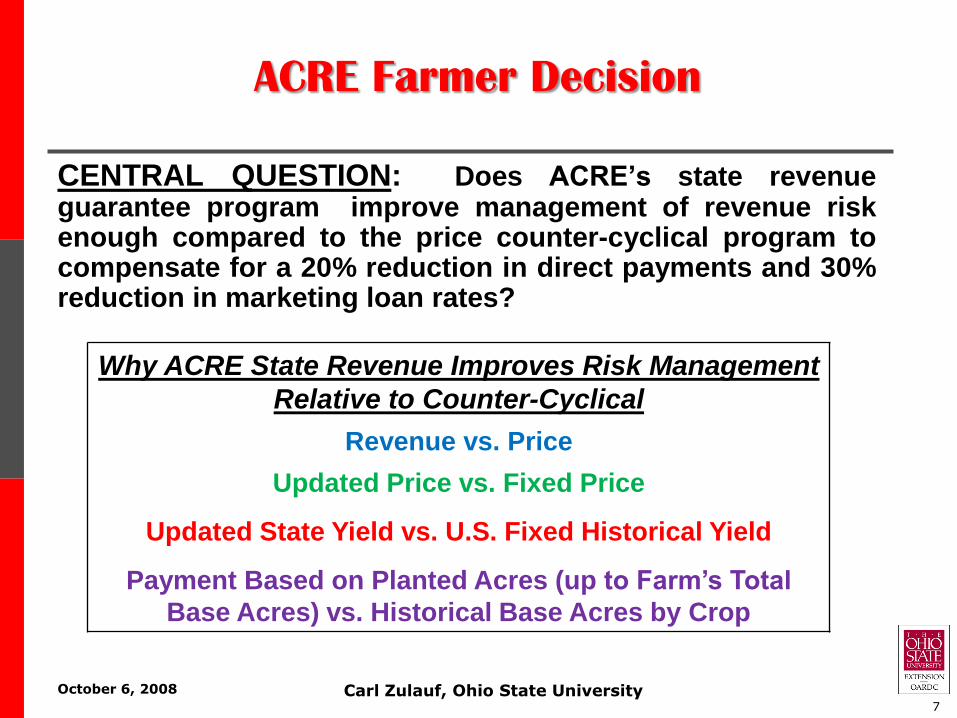
CENTRAL QUESTION: Does ACRE’s state revenueguarantee program improve management of revenue riskenough compared to the price counter-cyclical program tocompensate for a 20% reduction in direct payments and 30%reduction in marketing loan rates?
October 6, 2008 Carl Zulauf, Ohio State University
ACRE Farmer Decision
7
Why ACRE State Revenue Improves Risk Management
Relative to Counter-Cyclical
Revenue vs. Price
Updated Price vs. Fixed Price
Updated State Yield vs. U.S. Fixed Historical Yield
Payment Based on Planted Acres (up to Farm’s Total
Base Acres) vs. Historical Base Acres by Crop
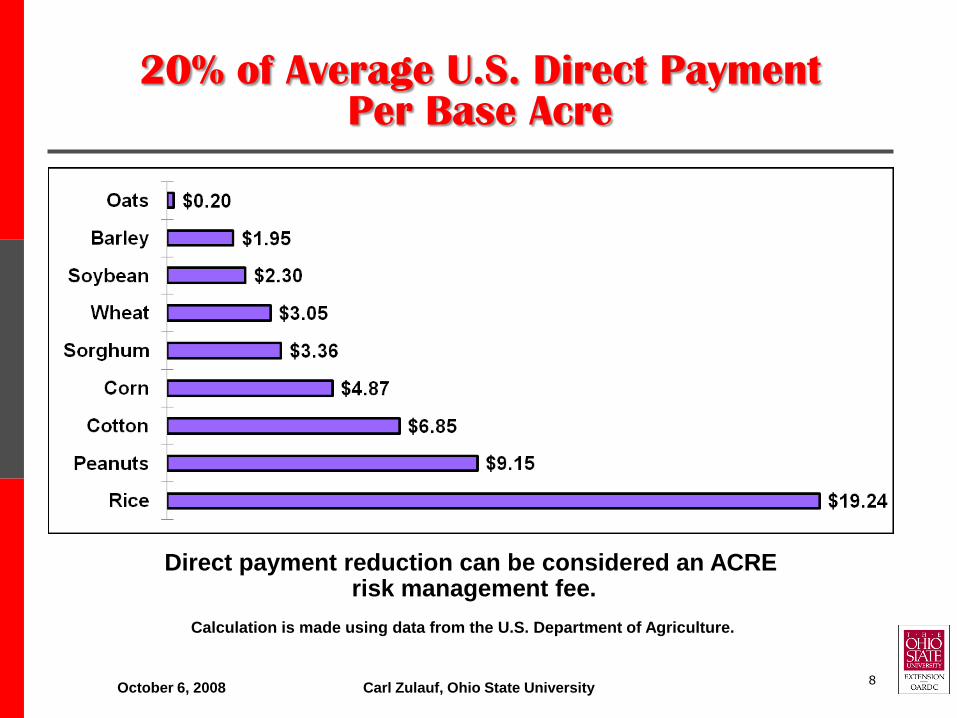
20% of Average U.S. Direct PaymentPer Base Acre
October 6, 2008 Carl Zulauf, Ohio State University
Direct payment reduction can be considered an ACRErisk management fee.
Calculation is made using data from the U.S. Department of Agriculture.
8
October 6, 2008 Carl Zulauf, Ohio State University
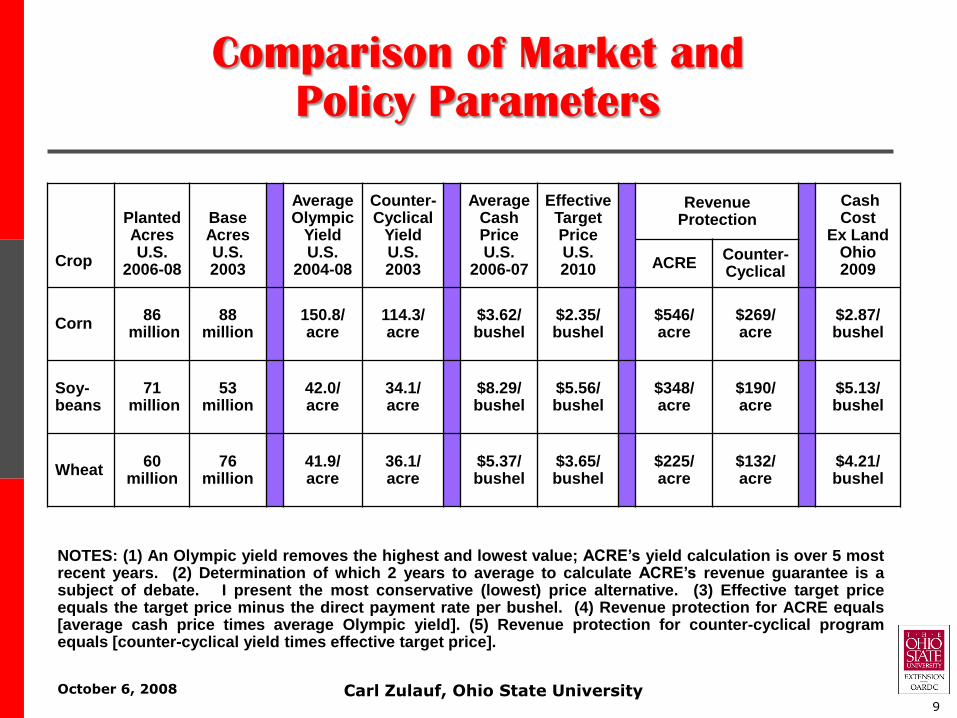
Comparison of Market and
Policy Parameters
9
Crop
PlantedAcresU.S.
2006-08
BaseAcresU.S.2003
AverageOlympic
YieldU.S.
2004-08
Counter-Cyclical
YieldU.S.2003
AverageCash PriceU.S.
2006-07
Effective Target PriceU.S.2010
RevenueProtection
Cash Cost
Ex Land Ohio2009ACRE
Counter-Cyclical
Corn86
million88
million150.8/acre
114.3/acre
$3.62/bushel
$2.35/bushel
$546/acre
$269/acre
$2.87/bushel
Soy-beans
71million
53 million
42.0/acre
34.1/acre
$8.29/bushel
$5.56/bushel
$348/acre
$190/acre
$5.13/bushel
Wheat60
million76
million41.9/acre
36.1/acre
$5.37/bushel
$3.65/bushel
$225/acre
$132/acre
$4.21/bushel
NOTES: (1) An Olympic yield removes the highest and lowest value; ACRE’s yield calculation is over 5 mostrecent years. (2) Determination of which 2 years to average to calculate ACRE’s revenue guarantee is asubject of debate. I present the most conservative (lowest) price alternative. (3) Effective target priceequals the target price minus the direct payment rate per bushel. (4) Revenue protection for ACRE equals[average cash price times average Olympic yield]. (5) Revenue protection for counter-cyclical programequals [counter-cyclical yield times effective target price].
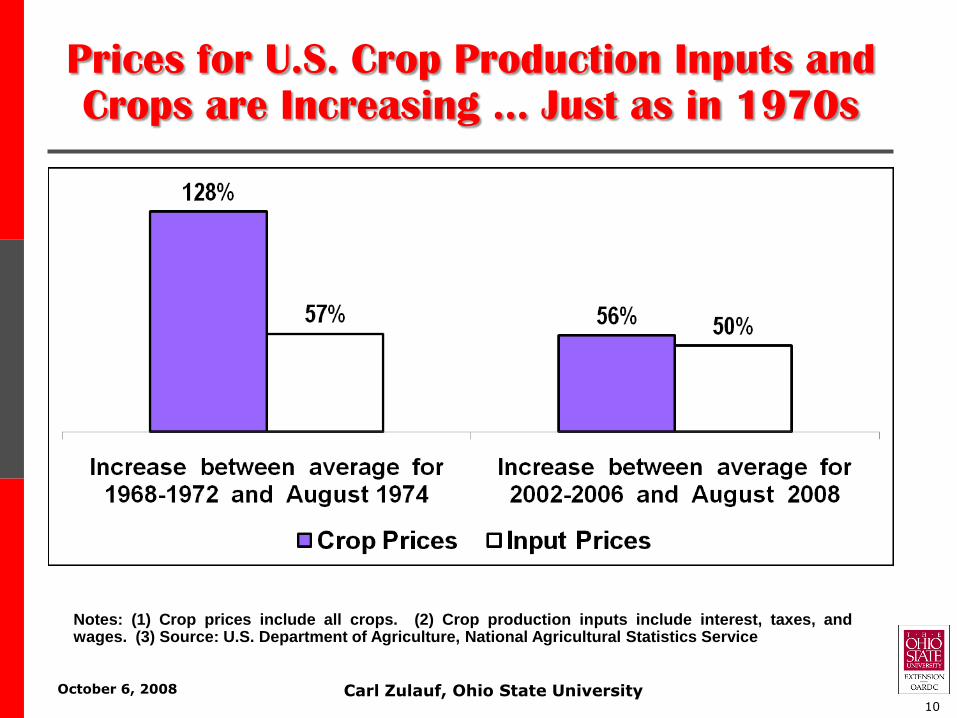
October 6, 2008 Carl Zulauf, Ohio State University10
Notes: (1) Crop prices include all crops. (2) Crop production inputs include interest, taxes, andwages. (3) Source: U.S. Department of Agriculture, National Agricultural Statistics Service
Prices for U.S. Crop Production Inputs and
Crops are Increasing … Just as in 1970s
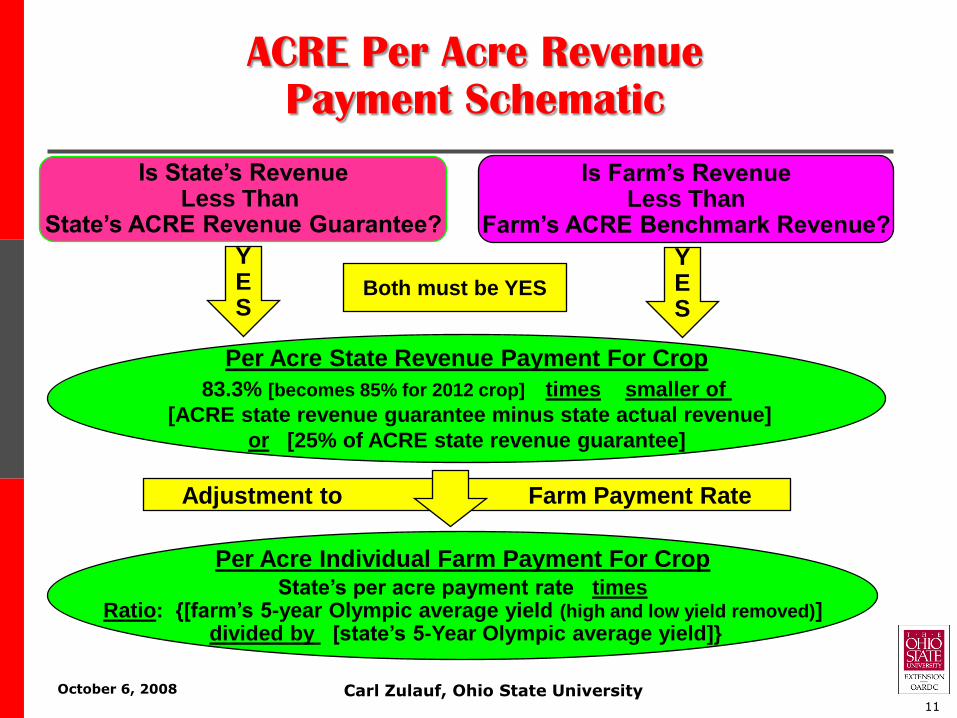
October 6, 2008 Carl Zulauf, Ohio State University11
ACRE Per Acre Revenue
Payment Schematic
Is Farm’s RevenueLess Than
Farm’s ACRE Benchmark Revenue?
Is State’s RevenueLess Than
State’s ACRE Revenue Guarantee?
YES
YES
Both must be YES
Per Acre State Revenue Payment For Crop
83.3% [becomes 85% for 2012 crop] times smaller of
[ACRE state revenue guarantee minus state actual revenue]
or [25% of ACRE state revenue guarantee]
Per Acre Individual Farm Payment For CropState’s per acre payment rate times
Ratio: {[farm’s 5-year Olympic average yield (high and low yield removed)]divided by [state’s 5-Year Olympic average yield]}
Adjustment to Farm Payment Rate
October 6, 2008 Carl Zulauf, Ohio State University12
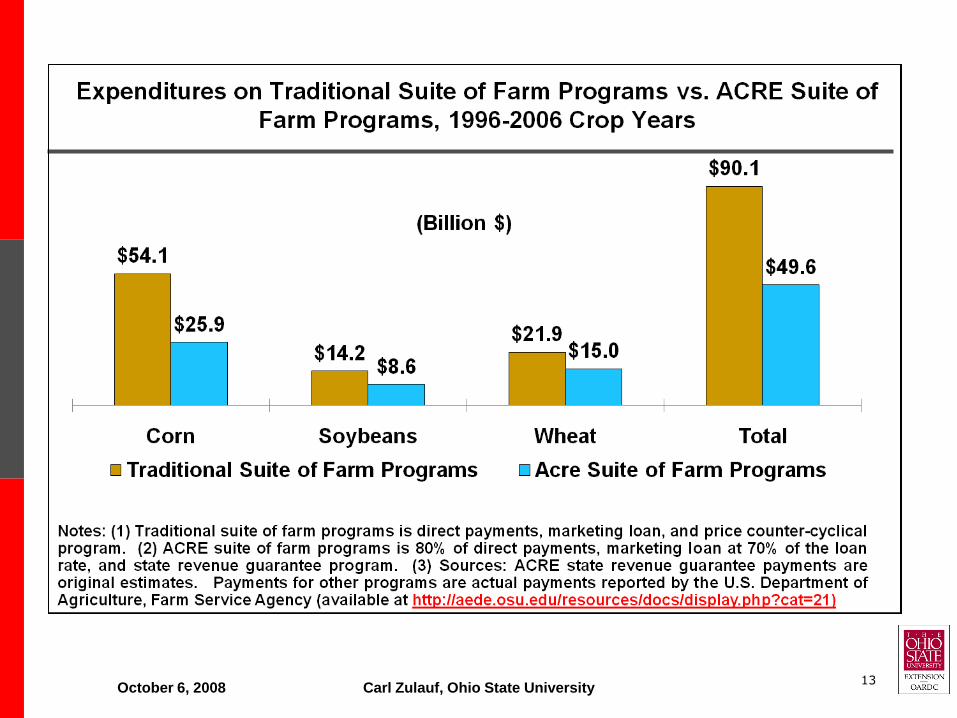
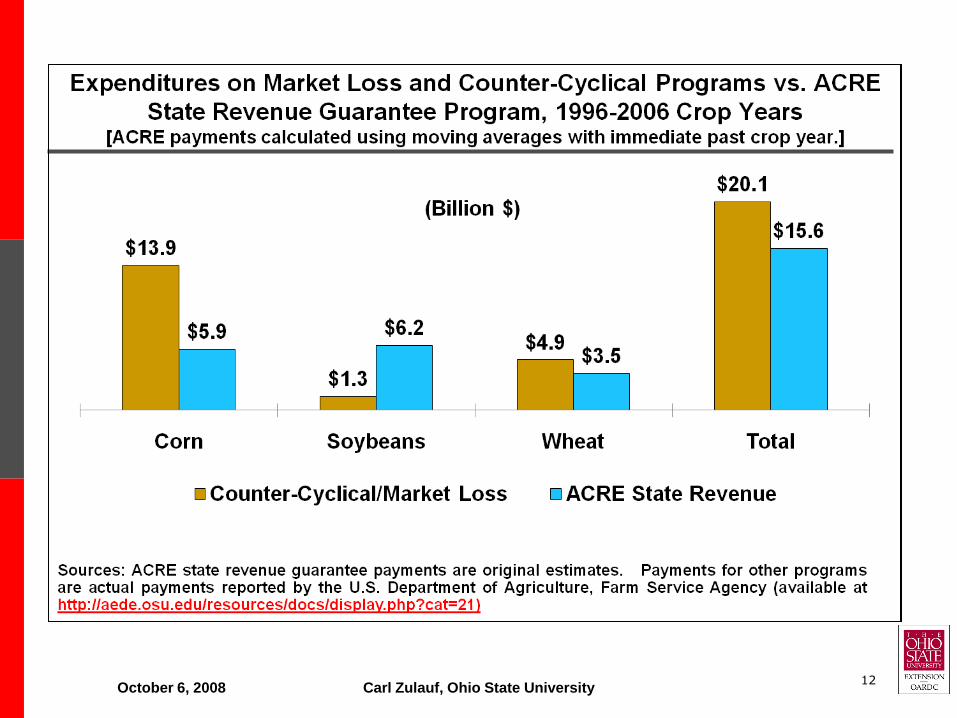
October 6, 2008 Carl Zulauf, Ohio State University13
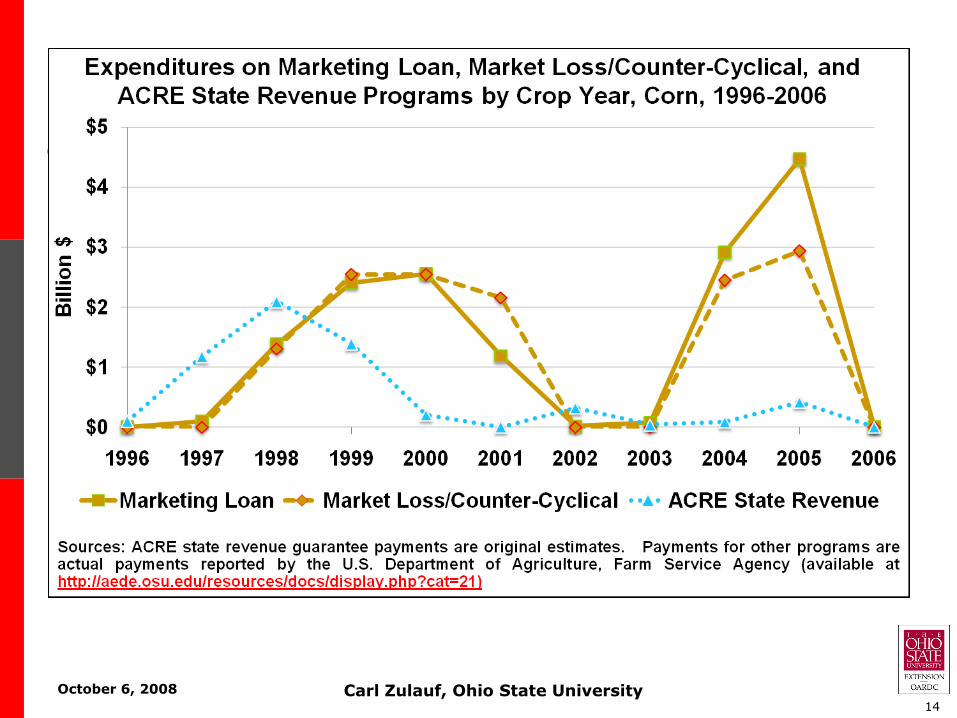
October 6, 2008 Carl Zulauf, Ohio State University14
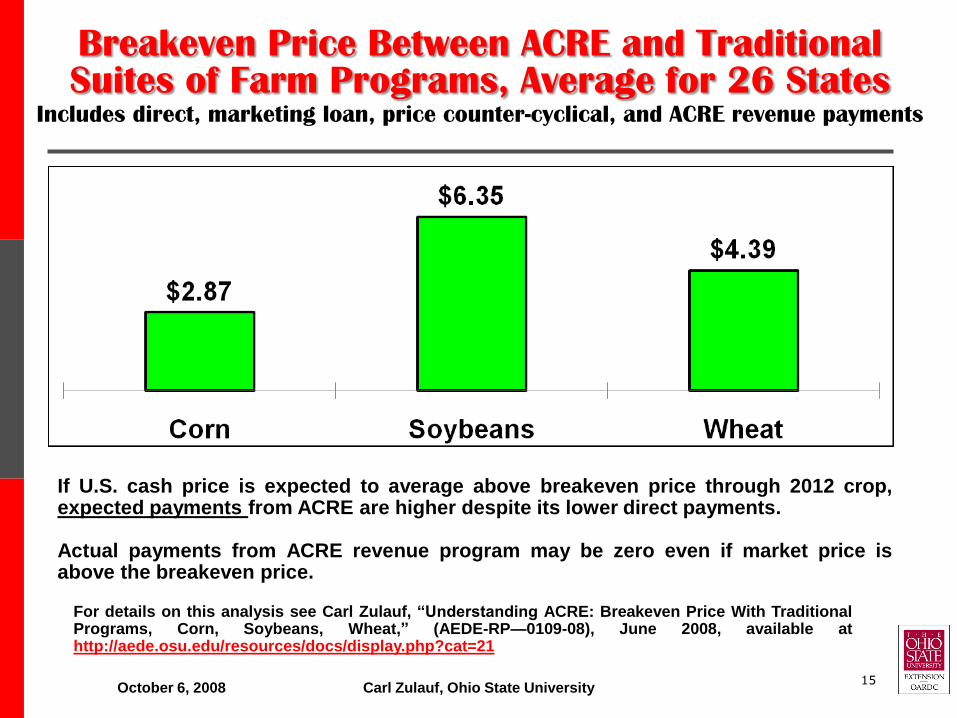
Breakeven Price Between ACRE and Traditional Suites of Farm Programs, Average for 26 States
Includes direct, marketing loan, price counter-cyclical, and ACRE revenue payments
October 6, 2008 Carl Zulauf, Ohio State University
If U.S. cash price is expected to average above breakeven price through 2012 crop,expected payments from ACRE are higher despite its lower direct payments.
Actual payments from ACRE revenue program may be zero even if market price isabove the breakeven price.
For details on this analysis see Carl Zulauf, “Understanding ACRE: Breakeven Price With TraditionalPrograms, Corn, Soybeans, Wheat,” (AEDE-RP—0109-08), June 2008, available athttp://aede.osu.edu/resources/docs/display.php?cat=21
15
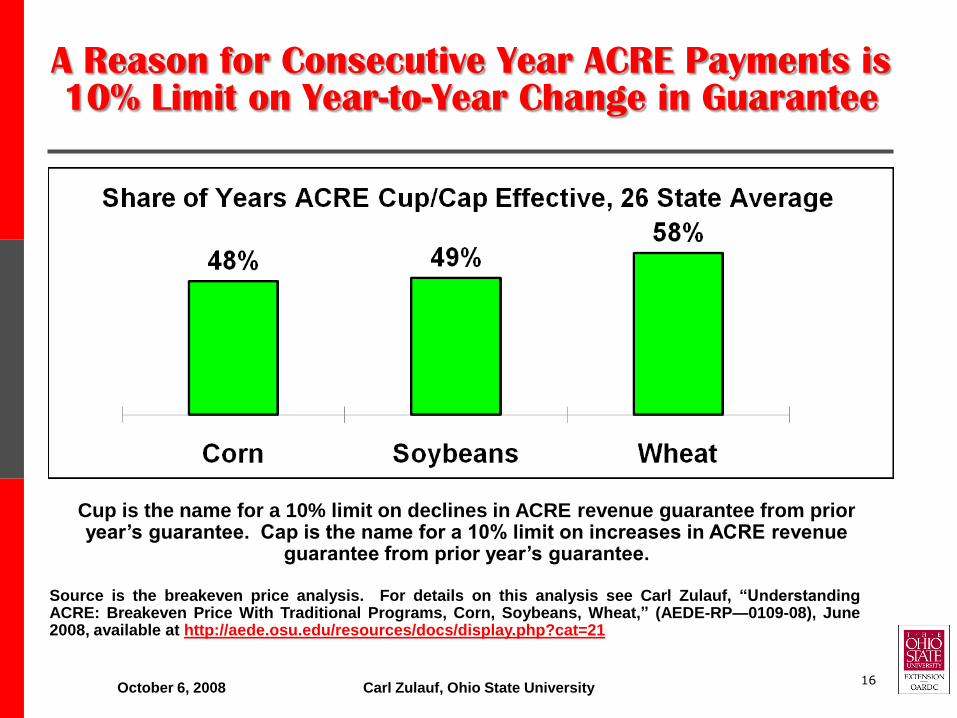
A Reason for Consecutive Year ACRE Payments is 10% Limit on Year-to-Year Change in Guarantee
October 6, 2008 Carl Zulauf, Ohio State University
Source is the breakeven price analysis. For details on this analysis see Carl Zulauf, “UnderstandingACRE: Breakeven Price With Traditional Programs, Corn, Soybeans, Wheat,” (AEDE-RP—0109-08), June2008, available at http://aede.osu.edu/resources/docs/display.php?cat=21
Cup is the name for a 10% limit on declines in ACRE revenue guarantee from prior year’s guarantee. Cap is the name for a 10% limit on increases in ACRE revenue
guarantee from prior year’s guarantee.
16
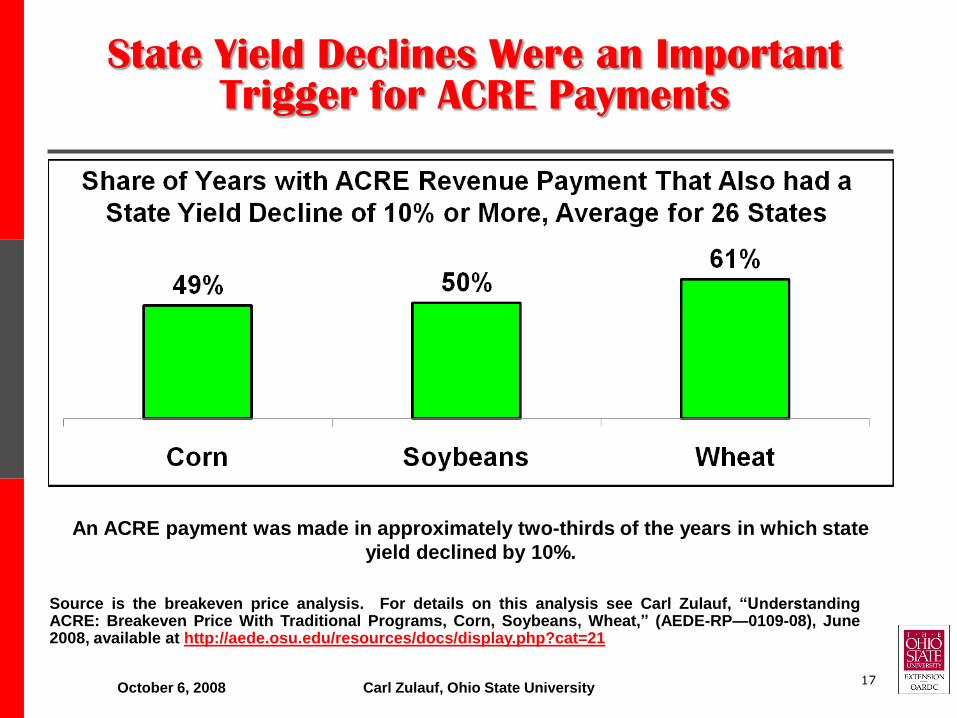
State Yield Declines Were an Important Trigger for ACRE Payments
October 6, 2008 Carl Zulauf, Ohio State University
Source is the breakeven price analysis. For details on this analysis see Carl Zulauf, “UnderstandingACRE: Breakeven Price With Traditional Programs, Corn, Soybeans, Wheat,” (AEDE-RP—0109-08), June2008, available at http://aede.osu.edu/resources/docs/display.php?cat=21
An ACRE payment was made in approximately two-thirds of the years in which state
yield declined by 10%.
17
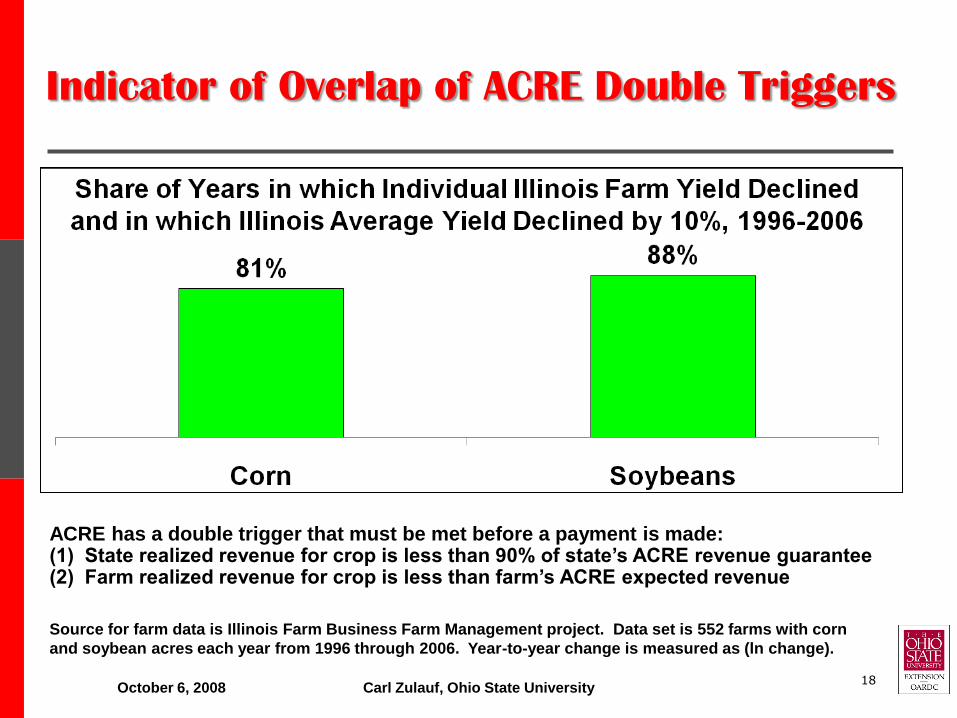
Indicator of Overlap of ACRE Double Triggers
October 6, 2008 Carl Zulauf, Ohio State University
Source for farm data is Illinois Farm Business Farm Management project. Data set is 552 farms with corn
and soybean acres each year from 1996 through 2006. Year-to-year change is measured as (ln change).
18
ACRE has a double trigger that must be met before a payment is made:(1) State realized revenue for crop is less than 90% of state’s ACRE revenue guarantee(2) Farm realized revenue for crop is less than farm’s ACRE expected revenue
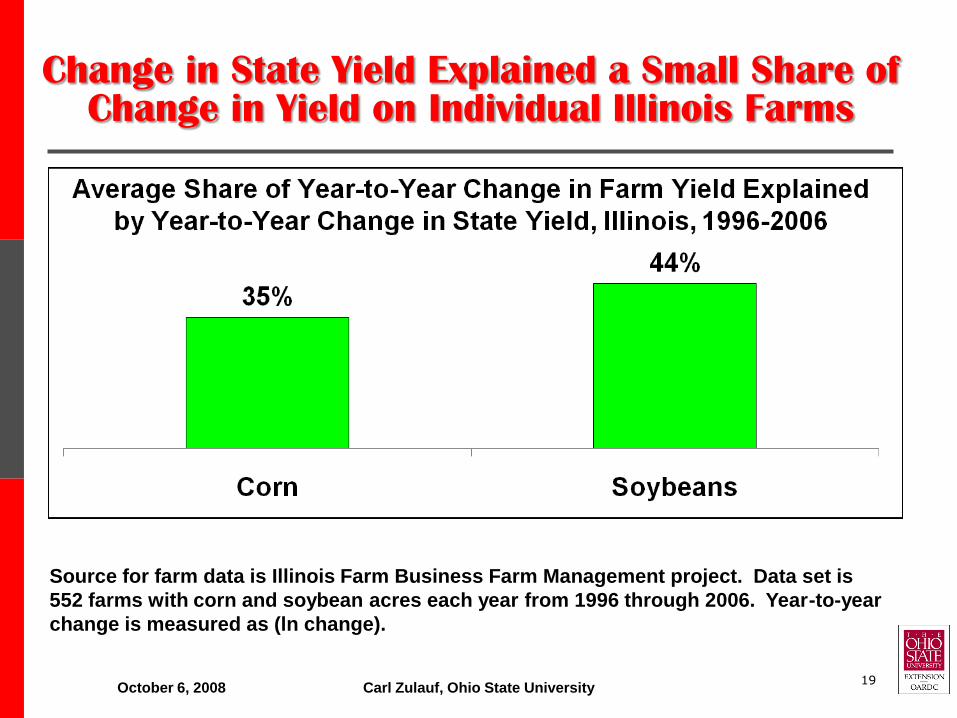
Change in State Yield Explained a Small Share of Change in Yield on Individual Illinois Farms
October 6, 2008 Carl Zulauf, Ohio State University
Source for farm data is Illinois Farm Business Farm Management project. Data set is
552 farms with corn and soybean acres each year from 1996 through 2006. Year-to-year
change is measured as (ln change).
19
October 6, 2008 Carl Zulauf, Ohio State University
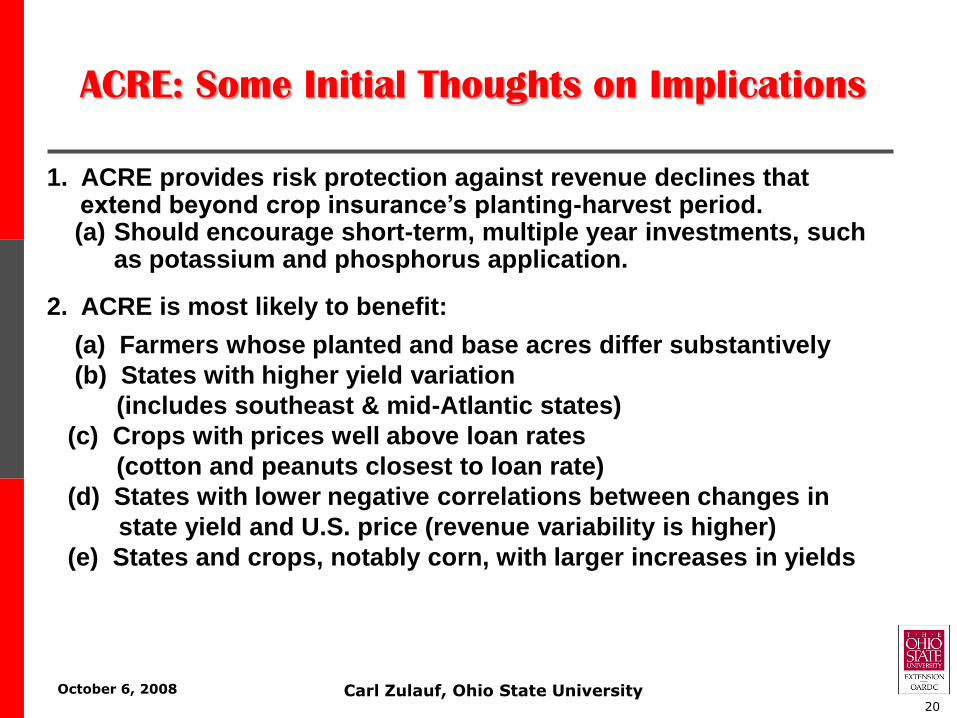
1. ACRE provides risk protection against revenue declines that extend beyond crop insurance’s planting-harvest period.(a) Should encourage short-term, multiple year investments, such
as potassium and phosphorus application.
2. ACRE is most likely to benefit:
(a) Farmers whose planted and base acres differ substantively
(b) States with higher yield variation
(includes southeast & mid-Atlantic states)
(c) Crops with prices well above loan rates
(cotton and peanuts closest to loan rate)
(d) States with lower negative correlations between changes in
state yield and U.S. price (revenue variability is higher)
(e) States and crops, notably corn, with larger increases in yields
ACRE: Some Initial Thoughts on Implications
20
October 6, 2008 Carl Zulauf, Ohio State University
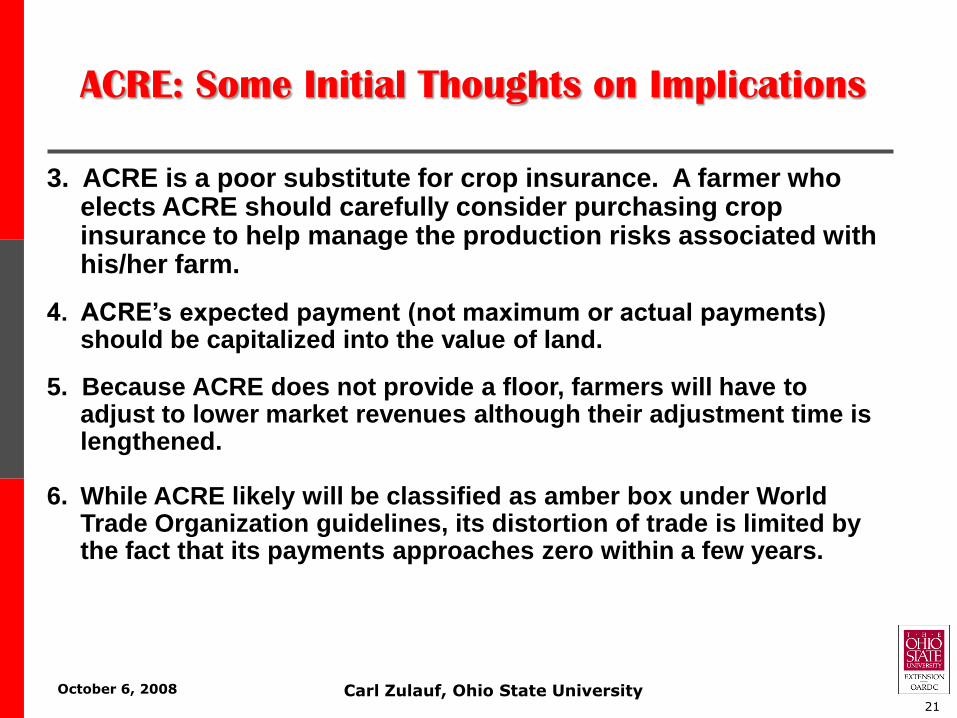
3. ACRE is a poor substitute for crop insurance. A farmer who elects ACRE should carefully consider purchasing crop insurance to help manage the production risks associated with his/her farm.
4. ACRE’s expected payment (not maximum or actual payments) should be capitalized into the value of land.
5. Because ACRE does not provide a floor, farmers will have to adjust to lower market revenues although their adjustment time is lengthened.
6. While ACRE likely will be classified as amber box under World Trade Organization guidelines, its distortion of trade is limited by the fact that its payments approaches zero within a few years.
ACRE: Some Initial Thoughts on Implications
21
October 6, 2008 Carl Zulauf, Ohio State University
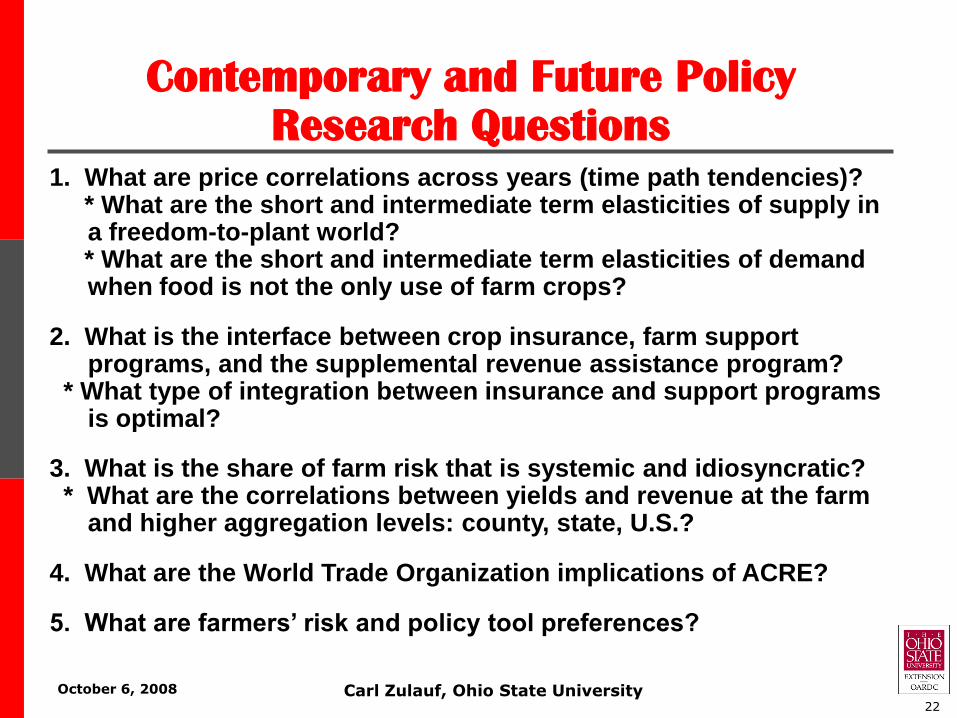
1. What are price correlations across years (time path tendencies)?* What are the short and intermediate term elasticities of supply in a freedom-to-plant world? * What are the short and intermediate term elasticities of demand when food is not the only use of farm crops?
2. What is the interface between crop insurance, farm support programs, and the supplemental revenue assistance program?
* What type of integration between insurance and support programs is optimal?
3. What is the share of farm risk that is systemic and idiosyncratic?* What are the correlations between yields and revenue at the farm
and higher aggregation levels: county, state, U.S.?
4. What are the World Trade Organization implications of ACRE?
5. What are farmers’ risk and policy tool preferences?
22
Contemporary and Future Policy
Research Questions
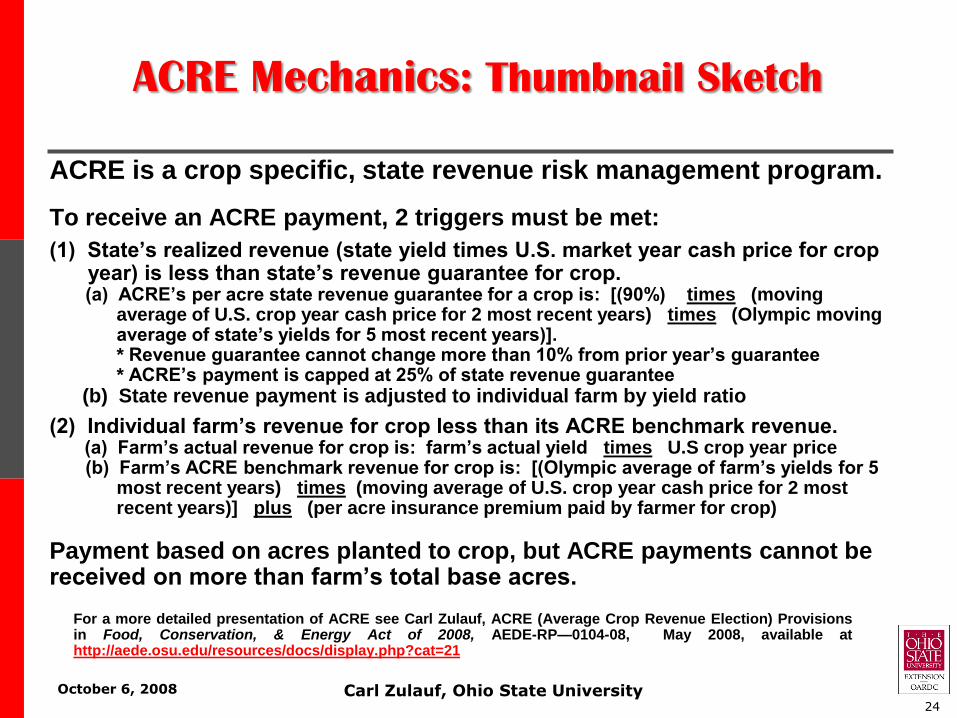
ACRE is a crop specific, state revenue risk management program.
To receive an ACRE payment, 2 triggers must be met:
(1) State’s realized revenue (state yield times U.S. market year cash price for crop year) is less than state’s revenue guarantee for crop.(a) ACRE’s per acre state revenue guarantee for a crop is: [(90%) times (moving
average of U.S. crop year cash price for 2 most recent years) times (Olympic moving average of state’s yields for 5 most recent years)].* Revenue guarantee cannot change more than 10% from prior year’s guarantee* ACRE’s payment is capped at 25% of state revenue guarantee
(b) State revenue payment is adjusted to individual farm by yield ratio
(2) Individual farm’s revenue for crop less than its ACRE benchmark revenue.(a) Farm’s actual revenue for crop is: farm’s actual yield times U.S crop year price(b) Farm’s ACRE benchmark revenue for crop is: [(Olympic average of farm’s yields for 5
most recent years) times (moving average of U.S. crop year cash price for 2 most recent years)] plus (per acre insurance premium paid by farmer for crop)
Payment based on acres planted to crop, but ACRE payments cannot be received on more than farm’s total base acres.
October 6, 2008 Carl Zulauf, Ohio State University
ACRE Mechanics: Thumbnail Sketch
For a more detailed presentation of ACRE see Carl Zulauf, ACRE (Average Crop Revenue Election) Provisionsin Food, Conservation, & Energy Act of 2008, AEDE-RP—0104-08, May 2008, available athttp://aede.osu.edu/resources/docs/display.php?cat=21
24
October 6, 2008 Carl Zulauf, Ohio State University
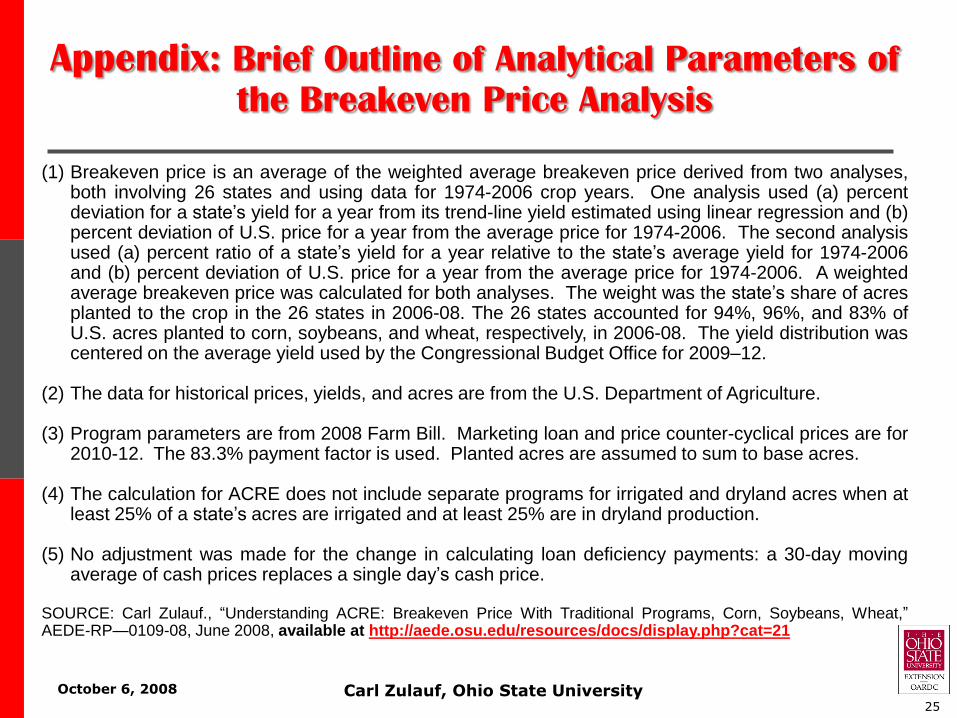
(1) Breakeven price is an average of the weighted average breakeven price derived from two analyses,both involving 26 states and using data for 1974-2006 crop years. One analysis used (a) percentdeviation for a state’s yield for a year from its trend-line yield estimated using linear regression and (b)percent deviation of U.S. price for a year from the average price for 1974-2006. The second analysisused (a) percent ratio of a state’s yield for a year relative to the state’s average yield for 1974-2006and (b) percent deviation of U.S. price for a year from the average price for 1974-2006. A weightedaverage breakeven price was calculated for both analyses. The weight was the state’s share of acresplanted to the crop in the 26 states in 2006-08. The 26 states accounted for 94%, 96%, and 83% ofU.S. acres planted to corn, soybeans, and wheat, respectively, in 2006-08. The yield distribution wascentered on the average yield used by the Congressional Budget Office for 2009–12.
(2) The data for historical prices, yields, and acres are from the U.S. Department of Agriculture.
(3) Program parameters are from 2008 Farm Bill. Marketing loan and price counter-cyclical prices are for2010-12. The 83.3% payment factor is used. Planted acres are assumed to sum to base acres.
(4) The calculation for ACRE does not include separate programs for irrigated and dryland acres when atleast 25% of a state’s acres are irrigated and at least 25% are in dryland production.
(5) No adjustment was made for the change in calculating loan deficiency payments: a 30-day movingaverage of cash prices replaces a single day’s cash price.
SOURCE: Carl Zulauf., ―Understanding ACRE: Breakeven Price With Traditional Programs, Corn, Soybeans, Wheat,‖AEDE-RP—0109-08, June 2008, available at http://aede.osu.edu/resources/docs/display.php?cat=21
Appendix: Brief Outline of Analytical Parameters of
the Breakeven Price Analysis
25
Recommended