AUTOMOTIVE
BEAUTY
COMMERCIAL TECHNOLOGY
CONSUMER TECHNOLOGY
ENTERTAINMENT
FASHION
FOOD & BEVERAGE
FOODSERVICE
HOME
OFFICE SUPPLIES
SOFTWARE
SPORTS
TOYS
WIRELESS
1
Top Line Report on the In-Home Potato Market
Prepared by: The NPD Group’s National Eating Trends®
March 2009
Copyright 2007. The NPD Group, Inc. All Rights Reserved. This presentation is Proprietary and Confidential and may not be disclosed in any manner, in whole or in part, to any third party without the express written consent of NPD.
2Proprietary and Confidential
Topline Summary
Consumption of Potatoes in-home has remained fairly stable over the last 5 years, with 79% of individuals consuming Potatoes at least once in an average two-week period. While things have been stable in recent years, it is worth noting that consumption is down notably compared to 10+ years ago.
Mashed continues to be the dominant type of Potato consumed. When it comes to form, fresh is still #1 but consumption of this key form is the lowest it has been in 15 years. Frozen, which had recently been displaying small growth year-over-year, took a small downturn in 2008.
Dinner meals with “Center of the Plate” protein continue to be quite stable. Poultry is the largest of the Proteins at these meals, followed by Beef. Additionally, Seafood consumption is currently at a a 10 year high!
Despite the stability of protein’s presence at dinner, Potato’s presence at these protein dinner meals continues to decline. Among the 4 proteins examined, Potatoes are most likely to be present alongside Beef and Pork/Ham.
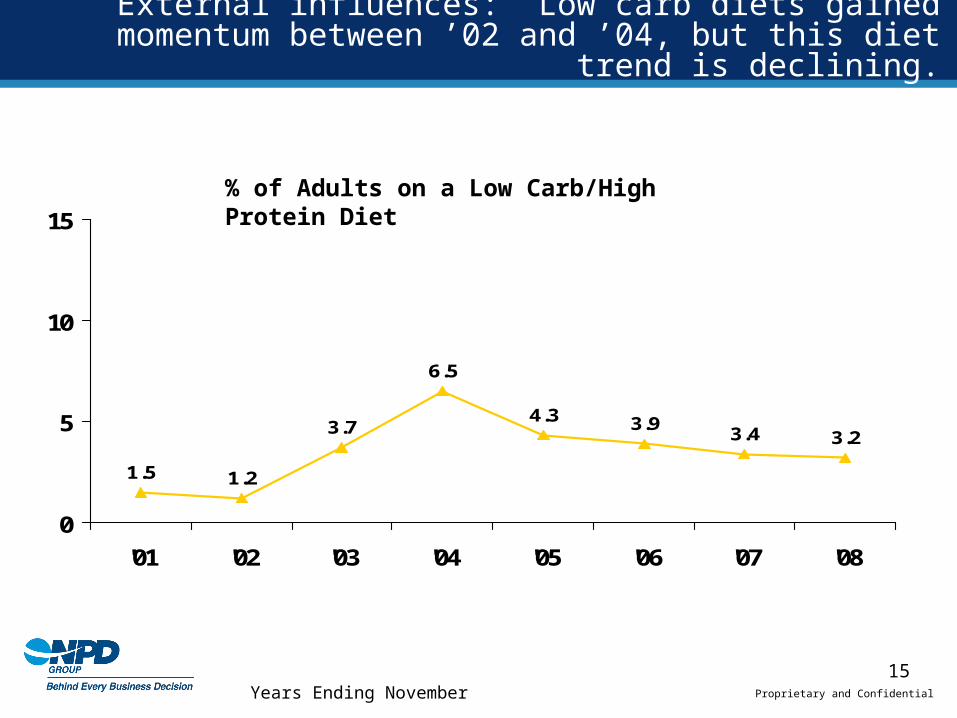
The percent of adults reporting they are on a Low Carb/High Protein diet declined for the 4th year in a row.
Diet status is much more likely to negatively influence the consumption of Potato Chips than Potatoes. In fact, adults who report being on a Diabetic/Low Sugar and/or Low Sodium diet consume Potatoes at an above average rate.
3Proprietary and Confidential
Methodology
This study examines trends in in-home potato consumption trends. Data is collected from a balanced panel of 2000 households, who report all foods and beverages consumed by all individuals during an average two-week period via a paper diary.
– In-Home includes all foods and beverages prepared and/or consumed in the home. Includes carried meals, ie. ‘brown bag lunches’.
Please note that the data is measured as an “eating” and does not attempt to measure actual volume consumed.
Panel is balanced to the U.S. Census on key demographic variables and is distributed evenly throughout the year so that all seasons are represented equally.
4Proprietary and Confidential
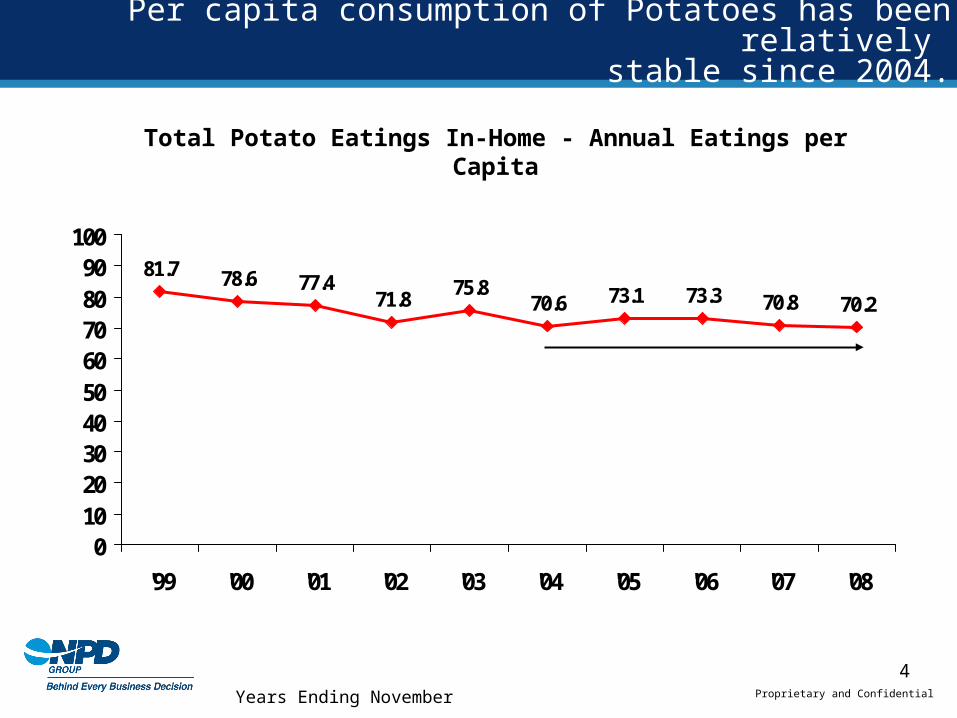
81.7 78.6 77.471.8
75.870.6 73.1 73.3 70.8 70.2
0102030405060708090
100
'99 '00 '01 '02 '03 '04 '05 '06 '07 '08
Total Potato Eatings In-Home - Annual Eatings per Capita
Years Ending November
Per capita consumption of Potatoes has been relatively stable since 2004.
5Proprietary and Confidential
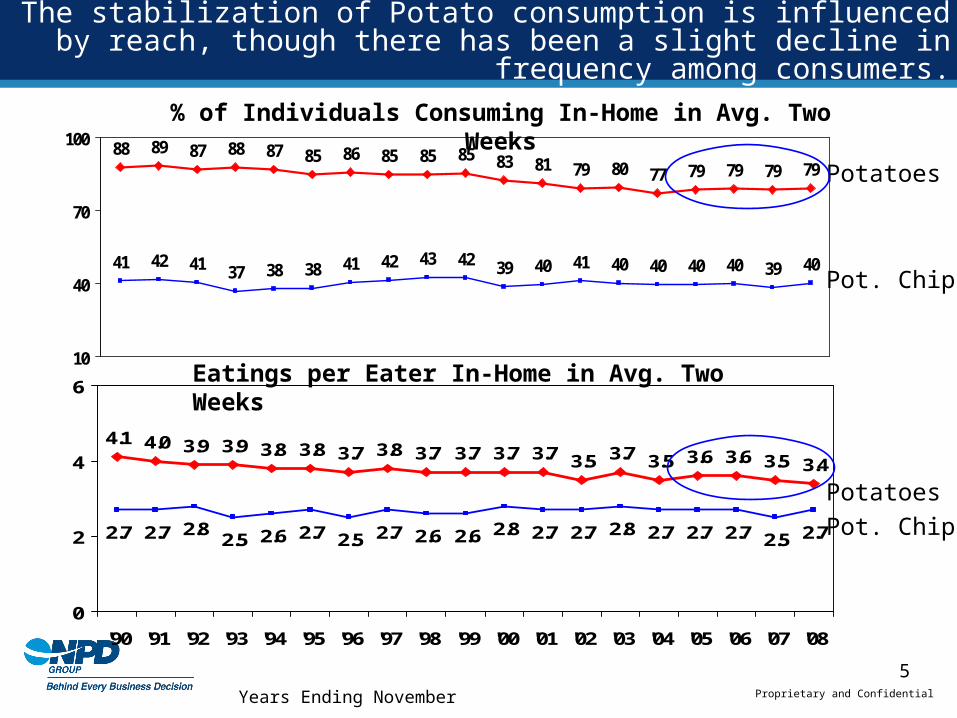
The stabilization of Potato consumption is influenced by reach, though there has been a slight decline in frequency among consumers.
88 89 87 88 87 85 86 85 85 85 83 81 79 80 77 79 79 79 79
41 42 41 37 38 38 41 42 43 42 39 40 41 40 40 40 40 39 40
10
40
70
100% of Individuals Consuming In-Home in Avg. Two Weeks
4.1 4.0 3.9 3.9 3.8 3.8 3.7 3.8 3.7 3.7 3.7 3.7 3.5 3.7 3.5 3.6 3.6 3.5 3.4
2.7 2.7 2.82.5 2.6 2.7 2.5 2.7 2.6 2.6 2.8 2.7 2.7 2.8 2.7 2.7 2.7 2.5 2.7
0
2
4
6
'90 '91 '92 '93 '94 '95 '96 '97 '98 '99 '00 '01 '02 '03 '04 '05 '06 '07 '08
Potatoes
Pot. Chips
Potatoes
Pot. Chips
Eatings per Eater In-Home in Avg. Two Weeks
Years Ending November
6Proprietary and Confidential
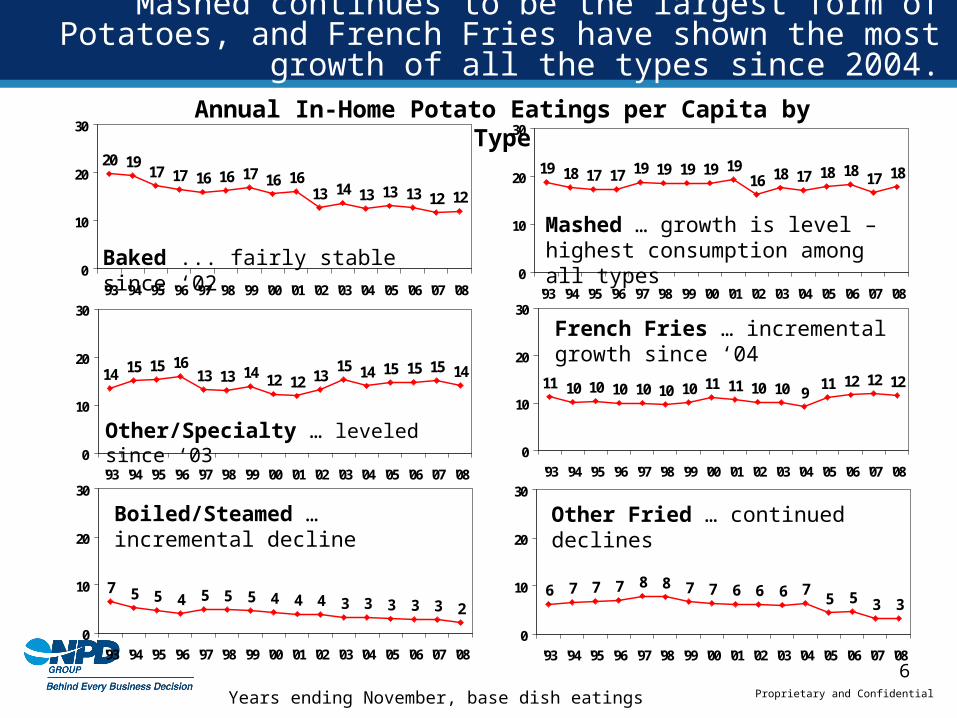
Annual In-Home Potato Eatings per Capita by Type
20 1917 17 16 16 17 16 16
13 14 13 13 13 12 12
0
10
20
30
'93 '94 '95 '96 '97 '98 '99 '00 '01 '02 '03 '04 '05 '06 '07 '08
19 18 17 17 19 19 19 19 1916 18 17 18 18 17 18
0
10
20
30
'93 '94 '95 '96 '97 '98 '99 '00 '01 '02 '03 '04 '05 '06 '07 '08
14 15 15 1613 13 14 12 12 13
15 14 15 15 15 14
0
10
20
30
'93 '94 '95 '96 '97 '98 '99 '00 '01 '02 '03 '04 '05 '06 '07 '08
7 5 5 4 5 5 5 4 4 4 3 3 3 3 3 2
0
10
20
30
'93 '94 '95 '96 '97 '98 '99 '00 '01 '02 '03 '04 '05 '06 '07 '08
11 10 10 10 10 10 10 11 11 10 10 911 12 12 12
0
10
20
30
'93 '94 '95 '96 '97 '98 '99 '00 '01 '02 '03 '04 '05 '06 '07 '08
6 7 7 7 8 8 7 7 6 6 6 75 5 3 3
0
10
20
30
'93 '94 '95 '96 '97 '98 '99 '00 '01 '02 '03 '04 '05 '06 '07 '08
Baked ... fairly stable since ‘02
Other/Specialty … leveled since ‘03
Boiled/Steamed … incremental decline
Other Fried … continued declines
French Fries … incremental growth since ‘04
Mashed … growth is level – highest consumption among all types
Years ending November, base dish eatings
Mashed continues to be the largest form of Potatoes, and French Fries have shown the most growth of all the types since 2004.
7Proprietary and Confidential
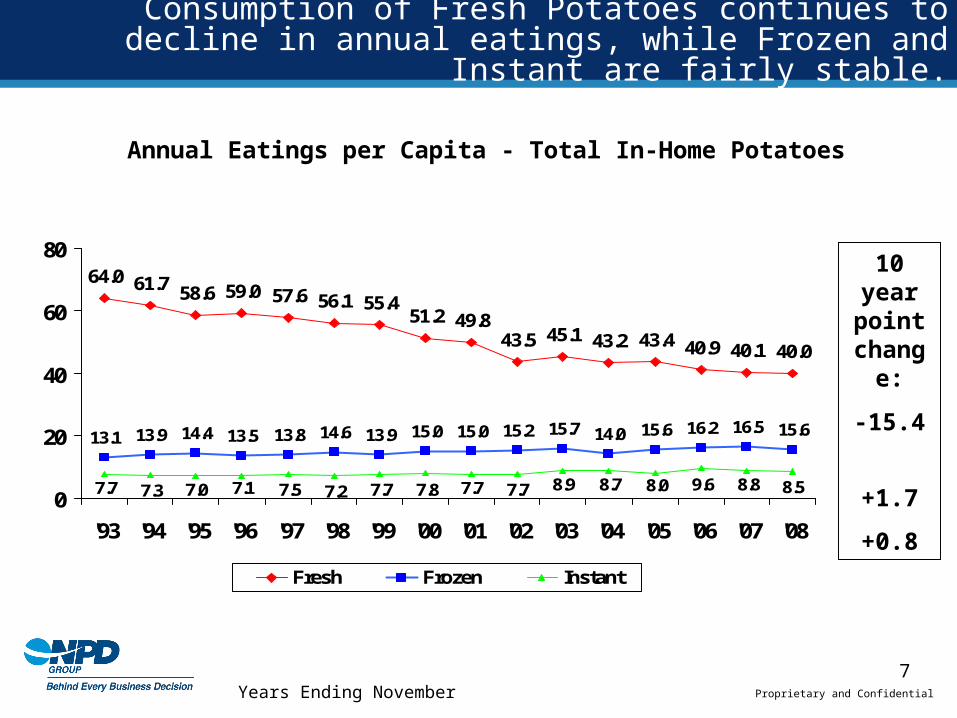
Consumption of Fresh Potatoes continues to decline in annual eatings, while Frozen and Instant are fairly stable.
64.0 61.7 58.6 59.0 57.6 56.1 55.451.2 49.8
43.5 45.1 43.2 43.4 40.9 40.1 40.0
13.1 13.9 14.4 13.5 13.8 14.6 13.9 15.0 15.0 15.2 15.7 14.0 15.6 16.2 16.5 15.6
8.58.89.68.08.78.97.77.77.87.77.27.57.17.07.37.70
20
40
60
80
'93 '94 '95 '96 '97 '98 '99 '00 '01 '02 '03 '04 '05 '06 '07 '08
Fresh Frozen Instant
Annual Eatings per Capita - Total In-Home Potatoes
10 year point
change:
-15.4
+1.7
+0.8
Years Ending November
8Proprietary and Confidential
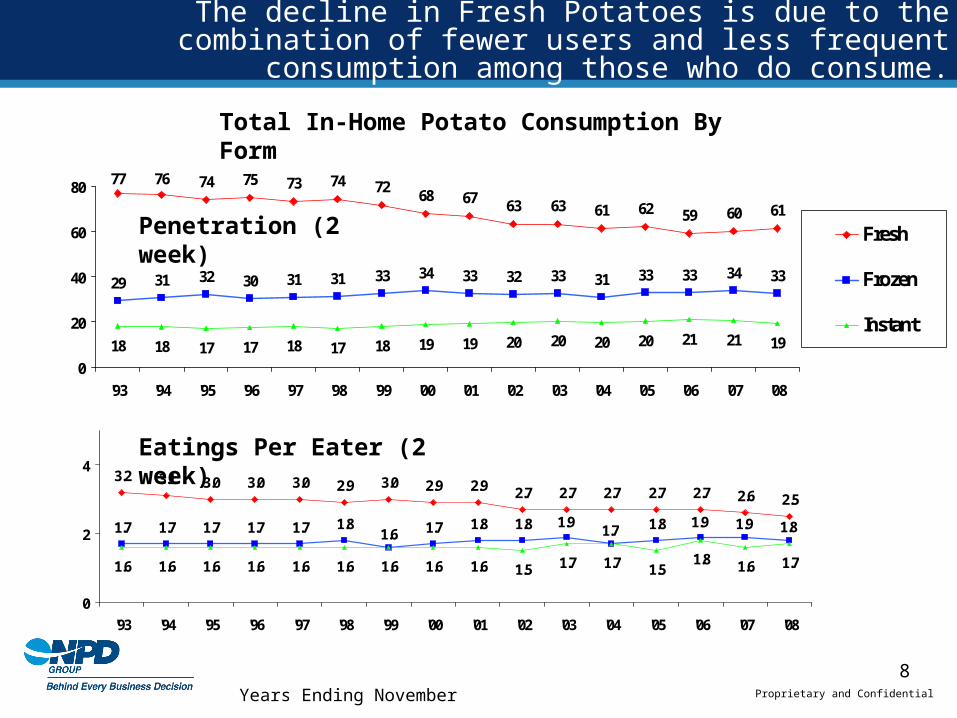
77 76 74 75 73 74 7268 67 63 63 61 62 59 60 61
29 31 32 30 31 31 33 34 33 32 33 31 33 33 34 33
20 20 20 21 21 1920191918171817171818
0
20
40
60
80
'93 '94 '95 '96 '97 '98 '99 '00 '01 '02 '03 '04 '05 '06 '07 '08
Fresh
Frozen
Instant
3.2 3.1 3.0 3.0 3.0 2.9 3.0 2.9 2.9 2.7 2.7 2.7 2.7 2.7 2.6 2.5
1.7 1.7 1.7 1.7 1.7 1.8 1.7 1.8 1.8 1.8
1.7 1.7 1.51.8 1.6 1.7
1.6 1.81.91.91.91.7
1.51.61.61.61.61.61.61.61.61.6
0
2
4
'93 '94 '95 '96 '97 '98 '99 '00 '01 '02 '03 '04 '05 '06 '07 '08
The decline in Fresh Potatoes is due to the combination of fewer users and less frequent consumption among those who do consume.
Total In-Home Potato Consumption By Form
Years Ending November
Penetration (2 week)
Eatings Per Eater (2 week)
9Proprietary and Confidential
5591 107
255218
247
341
130
198
96
192
120
Affl.Singles
Low/Md-Inc
Singles
DINKS WorkingParents
SingleParents
Affl.Tradit.
Families
Low/Md-Inc Trad
Fams
Affl.Empty
Nesters
Low/Md-Inc
EmptyNesters
SingleSeniors
MarriedSeniors
75+ YrOlds
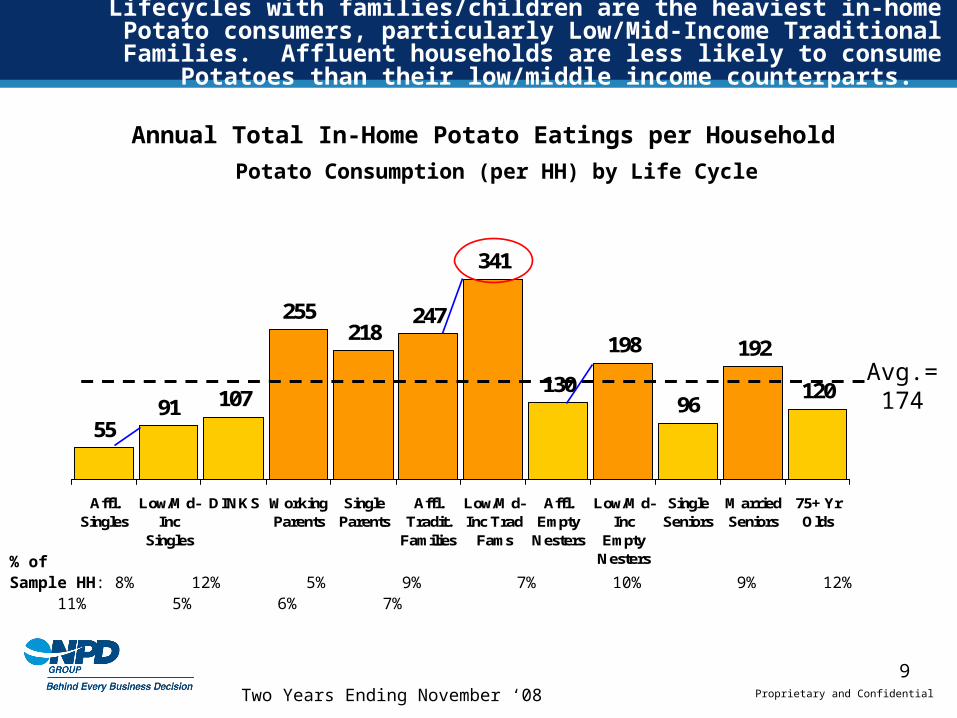
Lifecycles with families/children are the heaviest in-home Potato consumers, particularly Low/Mid-Income Traditional Families. Affluent households are less
likely to consume Potatoes than their low/middle income counterparts.
Annual Total In-Home Potato Eatings per Household
Avg.=174
% ofSample HH: 8% 12% 5% 9% 7% 10% 9% 12% 11% 5% 6% 7%
Two Years Ending November ‘08
Potato Consumption (per HH) by Life Cycle
10Proprietary and Confidential
4665
5169 70 64
7961
8473
9080
AffluentSingles
L/M IncSingles
DINKS WorkingParents
SingleParents
AflntTradFams
L/M IncTradFams
AflntTradFams
Low/MidInc
EmptyNstrs
SingleActive
Seniors
MarriedActive
Seniors
75+
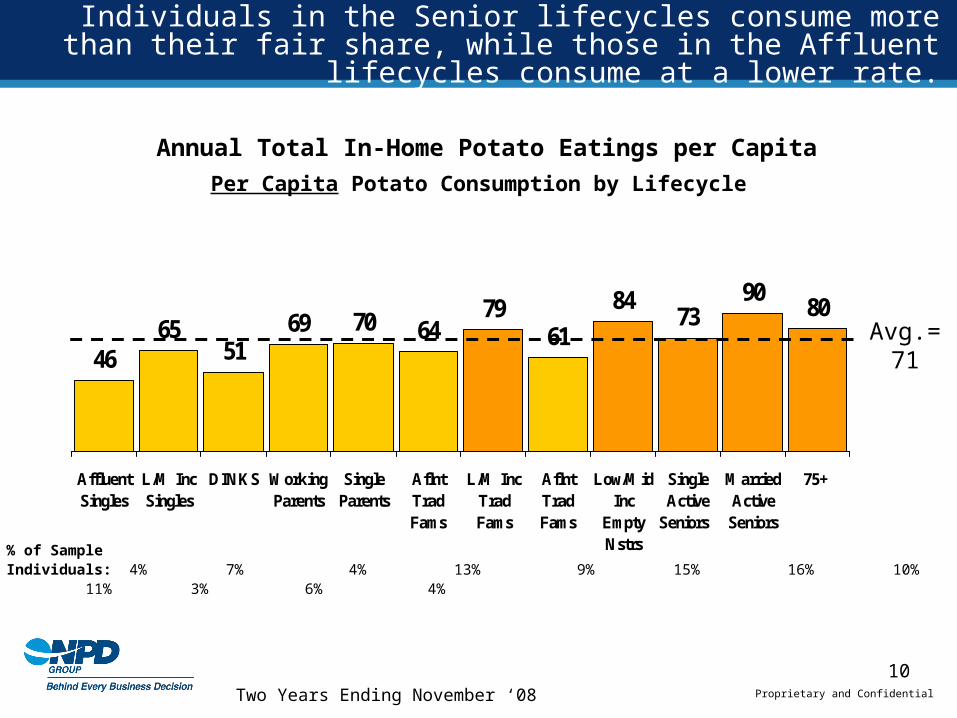
Annual Total In-Home Potato Eatings per Capita
Avg.=71
Per Capita Potato Consumption by Lifecycle
% of Sample Individuals: 4% 7% 4% 13% 9% 15% 16% 10% 11% 3% 6% 4%
Two Years Ending November ‘08
Individuals in the Senior lifecycles consume more than their fair share, while those in the Affluent lifecycles consume at a lower rate.
11Proprietary and Confidential
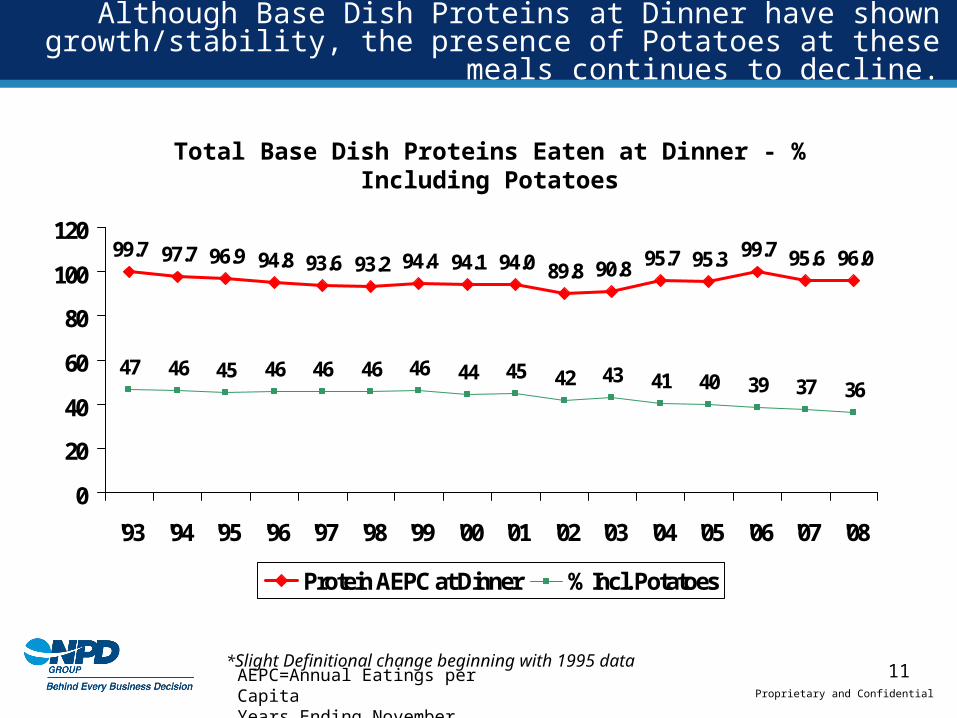
Although Base Dish Proteins at Dinner have shown growth/stability, the presence of Potatoes at these meals continues to decline.
99.7 97.7 96.9 94.8 93.6 93.2 94.4 94.1 94.0 89.8 90.8 95.7 95.3 99.7 95.6 96.0
47 46 45 46 46 46 46 44 45 42 43 41 40 39 37 36
0
20
40
60
80
100
120
'93 '94 '95 '96 '97 '98 '99 '00 '01 '02 '03 '04 '05 '06 '07 '08
Protein AEPC at Dinner % Incl. Potatoes
Total Base Dish Proteins Eaten at Dinner - % Including Potatoes
AEPC=Annual Eatings per CapitaYears Ending November
*Slight Definitional change beginning with 1995 data
12Proprietary and Confidential
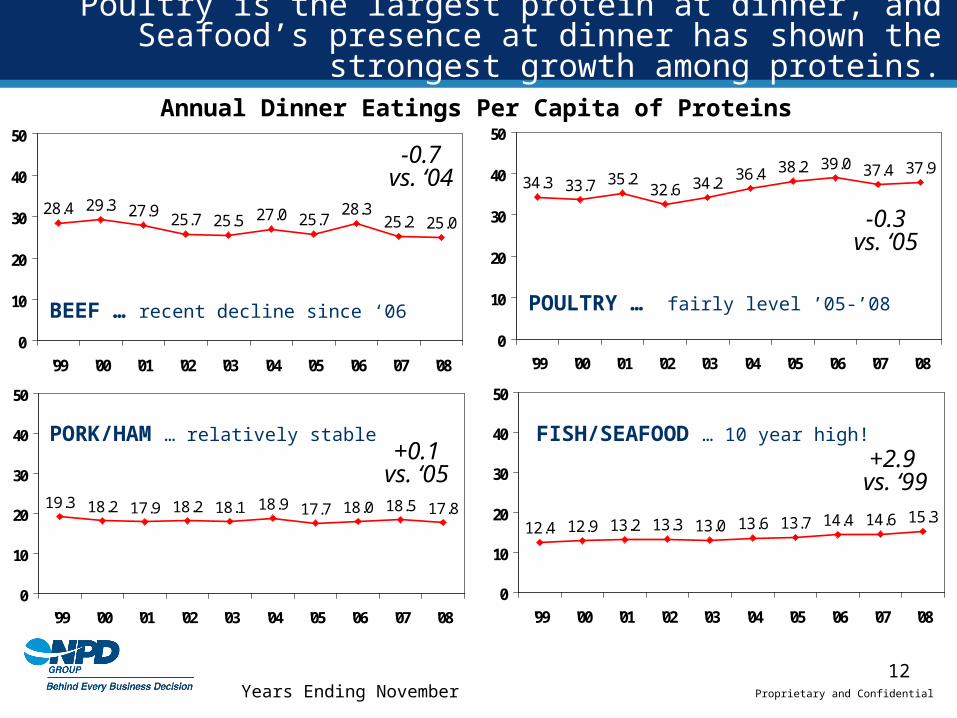
28.4 29.3 27.9 25.7 25.5 27.0 25.728.3
25.2 25.0
0
10
20
30
40
50
'99 '00 '01 '02 '03 '04 '05 '06 '07 '08
Poultry is the largest protein at dinner, and Seafood’s presence at dinner has shown the strongest growth among proteins.
Annual Dinner Eatings Per Capita of Proteins
34.3 33.7 35.232.6 34.2
36.4 38.2 39.0 37.4 37.9
0
10
20
30
40
50
'99 '00 '01 '02 '03 '04 '05 '06 '07 '08
19.3 18.2 17.9 18.2 18.1 18.9 17.7 18.0 18.5 17.8
0
10
20
30
40
50
'99 '00 '01 '02 '03 '04 '05 '06 '07 '08
12.4 12.9 13.2 13.3 13.0 13.6 13.7 14.4 14.6 15.3
0
10
20
30
40
50
'99 '00 '01 '02 '03 '04 '05 '06 '07 '08
Years Ending November
BEEF … recent decline since ‘06
PORK/HAM … relatively stable
POULTRY … fairly level ’05-’08
FISH/SEAFOOD … 10 year high!
-0.7vs. ‘04
-0.3vs. ‘05
+0.1vs. ‘05
+2.9 vs. ‘99
13Proprietary and Confidential
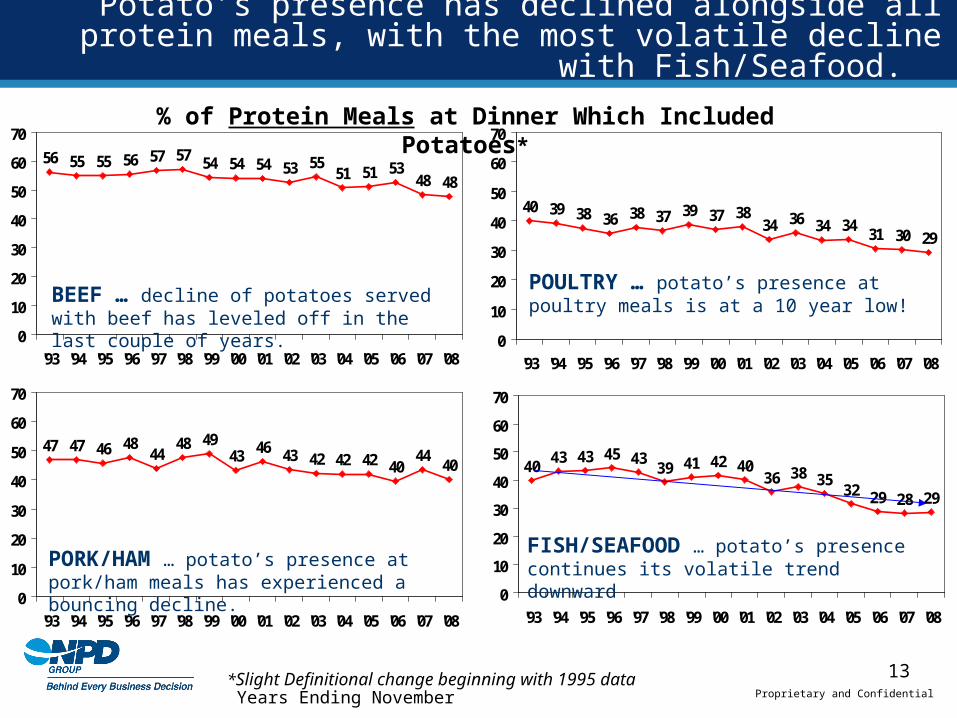
56 55 55 56 57 57 54 54 54 53 5551 51 53
48 48
0
10
20
30
40
50
60
70
'93 '94 '95 '96 '97 '98 '99 '00 '01 '02 '03 '04 '05 '06 '07 '08
Potato’s presence has declined alongside all protein meals, with the most volatile decline with Fish/Seafood.
% of Protein Meals at Dinner Which Included Potatoes*
40 39 38 36 38 37 39 37 3834 36 34 34
31 30 29
0
10
20
30
40
50
60
70
'93 '94 '95 '96 '97 '98 '99 '00 '01 '02 '03 '04 '05 '06 '07 '08
47 47 46 4844
48 4943 46 43 42 42 42 40
4440
0
10
20
30
40
50
60
70
'93 '94 '95 '96 '97 '98 '99 '00 '01 '02 '03 '04 '05 '06 '07 '08
4043 43 45 43
39 41 42 4036 38 35
32 29 28 29
0
10
20
30
40
50
60
70
'93 '94 '95 '96 '97 '98 '99 '00 '01 '02 '03 '04 '05 '06 '07 '08
BEEF … decline of potatoes served with beef has leveled off in the last couple of years.
PORK/HAM … potato’s presence at pork/ham meals has experienced a bouncing decline.
POULTRY … potato’s presence at poultry meals is at a 10 year low!
FISH/SEAFOOD … potato’s presence continues its volatile trend downward
*Slight Definitional change beginning with 1995 dataYears Ending November
14Proprietary and Confidential
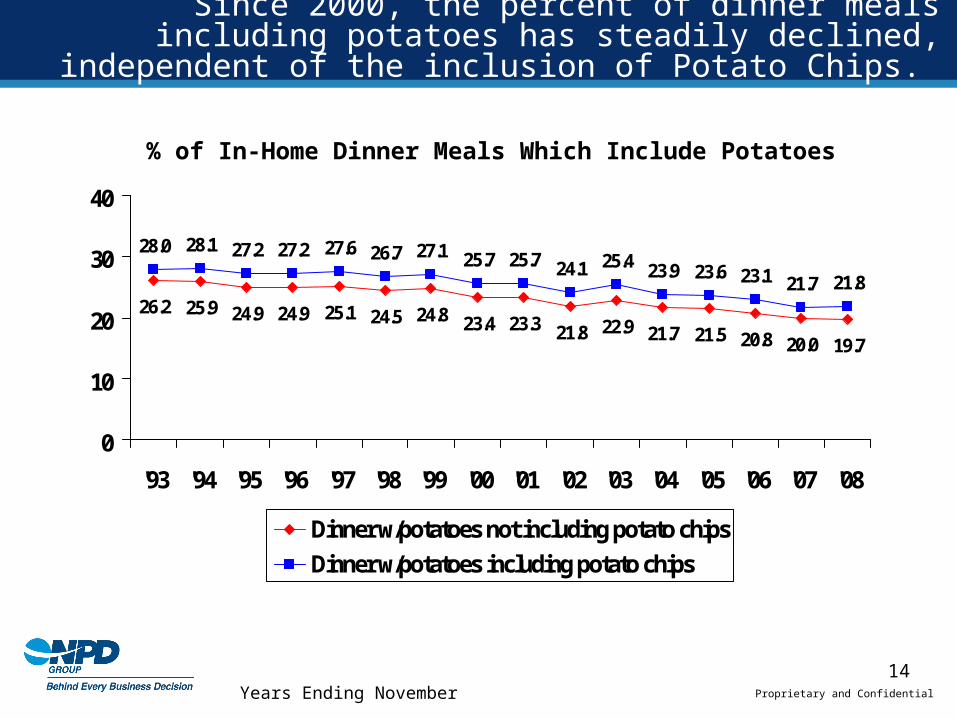
26.2 25.9 24.9 24.9 25.1 24.5 24.8 23.4 23.3 21.8 22.9 21.7 21.5 20.8 20.0 19.7
28.0 28.1 27.2 27.2 27.6 26.7 27.1 25.7 25.7 24.1 25.4 23.9 23.6 23.1 21.7 21.8
0
10
20
30
40
'93 '94 '95 '96 '97 '98 '99 '00 '01 '02 '03 '04 '05 '06 '07 '08
Dinner w/potatoes not including potato chips
Dinner w/potatoes including potato chips
Since 2000, the percent of dinner meals including potatoes has steadily declined, independent of the inclusion of Potato Chips.
% of In-Home Dinner Meals Which Include Potatoes
Years Ending November
15Proprietary and Confidential
External influences: Low carb diets gained momentum between ’02 and ’04, but this diet trend is declining.
3.23.43.94.3
6.5
3.7
1.21.5
0
5
10
15
'01 '02 '03 '04 '05 '06 '07 '08
% of Adults on a Low Carb/High Protein Diet
Years Ending November
16Proprietary and Confidential
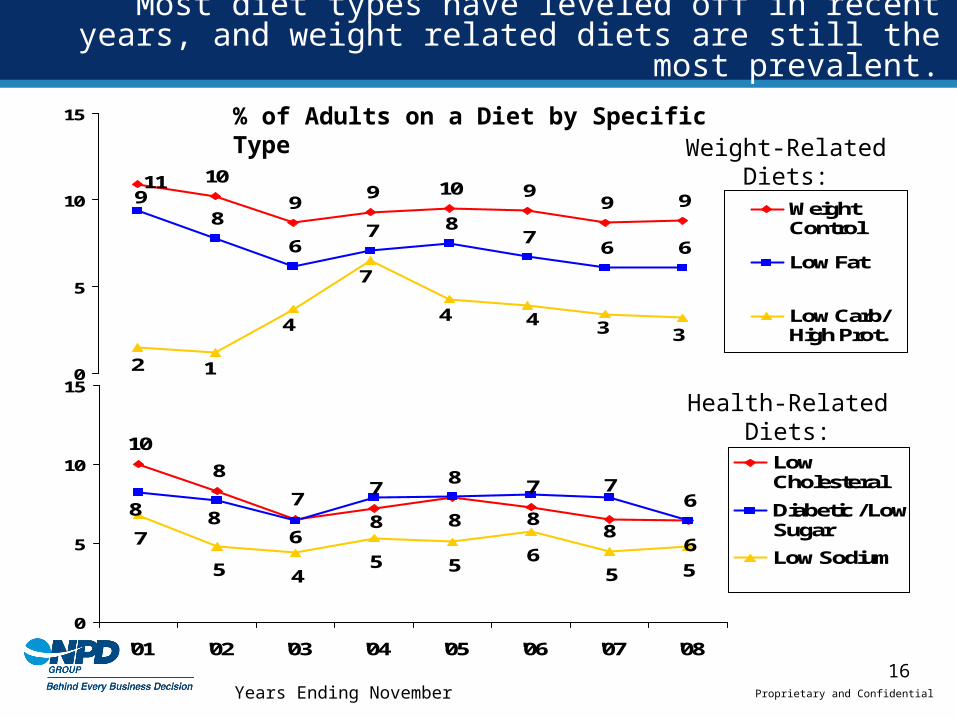
Most diet types have leveled off in recent years, and weight related diets are still the most prevalent.
10
99 10 9
9 98
67 8
76 6
119
2 1
4
7
4 4 33
0
5
10
15
WeightControl
Low Fat
Low Carb/High Prot.
% of Adults on a Diet by Specific Type
8
77
8 76
8 8 8
6
7
10
6 888
7
5 45 5
65 5
0
5
10
15
'01 '02 '03 '04 '05 '06 '07 '08
LowCholesteral
Diabetic / LowSugar
Low Sodium
Weight-RelatedDiets:
Health-RelatedDiets:
Years Ending November
17Proprietary and Confidential
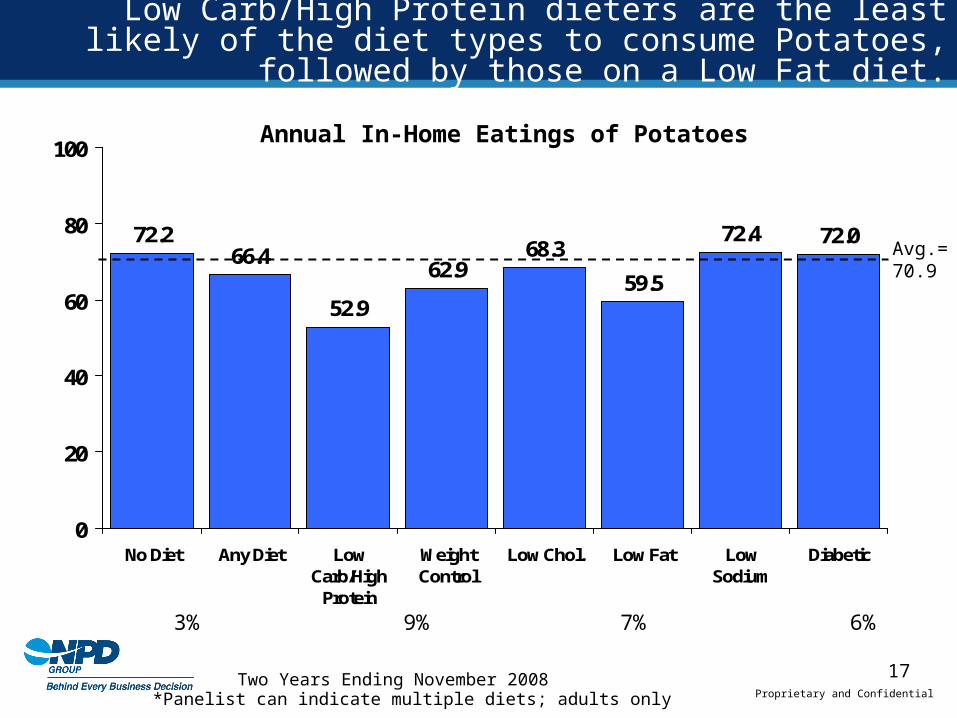
Low Carb/High Protein dieters are the least likely of the diet types to consume Potatoes, followed by those on a Low Fat diet.
72.266.4
52.9
62.968.3
59.5
72.4 72.0
0
20
40
60
80
100
No Diet Any Diet LowCarb/High
Protein
WeightControl
Low Chol. Low Fat LowSodium
Diabetic
Annual In-Home Eatings of Potatoes
Avg.=70.9
*Panelist can indicate multiple diets; adults only
% of Sample: 78% 22% 3% 9% 7% 6% 5% 7%
Two Years Ending November 2008
18Proprietary and Confidential
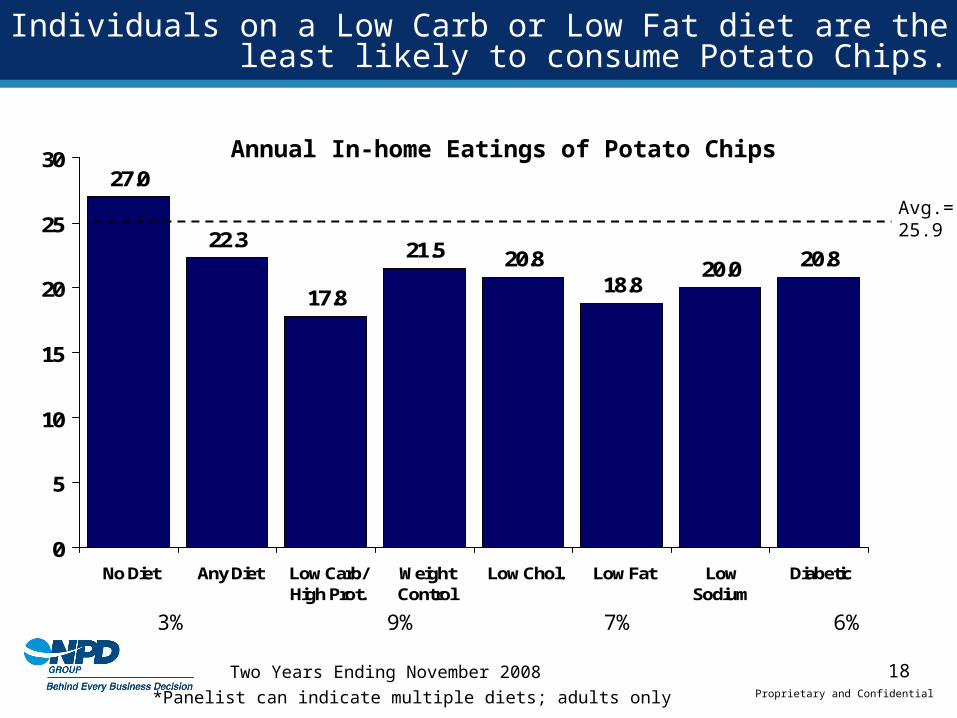
Individuals on a Low Carb or Low Fat diet are the least likely to consume Potato Chips.
27.0
22.3
17.8
21.5 20.8 20.818.8
20.0
0
5
10
15
20
25
30
No Diet Any Diet Low Carb/High Prot.
WeightControl
Low Chol. Low Fat LowSodium
Diabetic
Annual In-home Eatings of Potato Chips
Avg.=25.9
*Panelist can indicate multiple diets; adults only
Two Years Ending November 2008
% of Sample: 78% 22% 3% 9% 7% 6% 5% 7%
19Proprietary and Confidential
APPENDIX
20Proprietary and Confidential
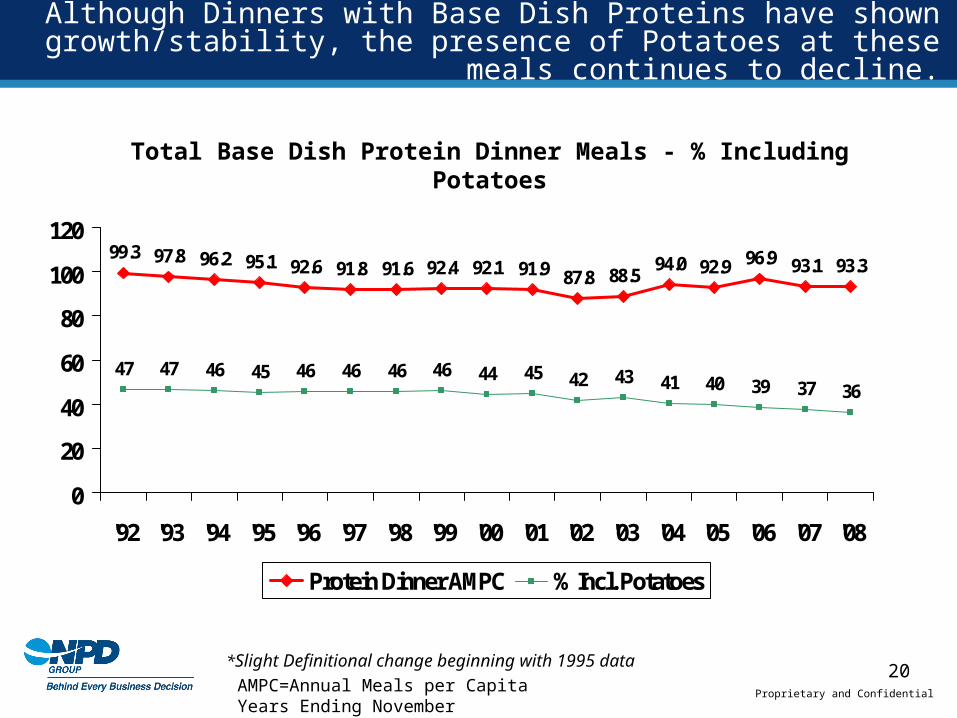
Although Dinners with Base Dish Proteins have shown growth/stability, the presence of Potatoes at these meals continues to decline.
99.3 97.8 96.2 95.1 92.6 91.8 91.6 92.4 92.1 91.9 87.8 88.594.0 92.9 96.9 93.1 93.3
47 47 46 45 46 46 46 46 44 45 42 43 41 40 39 37 36
0
20
40
60
80
100
120
'92 '93 '94 '95 '96 '97 '98 '99 '00 '01 '02 '03 '04 '05 '06 '07 '08
Protein Dinner AMPC % Incl. Potatoes
Total Base Dish Protein Dinner Meals - % Including Potatoes
AMPC=Annual Meals per CapitaYears Ending November
*Slight Definitional change beginning with 1995 data
Recommended