Signal & Image Processing : An International Journal (SIPIJ) Vol.6, No.1, February 2015
DOI : 10.5121/sipij.2015.6105 61
AUTOMATIC MEAL INSPECTION SYSTEM
USING LBP-HF FEATURE FOR CENTRAL
KITCHEN
Yue-Min Jiang1,Ho-Hsin Lee
1, Cheng-Chang Lien
2, Chun-Feng Tai
2, Pi-Chun
Chu2and Ting-Wei Yang
2
1Industrial Technology Research Institute, SSTC, Taiwan, ROC
2Department of CSIE, Chung Hua University, Taiwan, ROC
ABSTRACT
This paper proposes an intelligent and automatic meal inspection system which can be applied to the meal
inspection for the application of central kitchen automation. The diet specifically designed for the patients
are required with providing personalized diet such as low sodium intake or some necessary food. Hence,
the proposed system can benefit the inspection process that is often performed manually. In the proposed
system, firstly, the meal box can be detected and located automatically with the vision-based method and
then all the food ingredients can be identified by using the color and LBP-HF texture features. Secondly,
the quantity for each of food ingredient is estimated by using the image depth information. The
experimental results show that the meal inspection accuracy can approach 80%, meal inspection efficiency
can reach1200ms, and the food quantity accuracy is about 90%. The proposed system is expected to
increase the capacity of meal supply over 50% and be helpful to the dietician in the hospital for saving the
time in the diet inspection process.
KEYWORDS
meal inspection, LBP-HF, Image depth
1. INTRODUCTION
In recent years, the food industry has been addressing the research on the food quality inspection
for reducing the manpower and manual inspection error. To aim at this goal, in this study, the
machine learning technologies are applied to develop the 3D vision-based inspection
system[1,13] that can identify the meal categories and amount. In [2], the study indicated that the
selected image features are crucial [14]to the detection of peel defects. In [3], the authors
developed a vision-based method to improve the quality inspection of food products. In [4],
Matsuda et al. proposed the food identification method by integrating several detectors and image
features, e.g., color, gradient, texture, and SIFT features. Then, the multiple kernel
learning(MKL) method is applied to identify the food quality. Yang et al. [5] proposed the pair
wise local features to describe the texture distributions for eight basic food ingredients. However,
the abovementioned methods do not address the quality inspection for the Chinese foods. In the
Chinese food, several food ingredients are often mixed, e.g., the scrambled eggs with tomatoes,
such that it is difficult to identify the food ingredients and quantity by using the conventional
vision-based methods. In [8], Chen et al. proposed the diet ingredients inspection method by
using the SIFT, Gabor texture, and depth camera to detect the diet ingredients. Based this method,
in this study, we apply the proposed the meal box detection and locating technology, LBP-HF
texture features, and depth images to construct a novel approach of the meal inspection for the

Signal & Image Processing : An International Journal (SIPIJ) Vol.6, No.1, February 2015
central kitchen automation. The
system is shown in Figure 1.
Figure 1.The system flowchart of the
In Figure 1, firstly, the sensing
box locating module locates the position of
each food ingredient. Finally,
categories and amount for evaluate the food quality.
described in Figure 2. The meal box is moving on
3D (depth) and 2D images continuously. Once the meal box is located with
module, the food quality can be inspected with the color, texture, and depth image features.
experimental results show that the
efficiency can reach 1200 ms, and the food quantity accuracy is about 90%. The proposed system
is expected to increase the capacity of meal supply over 50% an
hospital for saving the time in the diet
Figure 2.The system operation
Signal & Image Processing : An International Journal (SIPIJ) Vol.6, No.1, February 2015
The system flowchart of the proposed automatic meal inspection
flowchart of the proposed automatic meal inspection system
module extracts 3D (depth) and 2D images. Secondly, the meal
box locating module locates the position of the detected meal box and segment the regions for
, the meal contents identification module identifies the food
nd amount for evaluate the food quality. The system operation procedures are
l box is moving on the conveyor and the sensing module extracts
continuously. Once the meal box is located with the meal box locating
, the food quality can be inspected with the color, texture, and depth image features.
experimental results show that the meal inspection accuracy can approach 80%, meal
00 ms, and the food quantity accuracy is about 90%. The proposed system
is expected to increase the capacity of meal supply over 50% and be helpful to the dietician in the
hospital for saving the time in the diet inspection process.
system operation procedures of the proposed automatic meal inspection system
Signal & Image Processing : An International Journal (SIPIJ) Vol.6, No.1, February 2015
62
automatic meal inspection
automatic meal inspection system.
3D (depth) and 2D images. Secondly, the meal
detected meal box and segment the regions for
the meal contents identification module identifies the food
procedures are
module extracts
the meal box locating
, the food quality can be inspected with the color, texture, and depth image features. The
meal inspection
00 ms, and the food quantity accuracy is about 90%. The proposed system
d be helpful to the dietician in the
automatic meal inspection system.
Signal & Image Processing : An International Journal (SIPIJ) Vol.6, No.1, February 2015
2. AUTOMATIC MEAL BOX
The baseline of the system design is based on the domain knowledge of
the methodologies of the meal box locating and the meal contents identification are described.
the diet content and amount identification process, the 2D/
and textures[6], are used to train the
diet categories and amounts. By using the novel automatically foods recognition and amount
identification system, the manual operations can be reduced significantly and the accuracy and
efficiency of food arrangement can be improved significantly
2.1. Meal Box Detection and
To develop a real-time vision-based
captured from the camera are crucial to detect
that the meal box is moving continuously
how to detect the meal box and locate
proposed a novel meal box locating
method to match the meal box template shown in
resolution to high resolution within the
Figure
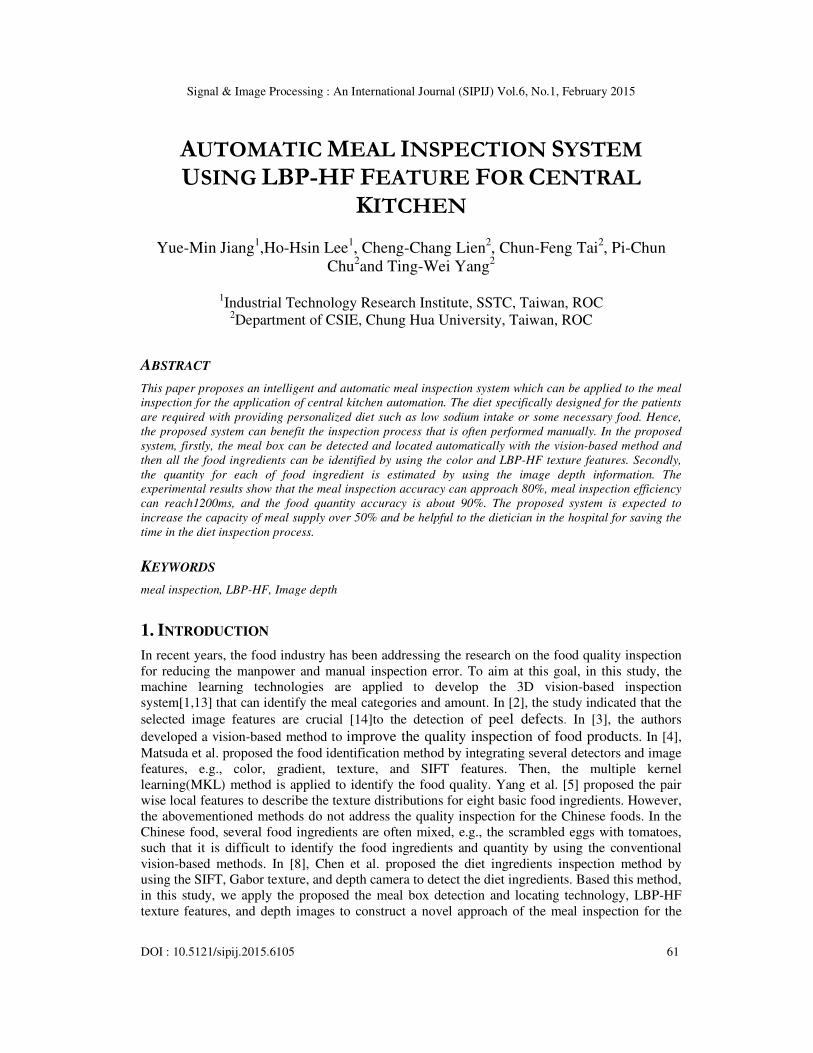
Based on the careful observations, the image template of the meal box is
because that the foods can cover the left side of meal box and no texture information exist on the
right side of meal box. Hence, we extract the middle image in the meal box image shown in
Figure 4-(b) as the image template of meal box to dete
Figure 4.Selection of image template of meal box to detect and locate the position of meal box.
image on the meal dispatch conveyor
Signal & Image Processing : An International Journal (SIPIJ) Vol.6, No.1, February 2015
OX INSPECTION
The baseline of the system design is based on the domain knowledge of dietician. In this
the methodologies of the meal box locating and the meal contents identification are described.
the diet content and amount identification process, the 2D/3D image features, e.g., depth, color
, are used to train the meal inspection system, and then the system can
diet categories and amounts. By using the novel automatically foods recognition and amount
identification system, the manual operations can be reduced significantly and the accuracy and
can be improved significantly.
etection and Locating with Multi-resolution Image Alignment
based meal inspection system, the analyses of the video
crucial to detect and locate the meal box. In Figure 3, we can see
that the meal box is moving continuously on the meal dispatch conveyor at central kitchen
locate the position of meal box in real-time is a problem
meal box locating method by using the multi-resolution image
method to match the meal box template shown in Figure 4-(b) to the captured images
resolution to high resolution within the region of interest (ROI) shown in Figure 3.
ure3.The ROI setting in the meal box image.
careful observations, the image template of the meal box is difficult
because that the foods can cover the left side of meal box and no texture information exist on the
right side of meal box. Hence, we extract the middle image in the meal box image shown in
(b) as the image template of meal box to detect and locate the position of meal box.
(a) (b)
Selection of image template of meal box to detect and locate the position of meal box.
on the meal dispatch conveyor.(b)Image template of meal box.
Signal & Image Processing : An International Journal (SIPIJ) Vol.6, No.1, February 2015
63
In this section,
the methodologies of the meal box locating and the meal contents identification are described. In
3D image features, e.g., depth, color [7]
system, and then the system can identify the
diet categories and amounts. By using the novel automatically foods recognition and amount
identification system, the manual operations can be reduced significantly and the accuracy and
lignment
video content
3, we can see
central kitchen. Then,
problem. Here, we
image alignment
to the captured images from low
difficult to generate
because that the foods can cover the left side of meal box and no texture information exist on the
right side of meal box. Hence, we extract the middle image in the meal box image shown in
ct and locate the position of meal box.
Selection of image template of meal box to detect and locate the position of meal box.(a)Meal box
Signal & Image Processing : An International Journal (SIPIJ) Vol.6, No.1, February 2015
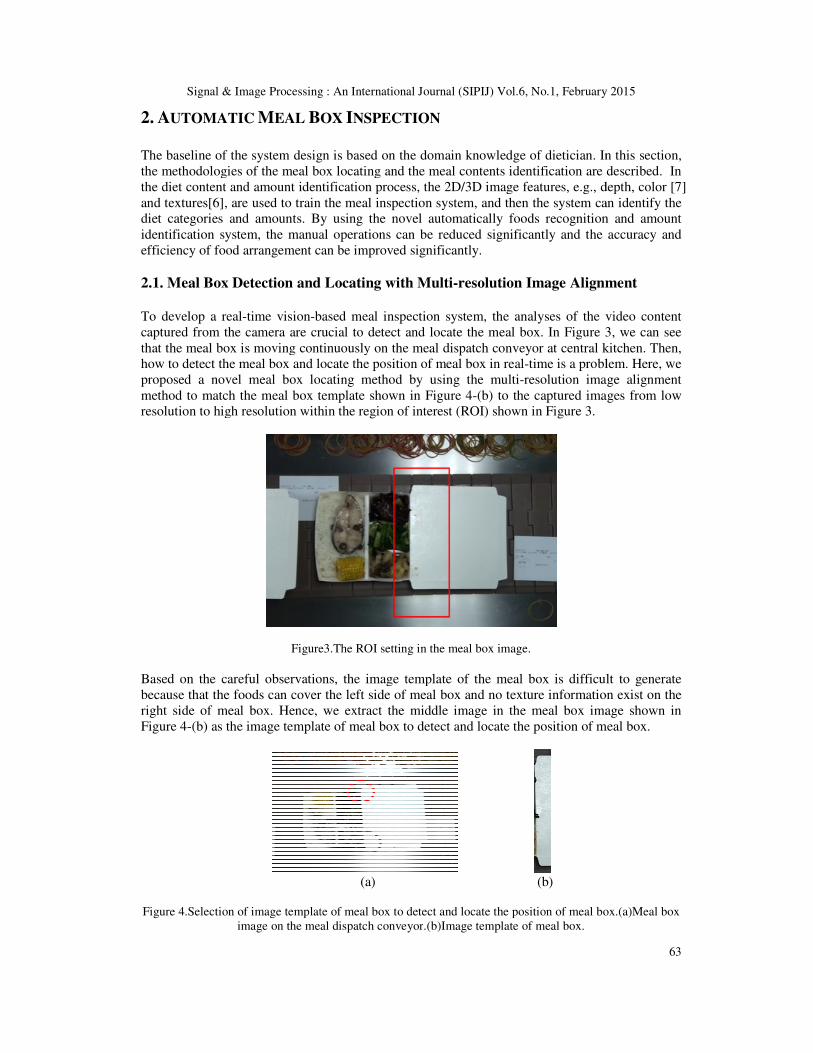
The algorithm of meal box locating is described as follows.
1. Image template and meal box image are decomposed into specified multi
(pyramid image representation
2. Perform the pixel-based template matching (correlation matching)
resolution). Then, some candidate regions are extracted.
3. Perform the pixel-based template matching
neighbouring region obtained from the
(aFigure 5.The multi-resolution image
resolution levels (pyramid image representation
high resolution images.(a) Template image
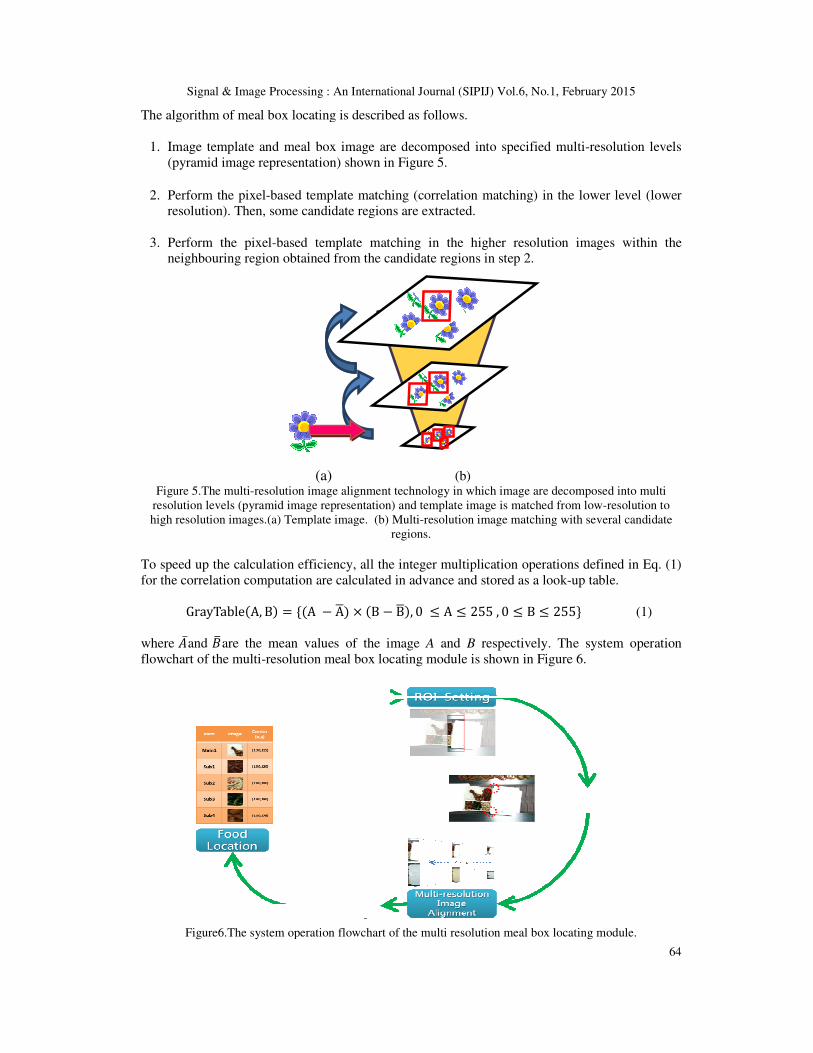
To speed up the calculation efficiency, all the integer
for the correlation computation are calculated in advance
GrayTableA, B � �A where �̅and ��are the mean values of the image
flowchart of the multi-resolution meal box locat
Figure6.The system operation flow
Signal & Image Processing : An International Journal (SIPIJ) Vol.6, No.1, February 2015
The algorithm of meal box locating is described as follows.
Image template and meal box image are decomposed into specified multi-resolution levels
yramid image representation) shown in Figure 5.
template matching (correlation matching) in the lower level
ome candidate regions are extracted.
template matching in the higher resolution image
region obtained from the candidate regions in step 2.
a) (b) image alignment technology in which image are decompose
image representation) and template image is matched from low-
(a) Template image. (b) Multi-resolution image matching with several candidate
regions.
To speed up the calculation efficiency, all the integer multiplication operations defined in Eq. (1)
computation are calculated in advance and stored as a look-up table.
� A� � B � B� , 0 � A � 255 , 0 � B � 255�
re the mean values of the image A and B respectively. The system
resolution meal box locating module is shown in Figure 6.
operation flowchart of the multi resolution meal box locating module
Signal & Image Processing : An International Journal (SIPIJ) Vol.6, No.1, February 2015
64
resolution levels
in the lower level (lower
images within the
mage are decomposed into multi
-resolution to
matching with several candidate
operations defined in Eq. (1)
up table.
(1)
system operation
module.
Signal & Image Processing : An International Journal (SIPIJ) Vol.6, No.1, February 2015
2.2. Meal Box Contents Identification
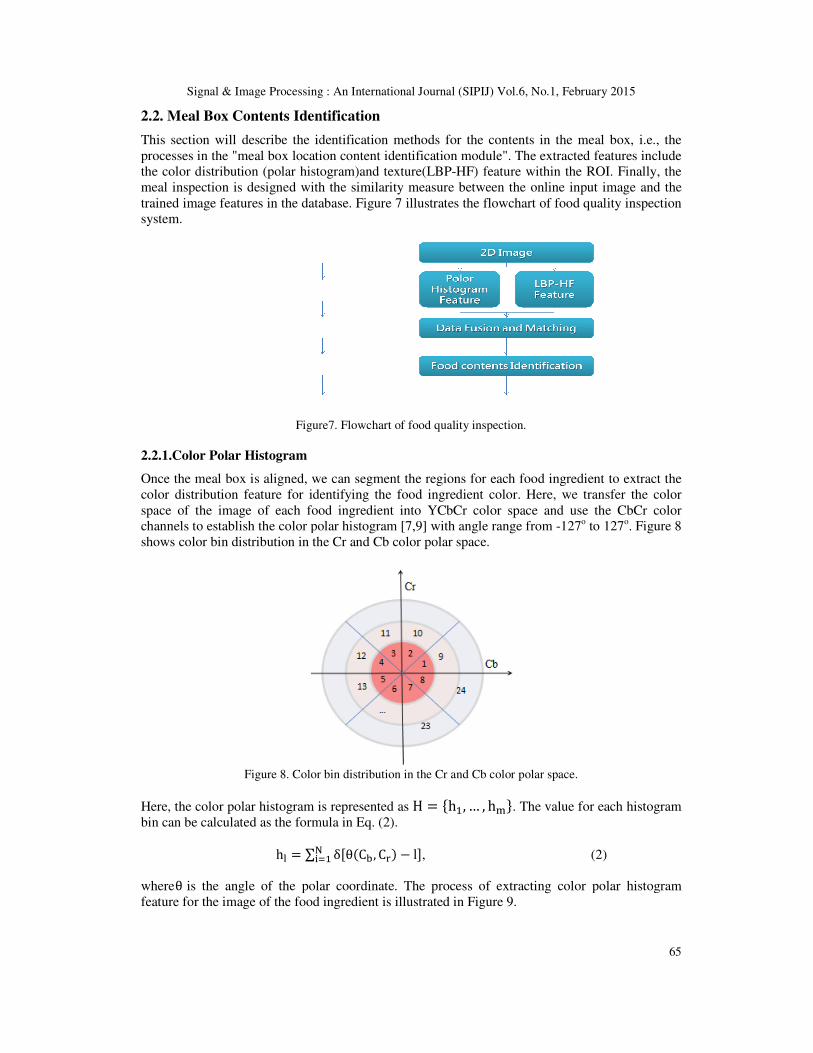
This section will describe the identification method
processes in the "meal box location
the color distribution (polar histogram)
meal inspection is designed with the
trained image features in the database. Figure
system.
Figure
2.2.1.Color Polar Histogram
Once the meal box is aligned, we can segment the regions for each
color distribution feature for identifying the
space of the image of each food ingredient
channels to establish the color polar
shows color bin distribution in the
Figure 8. Color bin distribution in the
Here, the color polar histogram is represented as
bin can be calculated as the formula in
h� � ∑ !"whereθ is the angle of the polar
feature for the image of the food ingredient
Signal & Image Processing : An International Journal (SIPIJ) Vol.6, No.1, February 2015
dentification
identification methods for the contents in the meal box,
the "meal box location content identification module". The extracted feature
histogram)and texture(LBP-HF) feature within the ROI
is designed with the similarity measure between the online input image and the
trained image features in the database. Figure 7 illustrates the flowchart of food quali
Figure7. Flowchart of food quality inspection.
we can segment the regions for each food ingredient
color distribution feature for identifying the food ingredient color. Here, we transf
food ingredient into YCbCr color space and use the
polar histogram [7,9] with angle range from -127o to 127
color bin distribution in the Cr and Cb color polar space.
Color bin distribution in the Cr and Cb color polar space.
the color polar histogram is represented as H � �h%, … , h'�. The value for each histogram
the formula in Eq. (2).
δ)θC+, C, � l- "% , (2)
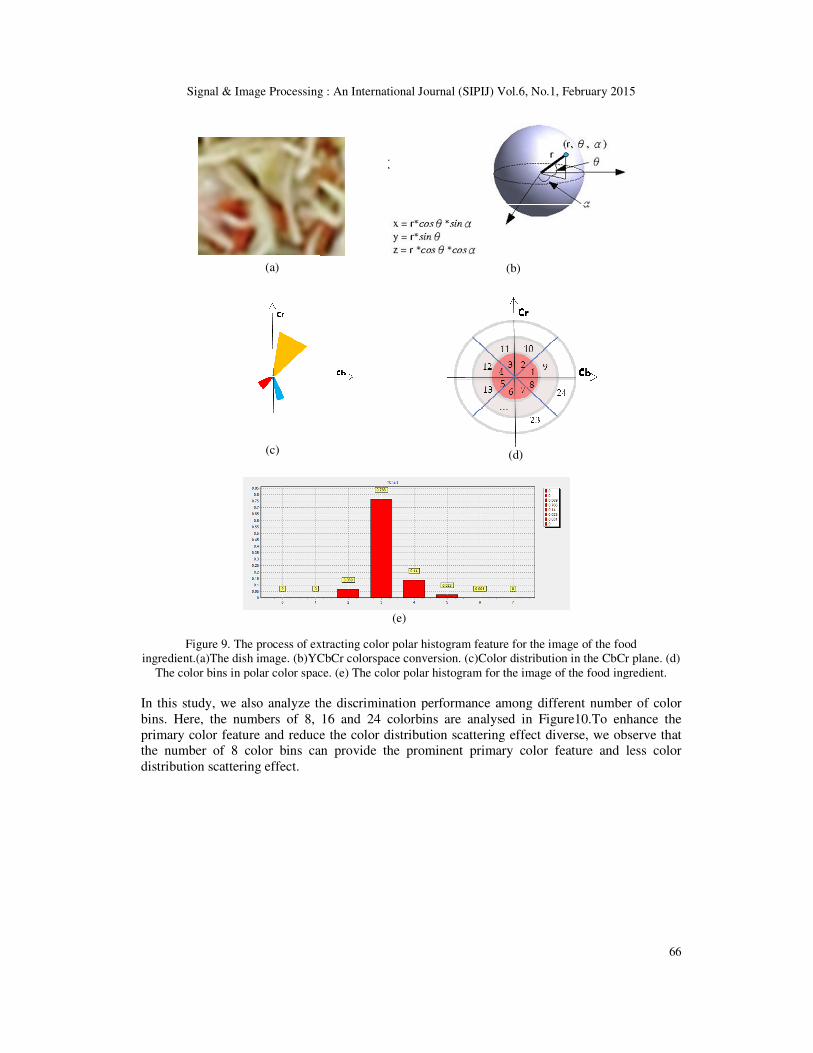
the polar coordinate. The process of extracting color polar histogram
food ingredient is illustrated in Figure 9.
Signal & Image Processing : An International Journal (SIPIJ) Vol.6, No.1, February 2015
65
the meal box, i.e., the
features include
the ROI. Finally, the
online input image and the
illustrates the flowchart of food quality inspection
to extract the
transfer the color
the CbCr color
to 127o. Figure 8
. The value for each histogram
(2)
color polar histogram
Signal & Image Processing : An International Journal (SIPIJ) Vol.6, No.1, February 2015
Figure 9. The process of extract
ingredient.(a)The dish image. (b)YCbCr
The color bins in polar color space
In this study, we also analyze the
bins. Here, the numbers of 8, 16 and 24
primary color feature and reduce the color distribution scattering effect diverse
the number of 8 color bins can
distribution scattering effect.
(a)
(c)
Signal & Image Processing : An International Journal (SIPIJ) Vol.6, No.1, February 2015
extracting color polar histogram feature for the image of the
(b)YCbCr colorspace conversion. (c)Color distribution in the CbCr
color bins in polar color space. (e) The color polar histogram for the image of the food ingredient
the discrimination performance among different number of
, 16 and 24 colorbins are analysed in Figure10.To enhance the
primary color feature and reduce the color distribution scattering effect diverse, we observe that
the number of 8 color bins can provide the prominent primary color feature and less color
(b)
(d)
(e)
Signal & Image Processing : An International Journal (SIPIJ) Vol.6, No.1, February 2015
66
of the food
CbCr plane. (d)
food ingredient.
discrimination performance among different number of color
To enhance the
, we observe that
provide the prominent primary color feature and less color

Signal & Image Processing : An International Journal (SIPIJ) Vol.6, No.1, February 2015
67
Figure 10. The analysis of the discrimination performance among different number of color bins. (a) The
dish image. (b)Histogram of 8 color bins.(c) Histogram of 16 color bins. (d) Histogram of 24 color bins.
2.2.2 Local Binary Pattern-Histogram Fourier (LBP-HF)
Local binary pattern-histogram Fourier (LBP-HF)[10] is based on the LBP method for rotation-
invariant. The LBP operator is powerful for texture description. It labels the image pixels by
thresholding the surrounding pixels with comparing the value of center pixel and summing the
thresholded values weighted by powers of two. The LBP label can be obtained with the formula
in Eq. (3).
LBP0,12, 3 � ∑ s 5fx, y � f8x9, y9:; 290<%9"= 3
(a)
(d)
(c)
(b)

Signal & Image Processing : An International Journal (SIPIJ) Vol.6, No.1, February 2015
68
where f(x, y) is the center pixel (red dot) of image f shown as Figure 11. P is the number of
surrounding points, R is sampling radius, and s(z) is the thresholding function shown as Eq.(4).
sz � @0, A < 01, z ≥ 0E (4)
Figure 11.LBP sampling radius.(a) (P, R) = (6, 1). (b) (P, R) = (8, 2).
Figure 12.58 possible uniform patterns of (P, R) = (8, R).
Furthermore, an extended LBP operator called uniform LBP [11] is proposed to describe the
region texture distribution more precisely. The uniform LBP operator is constructed by
considering if the binary pattern contains at most two bitwise transitions from 0 to 1 or 1 to 0
when the bit pattern is considered circular[6]. For computing the uniform LBP histogram, each
uniform pattern is assigned to a specified bin and all non-uniform patterns are assigned into a
single bin.The58 possible uniform patterns (all zeros, all ones, non-uniform)of (P, R) = (8, R) are
shown in Figure12.
Signal & Image Processing : An International Journal (SIPIJ) Vol.6, No.1, February 2015
69
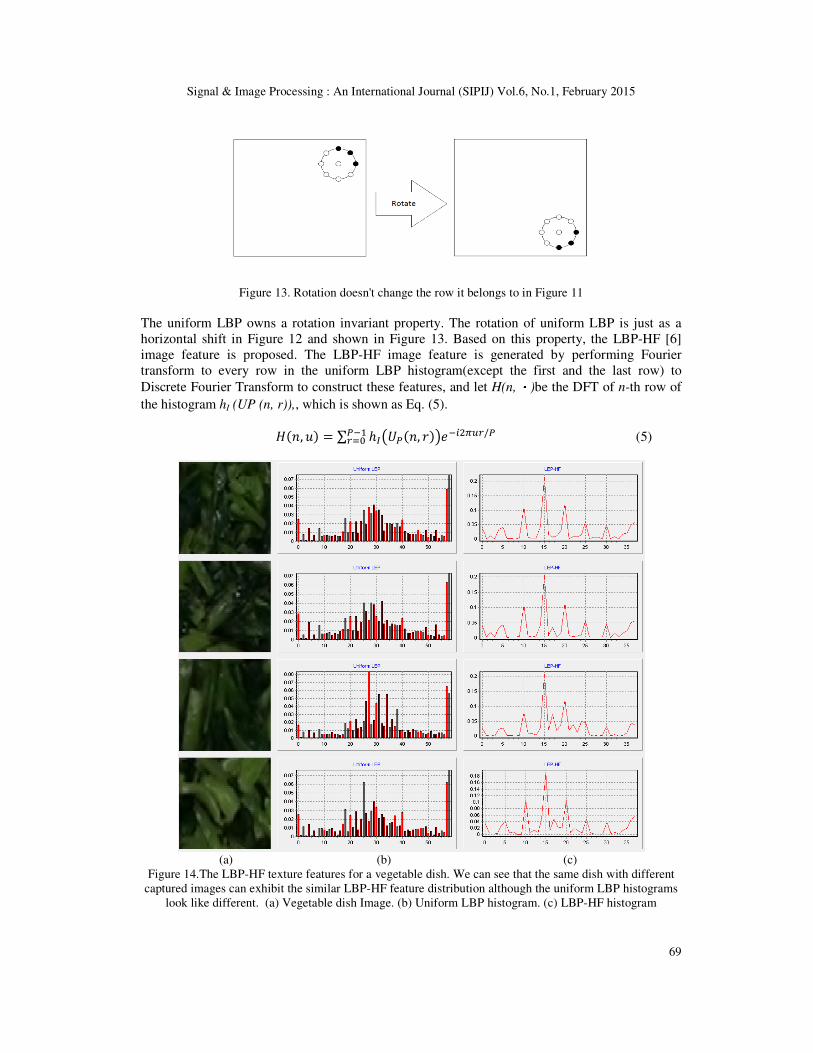
Figure 13. Rotation doesn't change the row it belongs to in Figure 11
The uniform LBP owns a rotation invariant property. The rotation of uniform LBP is just as a
horizontal shift in Figure 12 and shown in Figure 13. Based on this property, the LBP-HF [6]
image feature is proposed. The LBP-HF image feature is generated by performing Fourier
transform to every row in the uniform LBP histogram(except the first and the last row) to
Discrete Fourier Transform to construct these features, and let H(n,・)be the DFT of n-th row of
the histogram hI (UP (n, r)),, which is shown as Eq. (5).
FG, H � ∑ ℎJ8KLG, M :N<OPQRS/LL<%S"= (5)
(a) (b) (c)
Figure 14.The LBP-HF texture features for a vegetable dish. We can see that the same dish with different
captured images can exhibit the similar LBP-HF feature distribution although the uniform LBP histograms
look like different. (a) Vegetable dish Image. (b) Uniform LBP histogram. (c) LBP-HF histogram
Signal & Image Processing : An International Journal (SIPIJ) Vol.6, No.1, February 2015
70
In Eq. (5), H(n, u) is the Fourier transformed histogram, n is the number of “1”, u is the
frequency, hI is the uniform LBP histogram of the image I, UP(n, r) is the uniform LBP operator,
and r denotes the row index. We apply the feature vectors consisting of three LBP histogram
values (all zeros, all ones, non-uniform) and Fourier magnitude spectrum values of LBP-HF in
Eq. (6) to describe the texture distribution of the food ingredient image.
UVWX0<YZ � ) |H1,0 |,⋯ , ]H 51, 0P;] , …⋯ , |HP � 1,0 |,⋯ , ]H5P � 1, 0P;] ,h8U00,0 :, h8U0P, 0 :, h8U0P + 1,0 : -
(6)
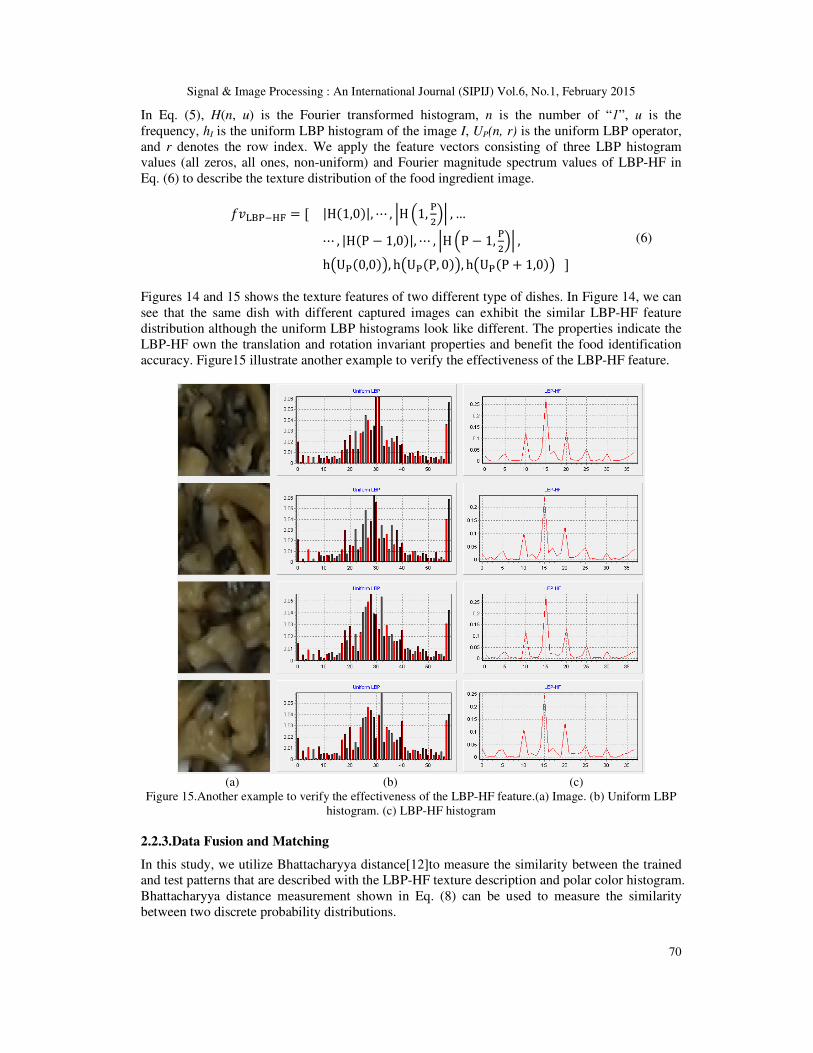
Figures 14 and 15 shows the texture features of two different type of dishes. In Figure 14, we can
see that the same dish with different captured images can exhibit the similar LBP-HF feature
distribution although the uniform LBP histograms look like different. The properties indicate the
LBP-HF own the translation and rotation invariant properties and benefit the food identification
accuracy. Figure15 illustrate another example to verify the effectiveness of the LBP-HF feature.
(a) (b) (c)
Figure 15.Another example to verify the effectiveness of the LBP-HF feature.(a) Image. (b) Uniform LBP
histogram. (c) LBP-HF histogram
2.2.3.Data Fusion and Matching
In this study, we utilize Bhattacharyya distance[12]to measure the similarity between the trained
and test patterns that are described with the LBP-HF texture description and polar color histogram.
Bhattacharyya distance measurement shown in Eq. (8) can be used to measure the similarity
between two discrete probability distributions.

Signal & Image Processing : An International Journal (SIPIJ) Vol.6, No.1, February 2015
dXy �
where, ρX)H+, P+y - � ∑ c'!"%
2.3. Food Quantity Measurement
Forthe inspection of amount of food ingredient
sensor to evaluate the amount of each
information used to determine the
(a)
Figure16. The captured depth information used to determine the amount of
3. EXPERIMENTAL RESULT
In this section, we apply the automatic meal box detection
ingredients identification module to
meal inspection machineis shown
Figure 1
The proposed food quality inspection system
of the Chinese food central kitchen
between customer-made meals orders of the
system's operation module used Intel i5 2.2GHz CPU to analysis the contents of meal box, and it
used the Microsoft Kinect camera in capture module.
Signal & Image Processing : An International Journal (SIPIJ) Vol.6, No.1, February 2015
� %d∑ e1 � ρX)H+, P+y -d+"% ,
c fg∙9gi ∑ fg∙∑ 9gi jgkljgkl
.
ood Quantity Measurement
food ingredient, we use depth information obtained from the depth
sensor to evaluate the amount of eachfood ingredient. Figure 16illustrates the captured depth
determine the amount of food ingredient.
(b)
The captured depth information used to determine the amount of food ingredient.
image. (b) Depth image for (a).
ESULTS
In this section, we apply the automatic meal box detection/locating module and automatic food
ingredients identification module to construct a food qualityinspection system. The
is shown in Figure 18. The operation scenario is shown in Fig
Figure 17.The system operation scenario.
inspection system is implemented on the meal box dispatch conveyor
food central kitchen. It automatically check compliance of the meal box content
made meals orders of the dietician designed. This automated inspection
system's operation module used Intel i5 2.2GHz CPU to analysis the contents of meal box, and it
used the Microsoft Kinect camera in capture module.
Signal & Image Processing : An International Journal (SIPIJ) Vol.6, No.1, February 2015
71
(8)
obtained from the depth
the captured depth
(a) Meal box
module and automatic food
The automatic
Figure 17.
implemented on the meal box dispatch conveyor
t automatically check compliance of the meal box content
utomated inspection
system's operation module used Intel i5 2.2GHz CPU to analysis the contents of meal box, and it

Signal & Image Processing : An International Journal (SIPIJ) Vol.6, No.1, February 2015
Figure 1
The performance of food quality inspection is evaluated with two different meal boxes that are
three and four food ingredients’ partitions
dishes types in the meal box including the
shown in Figure 19.The efficiency
food ingredients identification module
(a)
Figure 19.(a)
Table 1.The efficiency
Test Video Meal box location detect
module
Video 1 (4 vice-dish)
Video 2 (3 vice-dish)
Table 2 illustrates the accuracy
accuracy of meal box detection and
ingredients identification can approach 85%.
Table 2.Accuracy
Test Video
Video 1 (4 vice-dish)
Video 2 (3 vice-dish)
Angle-guide Bar Conveyor
Signal & Image Processing : An International Journal (SIPIJ) Vol.6, No.1, February 2015
Figure 18.Automatic meal inspection machine.
The performance of food quality inspection is evaluated with two different meal boxes that are
partitions. Figure 19 shows two different meal boxes. There are 9
including the one main dishes and 3 or 4 vice-dishes, which are
efficiency of the meal box location detection and locating
identification module is listed in Table 1.
(b)
(a) 4 vice-dish meal box. (b) 3 vice-dish meal box.
fficiency analysis of the meal box detection and locating.
Meal box location detect
module(1 box)
food ingredients
identification module
(1 box)
AVG. time for
meal box
10.16 ms 116.44ms 126.60 ms
9.8 ms 95 ms 114.8 ms
the accuracy analysis of the proposed food quality inspection system
accuracy of meal box detection and locating is higher than 85% and the accuracy of food
identification can approach 85%.
ccuracy analysis for the food quality inspection system.
Meal box location
detect module
food ingredients
identification module
85.3 % 82.1 %
89.6 % 89.3 %
Meal Box
Glare Shield Tunnel
2D / Depth Camera
Signal & Image Processing : An International Journal (SIPIJ) Vol.6, No.1, February 2015
72
The performance of food quality inspection is evaluated with two different meal boxes that are
shows two different meal boxes. There are 9
es, which are
ion and locating module and
AVG. time for one
meal box
126.60 ms
114.8 ms.
analysis of the proposed food quality inspection system. The
is higher than 85% and the accuracy of food
food ingredients
identification module
Meal Box Glare Shield Tunnel 2D / Depth Camera
Signal & Image Processing : An International Journal (SIPIJ) Vol.6, No.1, February 2015
73
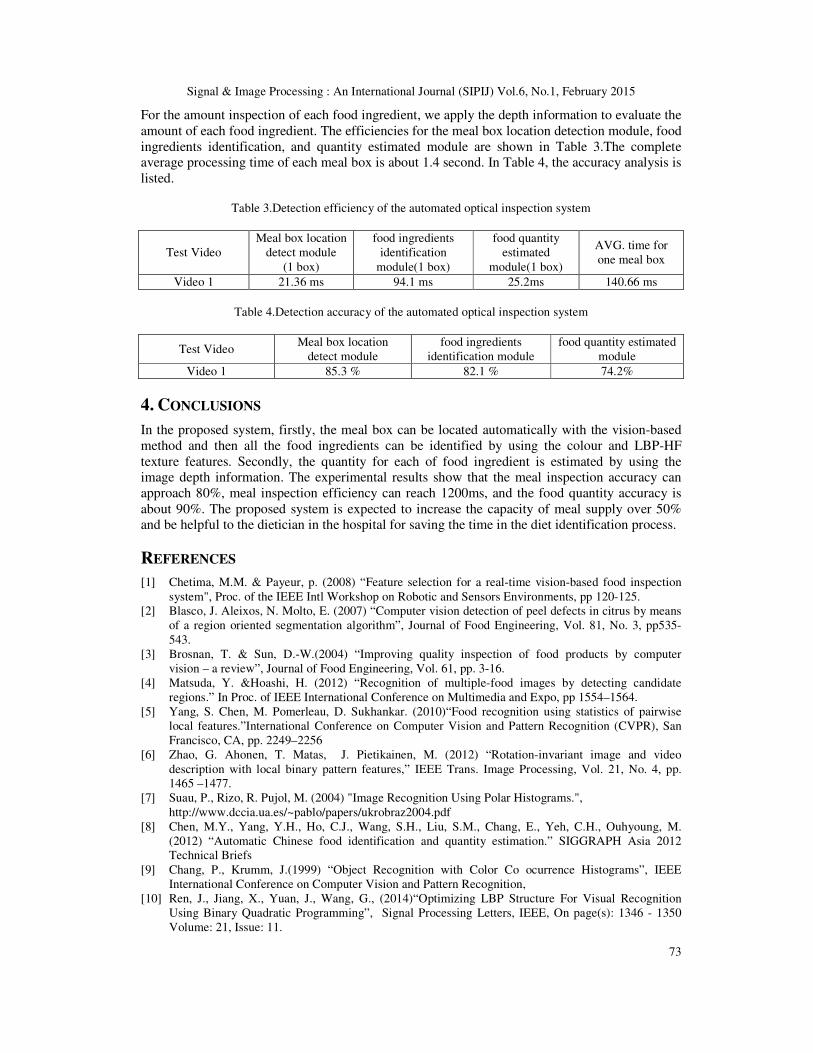
For the amount inspection of each food ingredient, we apply the depth information to evaluate the
amount of each food ingredient. The efficiencies for the meal box location detection module, food
ingredients identification, and quantity estimated module are shown in Table 3.The complete
average processing time of each meal box is about 1.4 second. In Table 4, the accuracy analysis is
listed.
Table 3.Detection efficiency of the automated optical inspection system
Test Video
Meal box location
detect module
(1 box)
food ingredients
identification
module(1 box)
food quantity
estimated
module(1 box)
AVG. time for
one meal box
Video 1 21.36 ms 94.1 ms 25.2ms 140.66 ms
Table 4.Detection accuracy of the automated optical inspection system
Test Video Meal box location
detect module
food ingredients
identification module
food quantity estimated
module
Video 1 85.3 % 82.1 % 74.2%
4. CONCLUSIONS
In the proposed system, firstly, the meal box can be located automatically with the vision-based
method and then all the food ingredients can be identified by using the colour and LBP-HF
texture features. Secondly, the quantity for each of food ingredient is estimated by using the
image depth information. The experimental results show that the meal inspection accuracy can
approach 80%, meal inspection efficiency can reach 1200ms, and the food quantity accuracy is
about 90%. The proposed system is expected to increase the capacity of meal supply over 50%
and be helpful to the dietician in the hospital for saving the time in the diet identification process.
REFERENCES
[1] Chetima, M.M. & Payeur, p. (2008) “Feature selection for a real-time vision-based food inspection
system", Proc. of the IEEE Intl Workshop on Robotic and Sensors Environments, pp 120-125.
[2] Blasco, J. Aleixos, N. Molto, E. (2007) “Computer vision detection of peel defects in citrus by means
of a region oriented segmentation algorithm”, Journal of Food Engineering, Vol. 81, No. 3, pp535-
543.
[3] Brosnan, T. & Sun, D.-W.(2004) “Improving quality inspection of food products by computer
vision – a review”, Journal of Food Engineering, Vol. 61, pp. 3-16.
[4] Matsuda, Y. &Hoashi, H. (2012) “Recognition of multiple-food images by detecting candidate
regions.” In Proc. of IEEE International Conference on Multimedia and Expo, pp 1554–1564.
[5] Yang, S. Chen, M. Pomerleau, D. Sukhankar. (2010)“Food recognition using statistics of pairwise
local features.”International Conference on Computer Vision and Pattern Recognition (CVPR), San
Francisco, CA, pp. 2249–2256
[6] Zhao, G. Ahonen, T. Matas, J. Pietikainen, M. (2012) “Rotation-invariant image and video
description with local binary pattern features,” IEEE Trans. Image Processing, Vol. 21, No. 4, pp.
1465 –1477.
[7] Suau, P., Rizo, R. Pujol, M. (2004) "Image Recognition Using Polar Histograms.",
http://www.dccia.ua.es/~pablo/papers/ukrobraz2004.pdf
[8] Chen, M.Y., Yang, Y.H., Ho, C.J., Wang, S.H., Liu, S.M., Chang, E., Yeh, C.H., Ouhyoung, M.
(2012) “Automatic Chinese food identification and quantity estimation.” SIGGRAPH Asia 2012
Technical Briefs
[9] Chang, P., Krumm, J.(1999) “Object Recognition with Color Co ocurrence Histograms”, IEEE
International Conference on Computer Vision and Pattern Recognition,
[10] Ren, J., Jiang, X., Yuan, J., Wang, G., (2014)“Optimizing LBP Structure For Visual Recognition
Using Binary Quadratic Programming”, Signal Processing Letters, IEEE, On page(s): 1346 - 1350
Volume: 21, Issue: 11.
Signal & Image Processing : An International Journal (SIPIJ) Vol.6, No.1, February 2015
74
[11] Ojala, T., Pietik¨ainen, M., M¨aenp¨a¨a, T.(2002)“Multi resolution gray-scale and rotation invariant
texture classification with local binary patterns.” IEEE Transactions onPattern Analysis and Machine
Intelligence 24(7), 971–987
[12] F. Aherne, N. Thacker and P. Rockett,(1998)“The Bhattacharyya Metric as an Absolute Similarity
Measure for Frequency Coded Data,” Kybernetika, vol. 34, no. 4, pp. 363-368.
[13] M.R. Chandraratne, D. Kulasiri, and S. Samarasinghe,(2007) “Classification of Lamb Carcass Using
Machine Vision: Comparison of Statistical and Neural Network Analyses”, Journal of Food
Engineering, vol. 82, no. 1, pp. 26-34.
[14] Aleixos, N., Blasco, J., &Moltó, E. (1999). “Design of a vision system for real-time inspection of
oranges.”In VIII national symposium on pattern recognition and image analysis. Bilbao, Spain.pp.
387–394
Recommended