AUTHORITY’S MONITORING REPORT 2017
Covering the period 1 April 2016 - 31 March 2017

Contents
Chapter
Section Page
Executive Summary 1
1 Introduction
3
2 The South Gloucestershire Context Introduction 7
Demographic Structure 8
Society and Communities 9
Labour Market Characteristics 10
Housing and the Built Environment 11
Transport and Accessibility 12
3 Plans and Policies Planning Policy Context 14
Progress of Local Development Document Preparation
14
4 4.1 Economy 15
4.2 Social 29
4.3 Environment 45
5 Monitoring the Joint Waste Core Strategy (JWCS)
Introduction Recycling / Composting Recovery Landfill Municipal Waste Management Map of Major Waste Facilities
59 60 61 62 63 65
6 Duty to Co-operate
66
Appendices
A. Housing Trajectory
B. Commentary on expected housing completions 2017
C. Policies, Sites and Places Plan: Future monitoring indicators

The South Gloucestershire Local Authority area

1
Executive Summary
This annually produced Authority’s Monitoring Report (AMR) by South Gloucestershire Council monitors the performance of the Council’s planning policies, and sets out progress of the Council’s planning documents. This is the thirteenth AMR published by South Gloucestershire Council and covers the monitoring year of 1 April 2016 to 31 March 2017. On 8th November the Council adopted its Policies, Sites and Places (PSP) Plan. The PSP Plan replaces the ‘saved’ policies of both the South Gloucestershire Local Plan 2006 (SGLP) and the South Gloucestershire Minerals and Waste Local Plan 2002. Indicators for policies contained within the adopted PSP will be monitored in future AMRs when a full monitoring years’ worth of data is available. Details for future plan monitoring can be found in section 14 of the adopted PSP Plan and features as an appendix. The 2017 publication of the AMR continues, as in previous years to monitor policies contained within the Core Strategy (2013), South Gloucestershire Local Plan 2006 (SGLP) and the South Gloucestershire Minerals and Waste Local Plan 2002 due to the monitoring period in which it covers (April 2016 – March 2017). This executive summary highlights some of the key findings for this monitoring period. An Economic Role
As of the 2016/2017 monitoring year there is 318.37ha of available employment land
in South Gloucestershire. This monitoring period saw an increase in the availability of
B1a, B2 and B8 land, little change in B1b and B1c and a decrease in mixed
employment uses.
This monitoring year has seen a loss of retail floorspace across the district, primarily as
a result of three main developments: The demolition of the Co-Op / Poundstretcher
store in Kingswood to allow for the construction of a new Lidl store; the change of
use of part the former B and Q store in Stoke Gifford to a gym; and the change of
use of part of the Wildings store in Thornbury to a restaurant.
7.9% of all A1 units in town centres across the District were vacant. This represents a
decrease of 0.7% in the A1 vacancy rate recorded in August 2016 (8.6%) and the
lowest vacancy rate in the last seven years. Filton had the highest A1 vacancy rate
(14.3%) which equates to 3 vacant A1 units but also the most significant decrease
compared to the previous monitoring year. Both Emersons Green and Bradley Stoke
had no vacant A1 units (0%).
A Social Role 1,630 new homes completed in 2016/2017, the highest number since the 1991/1992
monitoring year. 786 (48%) of which were on previously developed (brownfield) land 90% of completions were within the established urban areas of the East (35%) and
North (33%) fringes of Bristol and the towns of Yate/Chipping Sodbury (12%) and Thornbury (12%), thereby demonstrating housing delivery in accordance with the Council’s adopted Core Strategy.
28% of all residential development comprised of flats (473 homes). This represents the second highest number of flats built in any year since 2009/2010.
360 ‘Affordable’ Homes were delivered of which 339 were new build 53% of which were in the urban areas of the North and East Fringes of Bristol. Of the 360 homes,

2
237 were for social rent, 70 were for affordable rent, 53 was for intermediate affordable (4 intermediate rent and 49 shared ownership).
South Gloucestershire 5 year housing land supply at December 2017 is confirmed as 4.66 years. This represents an improvement on the figure reported in the 2015/2016 monitoring year. This follows work that has been completed with consultants (BNP Paribas) to independently verify and finalise the Council’s 2017 Housing Trajectory.
The Council has published its Brownfield Land Register on its website. The 2017
Brownfield Land Register comprises of two parts:
o Part one shows sites within the district that have planning permission on
brownfield land, that are yet to be completed but will commence within five
years. In 2017 part one of the register contains 73 sites, with potential to
deliver 5,433 new homes.
o Part two of the Brownfield Land Register is required to set out sites which the
council considers “permission in principle” would be suitable to grant. At this
time Part Two does not contain any sites.
An Environmental Role
There has been no change to the Green Belt (GB) area in South Gloucestershire in the 2016/2017 monitoring year.
The numbers of Local Sites has increased from 2015/2016 monitoring year with four new SNCIs and fourteen new RIGS adopted by the Council as recommended by the Local Sites Partnership and Avon RIGS Group. All other areas of biodiversity importance have remained the same
For full details including data sources please refer to the relevant sections of the AMR
3
1. Introduction
1.1 The Authority’s Monitoring Report (AMR), previously referred to as the Annual Monitoring Report is published each December. The AMR aims to show how the Council’s planning policies have been implemented for the previous financial year (1 April – 31 March) and how the Council’s planning documents are progressing. 1.2 The planning reforms set out in the Localism Act 2011 removed the duty to submit monitoring reports to the Secretary of State annually. However, the requirement to publish this information for the public in no more than yearly intervals still exists. On 30 March 2011 all Local Authorities received a letter from the Government1 announcing the withdrawal of guidance2 on local plan monitoring, allowing local authorities to choose which targets and indicators they include in their monitoring report. 1.3 The Council is committed to ensuring that the effectiveness of its planning policies are monitored though a process of plan, monitor and manage. The AMR is an essential tool in this process. 1.4 This is the thirteenth AMR prepared by South Gloucestershire Council; it covers the period 1 April 2016 to 31 March 2017 and builds on data presented in previous AMRs.
Development Plan Provision
1.5 The Council adopted the Core Strategy on 11th December 2013. The Core Strategy presents 24 generic and 12 place based polices to address key local issues and guide development in the period to 2027. 1.7 The Joint Waste Core Strategy (JWCS) 2011 sets out the four West of England unitary authorities’ aspirations for all levels of waste management until 2026: prevention; reuse; recycling; recovery; and disposal. 1.8 On 8 November the Council formally adopted its Policies, Sites and Places (PSP) Plan. Upon adoption, the PSP Plan replaced the ‘saved’ policies of both the South Gloucestershire Local Plan 2006 (SGLP) and the South Gloucestershire Minerals and Waste Local Plan 2002. The PSP Plan contains detailed planning policies to manage new development, allocates smaller scale (non-strategic) sites for various types of development, and designates Local Green Spaces. The PSP Plan also contains a roll forward of strategic housing allocations but does not contain allocations for new housing development, as this is being taken forward through the new Local Plan. 1.8 The PSP Plan includes new indicators which will monitor its new suite of policies, these indicators will be reported on in future AMRs. This AMR covers the period of the 1st April 2016 – 31st March 2017, therefore no monitoring data is available for the policies adopted through the PSP Plan, which took place after this AMRs reporting period. Future monitoring indicators can be viewed as Appendix C.
1 Letter from the Parliamentary Under Secretary of State, Bob Neill MP 2 Local Development Framework Monitoring : A Good Practice Guide (ODPM, 2005) Annual Monitoring Report FAQs and emerging Best Practice 2004-05 (ODPM, 2006) Regional Spatial Strategies and Local Development Framework: Core Output Indicators – Update 2/2008 (CLG, 2008)

4
1.9 Structure of the AMR
1. Introduction
2. The South Gloucestershire context - sets the scene by presenting key contextual information to provide the wider social, economic and environmental background to the district.
3. Plans and Policies – sets out the planning policy context in South Gloucestershire and includes information relating to the council’s Local Plan delivery programme (previously the Local Development Scheme) including progress against key milestones.
4. Development in South Gloucestershire – monitors the policies in the adopted South Gloucestershire Local Plan through a range of indicators. The refreshed AMR document focuses around the three important roles for the planning system in achieving sustainable development set out in the National Planning Policy Framework (para 7):
an economic role – contributing to building a strong, responsive and competitive economy;
a social role – supporting strong, vibrant and healthy communities; and an environmental role – contributing to protecting and enhancing our
natural, built and historic environment. 5. Monitoring the Joint Waste Core Strategy (JWCS) – monitors the policies in the
Joint Waste Core Strategy through the suite of indicators set out in the document.
6. Planning strategically across boundaries - sets out details relating to the Duty to Co-operate.
1.10 The AMR looks at policy performance, and its context. Examining what has happened in the area in the past helps to identify key challenges and opportunities for future local planning policy.
Types of indicator monitored in this report
1.11 As set out at paragraphs 1.2, local planning authorities can now choose which targets and indicators they include in their monitoring report. The indicators in this report are regularly reviewed in order to ensure that they continue to be the most effective measures to assess the performance of Local Plan policies. 1.12 This report makes reference to, and reports on: changes in the wider social, economic and environmental context; assesses the success of the Local Plan; ensures the components of the Local Plan are updated to reflect changing circumstances nationally, within the sub-region and locally. 1.13 Indicators have also been chosen by South Gloucestershire Council to help to monitor characteristics and issues which are important in the area locally.

5
Sustainability Appraisal and Significant Effect Indicators
1.14 European regulations on Strategic Environmental Assessment (SEA), as incorporated into government guidance on the Sustainability Appraisal of Local Development Documents, state that Local Authorities must predict, assess and monitor any significant environmental effects arising from their emerging Development Plans. This involves the identification of ‘Significant Effects Indicators’, through the SA process. These enable a comparison to be made between the predicted effects of policies on society, the environment, and the economy, and the actual effects measured during implementation of the policies. 1.15 South Gloucestershire Council’s Sustainability Appraisal (SA) Scoping report was approved in March 2008 and set out how SAs would be carried out for Development Plan Documents (DPDs) and Supplementary Plan Documents (SPDs). It also sets out proposed indicators to monitor the effects of the implementation of Development Plan Documents. 1.16 The Council has since updated the proposed SA/SEA Monitoring Framework. This was published in Appendix 12 of the December 2011 SA Report that accompanied the Post-Submission Changes version of the Core Strategy. Most of the indicators identified in that framework are monitored within this AMR. 1.17 In view of the time that had elapsed since 2008, the planning reforms introduced by the Government since 2010 and lessons learnt in the delivery of SA work, it was considered appropriate to review the 2008 report, by updating the review of relevant plans and programmes and amending the SA Framework objectives. An updated Scoping Report was subject to statutory consultation with Natural England, the Environment Agency and English Heritage and was published alongside the Draft Policies, Sites and Places Plan in summer 2014. 1.18 As the Local Plan process evolves, the Council will continue to develop and refine its SA Indicators. A new Scoping Report was prepared in 2017 and subject to consultation in September-October 2017. Progress will be reported in future AMRs.
Reporting on the Local Plan Delivery Programme
1.19 AMRs are expected to report upon whether the milestones or targets in the Local Plan Delivery Programme (formerly known as the Local Development Scheme), are on track. This information is contained in Chapter 3.
Annual Monitoring Report linkages
1.20 The data contained within this AMR is drawn from, and complements, a range of council strategies and other policy areas, notably South Gloucestershire’s 2016 Sustainable Community Strategy (SCS). 1.21 Through the Joint Planning Data Group, work has been carried out j in order to develop a consistent approach to monitoring.
6
Impact of the economic circumstances
1.22 The Council is committed to sustainable economic growth and delivery. The indicators monitored provide a basis upon which the impacts of the economic circumstances on South Gloucestershire can be understood. Future AMRs will continue to monitor this impact and how effectively South Gloucestershire is responding.
Planning Strategically Across Boundaries
1.23 The Localism Act 2011 established a new duty to co-operate. This relates to the sustainable development or use of land that would have a significant impact on at least two LPA areas. The National Planning Policy Framework sets out the strategic issues where co-operation might be appropriate and provides guidance on planning strategically across boundaries. The duty also applies to a number of public bodies in addition to councils who are required to co-operate on issues of common concern to develop sound plans. The Council reports on how the duty is being taken forward through the AMRs. 1.24 The West of England LEP prepares a Duty to Co-operate schedule which is updated on an ongoing basis. The schedule is a tool to ensure that strategic planning issues affecting more than one area are identified and the processes for taking these issues forward are defined and any outcomes delivered. It provides a framework to ensure effective co-operation throughout the plan making process. The schedule ensures that strategic issues are concisely and consistently recorded, and will be regularly monitored and updated. 1.25 Further details about how the Council is working with the other West of England authorities and other agencies regarding the Duty to Co-operate are set out in Chapter 6.

7
2. The South Gloucestershire Context
Contextual indicators provide the social, environmental and economic background against which the effects of policies can be monitored. The contextual indicators in this report are based on the key characteristics of, and issues facing South Gloucestershire.
The data presented is the latest available and where possible time series trends are included. Where possible these indicators are aligned with Council’s corporate sustainability indicators and other key indicators from related policy areas.
The key contextual indicators present a profile of South Gloucestershire that can be assessed over time, under the following six themes:
Demographic structure; Society and communities; Labour market characteristics; Housing and the built environment; Transport and accessibility; and Key environmental assets.
Some indicators also appear within the body of the main report.

8
Demographic structure
Population… The population of South Gloucestershire is estimated to be 277,600 (ONS 2016 mid-year population estimates). Age structure… The broad age structure of the population is very similar to the national average, however in comparison to the national average, South Gloucestershire has: • A lower proportion of the population in the 20-39 age group (1.2% below the national average) • A higher proportion of the population in both the 40-54 and 70-84 age groups (1.0% and 0.7% above the national average respectively). Further details can be found at SGC Statistics
Population change… South Gloucestershire has seen substantial levels of development over the past half century the population has grown by 31,600 in the last 15 years and 55,500 in the last 25.
Source: Population estimates (Office of National Statistics – via NOMIS) Further details can be found at SGC Statistics
3 The BME population comprises residents from the following ethnic groups: Mixed: White and Black Caribbean, Mixed: White and Black African, Mixed: White and Asian, Mixed: Other Mixed, Asian or Asian British: Indian, Asian or Asian British: Pakistani, Asian or
Components of population change… Over the most recent year for which population estimates are available (2015-2016), the ONS estimate that the population of South Gloucestershire has increased by 3,000 (1.1%). This change can be attributed to both natural change (i.e. births minus deaths) of 900 people and ‘net migration and other changes’ of 2,000 people. Net international migration accounted for 700 residents, whilst ‘net internal migration’ accounted for 1,200 (meaning that 1,200 more people moved into South Gloucestershire than moved out of the district to other areas in England). See graph below:
Source: Population estimates (Office of National Statistics – via NOMIS) Further details can be found here SGC Statistics
Ethnic composition… According to the 2011 Census; 13,193 (5.0%), of South Gloucestershire’s population are of Black and minority ethnic origin (BME)3. The estimates suggest that the number of BME residents has increased significantly from the proportion reported in the 2001 Census (2.4%); however these estimates suggest that the South Gloucestershire rate remains significantly lower than England and Wales average (14%). Further details can be found here SGC Statistics
Asian British: Bangladeshi, Asian or Asian British: Other Asian, Black or Black British: Black Caribbean, Black or Black British: Black African, Black or Black British: Other Black, Chinese or Other Ethnic Group: Chinese, Chinese or Other Ethnic Group: Other

9
Population projections… The most recent official population projections (the 2014-based ONS Sub-National Population Projections) suggest that the population of South Gloucestershire will rise to 330,800 in 2039 representing a 21.8% increase on the baseline 2014 mid-year population estimate (271,600). Further details can be found at SGC Statistics
Household composition According to the 2011 Census there were 107,538 households in South Gloucestershire, of which: 58.4% (62,847) were ‘couple’ households,
higher than both the national (51.2%) and regional (54.1%) averages.
6.4% (6,975) were ‘lone parent’ households with dependent children, lower than the national (7.1%) average, but higher than the regional (5.9%) average.
Society and Communities Deprivation… The English Indices of Deprivation 2015 is the Government’s latest official measure of deprivation at small area level (LSOA)*. According to this study: South Gloucestershire is the 54th least
deprived Local Authority in England (ranked 273rd out of 326 authorities). The authority is in the 5th national deprivation quintile, which means it is one of the 20% least deprived districts in England.
Compared to other areas in England,
there is little deprivation in the District (only one LSOA falls within the 20% most deprived areas in England), however there are sub-ward pockets of relative deprivation which tend to be areas with high concentrations of social housing.
South Gloucestershire’s most deprived areas are generally located within the urban wards of Staple Hill, Kings Chase, Patchway, Parkwall and Woodstock.
The Indices of Deprivation 2015 comprises seven different domains which represent different elements of deprivation. South Gloucestershire has the highest concentration of deprived LSOAs in the following domains: ‘Barriers to housing and services domain’
- 17 LSOAs within the most deprived 20% of areas nationally
‘Education, skills and training deprivation’ - where 15 LSOAs are within the most deprived 20% of areas nationally
In South Gloucestershire as a whole, 23,027 residents are ‘income deprived’, and 11,416 residents are ‘employment deprived’. Source: CLG English Indices of Deprivation 2010© Crown Copyright)
Recorded Crime… South Gloucestershire is a safe place to live and recorded crime rates are lower than the regional and national averages. In 2016/17 the total rate of recorded crime in South Gloucestershire was 58.0 crimes per 1,000 residents. This is an increase of 2,121 offences (15.4%) compared to 2015/16 but our crime rate is still lower than the rate for Avon and Somerset, the South West region and England and Wales. Further details can be found at SGC Statistics
Resident satisfaction…
According to the council’s 2016/17 Viewpoint Survey, 81% of respondents to the survey said they were satisfied with their local area as a place to live, including 33% who were very satisfied. Satisfaction with the local area has fluctuated annually over

10
the last four years but has remained at over 80% for every year. Further details can be found at SGC Statistics
Indicators of health… In general, South Gloucestershire is a healthy area. According to the 2011 Census 84.0% of residents considered their health was ‘good’ or “very good”, compared to the national average of 81.4%.
Further details can be found here SGC Statistics
Life Expectancy…
Overall, life expectancy has increased in South Gloucestershire over the last 12 years. Based on the most up to date data, over the last 10 years life expectancy at birth has increased by 2.1 years for men, reaching 81.2 years, and 1.9 years for women rising to 84.7 years. Life expectancy in South Gloucestershire remains significantly higher than the national average for both males and females. Source: Public Health England 2017
Rate of mortality considered preventable…
The rate of mortality considered preventable is an important indicator of the overall health of the population. Between 2013 and 2015, the mortality rate in South Gloucestershire was approximately 145 per 100,000 of the population. The rate of preventable death in South Gloucestershire has declined in line with national trends and has consistently been significantly lower than both the South West and the national average. Source: Public Health England 2017
*Lower Super Output Areas (LSOAs) are a statistical geography
designed by the Office of National Statistics (ONS). They are smaller than electoral Wards so enable a detailed geographical analysis of trends. There are 32,482 LSOAs in England and 162 LSOAs in South Gloucestershire. LSOAs have an average resident population of 1,500 people and contain about 600 households ** These measures relate to the ‘Income Deprivation’ and ‘Employment Deprivation’ Domains, which are comprised of a range of indicators which measure counts for people or families in receipt of means tested benefits.
Labour Market Characteristics
Unemployment rate … From April 2016 to March 2017, the official unemployment rate in South Gloucestershire was 3.3% of the economically active population. This is considerably lower than the corresponding rates for both England (4.8%) and the West of England (3.6%). Source: Annual Population Survey (Office of National Statistics – via NOMIS) Further details can be found at SGC Statistics
Employment rate…
In the year from April 2016 to March 2017, 80.1% of South Gloucestershire’s working age population (those aged 16-64) were in employment. The employment rate locally is considerably higher than the national (74.4%) and regional averages (78.0%). The employment rate in South Gloucestershire compares favourably to the 151 other unitary and county authorities in England (being ranked 18th after North Somerset, Gloucestershire and Swindon). Source: Annual Population Survey (Office for National Statistics - via NOMIS) Further details can be found at SGC Statistics
Earnings… In 2016 the average annual earnings for a full-time worker living in South Gloucestershire was £29,752*, representing a 2.5% increase on the 2015 figure (£29,031*). *Median gross annual pay (residents) for a full time worker. Source: Annual Survey of Hours and Earnings (Office of National Statistics) Further details can be found at SGC Statistics

11
Qualifications and Education Qualifications of working age residents…
In 2016, over a third (37.1%) of people aged 16 - 64 living in South Gloucestershire were educated to NVQ Level 4 or above*. This is in line with the national average (37.9%) and lower than the West of England average (43.8%). Only 4.3% of South Gloucestershire’s population aged 16 to 64 have no qualifications, which is considerably lower than the national figure (7.8%). Further details can be found at SGC Statistics *NVQ Level 4 is equivalent to having a HND, Degree and Higher Degree level qualifications or equivalent. Source: Annual Population Survey (Office of National Statistics – via NOMIS)
Attainment 8 score of children at the end of their secondary education In 2016, the Department for Education’s new secondary school accountability system was implemented*. Attainment 8 has been introduced to measure the achievement of a pupil across eight qualifications including English and mathematics. In 2016, the Attainment 8 score for pupils in South Gloucestershire was 47.9 and the national figure was 48.5 (all schools). *The education system is currently undergoing various reforms which are taking place gradually until 2019. For further information visit the Department for Education pages which outline the reforms taking place: https://www.gov.uk/government/publications/your-qualification-our-regulation-gcse-as-and-a-level-reforms
Proportion of 16-18 year olds not in education, employment or training (NEET)… In 2016, the proportion of 16 to 18 year olds who were known to be not in education, employment or training in South
Gloucestershire was 1.7% which is lower than the national average (2.7%). Source: South Gloucestershire Council, Children, Adults and Health Further details can be found at SGC Statistics
Housing and the built environment
Similar to many areas in the South West, South Gloucestershire is an area where high demand for housing has impacted on housing affordability. Housing tenure… According to the 2011 Census: 34.5% (37,050) own homes outright; 40.5% (43,536) are buying with a
mortgage; 8.0% (8,570) rent from registered social
landlords; 12.2% (13,124) rent from private
landlords, and; 1.9% (2,063) rent from the local
authority Further details can be found here SGC Statistics
Average house price…
In December 2016, the average price paid for a residential property in South Gloucestershire was £243,000*, increasing from £230,000* in 2015. *Median house price for all properties sold in 2002-2016 (ONS, House Price Statistics for small areas) Further details can be found at SGC Statistics

12
Quality and assets of the built environment… South Gloucestershire has a good quality historic built environment. Policies in the Core Strategy and recently adopted Policies, Sites and Places (PSP) Plan are aimed at protecting these assets for the future. Within the District there are: • 2085 Listed building entries of which 2% are Grade I, 6% are Grade II*, and 92% are Grade II. • Over 1,470 locally listed buildings • 38 Scheduled monuments • 30 Conservation Areas • 8 registered parks and gardens • 1 battlefield Source: South Gloucestershire Council Strategic Planning Policy and Specialist Advice Team
Transport & Accessibility
Rate of traffic growth…
In 2016, there was a 3.0% reduction in average speed when compared to the previous year, suggesting that there has been an increase in congestion in South Gloucestershire. General traffic levels within South Gloucestershire marginally increased in 2015/16, but again over the period from 2006/7 to 2015/16 have remained broadly constant.
Please note: the data has only been collected for 2 years, therefore it is a little early to draw conclusions from the figures.
Sources: Department for Transport and South Gloucestershire Council
Car ownership… South Gloucestershire has higher than average car ownership and usage. According to the 2011 Census: 86.9% of households have access to at
least one car or van, compared to 74.2% nationally.
There were 158,289 cars or vans in South Gloucestershire, an average of 1.47 cars or vans per household.
In general terms, households without a car tend to be located in parts of the district which are more urban in character, such as Kingswood and Patchway. Further details can be found here SGC Statistics
Accessibility of key services… According to the Indices of Deprivation 2015, South Gloucestershire is particularly deprived in terms of ‘barriers to housing and services’ domain’. The highest rates of deprivation in this domain are generally found in rural areas due to the road distances to services and higher than average house prices. This is largely due to the semi-rural nature of much of the authority area. 17 LSOA’s within the district fall within the 20% most deprived areas in England. Further details can be found here SGC Statistics

13
Key Environmental Assets Much of South Gloucestershire’s countryside and coastline of the Severn Estuary is protected by national and international environmental designations. Work is ongoing to continue to actively protect areas of local wildlife importance, and designate areas for environmental conservation. Within South Gloucestershire there are: Greenbelt… 23,026 ha – approximately 43% of the
total area of the District. Local Nature Reserves (LNR)… 9 LNRs making up a total of 109ha.
AONB… Cotswolds AONB (area within South
Gloucestershire) 11,800ha. SSSIs… Severn Estuary SSSI (also SPA/RAMSAR
and SAC) – 4,104ha Other SSSIs – 22 sites making up 553ha
RIGS… 67 Regionally Important Geological
Sites SNCIs… 273 Sites of Nature Conservation
Importance.
14
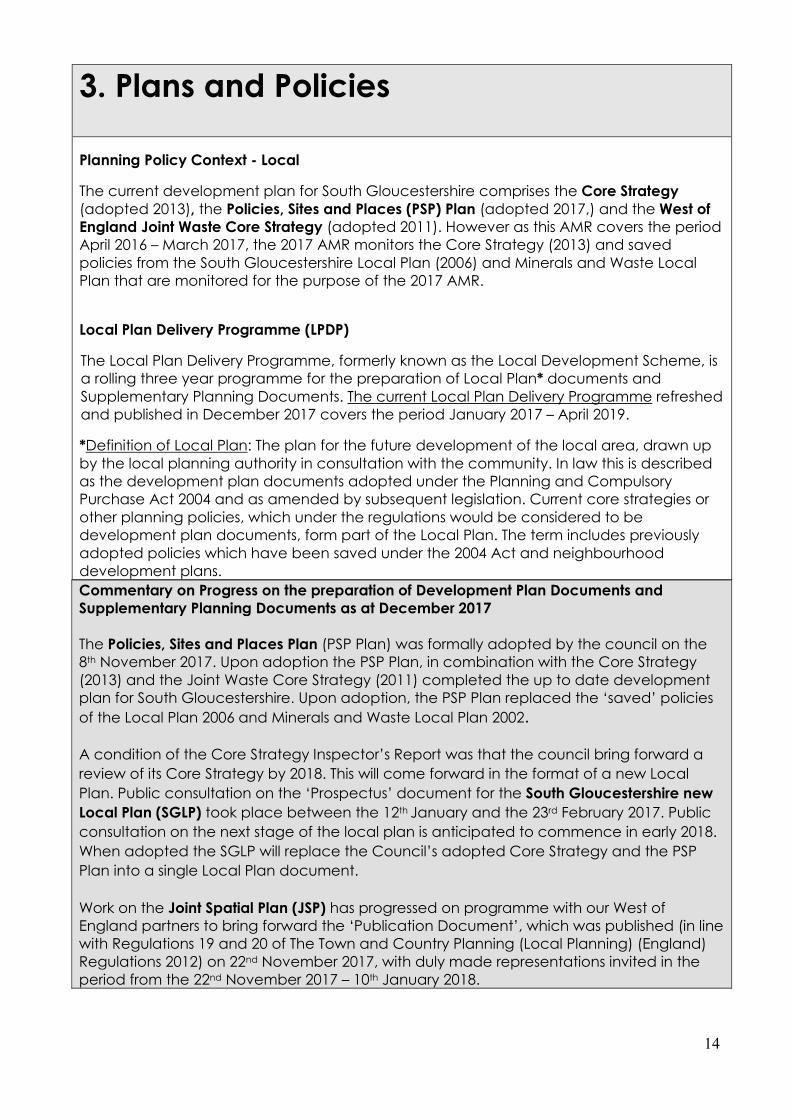
Commentary on Progress on the preparation of Development Plan Documents and Supplementary Planning Documents as at December 2017 The Policies, Sites and Places Plan (PSP Plan) was formally adopted by the council on the 8th November 2017. Upon adoption the PSP Plan, in combination with the Core Strategy (2013) and the Joint Waste Core Strategy (2011) completed the up to date development plan for South Gloucestershire. Upon adoption, the PSP Plan replaced the ‘saved’ policies
of the Local Plan 2006 and Minerals and Waste Local Plan 2002. A condition of the Core Strategy Inspector’s Report was that the council bring forward a
review of its Core Strategy by 2018. This will come forward in the format of a new Local
Plan. Public consultation on the ‘Prospectus’ document for the South Gloucestershire new
Local Plan (SGLP) took place between the 12th January and the 23rd February 2017. Public
consultation on the next stage of the local plan is anticipated to commence in early 2018.
When adopted the SGLP will replace the Council’s adopted Core Strategy and the PSP
Plan into a single Local Plan document.
Work on the Joint Spatial Plan (JSP) has progressed on programme with our West of England partners to bring forward the ‘Publication Document’, which was published (in line with Regulations 19 and 20 of The Town and Country Planning (Local Planning) (England) Regulations 2012) on 22nd November 2017, with duly made representations invited in the period from the 22nd November 2017 – 10th January 2018.
3. Plans and Policies
Planning Policy Context - Local
The current development plan for South Gloucestershire comprises the Core Strategy (adopted 2013), the Policies, Sites and Places (PSP) Plan (adopted 2017,) and the West of England Joint Waste Core Strategy (adopted 2011). However as this AMR covers the period April 2016 – March 2017, the 2017 AMR monitors the Core Strategy (2013) and saved policies from the South Gloucestershire Local Plan (2006) and Minerals and Waste Local Plan that are monitored for the purpose of the 2017 AMR.
Local Plan Delivery Programme (LPDP) The Local Plan Delivery Programme, formerly known as the Local Development Scheme, is a rolling three year programme for the preparation of Local Plan* documents and Supplementary Planning Documents. The current Local Plan Delivery Programme refreshed and published in December 2017 covers the period January 2017 – April 2019.
*Definition of Local Plan: The plan for the future development of the local area, drawn up by the local planning authority in consultation with the community. In law this is described as the development plan documents adopted under the Planning and Compulsory Purchase Act 2004 and as amended by subsequent legislation. Current core strategies or other planning policies, which under the regulations would be considered to be development plan documents, form part of the Local Plan. The term includes previously adopted policies which have been saved under the 2004 Act and neighbourhood development plans.

15
4.1 Economy
South Gloucestershire has a robust, diverse and vibrant economy which has experienced high job growth rates and low unemployment. The area has many strengths including excellent road and rail connections, the successful key sectors of aerospace engineering, the MOD and the financial services industries, as well as the University of the West of England (UWE) and the large retail area at Cribbs Causeway. New major development at: the Science Park at Emersons Green, part of the Emersons Green Enterprise Area; at Severnside part of the Avonmouth Severnside Enterprise Area; and at the Filton/A38 Enterprise Area, will help to reinforce the local economy.
Core Strategy Objectives
o Ensuring that South Gloucestershire plays its role in making the West of England economy one of the most prosperous, innovative and vibrant in Europe, by providing a sufficient range of employment land for existing and new businesses of all sizes;
o Providing for the key sectors of advanced engineering, including aerospace and defence; finance and business services; higher and further education; retail; environmental technologies and hi-tech industries;
o Taking opportunities to provide more balanced employment across the district so that every community has access to a range of employment opportunities locally;
o Ensuring provision of appropriate communication technologies, such as Broadband; and
o Enhancing town centre vitality and viability.
Relevant Core Strategy Policies
CS11 – Distribution of Economic Development Land; CS12 – Safeguarded Areas for Economic Development; CS13 – Non-Safeguarded Economic Development Sites; and CS14 – Town Centres and Retail.

16
Relevant PSP Policies to be monitored in future AMRs
PSP26 Enterprise Areas;
PSP7 B8 Storage and Distribution Areas;
PSP31 Town Centre Uses;
PSP33 Shopping Frontages;
PSP35 Food and Drink Uses (including drive through takeaway facilities); and
PSP36 Telecommunications Infrastructure.
Unless otherwise stated all figures relate to the period 1 April 2016 – 31 March 2017
17
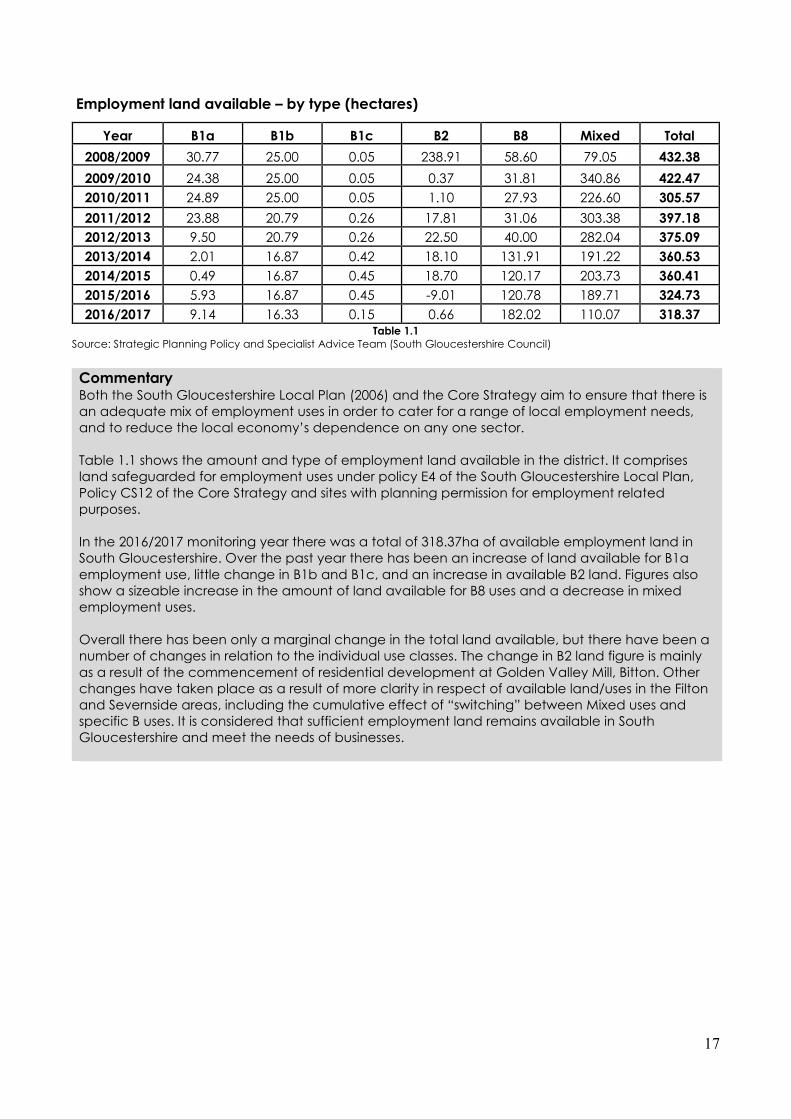
Employment land available – by type (hectares)
Year B1a B1b B1c B2 B8 Mixed Total
2008/2009 30.77 25.00 0.05 238.91 58.60 79.05 432.38
2009/2010 24.38 25.00 0.05 0.37 31.81 340.86 422.47
2010/2011 24.89 25.00 0.05 1.10 27.93 226.60 305.57
2011/2012 23.88 20.79 0.26 17.81 31.06 303.38 397.18
2012/2013 9.50 20.79 0.26 22.50 40.00 282.04 375.09
2013/2014 2.01 16.87 0.42 18.10 131.91 191.22 360.53
2014/2015 0.49 16.87 0.45 18.70 120.17 203.73 360.41
2015/2016 5.93 16.87 0.45 -9.01 120.78 189.71 324.73
2016/2017 9.14 16.33 0.15 0.66 182.02 110.07 318.37 Table 1.1
Source: Strategic Planning Policy and Specialist Advice Team (South Gloucestershire Council)
Commentary Both the South Gloucestershire Local Plan (2006) and the Core Strategy aim to ensure that there is an adequate mix of employment uses in order to cater for a range of local employment needs, and to reduce the local economy’s dependence on any one sector. Table 1.1 shows the amount and type of employment land available in the district. It comprises land safeguarded for employment uses under policy E4 of the South Gloucestershire Local Plan, Policy CS12 of the Core Strategy and sites with planning permission for employment related purposes. In the 2016/2017 monitoring year there was a total of 318.37ha of available employment land in South Gloucestershire. Over the past year there has been an increase of land available for B1a employment use, little change in B1b and B1c, and an increase in available B2 land. Figures also show a sizeable increase in the amount of land available for B8 uses and a decrease in mixed employment uses. Overall there has been only a marginal change in the total land available, but there have been a number of changes in relation to the individual use classes. The change in B2 land figure is mainly as a result of the commencement of residential development at Golden Valley Mill, Bitton. Other changes have taken place as a result of more clarity in respect of available land/uses in the Filton and Severnside areas, including the cumulative effect of “switching” between Mixed uses and specific B uses. It is considered that sufficient employment land remains available in South Gloucestershire and meet the needs of businesses.

18
Total amount of additional employment floorspace – by type (net)
Year B1a B1b B1c B2 B8 Mixed Total
2008/2009 Net (sq.m) 15,788 0 0 16,216 -25,233 1,251 8,022
2009/2010 Net (sq.m) 2,921 0 0 -93,329 46,190 10,100 -34,118
2010/2011 Net (sq.m) 8,491 0 -1,422 1,043 -1,508 0 6,604
2011/2012 Net (sq.m) -2,217 9,152 -550 -256 -12,680 11,922 11,537
2012/2013 Net (sq.m) -3,126 0 26 -1,318 4,269 48,794 48,645
2013/2014 Net (sq.m) -2,715 9,972 224 4,315 -25,465 20,991 7,322
2014/2015 Net (sq.m) 0 0 0 1,408 20,271 -3,392 18,827
2015/2016 Net (sq.m) -5,698 0 0 13,226 -10,737 12,720 9,511
2016/2017 Net (sq.m) -2,300 0 6,845 102 166,109 4,354 175,110 Table 1.2
Source: Strategic Planning Policy and Specialist Advice Team (South Gloucestershire Council)
Commentary
Table 1.2 shows that in the 2016/2017 year, there was a net gain of 175,110 square metres of employment floorspace. There has been a sizable loss of B1a office space in the12 months to April 2017, this however hides a sizeable completion of 3 office buildings at Vertex Park, Emersons Green (3,826 sq.m). The losses have occurred across the district with losses at Parklands, Stoke Gifford (demolition), Aztec West (change of use to health care use), Thornbury (change of use to residential), and Almondsbury (change of use to residential). Within category B1c all completions can be attributed to a single development at Armstrong Way, Yate (6,485 sq.m). In the last 12 months there has been large new gains at Central Park, Severnside with the completion of warehousing for Lidl (51,097 sq.m) and The Range (111,484 sq.m m). Within the Mixed category the majority of new completions in the 12 months to April 2017can be attributed to one site at Armstrong Way, Yate (2,790 sq.m).

19
Total amount of floorspace for ‘town centre uses’
A1 A2 B1a D2 Mixed Total
2008/ 2009
Town Centre Area -955 0 0 0 27,441 26,486
SG Total 2,420 0 15,788 391 28,409 47,008
2009/2010 Town Centre Area 0 0 0 0 0 0
SG Total 2,475 0 2,921 1,808 12,056 19,260
A1 A2 B1a D2 Other Mixed
A3/ A4/A5
Mixed 'A'
Total
2010/2011 Town Centre Area -5,132 0 0 0 0 572 0 -4,560
SG Total 1,050 0 8,491 150 5,028 -79 0 14,640
2011/2012 Town Centre Area 9,873 0 0 0 0 525 0 10,398
SG Total 12,648 0 -2,217 -820 5,319 525 0 15,455
2012/2013 Town Centre Area 4,180 0 0 0 0 0 0 4,180
SG Total -3,820 0 -3,126 299 -723 235 0 -7,135
2013/2014 Town Centre Area 1,482 0 0 0 0 0 0 1,482
SG Total 9,527 0 -2,715 0 9,009 -315 0 15,506
2014/2015 Town Centre Area 743 0 0 0 0 0 0 743
SG Total 263 0 0 24,700 4,518 1,163 1,475 32,119
2015/2016 Town Centre Area 306 0 0 0 7,797 0 0 8,103
SG Total 1,994 -133 -5,698 6,956 26,800* 1,326 0 31,245
2016/2017 Town Centre Area -1,530 0 -858 657 0 -657 0 -2,388
SG Total -5,942 0 -2,300 3,105 0 -657 0 -5,794 Table 1.3
Source: Strategic Planning Policy and Specialist Advice Team (South Gloucestershire Council)
Commentary For the purposes of this indicator, Town Centre Uses are those defined by Use Class Orders:
A1 - Shops; A2 – Financial and Professional Services; B1a – Offices (other than those in a use within Class A2), and; D2 – Assembly and Leisure.
Table 1.3 shows that there has been a loss of A1 floorspace across South Gloucestershire including a loss within the town centres. This loss can be attributed to Thornbury Town Centre a large shop unit has been changed to a restaurant. Outside of the Town Centres the former Co-Op store in Halls Road, Kingswood is undergoing redevelopment, and part of the former B and Q store in Stoke Gifford has been changed to a gym and fitness centre. Losses of B1a uses is also shown in Table 1.2 above, see supporting commentary for explanation of the loss. As well as these changes, 2016/2017 saw the completion of the change of use of a vacant first floor A3 unit to a nursery/play centre at the Yate Riverside development. For the purpose of this analysis a change of use from A3 to D2 at Yate Riverside in 2016/2017 has been include in the Town Centre Area

20
Losses of employment land (B use classes) within safeguarded employment areas (net ha)
Year Previous Use Area (ha)
B2 - General Industrial 1.56
2006/2007
Agricultural 0.43
1.99
B1a – Office 0.15
B2 - General Industrial 0.43
Agricultural 0.96
2007/2008 1.54
B2 - General Industrial 0.52
2008/2009 0.52
B2 - General Industrial 0.21
B8 - Storage and Distribution 0.07
2009/2010 0.28
B1a – Office 0.01
B1/B2/B8 - Mixed 0.38
B8 - Storage and Distribution 0.18
2010/2011 0.57
B1a – Office 0.63
B2 - General Industrial 1.58
B8 - Storage and Distribution 2.77
2011/2012 4.98
B2 - General Industrial 0.07 B8 - Storage and Distribution 0.14 2012/2013 0.21
B1a – Office 0.96 B1 – Mixed 0.23
2013/2014 1.19
B8 – Storage and Distribution 0.36 Mixed B 1.67
2014/2015 2.03
B1a – Office 2.01 B8 – Storage and Distribution 2.21
2015/2016 4.22
B1a – Office 1.83 B1 – General 0.28 B8 – Storage and Distribution 0.11
2016/2017 2.22 Table 1.4
Source: Strategic Planning Policy and Specialist Advice Team (South Gloucestershire Council)
Commentary The Council aims to protect safeguarded employment areas from developments for non-employment uses. In 2016/2017, 2.22ha of employment land within safeguarded employment areas (previously under SGLP policy E4 and now under CS policy CS12) was lost to non-B land uses. Although as in previous years some of this employment land has been lost from traditional B-use employment to uses still providing employment opportunities such as leisure uses, it is worth noting that 1.79ha of the losses have been as a result of demolition of an office building in Stoke Gifford.
21
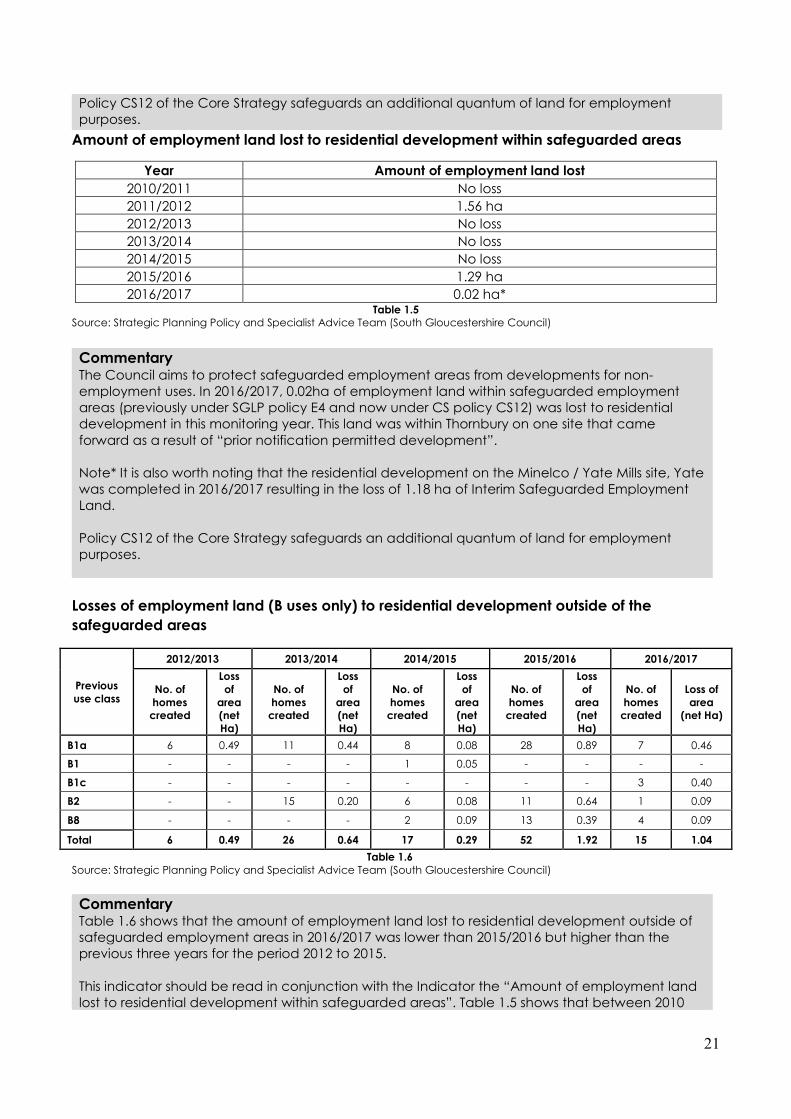
Amount of employment land lost to residential development within safeguarded areas
Year Amount of employment land lost
2010/2011 No loss
2011/2012 1.56 ha
2012/2013 No loss
2013/2014 No loss
2014/2015 No loss
2015/2016 1.29 ha
2016/2017 0.02 ha* Table 1.5
Source: Strategic Planning Policy and Specialist Advice Team (South Gloucestershire Council)
Losses of employment land (B uses only) to residential development outside of the
safeguarded areas
Previous use class
2012/2013 2013/2014 2014/2015 2015/2016 2016/2017
No. of homes
created
Loss of
area (net Ha)
No. of homes
created
Loss of
area (net Ha)
No. of homes
created
Loss of
area (net Ha)
No. of homes
created
Loss of
area (net Ha)
No. of homes
created
Loss of area
(net Ha)
B1a 6 0.49 11 0.44 8 0.08 28 0.89 7 0.46
B1 - - - - 1 0.05 - - - -
B1c - - - - - - - - 3 0.40
B2 - - 15 0.20 6 0.08 11 0.64 1 0.09
B8 - - - - 2 0.09 13 0.39 4 0.09
Total 6 0.49 26 0.64 17 0.29 52 1.92 15 1.04
Table 1.6 Source: Strategic Planning Policy and Specialist Advice Team (South Gloucestershire Council)
Policy CS12 of the Core Strategy safeguards an additional quantum of land for employment purposes.
Commentary The Council aims to protect safeguarded employment areas from developments for non-employment uses. In 2016/2017, 0.02ha of employment land within safeguarded employment areas (previously under SGLP policy E4 and now under CS policy CS12) was lost to residential development in this monitoring year. This land was within Thornbury on one site that came forward as a result of “prior notification permitted development”. Note* It is also worth noting that the residential development on the Minelco / Yate Mills site, Yate was completed in 2016/2017 resulting in the loss of 1.18 ha of Interim Safeguarded Employment Land. Policy CS12 of the Core Strategy safeguards an additional quantum of land for employment purposes.
Commentary Table 1.6 shows that the amount of employment land lost to residential development outside of safeguarded employment areas in 2016/2017 was lower than 2015/2016 but higher than the previous three years for the period 2012 to 2015. This indicator should be read in conjunction with the Indicator the “Amount of employment land lost to residential development within safeguarded areas”. Table 1.5 shows that between 2010

22
Amount of completed retail development (sq.m net floor space)
Year A1 + A2
2004/2005 6,802
2005/2006 13,070
2006/2007 2,304
2007/2008 8,488
2008/2009 -45
2009/2010 2,475
2010/2011 -4,082
2011/2012 13,173
2012/2013 -3,820
2013/2014 9,527
2014/2015 263
2015/2016 1,861
2016/2017 -5,942
Table 1.7 Source: Strategic Planning Policy and Specialist Advice Team (South Gloucestershire Council)
and 2017 there was 2.87 Ha of land lost within areas safeguarded for employment to residential use. In comparison, 10.05 Ha of traditional “B –use” employment land has been lost to residential development outside of safeguarded employment areas during the same period. Where proposals are not Permitted Development, current policy seeks to ensure that the amount of employment land lost from within safeguarded areas remains minimal, and that any loss of employment land to residential development outside of employment areas is in such a manner that it does not compromise the balance between housing need and employment provision within communities. It also reinforces the Council’s policy position – that the Core Strategy safeguards more employment land – where this will help retain land in employment use to support mixed and balanced communities.
Commentary Table 1.7 shows that, in the 2016/2017 monitoring year there has been a loss of retail floorspace across the district. This was primarily as a result of three main developments: The demolition of the Co-Op / Poundstretcher store in Kingswood to allow for the construction of a new Lidl store; the change of use of part the former B&Q store in Stoke Gifford to a gym; and the change of use of part of the Wildings store in Thornbury to a restaurant.

23
Amount of total primary frontage in LP Policy RT9 town and District centres plus amount and proportion of primary frontage in A1 uses ***
Total primary frontage
(metres) Amount in A1 use
(metres) % of primary frontage in
A1 use
2008/2009 4,379 3,299 75.3%
2009/2010 4,379 3,304 75.4%
2010/2011 4,329 3,264 75.4%
2011/2012 4,444 3,370 75.8%
2012/2013 4,466 3,331 74.6%
2013/2014 4,466 3,301 73.9%
2014/2015 4,466 3,291 73.7%
2015/2016 4,466 3,228 72.3%
2016/2017 4,448 3,192 71.8% Table 1.8
Source: Strategic Planning Policy and Specialist Advice Team (South Gloucestershire Council)
*** indicates that data used is collected through the annual survey of Town Centres and Retailing undertaken in August each year.
Commentary The Local Plan (SGLP) and the Core Strategy aim to sustain the vitality and viability of South Gloucestershire’s town centres through retaining town centre units in A1 (retail) use. Table 1.8 shows that the percentage of primary frontage in A1 use has dropped slightly from the level reported last year. The change in the total primary frontage reflects that there has been a decrease in the percentage of primary frontage in non-A1 use in Hanham, Staple Hill, Thornbury and Yate. Over the period 2008/09 to 2011/12 the percentage of primary frontage in A1 use remained at over 75%, indicating that policy RT9 of the South Gloucestershire Local Plan was performing well. It is too soon to tell if the drop over the past 5 years is an anomaly or if it is symptomatic of wider issues relating to the changing face of town centres across the UK. However, the percentage of primary frontage still remains over 71%.

24
Percentage of vacant A1 (retail) units in South Gloucestershire’s town centres ***
2010/2011 2011/2012 2012/2013 2013/2014 2014/2015 2015/2016 2016/2017
Chipping Sodbury
1.8 5.6 1.9 1.9 3.7 3.7 5.6
Downend 3.7 3.8 6.5 3.3 6.7 3.4 3.4
Emersons Green 0 0 0 0 0 0 0
Filton 0 5.0 9.5 12.5 16.7 20.0 14.3
Hanham 15.4 10.8 10.8 12.8 18.4 11.8 9.1
Kingswood 19.1 12.1 17.0 16.3 13.1 14.3 12.8
Staple Hill 7.3 4.7 2.4 4.8 4.9 4.8 6.9
Thornbury 9.9 8.2 9.6 8.2 11.0 6.9 6.9
Yate (exc. Station Road)
15.9 19.3 20.2 16.5 15.2 12.2 8.4
Bradley Stoke - 0 5.6 0 0 0 0
Total 10.7 9.3 10.2 9.4 10.1 8.6 7.9 Table 1.9
Source: Strategic Planning Policy and Specialist Advice Team (South Gloucestershire Council
Commentary This indicator was introduced to help monitor the effects of the economic recession on town centres and the retail sector within South Gloucestershire. As part of the annual monitoring of South Gloucestershire’s town centres and out of centre retailing, the Strategic Planning Policy and Specialist Advice Team has monitored vacancy rates since 2006. In August 2017, 7.9% of all A1 units in town centres across the District were vacant. This represents a decrease of 0.7% in the A1 vacancy rate recorded in August 2016 (8.6%) and the lowest vacancy rate in the last seven years. In August 2017:
Filton had the highest A1 vacancy rate (14.3%) which equates to 3 vacant A1 units; and Both Emersons Green and Bradley Stoke had no vacant A1 units (0%).
Despite Filton having the highest vacancy rate between August 2016 and August 2017 the centre had the most significant decrease in A1 vacancy rate, the rate falling from 20.0% to 14.3%. There has also been an increase in the percentage of A1 units occupied/trading in Hanham, Kingswood and Yate in the 2016/2017 monitoring year. Excluding Emersons Green and Bradley Stoke, Downend and Thornbury the percentage of vacant A1 units has remained the same. In terms of actual A1 Units – Yate recorded the greatest decrease in vacancy (where an additional three units became occupied for A1 use). In contrast between August 2016 and August 2017 there has been an increase in the vacancy in A1 units in Chipping Sodbury (one unit), and Staple Hill (two units) town centres. It should be noted that this indicator is purely a measure of ‘quantity’ it does not measure ‘quality’. The quality of individual retail premises is a subjective matter over which the planning system has little influence. In addition, this indicator relates solely to A1 units. Any units not in A1 use are excluded from this indicator – the total vacancy rate (all uses) is covered in the indicator below.

25
Number of vacant units (all uses) ***
Figure 1.1
2010/11 2011/12 2012/13 2013/14 2014/15 2015/16 2016/17
Chipping Sodbury 3 5 4 6 3 4 8
Downend 2 2 2 1 3 2 1
Emersons Green 0 0 0 0 0 0 0
Filton 4 5 3 4 5 7 6
Hanham 8 5 5 6 9 9 6
Kingswood 26 18 21 21 24 20 20
Staple Hill 13 7 6 12 12 6 6
Thornbury 16 13 18 17 19 14 16
Willow Brook Centre 2 0 1 0 1 1 1
Yate 16 19 20 13 14 11 9
Total 90 74 80 80 90 74 73
Table 1.10 Source: Strategic Planning Policy and Specialist Advice Team (South Gloucestershire Council)
0
5
10
15
20
25
30
2010/2011 2011/2012 2012/2013 2013/2014 2014/2015 2015/2016 2016/2017
Num
ber
of
units
Number of vacant units (all uses)
Chipping Sodbury Downend Emersons Green Filton
Hanham Kingswood Staple Hill Thornbury
Willow Brook Centre Yate
26
Commentary This indicator monitors the level of all vacant units in Town Centres (not just retail uses). Figure 1.1 and Table 1.10 show how the number of vacant units in South Gloucestershire’s town centres has changed over the past seven years. In summary they show that:
- Chipping Sodbury vacancy rate has risen compared to previous years; - Downend has had only one or two vacant units in six of the past seven years and
currently only has two vacant units; - Emersons Green has no vacant units in this monitoring year and although there have
been none or low rates of vacancy for the last seven years, it is the smallest town centre in South Gloucestershire (in terms of number of units);
- Filton has a lower vacancy rate compared to 2015/2016 but it is only slightly higher than the vacancy rate compared to other previous years;
- The vacancy rate in Hanham has fallen compared to last year; - The number of vacant units in Kingswood remains high; - The number of vacant units in Staple Hill has remained unchanged from the past year; - The rate of vacancy in Thornbury remains high; - This year there is only one vacant unit at the Willow brook Centre; and - The number of vacant units in Yate is the lowest of all the past seven years.
It should be noted that this indicator is purely a measure of ‘quantity’ it does not measure ‘quality’. The quality of individual retail premises is a subjective matter over which the planning system has little influence. In addition, this indicator relates to all units shown as vacant in the Council’s annual Town Centres and Retailing survey – it does not take account of what use they are currently in. *** indicates that data used is collected through the annual survey of Town Centres and Retailing undertaken in August each year.
27
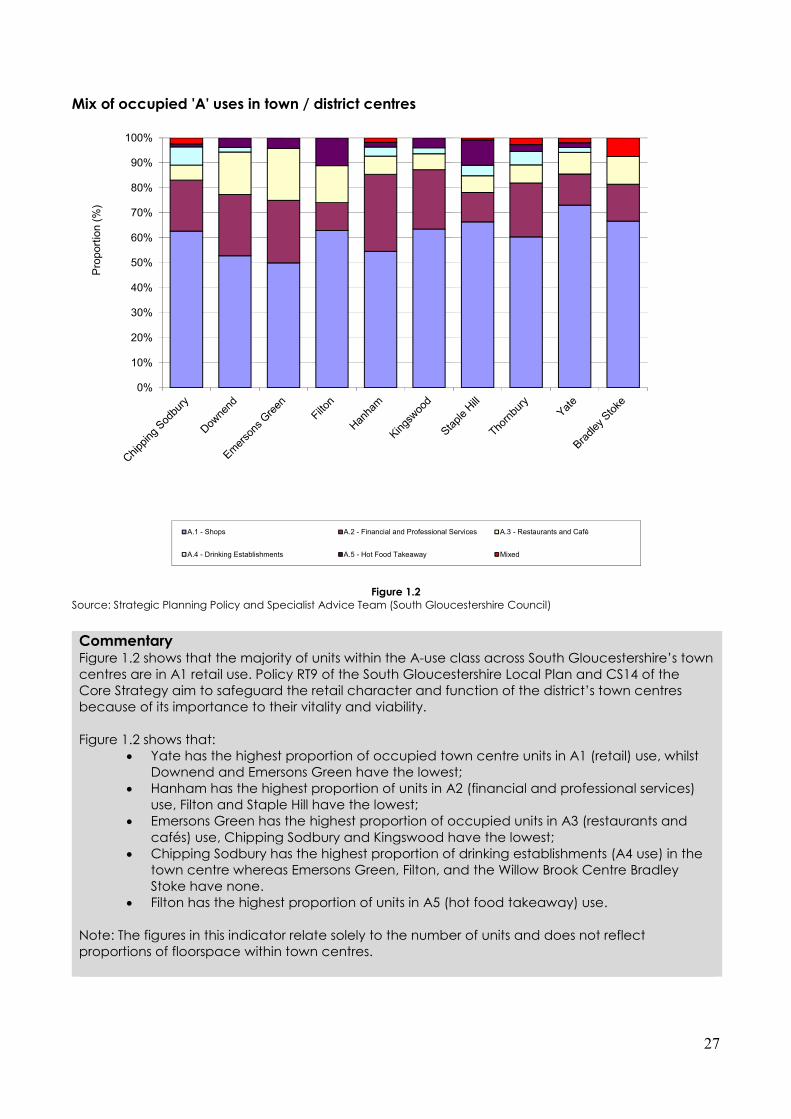
Mix of occupied 'A' uses in town / district centres
Figure 1.2
Source: Strategic Planning Policy and Specialist Advice Team (South Gloucestershire Council)
0%
10%
20%
30%
40%
50%
60%
70%
80%
90%
100%
Pro
port
ion
(%
)
A.1 - Shops A.2 - Financial and Professional Services A.3 - Restaurants and Café
A.4 - Drinking Establishments A.5 - Hot Food Takeaway Mixed
Commentary Figure 1.2 shows that the majority of units within the A-use class across South Gloucestershire’s town centres are in A1 retail use. Policy RT9 of the South Gloucestershire Local Plan and CS14 of the Core Strategy aim to safeguard the retail character and function of the district’s town centres because of its importance to their vitality and viability. Figure 1.2 shows that:
Yate has the highest proportion of occupied town centre units in A1 (retail) use, whilst Downend and Emersons Green have the lowest;
Hanham has the highest proportion of units in A2 (financial and professional services) use, Filton and Staple Hill have the lowest;
Emersons Green has the highest proportion of occupied units in A3 (restaurants and cafés) use, Chipping Sodbury and Kingswood have the lowest;
Chipping Sodbury has the highest proportion of drinking establishments (A4 use) in the town centre whereas Emersons Green, Filton, and the Willow Brook Centre Bradley Stoke have none.
Filton has the highest proportion of units in A5 (hot food takeaway) use. Note: The figures in this indicator relate solely to the number of units and does not reflect proportions of floorspace within town centres.

28
Potential number of jobs arising from implemented planning permissions
Retail (A -A5) Offices (B1a)
Industry and warehousing (B1b, B1c, B2,
B8, Mixed B, SG Industrial
Other (C1, C2, D1, D2, SG,
Mixed) Total
2006/2007 100 300 -300 0 100
2007/2008 400 800 300 0 1,500
2008/2009 200 1,300 0 100 1,600
2009/2010 100 1,300 1,400 400 3,200
2010/2011 0 600 200 0 800
2011/2012 200 -200 500 400 900
2012/2013 150 0 200 50 400
2013/2014 241 209 153 486 1,089
2014/2015 131 0 543 684 1,358
2015/2016 78 -324 562 513 829
2016/2017 -10 136 1,898 73 2,097
Total 1,590 4,121 5,456 2,706 13,873
Table 1.12 Source: Strategic Planning Policy and Specialist Advice Team (South Gloucestershire Council)
Commentary Since 2006 it is estimated that almost 13,880 additional jobs may have been created in the district through completed developments which required planning permission; 2,097 of these jobs may have been created in the last monitoring year **. NOTES: These estimates are derived from information provided by developers in Planning Applications. Where this is not available
assumptions have been made using employment floor space densities. It is assumed that if the development is completed, the number of jobs derived from the application / floor space density
calculations has been realised, no occupier survey has been carried out to ascertain actual employee numbers. It is important to note that these figures are not official estimates and may differ considerably from official data published by the ONS. However, this data provides a useful indication of the role the planning system can play in stimulating and sustaining economic development.
29
4.2 Social
Creating mixed and balanced communities is one of the government’s aims for sustainable development and a core aim of the Council. This means providing sufficient good quality housing of the right types and mix, in the right places, which will be attractive to, and meet the identified needs of, different groups in society. Access to community facilities is fundamental to creating sustainable communities. Similarly, opportunities to participate in the cultural life of communities can contribute greatly to the health and wellbeing of individuals and communities as a whole.
Core Strategy Objectives
o Providing a range of housing to meet the needs of the whole community; o Providing decent and affordable housing in accessible locations and for local
needs in rural areas; o Improving health and well-being by provision and access to a range of social,
cultural, community, recreational facilities and green space in step with development whilst realising opportunities to redress any deficit; and
o Ensuring that environments for play are delivered as an integral part of the design of sustainable communities.
Relevant Core Strategy Policies
CS15 – Distribution of Housing; CS16 – Housing Density; CS17 – Housing Diversity; CS18 – Affordable Housing; CS19 – Housing Exception Sites; CS20 – Extra Care Housing; CS21 – Gypsy and Traveller Accommodation; CS22 – Travelling Showpeople; CS23 – Community Buildings and Cultural Activity; and CS24 – Green Infrastructure, Sport and Recreation Standards.
Relevant PSP Policies to be monitored in future AMR
PSP37 Internal Space and Accessibility Standards for Affordable Dwellings;
PSP41 Rural Workers Dwellings;
PSP42 Self-Build and Custom Housebuilding;
PSP43 Private Amenity Space Standards; and
PSP44 Open Space, Sport and Recreation.
Unless otherwise stated all figures relate to the period 1 April 2016 – 31 March 2017

30
Plan period and housing targets
Net additional homes in previous years; and Net additional homes for the reporting year
Figure 2.1
Analysis by policy area – completions 2016 to 2017
South Glos Total
East Fringe
of Bristol
North Fringe
of Bristol
Yate/Chipping Sodbury
Thornbury Rural Areas
Severnside
New build completions 1,532 539 532 184 189 88 0
Demolitions 44 21 4 0 0 19 0
Change of use (net gain) 116 43 4 10 14 43 2
Conversions (net gain) 10 10 1 0 -1 0 0
Other gains 16 0 0 0 0 16 0
Net additional homes 1,630
(100%) 571
(35%) 533
(33%) 194
(12%) 202
(12%) 128 (8%)
2 (0%)
Table 2.1
471657 584
475 517754
618
893997
832
1373218
346332
267 197
169205
202227
275
257
0
200
400
600
800
1,000
1,200
1,400
1,600
1,800
2006/07 2007/08 2008/09 2009/10 2010/11 2011/12 2012/13 2013/14 2014/15 2015/16 2016/17
Net additional dwellings delivered
Large Sites (10+ Homes) Small Sites (Fewer than 10 Homes)
Commentary Planning reforms introduced through the Localism Act (November 2011) require local councils to establish a locally derived housing requirement. The adopted South Gloucestershire Local Plan: Core Strategy forms the statutory development plan for the district up to 2027, by which the housing requirement for the district is set. Core Strategy (Policy CS15) identifies that a supply of deliverable and developable land will be identified to secure the delivery of a minimum of 28,355 new homes in the period between 2006 and 2027. Some 10,866 of these new homes were built between April 2006 and March 2017, leaving a minimum of 17,489 new homes to be delivered in the 10 years to 2027. Further details of the housing requirement, including the calculation of the five-year land supply, are set out below.

31
Source: Strategic Planning Policy and Specialist Advice (South Gloucestershire Council)
Number of homes lost through demolition for further residential development and the subsequent number of homes gained/lost (net)
Date Number of Homes Lost
Through Demolition Number of Homes Lost
Through Conversion
Total New Homes Completed
(Gross Completions)
Total Gain/Loss (Net Completions)
2006/2007 16 68 773 689
2007/2008 16 89 1,108 1,003
2008/2009 22 46 984 916
2009/2010 15 23 780 742
2010/2011 12 36 762 714
2011/2012 13 21 957 923
2012/2013 32 30 885 823
2013/2014 14 14 1,123 1,095
2014/2015 70 31 1,325 1,224
2015/2016 11 32 1,150 1,107
2016/2017 44 18 1,692 1,630
Table 2.2 Source: Strategic Planning Policy and Specialist Advice (South Gloucestershire Council)
Commentary As illustrated by Fig 2.1, in the year to April 2017, 1,630 homes (net) were completed in South Gloucestershire.
Table 2.1 shows that the vast majority (94%) of new developments were ‘new build’ developments. 84% of completions in the last year were on large sites (those with more than 10 homes) illustrating that the Council is proactively working with developers to bring sites forward through the development management process. In the last year over, 90% of completions were within the established urban areas of the East (35%) and North (33%) fringes of Bristol and the towns of Yate/Chipping Sodbury (12%) and Thornbury (12%), thereby demonstrating housing delivery in accordance and consistent with the Council’s adopted Core Strategy.
32
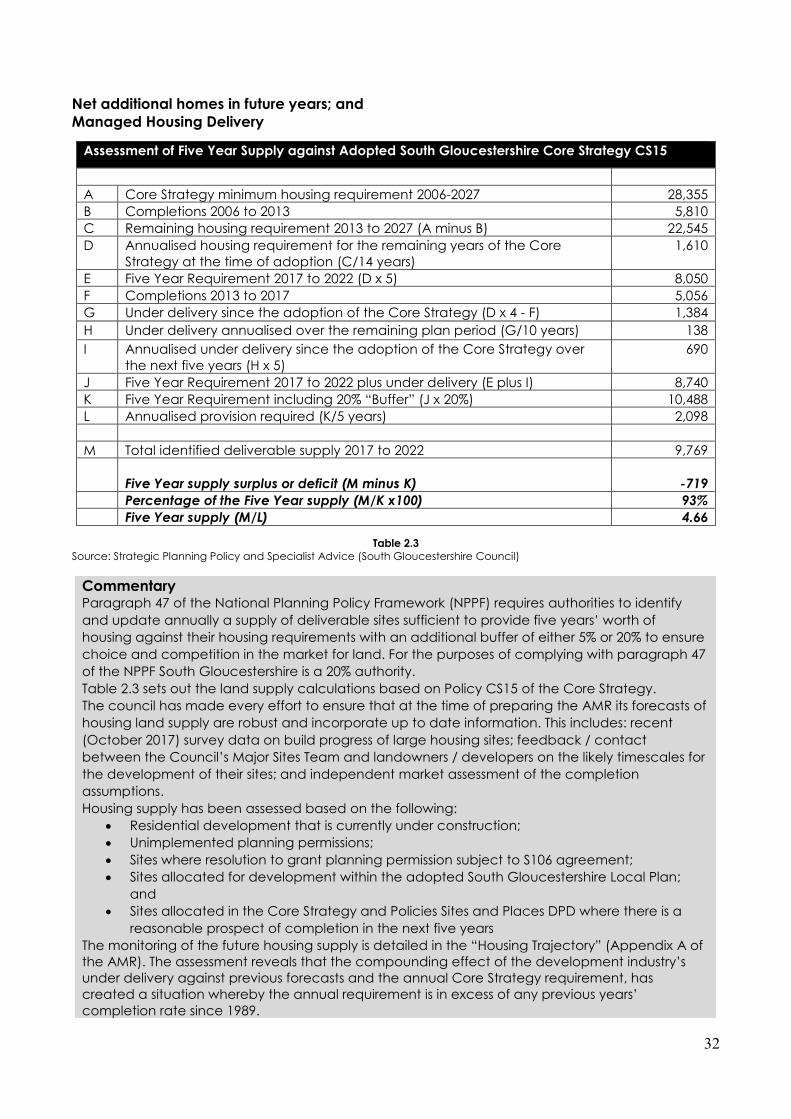
Net additional homes in future years; and Managed Housing Delivery
Table 2.3 Source: Strategic Planning Policy and Specialist Advice (South Gloucestershire Council)
Assessment of Five Year Supply against Adopted South Gloucestershire Core Strategy CS15
A Core Strategy minimum housing requirement 2006-2027 28,355
B Completions 2006 to 2013 5,810
C Remaining housing requirement 2013 to 2027 (A minus B) 22,545
D Annualised housing requirement for the remaining years of the Core Strategy at the time of adoption (C/14 years)
1,610
E Five Year Requirement 2017 to 2022 (D x 5) 8,050
F Completions 2013 to 2017 5,056
G Under delivery since the adoption of the Core Strategy (D x 4 - F) 1,384
H Under delivery annualised over the remaining plan period (G/10 years) 138
I Annualised under delivery since the adoption of the Core Strategy over the next five years (H x 5)
690
J Five Year Requirement 2017 to 2022 plus under delivery (E plus I) 8,740
K Five Year Requirement including 20% “Buffer” (J x 20%) 10,488
L Annualised provision required (K/5 years) 2,098
M Total identified deliverable supply 2017 to 2022 9,769
Five Year supply surplus or deficit (M minus K)
-719
Percentage of the Five Year supply (M/K x100) 93%
Five Year supply (M/L) 4.66
Commentary Paragraph 47 of the National Planning Policy Framework (NPPF) requires authorities to identify
and update annually a supply of deliverable sites sufficient to provide five years’ worth of
housing against their housing requirements with an additional buffer of either 5% or 20% to ensure
choice and competition in the market for land. For the purposes of complying with paragraph 47
of the NPPF South Gloucestershire is a 20% authority.
Table 2.3 sets out the land supply calculations based on Policy CS15 of the Core Strategy.
The council has made every effort to ensure that at the time of preparing the AMR its forecasts of
housing land supply are robust and incorporate up to date information. This includes: recent
(October 2017) survey data on build progress of large housing sites; feedback / contact
between the Council’s Major Sites Team and landowners / developers on the likely timescales for
the development of their sites; and independent market assessment of the completion
assumptions.
Housing supply has been assessed based on the following:
Residential development that is currently under construction;
Unimplemented planning permissions;
Sites where resolution to grant planning permission subject to S106 agreement;
Sites allocated for development within the adopted South Gloucestershire Local Plan;
and
Sites allocated in the Core Strategy and Policies Sites and Places DPD where there is a
reasonable prospect of completion in the next five years
The monitoring of the future housing supply is detailed in the “Housing Trajectory” (Appendix A of the AMR). The assessment reveals that the compounding effect of the development industry’s under delivery against previous forecasts and the annual Core Strategy requirement, has created a situation whereby the annual requirement is in excess of any previous years’ completion rate since 1989.

33
New and converted homes on previously developed land
Year Number of homes on Previously
Developed Land (gross) Percentage of homes on Previously
Developed Land
2004/2005* 415 67%
2005/2006* 520 71%
2006/2007* 478 62%
2007/2008* 771 70%
2008/2009 763 78%
2009/2010 468 60%
2010/2011 482 63%
2011/2012 657 69%
2012/2013 485 55%
2013/2014 445 40%
2014/2015 686 52%
2015/2016 630 55%
2016/2017 786 46% Table 2.4
Source: Strategic Planning Policy and Specialist Advice (South Gloucestershire Council)
The council’s assessment, supported by independent appraisal is that the ability of the development sector to construct and complete sufficient new homes to address this shortfall within the next 5 years (referred to as the Sedgefield approach) in addition to the ambitious annual housing targets set out in the adopted Core Strategy is not feasible or practical. The council recognises the desire, set out in the National Planning Practice Guidance, to address under delivery as soon as possible. However, the particular circumstances that exist in South Gloucestershire mean that it would be wholly inappropriate to calculate the housing supply requirement in this way. Therefore, the housing trajectory continues to be set on the basis of addressing under delivery over the remaining plan period to 2027 (referred to as the ‘Liverpool approach’) as this provides a more realistic target. Compared to the land supply situation shown in the 2016 AMR it can be seen that the Council has made further steps forward to address the land supply deficit. In 2016 there was a deficit of 960 homes equating to a supply of 4.54 years. The deficit this year has continued to be reduced by more than 200 homes to give a land supply of 4.66 years. This represents a 25% improvement over last year and when measured over the last two years shows the deficit has been reduced by over 50% (1,451 in 2015 to 719 in 2017). With the Council’s continued approach and the other identified sites coming on stream in the next few years this improvement is expected to be sustained.
34
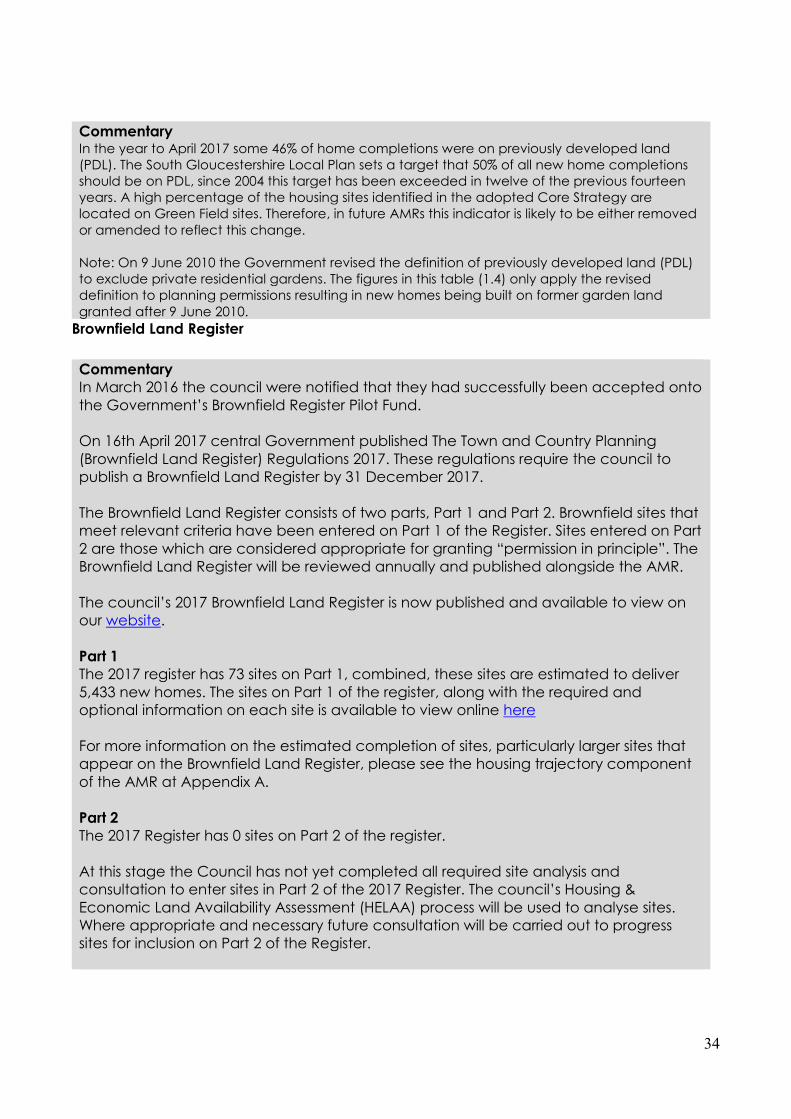
Brownfield Land Register
Commentary In the year to April 2017 some 46% of home completions were on previously developed land (PDL). The South Gloucestershire Local Plan sets a target that 50% of all new home completions should be on PDL, since 2004 this target has been exceeded in twelve of the previous fourteen years. A high percentage of the housing sites identified in the adopted Core Strategy are located on Green Field sites. Therefore, in future AMRs this indicator is likely to be either removed or amended to reflect this change. Note: On 9 June 2010 the Government revised the definition of previously developed land (PDL) to exclude private residential gardens. The figures in this table (1.4) only apply the revised definition to planning permissions resulting in new homes being built on former garden land granted after 9 June 2010.
Commentary In March 2016 the council were notified that they had successfully been accepted onto the Government’s Brownfield Register Pilot Fund. On 16th April 2017 central Government published The Town and Country Planning (Brownfield Land Register) Regulations 2017. These regulations require the council to publish a Brownfield Land Register by 31 December 2017. The Brownfield Land Register consists of two parts, Part 1 and Part 2. Brownfield sites that meet relevant criteria have been entered on Part 1 of the Register. Sites entered on Part 2 are those which are considered appropriate for granting “permission in principle”. The Brownfield Land Register will be reviewed annually and published alongside the AMR. The council’s 2017 Brownfield Land Register is now published and available to view on our website. Part 1 The 2017 register has 73 sites on Part 1, combined, these sites are estimated to deliver 5,433 new homes. The sites on Part 1 of the register, along with the required and optional information on each site is available to view online here For more information on the estimated completion of sites, particularly larger sites that appear on the Brownfield Land Register, please see the housing trajectory component of the AMR at Appendix A. Part 2 The 2017 Register has 0 sites on Part 2 of the register. At this stage the Council has not yet completed all required site analysis and consultation to enter sites in Part 2 of the 2017 Register. The council’s Housing & Economic Land Availability Assessment (HELAA) process will be used to analyse sites. Where appropriate and necessary future consultation will be carried out to progress sites for inclusion on Part 2 of the Register.

35
Housing Density: Percentage of new homes completed (on fully completed Large Sites)
i) Less than 30 dwellings per ha; ii) Between 30 and 50 dwellings per ha; and iii) Above 50 dwellings per ha.
2009/ 2010
2010/ 2011
2011/ 2012
2012/ 2013
2013/ 2014
2014/ 2015
2015/ 2016
2016/ 2017
I) Less than 30 dwellings per ha
22% 0% 0% 3% 8% 11% 0% 40%
ii)
Between 30 and 50 dwellings per ha
16% 83% 53% 25% 25% 33% 64% 29%
iii) Above 50 dwellings per ha
62% 17% 47% 72% 67% 56% 36% 31%
Table 2.5 Source: Strategic Planning Policy and Specialist Advice (South Gloucestershire Council)
Commentary The Council seeks to avoid developments which make inefficient use of land in the context of the character and amenity of the local area. In the year to April 2017 almost two thirds (60%) of homes (on large housing sites) were delivered at over 30 dph.
The achievement of housing densities will continue to be monitored, taking into account the removal of minimum density requirements in June 2010 and, looking forward, the implementation of Core Strategy policy CS16.
36
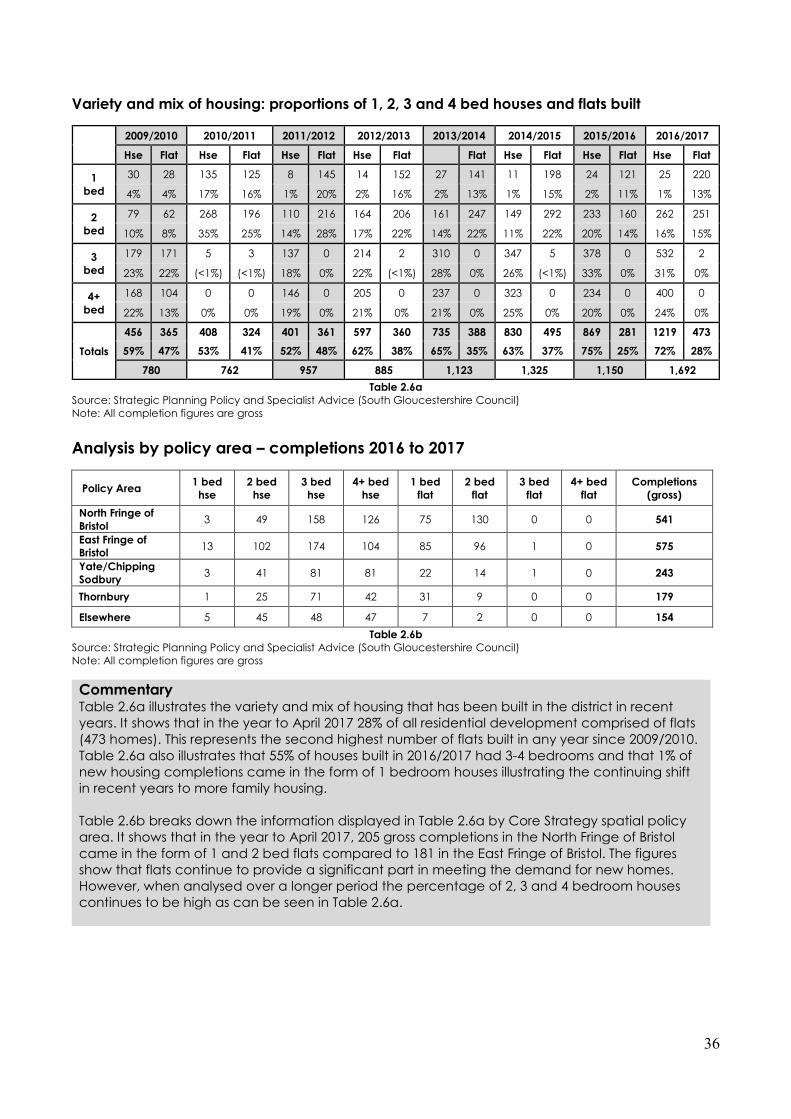
Variety and mix of housing: proportions of 1, 2, 3 and 4 bed houses and flats built
2009/2010 2010/2011 2011/2012 2012/2013 2013/2014 2014/2015 2015/2016 2016/2017
Hse Flat Hse Flat Hse Flat Hse Flat Flat Hse Flat Hse Flat Hse Flat
1 bed
30 28 135 125 8 145 14 152 27 141 11 198 24 121 25 220
4% 4% 17% 16% 1% 20% 2% 16% 2% 13% 1% 15% 2% 11% 1% 13%
2 bed
79 62 268 196 110 216 164 206 161 247 149 292 233 160 262 251
10% 8% 35% 25% 14% 28% 17% 22% 14% 22% 11% 22% 20% 14% 16% 15%
3 bed
179 171 5 3 137 0 214 2 310 0 347 5 378 0 532 2
23% 22% (<1%) (<1%) 18% 0% 22% (<1%) 28% 0% 26% (<1%) 33% 0% 31% 0%
4+ bed
168 104 0 0 146 0 205 0 237 0 323 0 234 0 400 0
22% 13% 0% 0% 19% 0% 21% 0% 21% 0% 25% 0% 20% 0% 24% 0%
Totals
456 365 408 324 401 361 597 360 735 388 830 495 869 281 1219 473
59% 47% 53% 41% 52% 48% 62% 38% 65% 35% 63% 37% 75% 25% 72% 28%
780 762 957 885 1,123 1,325 1,150 1,692
Table 2.6a Source: Strategic Planning Policy and Specialist Advice (South Gloucestershire Council) Note: All completion figures are gross
Analysis by policy area – completions 2016 to 2017
Policy Area 1 bed
hse 2 bed
hse 3 bed
hse 4+ bed
hse 1 bed
flat 2 bed
flat 3 bed
flat 4+ bed
flat Completions
(gross)
North Fringe of Bristol
3 49 158 126 75 130 0 0 541
East Fringe of Bristol
13 102 174 104 85 96 1 0 575
Yate/Chipping Sodbury
3 41 81 81 22 14 1 0 243
Thornbury 1 25 71 42 31 9 0 0 179
Elsewhere 5 45 48 47 7 2 0 0 154
Table 2.6b Source: Strategic Planning Policy and Specialist Advice (South Gloucestershire Council) Note: All completion figures are gross
Commentary Table 2.6a illustrates the variety and mix of housing that has been built in the district in recent years. It shows that in the year to April 2017 28% of all residential development comprised of flats (473 homes). This represents the second highest number of flats built in any year since 2009/2010. Table 2.6a also illustrates that 55% of houses built in 2016/2017 had 3-4 bedrooms and that 1% of new housing completions came in the form of 1 bedroom houses illustrating the continuing shift in recent years to more family housing. Table 2.6b breaks down the information displayed in Table 2.6a by Core Strategy spatial policy area. It shows that in the year to April 2017, 205 gross completions in the North Fringe of Bristol came in the form of 1 and 2 bed flats compared to 181 in the East Fringe of Bristol. The figures show that flats continue to provide a significant part in meeting the demand for new homes. However, when analysed over a longer period the percentage of 2, 3 and 4 bedroom houses continues to be high as can be seen in Table 2.6a.
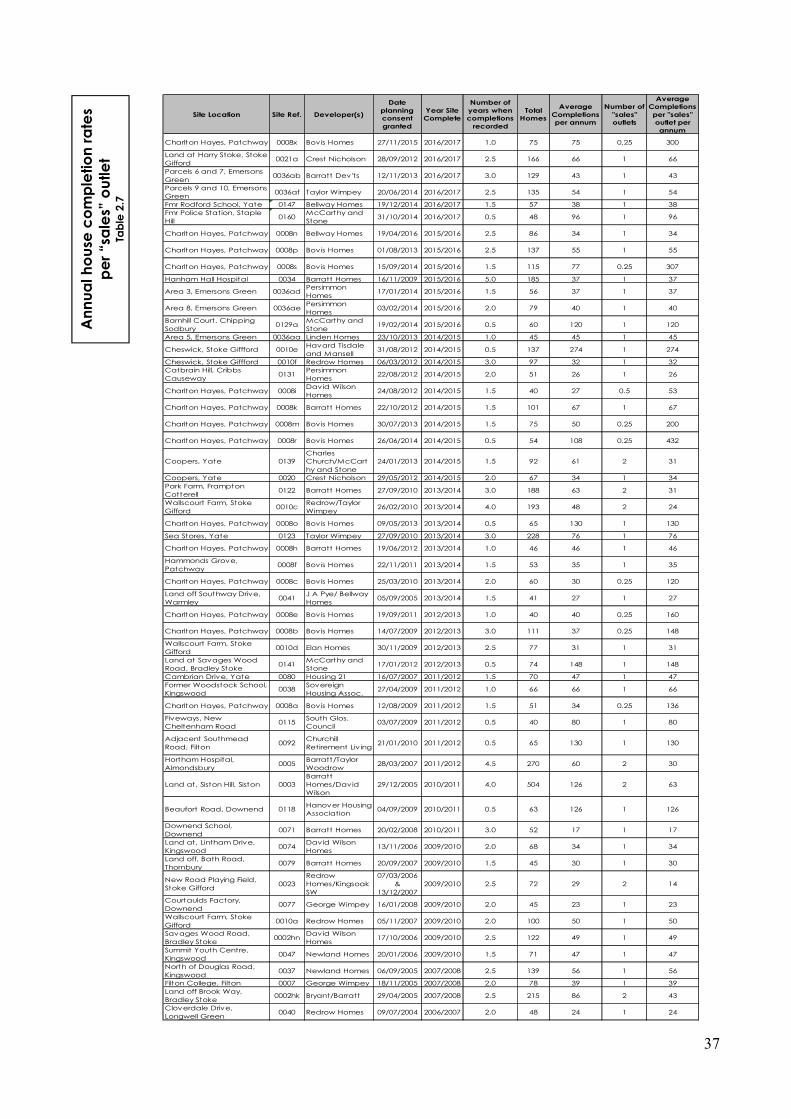
37
Site Location Site Ref. Developer(s)
Date planning consent granted
Year Site Complete
Number of years when completions
recorded
Total Homes
Average Completions per annum
Number of "sales" outlets
Average Completions per "sales" outlet per annum
Charlton Hayes, Patchway 0008x Bovis Homes 27/11/2015 2016/2017 1.0 75 75 0.25 300
Land at Harry Stoke, Stoke
Gifford0021a Crest Nicholson 28/09/2012 2016/2017 2.5 166 66 1 66
Parcels 6 and 7, Emersons
Green0036ab Barratt Dev'ts 12/11/2013 2016/2017 3.0 129 43 1 43
Parcels 9 and 10, Emersons
Green0036af Taylor Wimpey 20/06/2014 2016/2017 2.5 135 54 1 54
Fmr Rodford School, Yate 0147 Bellway Homes 19/12/2014 2016/2017 1.5 57 38 1 38
Fmr Police Station, Staple
Hill0160
McCarthy and
Stone31/10/2014 2016/2017 0.5 48 96 1 96
Charlton Hayes, Patchway 0008n Bellway Homes 19/04/2016 2015/2016 2.5 86 34 1 34
Charlton Hayes, Patchway 0008p Bovis Homes 01/08/2013 2015/2016 2.5 137 55 1 55
Charlton Hayes, Patchway 0008s Bovis Homes 15/09/2014 2015/2016 1.5 115 77 0.25 307
Hanham Hall Hospital 0034 Barratt Homes 16/11/2009 2015/2016 5.0 185 37 1 37
Area 3, Emersons Green 0036adPersimmon
Homes17/01/2014 2015/2016 1.5 56 37 1 37
Area 8, Emersons Green 0036aePersimmon
Homes03/02/2014 2015/2016 2.0 79 40 1 40
Barnhill Court, Chipping
Sodbury0129a
McCarthy and
Stone19/02/2014 2015/2016 0.5 60 120 1 120
Area 5, Emersons Green 0036aa Linden Homes 23/10/2013 2014/2015 1.0 45 45 1 45
Cheswick, Stoke Giffford 0010eHavard Tisdale
and Mansell31/08/2012 2014/2015 0.5 137 274 1 274
Cheswick, Stoke Giffford 0010f Redrow Homes 06/03/2012 2014/2015 3.0 97 32 1 32
Catbrain Hill, Cribbs
Causeway0131
Persimmon
Homes22/08/2012 2014/2015 2.0 51 26 1 26
Charlton Hayes, Patchway 0008iDavid Wilson
Homes24/08/2012 2014/2015 1.5 40 27 0.5 53
Charlton Hayes, Patchway 0008k Barratt Homes 22/10/2012 2014/2015 1.5 101 67 1 67
Charlton Hayes, Patchway 0008m Bovis Homes 30/07/2013 2014/2015 1.5 75 50 0.25 200
Charlton Hayes, Patchway 0008r Bovis Homes 26/06/2014 2014/2015 0.5 54 108 0.25 432
Coopers, Yate 0139
Charles
Church/McCart
hy and Stone
24/01/2013 2014/2015 1.5 92 61 2 31
Coopers, Yate 0020 Crest Nicholson 29/05/2012 2014/2015 2.0 67 34 1 34
Park Farm, Frampton
Cotterell0122 Barratt Homes 27/09/2010 2013/2014 3.0 188 63 2 31
Wallscourt Farm, Stoke
Gifford 0010c
Redrow/Taylor
Wimpey26/02/2010 2013/2014 4.0 193 48 2 24
Charlton Hayes, Patchway 0008o Bovis Homes 09/05/2013 2013/2014 0.5 65 130 1 130
Sea Stores, Yate 0123 Taylor Wimpey 27/09/2010 2013/2014 3.0 228 76 1 76
Charlton Hayes, Patchway 0008h Barratt Homes 19/06/2012 2013/2014 1.0 46 46 1 46
Hammonds Grove,
Patchway 0008f Bovis Homes 22/11/2011 2013/2014 1.5 53 35 1 35
Charlton Hayes, Patchway 0008c Bovis Homes 25/03/2010 2013/2014 2.0 60 30 0.25 120
Land off Southway Drive,
Warmley0041
J A Pye/ Bellway
Homes05/09/2005 2013/2014 1.5 41 27 1 27
Charlton Hayes, Patchway 0008e Bovis Homes 19/09/2011 2012/2013 1.0 40 40 0.25 160
Charlton Hayes, Patchway 0008b Bovis Homes 14/07/2009 2012/2013 3.0 111 37 0.25 148
Wallscourt Farm, Stoke
Gifford 0010d Elan Homes 30/11/2009 2012/2013 2.5 77 31 1 31
Land at Savages Wood
Road, Bradley Stoke 0141
McCarthy and
Stone17/01/2012 2012/2013 0.5 74 148 1 148
Cambrian Drive, Yate 0080 Housing 21 16/07/2007 2011/2012 1.5 70 47 1 47
Former Woodstock School,
Kingswood 0038
Sovereign
Housing Assoc.27/04/2009 2011/2012 1.0 66 66 1 66
Charlton Hayes, Patchway 0008a Bovis Homes 12/08/2009 2011/2012 1.5 51 34 0.25 136
Fiveways, New
Cheltenham Road 0115
South Glos.
Council03/07/2009 2011/2012 0.5 40 80 1 80
Adjacent Southmead
Road, Filton 0092
Churchill
Retirement Living21/01/2010 2011/2012 0.5 65 130 1 130
Hortham Hospital,
Almondsbury 0005
Barratt/Taylor
Woodrow28/03/2007 2011/2012 4.5 270 60 2 30
Land at, Siston Hill, Siston 0003
Barratt
Homes/David
Wilson
29/12/2005 2010/2011 4.0 504 126 2 63
Beaufort Road, Downend 0118Hanover Housing
Association04/09/2009 2010/2011 0.5 63 126 1 126
Downend School,
Downend 0071 Barratt Homes 20/02/2008 2010/2011 3.0 52 17 1 17
Land at, Lintham Drive,
Kingswood0074
David Wilson
Homes13/11/2006 2009/2010 2.0 68 34 1 34
Land off, Bath Road,
Thornbury 0079 Barratt Homes 20/09/2007 2009/2010 1.5 45 30 1 30
New Road Playing Field,
Stoke Gifford 0023
Redrow
Homes/Kingsoak
SW
07/03/2006
&
13/12/2007
2009/2010 2.5 72 29 2 14
Courtaulds Factory,
Downend 0077 George Wimpey 16/01/2008 2009/2010 2.0 45 23 1 23
Wallscourt Farm, Stoke
Gifford0010a Redrow Homes 05/11/2007 2009/2010 2.0 100 50 1 50
Savages Wood Road,
Bradley Stoke 0002hn
David Wilson
Homes17/10/2006 2009/2010 2.5 122 49 1 49
Summit Youth Centre,
Kingswood 0047 Newland Homes 20/01/2006 2009/2010 1.5 71 47 1 47
North of Douglas Road,
Kingswood 0037 Newland Homes 06/09/2005 2007/2008 2.5 139 56 1 56
Filton College, Filton 0007 George Wimpey 18/11/2005 2007/2008 2.0 78 39 1 39
Land off Brook Way,
Bradley Stoke 0002hk Bryant/Barratt 29/04/2005 2007/2008 2.5 215 86 2 43
Cloverdale Drive,
Longwell Green 0040 Redrow Homes 09/07/2004 2006/2007 2.0 48 24 1 24
An
nu
al h
ou
se c
om
ple
tio
n r
ate
s p
er
“sa
les”
ou
tle
t
Tab
le 2
.7

38
Source: Strategic Planning Policy and Specialist Advice (South Gloucestershire Council)
Long Term Vacant Housing Stock
Year Total Stock on Valuation List
Long Term Vacant % Long Term
Vacant
2005 104,691 452 0.4
2006 105,324 398 0.4
2007 106,306 405 0.4
2008 107,339 555 0.5
2009 108,291 570 0.5
2010 108,951 582 0.5
2011 109,706 463 0.4
2012 110,634 456 0.4
2013 111,543 494 0.4
2014 112,591 446 0.4
2015 113,857 581 0.5
2016 114,810 337 0.3
2017 115,284 293 0.3 Table 2.8
Source: Council Tax (South Gloucestershire Council)
Commentary Table 2.7 shows annual housing completion rates for all fully completed housing sites of 40 homes or more since 2011/2012. The table includes both market and affordable housing, and a mix of schemes from “Extra Care” sites to mixed sites with a high proportion of family housing. The table gives an indication of completions per “sales” outlet. It can be seen that a number of sites at the Charlton Hayes development share a “sales” outlet (Defined either by the presence of a show home/sales office or site boundary if solely an Affordable Housing scheme). Whilst no attempt is made to reconcile these figures with actual house sales and occupation the table does illustrate the level of annual completions per outlet that has been achieved over the past few years from a variety of development types. The Table shows high rates have been achieved at: Charlton Hayes, Patchway (refs. 0008a, 0008k, 0008m, 0008o, 0008p, 0008r, 0008s, 0008x); Sea Stores, Yate (ref. 0123); Cheswick (ref. 0010e; Savages Wood Road, Bradley Stoke (ref. 0141); Barnhill Court (ref 0129a; Harry Stoke (ref. 0021a); and Former Police Station, Staple Hill (ref. 0160). Annual average completions per outlet (Excluding Charlton Hayes) for these ranging between 66 and 274 homes. When the affordable homes element is removed from these sites this range is reduced to between 44 and 194 homes per outlet. The annual average completions per outlet across all the sites shown in the table is 82 homes.
Commentary In December 2017, 293 domestic properties had been vacant for more than one year, this is a decrease from the figure last year and equates to only 0.3% of the total housing stock (according to Council Tax valuation records). Table 2.8 illustrates that the amount of long-term vacant housing in the district has consistently remained at a very low level since 2005.
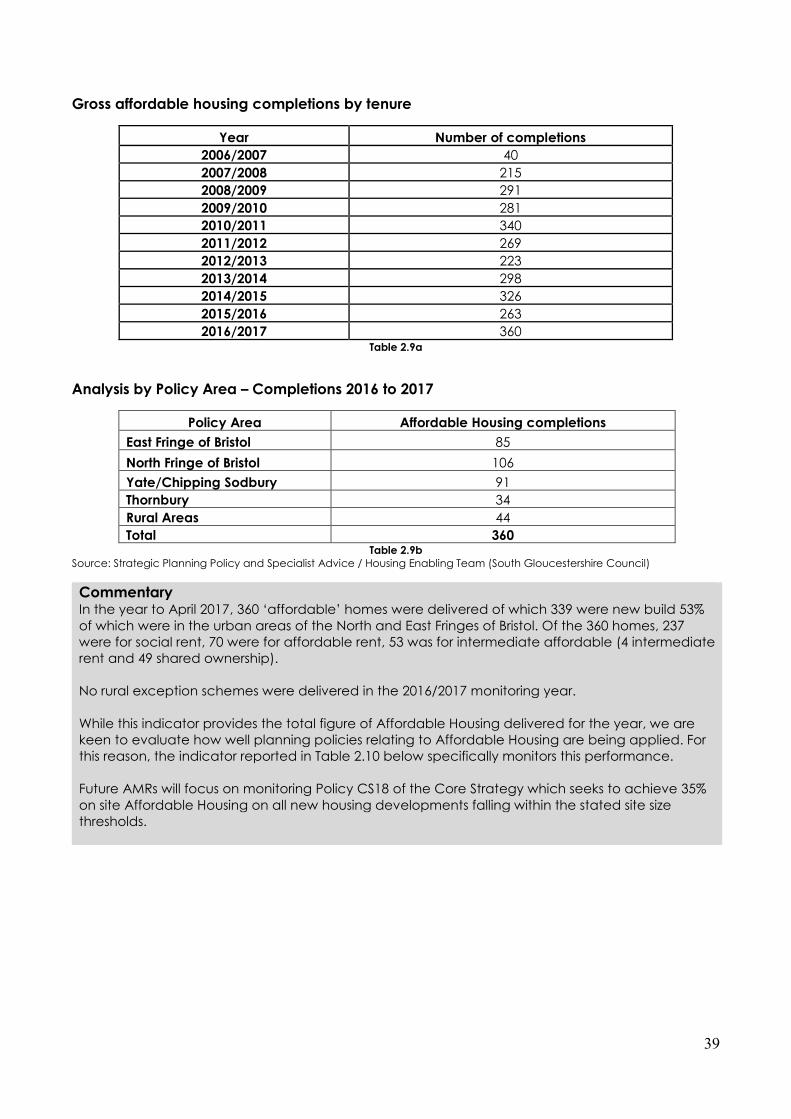
39
Gross affordable housing completions by tenure
Year Number of completions
2006/2007 40
2007/2008 215
2008/2009 291
2009/2010 281
2010/2011 340
2011/2012 269
2012/2013 223
2013/2014 298
2014/2015 326
2015/2016 263
2016/2017 360 Table 2.9a
Analysis by Policy Area – Completions 2016 to 2017
Policy Area Affordable Housing completions
East Fringe of Bristol 85
North Fringe of Bristol 106
Yate/Chipping Sodbury 91
Thornbury 34
Rural Areas 44
Total 360 Table 2.9b
Source: Strategic Planning Policy and Specialist Advice / Housing Enabling Team (South Gloucestershire Council)
Commentary In the year to April 2017, 360 ‘affordable’ homes were delivered of which 339 were new build 53% of which were in the urban areas of the North and East Fringes of Bristol. Of the 360 homes, 237 were for social rent, 70 were for affordable rent, 53 was for intermediate affordable (4 intermediate rent and 49 shared ownership). No rural exception schemes were delivered in the 2016/2017 monitoring year. While this indicator provides the total figure of Affordable Housing delivered for the year, we are keen to evaluate how well planning policies relating to Affordable Housing are being applied. For this reason, the indicator reported in Table 2.10 below specifically monitors this performance. Future AMRs will focus on monitoring Policy CS18 of the Core Strategy which seeks to achieve 35% on site Affordable Housing on all new housing developments falling within the stated site size thresholds.

40
Affordable Housing completions
Table 2.10
Source: Strategic Planning Policy and Specialist Advice (South Gloucestershire Council)
Site Location
Date
planning
consent
granted
Build
period
(years)
Total
Units
Target:
Proportion of
affordable
housing
negotiated (%)
(number of units)
Delivered:
Proportion of
affordable
housing
delivered (%)
(number of units)
Difference:
Delivered
minus Target
(%)
Charlton Hayes, Patchway (ref. 0008v) 04/09/2015 2016-2016 36 33.3% (12 units) 33.3% (12 units) 0
Charlton Hayes, Patchway (ref. 0008w) 28/09/2015 2016-2017 28 28.6% (8 units) 28.6% (8 units) 0
Charlton Hayes, Patchway (ref. 0008x) 27/11/2015 2016-2017 75 24.0% (18 units) 24.0% (18 units) 0
The Lime Works, Itchington Road, Tytherington (ref. 0009) 21/06/2004 2016-2017 17 29.4% (5 units) 29.4% (5 units) 0
Land at Harry Stoke, Stoke Gifford (ref. 0021a) 28/09/2012 2013-2016 166 33.3% (55 units) 33.3% (55 units) 0
Parcels 6 and 7 Emersons Green (ref. 0036ab) 12/11/2013 2014-2017 129 24.0% (31 units) 24.0% (31 units) 0
Parcels 9 and 10 Emersons Green (ref. 0036af) 20/06/2014 2014-2017 135 25.0% (34 units) 25.0% (34 units) 0
Fmr Rodford School, Yate (ref. 0147) 19/12/2014 2015-2016 57 35.0% (20 units) 35.0% (20 units) 0
Fmr Police Station, Staple Hill (ref. 0160) 31/10/2014 2015-2016 48 10.0% (5 units) 10.0% (5 units) 0
Fmr Care Home, Kelston Close, Yate (ref. 0161) 31/07/2015 2016-2016 24 100.0% (24 units) 100.0% (24 units) 0
12 Oldlands Avenue, Coalpit Heath (ref. 0174l) 11/03/2015 2015-2016 17 100.0% (17 units) 100.0% (17 units) 0
Garage Site off James Road, Soundwell (ref. 0174q) 23/04/2015 2016-2016 5 100.0% (5 units) 100.0% (5 units) 0
Charlton House, Filton (ref. 0177) 31/03/2015 2015-2016 22 100.0% (22 units) 100.0% (22 units) 0
17-19 Edgeware Road, Stple Hill (ref. 0178) 25/03/2015 2016-2016 12 100% (12 units) 100% (12 units) 0
Commentary Policy H6 (33.3%) of the SGLP and CS18 (35.0%) of the Core Strategy sets out the Council’s approach to securing Affordable Housing. It is also recognised that due to the timescales between planning permission and completed buildout policy CS18 does not currently apply to all those sites shown in table 2.10. In future years of monitoring as new sites come forward for completion it may be necessary to distinguish between which policy applied when planning permission was given. Reporting the proportion of Affordable Housing completions in any single year is often misleading; sites can take several years to complete and the Affordable Housing element is often delivered within varying phases of development. As such, a more accurate representation of how effective policies are at securing Affordable Housing provision is derived from analysing completion data over the build-out of the schemes. Table 2.10 lists the housing sites, completed during the 2016/2017 monitoring year, that meet the requirements for policy. It shows the period over which the site was completed and the proportion of Affordable Housing delivered, compared to the proportion of Affordable Housing negotiated for the site. The table illustrates that, during the 2016/2017 monitoring year, development was completed on fourteen housing sites where Affordable Housing was required. An account of Affordable Housing delivery on these sites is provided below:
Charlton Hayes, Patchway – a development scheme of 36 homes, 33.3% of which (12) were “affordable”. This meets the 33.3% identified by SGLP policy H6.
Charlton Hayes, Patchway – a development scheme of 28 homes, 28.6% of which (8) were “affordable”. Whilst this is below the 33.3% identified by SGLP policy H6, it is one phase of a much larger development scheme for the Charlton Hayes site where overall 33.3% is sought. The percentage of “Affordable Housing” on each parcel will vary due to the house numbers and house types planned.
Charlton Hayes, Patchway – a development scheme of 75 homes, 24.0% of which (18) were “affordable”. Whilst this is below the 33.3% identified by SGLP policy H6, it is one phase of a much larger development scheme for the Charlton Hayes site where overall 33.3% is sought. The percentage of “Affordable Housing” on each parcel will vary due to the house numbers and house types planned.
Lime Works, Itchington – a development scheme of 17 homes, 29.4% of which were “affordable”. This site was granted planning permission some years prior to the adoption of the SGLP policy H6.

41
Net additional pitches (Gypsy and Traveller)
Year Additional Gypsy and Traveller Pitches delivered
(Net)
2011/2012 2
2012/2013 0
2013/2014 5
2014/2015 7
2015/2016 5
2016/2017 0 Table 2.11
Source: Strategic Planning Policy and Specialist Advice (South Gloucestershire Council)
Land at Harry Stoke, Stoke Gifford – a development of 166 homes, 33.3% of which (55) were “affordable”. This meets the 33.3% identified by SGLP policy H6.
Parcels 6 and 7 Emersons Green – a development scheme of 129 homes, 25.0% of which (32) were “affordable”. Whilst this is below the 33.3% identified by SGLP policy H6, it is one phase of a much larger development scheme for the Emersons Green site where overall 33.3% is sought. The percentage of “Affordable Housing” on each parcel will vary due to the house numbers and house types planned.
Parcels 9 and 10 Emersons Green – a development scheme of 135 homes, 24.0% of which (31) were “affordable”. Whilst this is below the 33.3% identified by SGLP policy H6, it is one phase of a much larger development scheme for the Emersons Green site where overall 33.3% is sought. The percentage of “Affordable Housing” on each parcel will vary due to the house numbers and house types planned.
Former Rodford School, Yate – a development scheme of 57 homes, 35.0% of which (20) were affordable. This meets the 35.0% identified by policy CS18.
Former Police Station, Staple Hill – a development of 48 homes, 10.0% of which (5) were affordable. Whilst this is below the 33.3% identified by SGLP policy H6, the scheme primarily relates to a scheme to provide elderly persons flats.
Former Care Home, Kelston Close, Yate – a development scheme of 24 homes, 100.0% of which were “affordable”.
12 Oldlands Avenue, Coalpit Heath – a development scheme of 17 homes, 100.0% of which were “affordable”.
Garage site off James Road, Soundwell – a development scheme of 5 homes, 100.0% of which were “affordable”.
Charlton House, Filton – a development scheme of 22 homes, 100.0% of which were “affordable”.
17-19 Edgeware Road, Staple Hill – a development scheme of 12 homes, 100.0% of which were “affordable”.
Table 2.10 illustrates that the Council was successful in negotiating all proposals against policy H6 of the SGLP and policy CS18 of the Core Strategy where applicable at the time the applications were submitted.
Commentary In the 2016/2017 monitoring year, there were no additional Gypsy/Traveller pitches delivered in
South Gloucestershire.
There were however a number of pitches under construction in 2016/2017, and it is anticipated
these will be completed in 2017/2018. These comprise one pitch at Oldbury Lane, Thornbury
(PT13/3361/F), 2 pitches at Hall End, Wickwar (PT16/1833/F) and a 12 pitch site at Leechpool Dairy
Farm, Tanhouse Lane, Yate (PT11/2001/F).

42
Number of Extra Care housing homes completed
Year Number of Extra Care housing units completed
2010/2011 123
2011/2012 40
2012/2013 Nil
2013/2014 Nil
2014/2015 Nil
2015/2016 60
2016/2017 Nil
Table 2.12 Source: Strategic Planning Policy and Specialist Advice (South Gloucestershire Council)
Number of applicants on Self/Custom Build register
Commentary Extra Care is an alternative accommodation choice for older people and those with special needs. It promotes independent living in self-contained accommodation, where people are able to readily access high quality, flexible support and care services on site to suit their needs. In the year to April 2017, no Extra Care flats were completed. Policy CS20 aims to ensure that Extra Care housing schemes are located with good access to local facilities and services, are proportionate in scale to the locality and provide ancillary facilities that complement locally available amenities.
Commentary Under The Self-Build and Custom Housebuilding Regulations 2016, from the 1st April 2016 Local Authorities are required to maintain a register of those individuals and groups interested in building their own homes in the district. South Gloucestershire Council currently reports quarterly on the number of applicants contained on its register and publishes a summary of each year’s data at the end of each base period, which is available to view on the website here: website. Details are also provided on the number of plots that have been granted planning permission for Self-Build and Custom Housebuilding. The Policies, Sites and Places (PSP) Plan (Adopted 8 November 2017) contains Policy PSP42 Self-Build and Custom Housebuilding which aims to increase the number of self-build and custom housebuilding plots given planning permission across the district. Given the date the PSP Plan was adopted monitoring against policy PSP42 is intended to be reported in the 2018 AMR. The Council has been successful in appointing a Self-Build Officer to identify and expand opportunities for self-build and custom housebuilding plot provision as well as help monitor the success of the Council’s initiatives. This role will also help to identify other opportunities to encourage the growth of this sector of the housing industry and therefore increase the diversity of the market.

43
Community Infrastructure Levy (CIL)
Reg 62 Ref
Description % Amount
CIL Receipts 2016/17
Total Value of CIL Demand Notices raised in 2016/17 £2,282,451.71
4 (a) Total CIL receipts for 2016/17 24% £559,796.81
Total CIL payable in 2017/18 from Demand Notices issued in 2016/17 42% £962,756.82
Total CIL payable in 2018/19 from Demand Notices issued in 2016/17 27% £635,427.28
CIL Expenditure in 2016/17
4(c)(i) Expenditure on infrastructure 0% £0.00
4(c)(ii) Amount of CIL expenditure on each item 0% £0.00
4(c)(iii) Amount of CIL applied to repay money borrowed and items of infrastructure funded 22% £100,000.00
4(c)(iv) Amount of CIL applied to Administration Expenditure 1% £29,916.82
Amount of CIL passed to Town/Parish Council 3% £80,099.16
4(b) Total CIL Expenditure 9% £210,015.98
4(d) Total CIL receipts retained at end of year [4(a) less 4(b)] 15% £349,780.83 Table 2.13
Source: Strategic Planning Policy and Specialist Advice (South Gloucestershire Council)
Commentary South Gloucestershire Council became a CIL charging authority on 1st August 2015 which was approved by Full Council on 18th March 2015. The charging schedule and supporting information can be found on the Authorities website. Allocation of CIL receipts is restricted to items on the adopted Regulation 123 List. This is to ensure there is no duplication of infrastructure funding between CIL and Section 106 Agreements. The CIL regulations require that 15% of all CIL receipts (or 25% where there is a Neighbourhood Plan) are passed to the Parish/Town Council where the development has taken place for them to spend on infrastructure within their area (or pass to a neighbouring Parish/Town Council area). In the Unparished area it was decided to consult with the locally elected Ward Members on spending of the local contribution. Regulation 62 of the Community Infrastructure Levy Regulations (2010) requires a Charging Authority to prepare and publish a report annually of CIL receipts and spending. CIL charges should be set at a rate that ensures most new development remains viable. As such, fluctuations in residential and commercial development markets and changes in construction costs may have significant impact on development viability. Periodic monitoring and review is therefore necessary to ensure the CIL Charging Schedule is appropriate. There are a number of sources of information and indices for both sales values and build costs. For the period of March 2015 to March 2016 we have used the Land Registry House Price Index for South Gloucestershire, which shows sold prices. There are different indices, but the average price at March 2015 was £216,877. The average price at March 2016 was £242,297, an increase of 11.72%. In terms of residential Build costs BCIS does not have figures for South Gloucestershire. The respective average prices for Gloucester & Bristol for general estate housing at 1st March 2015,

44
Amount of completed leisure development in South Gloucestershire (sq.m net floorspace)
Year D2 – leisure
2011/2012 -820
2012/2013 299
2013/2014 Nil
2014/2015 24,700
2015/2016 6,956
2016/2017 3,105 Table 2.14
Amount of completed leisure development in town centres
Year D2 - leisure
2011/2012 0%
2012/1013 0%
2013/2014 0%
2014/2015 0%
2015/2016 0%
2016/2017 0%
Table 2.15
Source: Strategic Planning Policy and Specialist Advice (South Gloucestershire Council)
are £914 and £971 per sq.m, and 1st March 2016 it is £959 & £1020 per sq.m, an increase of 4.9% and 5% respectively. The BCIS All in Tender price index for the period shows an increase in build costs of 1.9%. The indications are therefore that both sales values and to a lesser extent build costs have risen within the period. These adjustments are not considered significant enough to warrant a full review of the adopted CIL charges at this time. Further information regarding the South Gloucestershire Council Community Infrastructure Levy can be found here. If you would like to contact us regarding CIL policy email [email protected]. If you would like to contact us regarding CIL funds and spending email [email protected].
Commentary Table 2.14 shows that there has been a net increase in leisure floorspace in 2016/2017 this increase can be attributed to two sites the first being the change of use of part of the vacant B & Q retail unit on Fox Den Road, Stoke Gifford to a gym (2,448 sq.m); and the change of use of a former A3 unit at Yate Riverside to a children’s nursery (657 sq.m). Table 2.15 shows that, as in previous years, none of the completed leisure developments were in any of South Gloucestershire’s town centres. This can be attributed to the fact that South Gloucestershire’s town centres do not lend themselves to large scale leisure development (which is above the threshold of 500 sq.m).
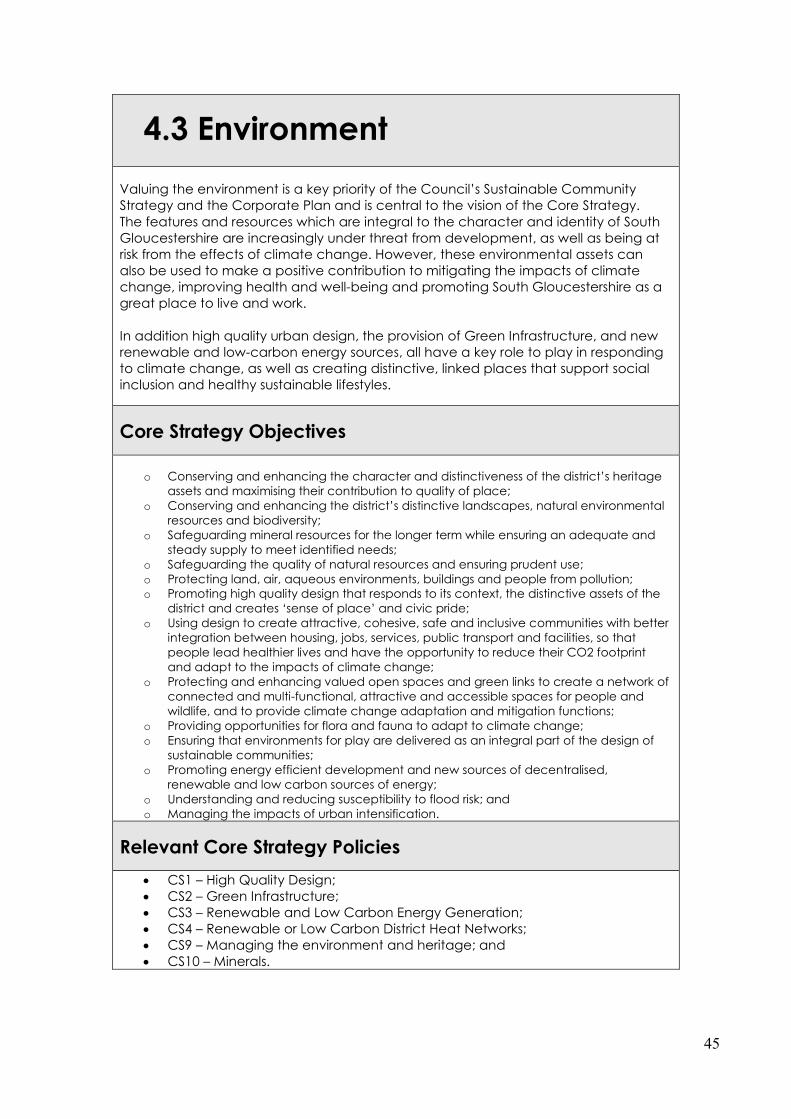
45
4.3 Environment
Valuing the environment is a key priority of the Council’s Sustainable Community Strategy and the Corporate Plan and is central to the vision of the Core Strategy. The features and resources which are integral to the character and identity of South Gloucestershire are increasingly under threat from development, as well as being at risk from the effects of climate change. However, these environmental assets can also be used to make a positive contribution to mitigating the impacts of climate change, improving health and well-being and promoting South Gloucestershire as a great place to live and work. In addition high quality urban design, the provision of Green Infrastructure, and new renewable and low-carbon energy sources, all have a key role to play in responding to climate change, as well as creating distinctive, linked places that support social inclusion and healthy sustainable lifestyles.
Core Strategy Objectives
o Conserving and enhancing the character and distinctiveness of the district’s heritage assets and maximising their contribution to quality of place;
o Conserving and enhancing the district’s distinctive landscapes, natural environmental resources and biodiversity;
o Safeguarding mineral resources for the longer term while ensuring an adequate and steady supply to meet identified needs;
o Safeguarding the quality of natural resources and ensuring prudent use; o Protecting land, air, aqueous environments, buildings and people from pollution; o Promoting high quality design that responds to its context, the distinctive assets of the
district and creates ‘sense of place’ and civic pride; o Using design to create attractive, cohesive, safe and inclusive communities with better
integration between housing, jobs, services, public transport and facilities, so that people lead healthier lives and have the opportunity to reduce their CO2 footprint and adapt to the impacts of climate change;
o Protecting and enhancing valued open spaces and green links to create a network of connected and multi-functional, attractive and accessible spaces for people and wildlife, and to provide climate change adaptation and mitigation functions;
o Providing opportunities for flora and fauna to adapt to climate change; o Ensuring that environments for play are delivered as an integral part of the design of
sustainable communities; o Promoting energy efficient development and new sources of decentralised,
renewable and low carbon sources of energy; o Understanding and reducing susceptibility to flood risk; and o Managing the impacts of urban intensification.
Relevant Core Strategy Policies
CS1 – High Quality Design; CS2 – Green Infrastructure; CS3 – Renewable and Low Carbon Energy Generation; CS4 – Renewable or Low Carbon District Heat Networks; CS9 – Managing the environment and heritage; and CS10 – Minerals.
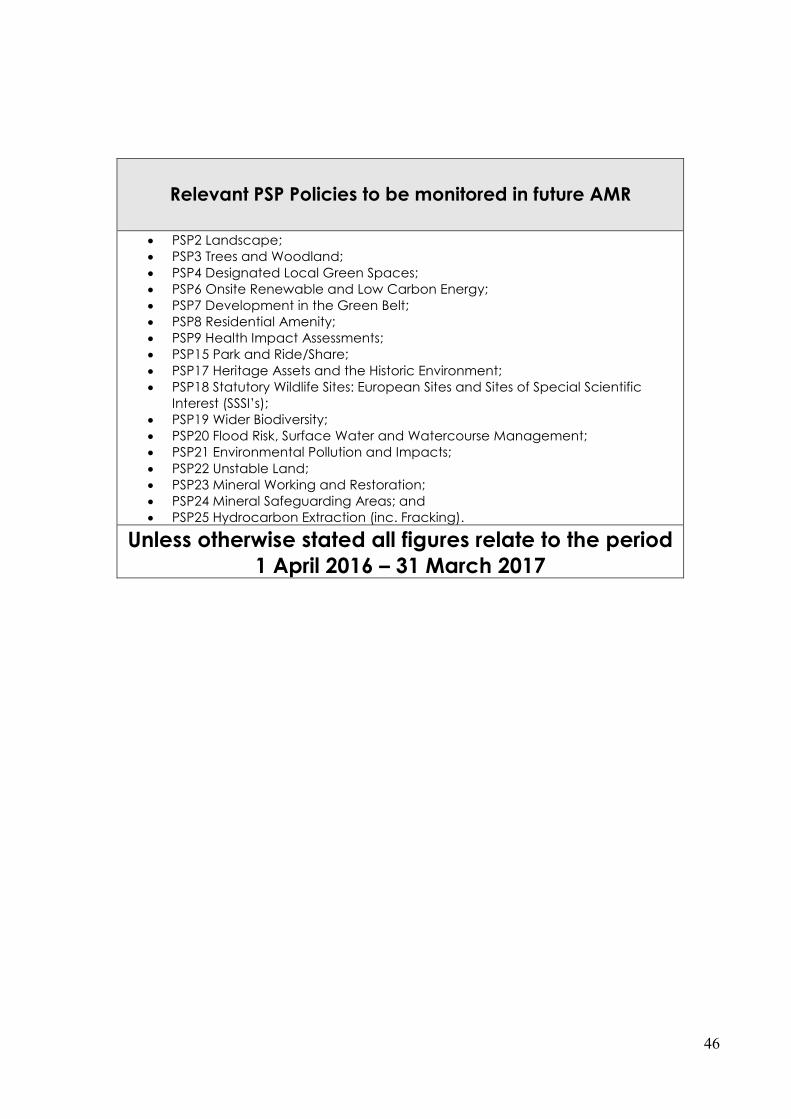
46
Relevant PSP Policies to be monitored in future AMR
PSP2 Landscape; PSP3 Trees and Woodland; PSP4 Designated Local Green Spaces; PSP6 Onsite Renewable and Low Carbon Energy; PSP7 Development in the Green Belt; PSP8 Residential Amenity; PSP9 Health Impact Assessments; PSP15 Park and Ride/Share; PSP17 Heritage Assets and the Historic Environment; PSP18 Statutory Wildlife Sites: European Sites and Sites of Special Scientific
Interest (SSSI’s); PSP19 Wider Biodiversity; PSP20 Flood Risk, Surface Water and Watercourse Management; PSP21 Environmental Pollution and Impacts; PSP22 Unstable Land; PSP23 Mineral Working and Restoration; PSP24 Mineral Safeguarding Areas; and PSP25 Hydrocarbon Extraction (inc. Fracking).
Unless otherwise stated all figures relate to the period 1 April 2016 – 31 March 2017

47
Number of planning permissions granted contrary to Environment Agency advice on flooding or water quality grounds
Year No. of applications with no outstanding EA
Objection or concerns* No. of applications with an unresolved EA
Objection
Total No. of applications
refused planning
permission
No. of applications withdrawn
No. of applications
granted approval*
No. of applications
refused planning
permission
No. of applications withdrawn
No. of applications
granted approval
contrary to EA advice
2009/2010 7 (8%) 8 (9%) 64 (74%) 3 (3%) 4 (5%) 1 (1%) 87
2010/2011 15 (16%) 13 (14%) 60 (65%) 2 (2%) 3 (3%) 0 (0%) 93
2011/2012 11 (16%) 7 (10%) 44 (65%) 3 (4%) 3 (4%) 0 (0%) 68
2012/2013
***
***
***
***
***
*** ***
2013/2014
***
***
***
***
***
*** ***
2014/2015 12 (8%) 8 (5%) 116(79%) 5(3%) 2(1%) 3(2%) 146
2015/2016 8 (8%) 3 (3%) 76 (76%) 5 (5%) 1 (1%) 3 (3%) 100
2016/2017 19 (16%) 5 (4%) 86 (70%) 9 (7%) 2 (2%) 1 (1%) 122
Table 3.1
Source: Strategic Planning Policy and Specialist Advice Team (South Gloucestershire Council)
* Includes where EA concerns were mitigated through inclusion of informatives and/or conditions in the Decision
Notice N.B. Figures are rounded
Commentary The Council is concerned to ensure that water resources are not unacceptably affected by development and that development proposals within flood risk areas (defined by the Environment Agency’s Flood Maps) incorporate appropriate mitigation measures. The Council consults with the Environment Agency to ensure that development proposals meet the acceptable environmental standards set out in national planning policy. Due to changes in the way that the Environment Agency (EA) report this indicator (via their High Level Target 5 Report (HLT5)) a new method of extracting the data from the Council’s Development Management Records was developed in the 2009/2010 monitoring year. Table 3.1 shows the number of applications on which the Environment Agency provided formal comments to the Council in 2016/2017. The table shows that in 90% of cases the EA had no outstanding objection. In a lot of these cases an initial EA objection was later withdrawn as a result of further information being submitted by the applicant. In other cases, EA concerns were mitigated through the inclusion of informatives or conditions in the Decision Notice. Of the 12 applications where there was an outstanding Environment Agency objection:
2 were withdrawn partly as a result of the EA objection. 9 were refused planning permission where the EA objection formed one of the reasons
for refusal.
1 planning application was granted approval contrary to EA advice. Application DOC15/0266 was granted contrary to EA advice regarding the discharge of condition 3: Updated Flood Risk Assessment. The original application was granted permission on appeal in September 2014.

48
No. of ‘poor’ air quality days when pollution exceeds national air quality objectives Year
No. of poor air quality days
2008 2009 2010 2011 2012 2013 2014 2015 2016
15 5 3
20 4 1 1 4 0
Figure 3.1
Source: South Gloucestershire Council Environmental Protection Team
Annual average nitrogen dioxide levels
Fig 3.2 Source: South Gloucestershire Council Environmental Protection Team
49
Commentary The Council has a duty to review and assess air quality within its district. Air pollutants can arise from transport, industrial, commercial and domestic sources. The main air pollutant of concern locally is nitrogen dioxide (NO2), which originates primarily from road traffic emissions. Nitrogen dioxide is associated with adverse effects on human health, particularly in relation to respiratory and cardiovascular function. Pollutant levels are assessed against health-based national air quality objectives. Where pollutant levels are identified above the objectives, the Council has a duty to declare Air Quality Management Areas (AQMAs). The above Figures include the 2016 data derived from the single remaining automatic monitoring site in South Gloucestershire located in Yate. The Kingswood and Filton automatic monitoring stations closed in 2010 and 2014 respectively. Figure 3.1 shows there were no poor air quality days in 2016 at the Yate monitoring station. In all years shown, the number of short term exceedances is well below the target level. Figure 3.2 shows the annual average nitrogen dioxide level for 2016 at the Yate automatic monitoring site has increased from 2015 to 24µg/m3; the same level as that recorded in 2014. The levels of nitrogen dioxide, however, remain well below the national annual mean objective for nitrogen dioxide (40µg/m3) at this monitoring site. Nitrogen dioxide is also monitored across the district at other non-automatic (diffusion tube) sites. This monitoring previously identified exceedances of the annual mean objective for nitrogen dioxide in three areas and in 2010, AQMAs were declared in the centre of Kingswood and Staple Hill and at Cribbs Causeway adjacent to the M5 Junction 17 roundabout. The Kingswood and Staple Hill AQMAs were extended in 2012 following further assessment of these areas. The Council produced an Air Quality Action Plan in 2012 aimed at improving air quality in these AQMAs. The plan focuses predominantly on transport measures. An update on the progress made in implementing the Action Plan is included in the annual air quality reports the Council produces. The monitoring results for the Cribbs Causeway AQMA show the nitrogen dioxide levels are below the annual mean objective and have been for the past five years, so revocation of this AQMA is being considered. In December 2015, the Kingswood AQMA was extended along the A420 to Warmley and the Kingswood - Warmley AQMA was declared. This followed a detailed assessment in 2014, which identified new locations along the A420 corridor where the nitrogen dioxide annual mean objective was being exceeded. The Air Quality Action Plan is being updated and appropriate actions will be identified to cover the new extent of the AQMA. In future, a new air quality indictor will be reported as follows: Number of monitoring sites exceeding the annual mean nitrogen dioxide objective (40 µg/m3) in South Gloucestershire:
a) Total number of monitoring sites exceeding the annual mean nitrogen dioxide objective
(40 µg/m3) in South Gloucestershire;
b) Number of monitoring sites exceeding the annual mean nitrogen dioxide objective (40
µg/m3) within Air Quality Management Areas; and
c) Number of monitoring sites exceeding the annual mean nitrogen dioxide objective (40
µg/m3) outside AQMAs.

50
Change in areas of biodiversity importance
Local Nature Reserve (LNRs)
Site of Nature
Conservation Importance
(SNCIs)
Site of Special
Scientific Interest (SSSIs)
Area of Outstanding
Natural Beauty (AONB)
*SPA/ Ramsar (also an
SSSI)
*RIGS
2008/2009 106.25 Ha
(7LNRs) 268 sites
553 Ha (22 sites)
11,800 Ha 4,104 Ha 52 sites
2009/2010 108.69 Ha (9 LNRs)
269 sites 553 Ha
(22 sites) 11,800 Ha 4,104 Ha 53 sites
2010/2011 108.69 Ha (9 LNRs)
269 sites 553 Ha
(22 sites) 11,800 Ha 4,104 Ha 53 sites
2011/2012 108.69 Ha (9 LNRs)
269 sites 553 Ha
(22 sites) 11,800 Ha 4,104 Ha 53 sites
2012/2013 108.69 Ha (9 LNRs)
269 sites 553 Ha
(22 sites) 11,800 Ha 4,104 Ha 53 sites
2013/2014 108.69 Ha (9 LNRs)
269 sites 553 Ha
(22 sites) 11,800 Ha 4,104 Ha 53 sites
2014/2015 108.69 Ha (9 LNRs)
269 sites 553 Ha
(22 sites) 11,800 Ha 4, 104 Ha 53 sites
2015/2016 108.69 Ha (9 LNRs)
269 sites 553 Ha
(22 sites) 11,800 Ha 4, 104 Ha 53 sites
2016/2017 108.69 Ha (9 LNRs)
273 sites 553 Ha
(22 sites) 11,800 Ha 4,104 Ha 67 sites
Table 3.2 Source: Ecological Officer (South Gloucestershire Council)
*KEY
SPA International Severn Estuary Special Protection Area
Ramsar Wetlands of international importance, designated under the Ramsar Convention
RIGS Regionally Important Geological and Geomorphological Sites
Commentary South Gloucestershire contains an extensive portfolio of sites of importance for nature conservation, protected by a combination of local, regional, national or international designations. Significant parts of South Gloucestershire are predominantly rural where the agricultural landscape is greatly influenced by large scale scarps, ridges, vales, levels and estuary landforms, overlain by a variety of land cover, and which in places comprises unique natural or historic features. The numbers of Local Sites has increased from 2016 with four new SNCIs and fourteen new RIGS adopted by the Council as recommended by the Local Sites Partnership and Avon RIGS Group. In November 2017, a group of volunteers led by the Council’s Biodiversity Officer carried out a programme of management works to control scrub at the Parkway P&R SNCI; and the Council is exploring the possibility of using Highway England ‘Legacy’ funding to restore grassland SNCIs as part of the new M49 motorway junction. At a more strategic level, the Iconic Wildlife & Landscape Sub-Group of the Local Nature Partnership (LNP) continues to investigate the possibility of the LNP championing ‘local sites’ across the West of England to encourage their sympathetic management for biodiversity. The South Gloucestershire Biodiversity Action Plan has been consolidated and extended and its species and habitats continue to be protected under plan policy within the Policies, Sites & Places Plan.

51
Change in priority habitats and species, by type
Priority Habitat
Year Ancient
Woodland Coastal Salt
Marsh/
Old Meadows
and Pastures
Ponds, Rhynes, Rivers &
Water Bodies
Hedges and Field Margins
Arable Farmland
Orchards
2015/2016 Static Static Static Increasing Increasing Declining Static
2016/2017 Static Static Static Increasing Declining Declining Static
Table 3.3a
UK Priority Species
Year Bullfinch Dormouse Lesser
Horseshoe Bat
Song Thrush
White Clawed Crayfish
Great Crested
Newt
Tassel Stonewort
2015/2016 Static Static Static Static Declining Static Static
2016/2017 Static Static Static Static Locally Extinct
Static Static
Table 3.3b
Local Priority Species
Year Adders Tongue
Spearwort
Bath Asparag
us
Wild Service
Tree
Bithynian Vetch
Glow Worm
Slow-Worm
Barn Owl Hedgehog
2015/2016 Static Static Increasing Static Static Static Static Static
2016/2017 Increasing Static Static Static Static Static Static Static
Table 3.3c Source: Ecological Officer (South Gloucestershire Council)
Commentary As in previous years, it is not possible to gather precise data on the actual figures relating to the populations and extent of priority species and habitat. However, a general impression can be gleaned through the new areas of semi-natural habitat being created as part of (particularly major) planning applications. The increase in the number of major residential schemes on intensive farmland continues to offer opportunities for biodiversity through new SUDS (‘Ponds, Rhynes, Rivers and Water Bodies’); conversely, such development has inevitably led to a loss of hedges and agricultural field margins although the majority of these, having been intensively managed, have had very limited value for wildlife. White-clawed crayfish are now considered to be extinct within South Gloucestershire, either displaced by alien signal crayfish or through crayfish ‘plague’. Adder’s tongue spearwort has increased in number due to positive management works carried out on the species sole resident ponds near Hawkesbury. Wild service tree was considered to be static in 2017 purely due to a lack of landscape planting plans for residential schemes agreed that year. The Heritage Lottery Fund (HLF) Landscape Partnership project ‘A Forgotten Landscape’ continued throughout 2017 and continues to make a contribution towards the conservation of many of the above habitats and species through the work of its project team and the enthusiastic and motivated network of volunteers and participants that it has generated across the project area http://www.aforgottenlandscape.org.uk/.

52
No. of appeals won/lost by the Council where AONB, a Conservation Area or Listed Building was a material consideration
Date
AONB (SGLP policy L2)
Conservation Area (SGLP policy L12)
Listed Building (SGLP policy L13 & L14)
Won Lost Won Lost Won Lost
2008/2009 0 1 4 3 7 2
2009/2010 0 1 3 1 6 0
2010/2011 0 0 3 2 4 0
2011/2012 0 0 2 0 4 1
2012/2013 1 0 1 0 1 1
2013/2014 0 1 2 1 1 0
2014/2015 0 0 5 0 5 3
2015/2016 1 0 2 1 8 1
2016/2017 1 0 2 1 3 2 Table 3.4
Source: Strategic Planning Policy and Specialist Advice Team (South Gloucestershire Council)
Commentary Policies set out in Chapter 4 of the 2006 Local Plan (SGLP) and CS1/CS9 of the Core Strategy 2006-2027 seek to protect Conservation Areas, Listed Buildings and Areas of Outstanding Natural Beauty (AONB); they are regarded as a fundamental aspect of our natural and cultural heritage. Table 3.4 indicates that these policies are generally achieving this objective. In the 2016/2017 monitoring year, the Council was successful in 2 of 3 appeals where policies relating to conservation were a material consideration. The Council won 3 of 5 appeals where policies relating to Listed Buildings were a material consideration. In those which were lost the inspector generally found that the benefits to listed buildings outweighed harm. There was 1 appeal made to the Council in the monitoring year of 2016/2017 where Area of Outstanding Natural Beauty (AONB) was a material consideration. This was won by The Council.
Number of Tree Preservation Orders made (TPOs)
Year With Individual Trees
With Groups of Trees
Area Orders Woodland Orders
2008/2009 34 2 0 0
2009/2010 27 1 0 1
2010/2011 43 23 3 2
2011/2012 67 30 2 1
2012/2013 23 4 2 1
2013/2014 29 6 7 1
2014/2015 25 8 9 1
2015/2016 22 11 6 3
2016/2017 33 12 7 4 Table 3.5
Source: Strategic Planning Policy and Specialist Advice Team (South Gloucestershire Council)
Commentary Tree Preservation Orders (TPOs) represent an important contribution towards both the safeguarding and facilitation of biodiversity, and to retaining the local distinctiveness of an area. The protection of groups of trees is especially important because they play a vital role for many species and make a significant contribution to maintaining high levels of biodiversity.

53
Production of primary land won aggregates
Year Annual production of primary land won aggregates for West of England*
2007/2008 4.06 million tonnes
2008/2009 4.32 million tonnes
2009/2010 3.37 million tonnes (1.75 million tonnes South Glos)
2010/2011 3.22 million tonnes
2011/2012 3.1 million tonnes
2012/2013 2.89 million tonnes
2013/2014 2.66 million tonnes
2014/2015 3.19 million tonnes
2015/2016 3.62 million tonnes
2016/2017 Data not currently available Table 3.6
*Confidentiality restrictions prevent publication of production figures for individual mineral planning authorities
Commentary In line with both the South West and nationally there has been a trend of declining sales in recent years, largely reflecting the recession. There has however been an increase in sales in this and the previous monitoring year.
Size of landbank for crushed rock
Commentary The adopted Core Strategy Policy CS10 relates to minerals and states that the council will seek to maintain a landbank for crushed rock of at least 10 years. The Policies, Sites and Places Plan, which was adopted in 2017, makes provision for additional land for mineral working, to ensure that a 10 year landbank can be maintained. Currently the calculated landbank is in excess of 10 years. This indicator will be monitored and reported annually.
Size of landbank for clay
Commentary As there is only one production unit operating in the area, no data is published to protect commercial confidentiality.
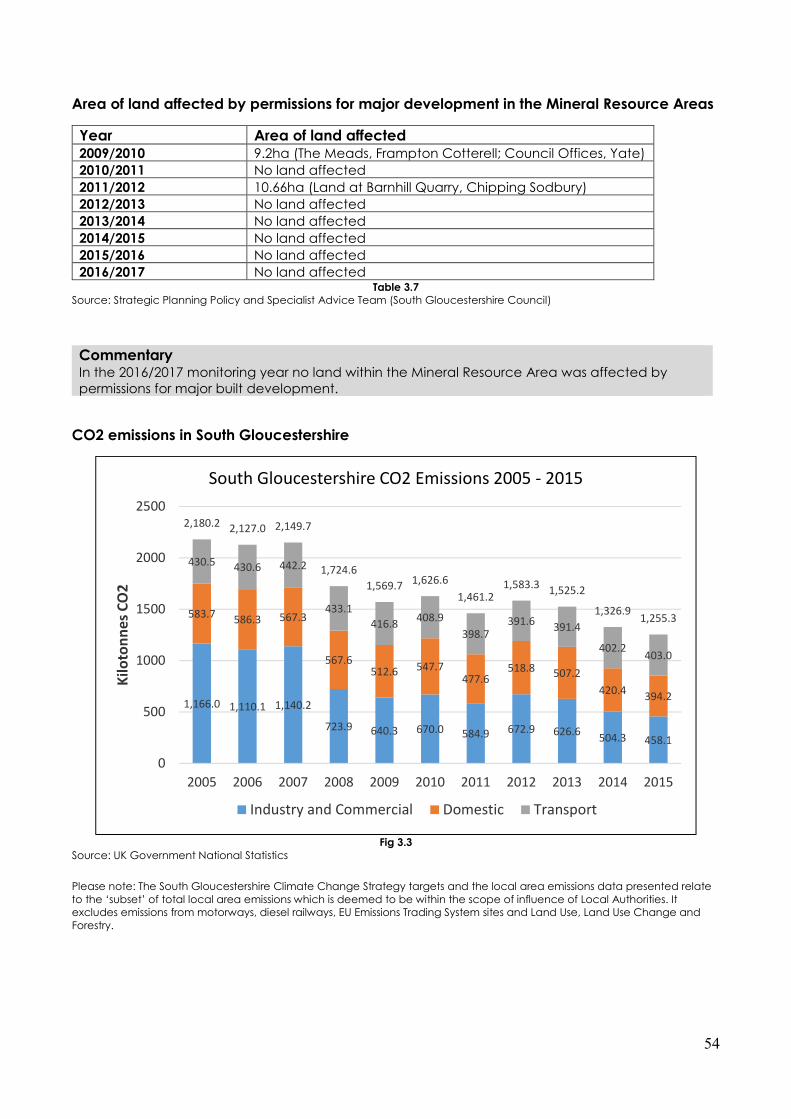
54
Area of land affected by permissions for major development in the Mineral Resource Areas
Year Area of land affected 2009/2010 9.2ha (The Meads, Frampton Cotterell; Council Offices, Yate)
2010/2011 No land affected
2011/2012 10.66ha (Land at Barnhill Quarry, Chipping Sodbury)
2012/2013 No land affected
2013/2014 No land affected
2014/2015 No land affected
2015/2016 No land affected
2016/2017 No land affected Table 3.7
Source: Strategic Planning Policy and Specialist Advice Team (South Gloucestershire Council)
Commentary In the 2016/2017 monitoring year no land within the Mineral Resource Area was affected by permissions for major built development.
CO2 emissions in South Gloucestershire
Fig 3.3
Source: UK Government National Statistics Please note: The South Gloucestershire Climate Change Strategy targets and the local area emissions data presented relate to the ‘subset’ of total local area emissions which is deemed to be within the scope of influence of Local Authorities. It excludes emissions from motorways, diesel railways, EU Emissions Trading System sites and Land Use, Land Use Change and Forestry.
1,166.0 1,110.1 1,140.2
723.9 640.3 670.0 584.9 672.9 626.6504.3 458.1
583.7 586.3 567.3
567.6512.6 547.7
477.6518.8 507.2
420.4394.2
430.5 430.6 442.2
433.1
416.8408.9
398.7391.6 391.4
402.2403.0
2,180.2 2,127.0 2,149.7
1,724.6
1,569.7 1,626.6
1,461.21,583.3 1,525.2
1,326.91,255.3
0
500
1000
1500
2000
2500
2005 2006 2007 2008 2009 2010 2011 2012 2013 2014 2015
Kilo
ton
nes
CO
2
South Gloucestershire CO2 Emissions 2005 - 2015
Industry and Commercial Domestic Transport

55
Commentary South Gloucestershire Partnership is committed to reducing CO2 emissions arising from industrial, commercial and domestic sources and from local road transport. The South Gloucestershire Climate Change Strategy has a target to reduce CO2 emissions by 80% to 414.6 Kilotonnes (kt) by 2050. This includes interim targets to reduce them by 35% by 2020 and by 50% by 2025. The targets are set against a 1990 baseline emissions figure of 2,073.3kt. Each year the Department of Business, Energy and Industrial Strategy provide a breakdown of CO2 emissions by local authority area. In 2015 (the most recently available data), emissions were 39% lower than in 1990 and 5.4% lower than the previous year. Annual emissions are influenced by factors such as weather conditions, new development, the wider economy as well as local and national policies and drivers. These factors will continue to influence future energy consumption and CO2 emissions.

56
Proportion of energy produced from renewable sources
Fig 3.4
Source: Regen SW project database 2016 and South Gloucestershire Council data 2016/17
Commentary
The climate change strategy includes a target for 7.5% of South Gloucestershire’s total energy demand (i.e. electricity, heat and transport) to be met from renewable sources by 2020. Renewable energy currently generated in South Gloucestershire is equal to 3.39% of projected 2020 energy demand. If all the consented renewable energy schemes are developed (with the exception of the consented Anaerobic Digestion project in Severnside which has now been abandoned), the amount of renewable energy being generated would be equal to 4.37% of projected 2020 total energy demand. Renewable Energy has not been developed at the rate anticipated when the Climate Change Strategy was prepared in 2013. This reflects the situation nationally and is predominantly a reflection of national changes to renewable energy subsidies and planning requirements. An updated assessment of renewable energy resources in South Gloucestershire has been undertaken and also an assessment of possible future scenarios of renewable energy generation and energy demand in South Gloucestershire. The findings will inform the review of the renewable energy target that will be consulted upon in the forthcoming refresh of the Climate Change Strategy. Also, work continues on exploring the potential for strategic district heat networks in South Gloucestershire and Bristol.
Statutory Greenbelt change
Year Statutory greenbelt change
2010/2011 None
2011/2012 None
2012/2013 None
2013/2014 - 205.47 ha
2014/2015 None
2015/2016 None
2016/2017 None Table 3.8
Source: MapInfo (Cartesian Measure)
0.1
1
1.0
4
0.0
4
0.3
3
1.8
6
0 0.5 1 1.5 2 2.5 3 3.5 4
Existing Renewable Energy Generation as % of projected 2020 energy demand, by technology
Heat Pumps Biomass
Solar PV (ground and roof mounted) Wind Turbines
Landfill Gas Energy from Waste

57
Commentary Green Belt (GB) serves a number of important functions in planning terms; it prevents the (otherwise) unrestricted sprawl of large built-up areas; it prevents the coalescence of neighbouring towns, and; focuses development towards urban areas. There has been no change to the Statutory Green Belt area in South Gloucestershire for the 2016/2017 monitoring year.
Area of SSSI lost as a result of built development
Year Amount of SSSI lost as a result of built development
2008/2009 None
2009/2010 None
2010/2011 None
2011/2012 None
2012/2013 None
2013/2014 None
2014/2015 None
2015/2016 None
2016/2017 None Table 3.9
Source: Ecological Officer (South Gloucestershire Council)
Commentary Sites of Special Scientific Interest (SSSIs) are identified under the Wildlife and Countryside Act 1981 (as amended by the Countryside and Rights of Way Act 2000) as an area of special interest by reason of any of its flora, fauna, geological or physiographical features. As is shown in Table 3.9, there are currently 22 SSSIs in South Gloucestershire which account for around 553ha of the District. The figures show that the Council is giving adequate protection to Sites of Special Scientific Interest, as no area designated as an SSSI has been lost to built development over the past 8 years.
Amount of publicly accessible Green Infrastructure per 1,000 population (*2013/14 data)
Quantity per 1,000 residents
Policy CS24 Standard
Informal recreational greenspace 1.294 1.4
Natural/Semi-Natural greenspace 5.140 1.5
Allotments 0.127 0.2
Outdoor sports 1.464 1.6
Children’s play 0.064 0.25 Table 3.10
Source: Environmental Partnerships and Projects Officer (South Gloucestershire Council)

58
Informal recreational greenspace Informal recreational greenspace is not evenly distributed throughout South Gloucestershire and there are differences in provision levels between the urban analysis areas and the rural/other area. Natural/Semi-Natural greenspace Although the current supply level across South Gloucestershire is significantly above the recommended provision standard, semi-natural greenspace is not evenly distributed across the authority’s area. While the level of supply is high within South Gloucestershire’s rural areas, it is significantly lower within the district’s urban areas. Allotments The current supply of allotment plots is less than the recommended standard. The standard reflects the large numbers on waiting lists due to the increased demand for allotments. Additional provision has been created through the sub division of plots to create half plot sizes (250sqm full / 125sqm half plot). Outdoor sports The current supply of outdoor sport facilities is below the recommended provision standard of 1.6ha per 1000 population. Please note this AMR includes pavilions. Children’s play The current supply of equipped play space is below the recommended standard across the district. The provision standard needs to be carefully applied as it is desirable to ensure a range of provision to cater for different age groups. N.B. Table 3.10 presents a district wide analysis at a snap shot in time of the provision available and does not therefore preclude the need to undertake a more detailed analysis of local provision levels in support of any development proposals.
59
5. Monitoring the Joint Waste Core Strategy (JWCS)
The tables below document the monitoring tables for the Joint Waste Core Strategy for 2016/17 (1/4/16-31/3/17). The Joint Waste Core Strategy sets out the strategic spatial planning policy for the provision of waste management infrastructure across the West of England sub-region and is underpinned by an understanding of the local distinctiveness of the sub-region.
JWCS Strategic Objectives
o To move the management of waste up the waste hierarchy by increasing waste minimisation, recycling and composting then recovering further value from any remaining waste, and only looking to landfill for the disposal of pre-treated waste;
o To help enable communities and businesses in the West of England to take responsibility for the waste they generate;
o To continue to promote public awareness towards a shared commitment to waste prevention and reuse;
o To deliver the timely provision of an integrated network of waste management facilities to meet requirements in the West of England;
o To contribute to reducing and adapting to the impacts of climate change by driving waste up the hierarchy and encouraging the provision of waste management facilities at appropriate locations;
o To encourage sustainable construction and waste minimisation in new development;
o To ensure that waste management facilities do not harm the environment or endanger human health and where possible provide benefits; and
o To locate waste development in accordance with land use priorities, giving preference to previously developed land and/or urban areas.

60
Relevant Core Strategy Policies
Policy 1 – Waste Prevention; Policy 2 – Non-residual waste treatment facilities (excluding open windrow
composting); Policy 3 – Open windrow composting; Policy 4 – Recycling, storage and transfer of construction, demolition and
excavation waste at mineral sites; Policy 5 – Residual waste treatment facilities – locations; Policy 6 – Residual waste treatment facilities – operational expectations; Policy 7 – Consideration of residual waste treatment proposals at sites not
allocated in the JWCS; Policy 8 – Landfill, landraise, engineering or other operations – Principles; Policy 9 – Landfilling, landraising and engineering or other operations – Details; Policy 10 –Waste water treatment; Policy 11 – Planning Designations; Policy 12 – General Considerations; and Policy 13 – Safeguarding operational and allocated sites for waste
management facilities.
JW1: Recycling/ Composting
Unitary Authority Indicative requirement at 2026 as set out in the JWCS (tonnes)
Capacity of applications approved during 2016/17 (tonnes)
Capacity lost during 2016/17 (tonnes)
Capacity operational at 31/03/2017 (tonnes)
Capacity permitted but not operational at 31/03/2017 (tonnes)
Bath & North East Somerset 0 0 117,300 0
Bristol City 168,780 0 320,000 264,780
North Somerset 0 0 268,200 0
South Gloucestershire 0 0 203,220 2,500
(West of England 858,000¹ 168,780 0 908,720 267,280
¹ municipal, commercial & industrial waste
Source: The four West of England authorities
Commentary There has been changes from the 2015/16 situation for Bristol, with planning consents granted during 2016/17. They included a change of use of buildings at Blocks 2-3 Chittening Industrial Estate, Bristol from B2/B8 uses to a paper processing and recycling facility (application 16/04253/F), and construction of new vehicle recycling centre at Severn Road Avonmouth (15/05705/F ). NB. The Joint Waste Core Strategy (JWCS) sets out an indicative requirement for recycling and composting of municipal, commercial and industrial waste. However, the capacity tonnages of operational and permitted sites in the monitoring table may include construction, demolition and excavation waste, as many recycling facilities, particularly transfer stations, recycle this waste as well.

61
JW2: Recovery
Zone & indicative capacity/ requirement at 2026, as set out in the Spatial Strategy (Policy 5 of the JWCS)
Capacity of applications approved during 2016/17 (tonnes)
Capacity lost during 2016/17 (tonnes)
Capacity operational at 31/03/2017 (tonnes)
Capacity permitted but not operational at 31/03/2017 (tonnes)
Electricity and/or heat output from operational recovery facility (MW)
A~390,000tpa 0 0 508,000 664,000 ?
C~150,000 tpa 0 0 0 125,000 0
D~60,000tpa 0 0 0 0 0
E~100,000tpa 0 0 15,000, 0 1.1
West of England = 800,000tpa
0 0 523,000 789,000 1.1+?
Source: The four West of England authorities
Commentary The main change since 2015/16 has been in zone A reflecting the fact that in December 2016 the SUEZ 400,000tpa capacity Severnside Energy Recovery Centre near Seabank Power Station began operating, boosting the “capacity operational” column and reducing the “capacity permitted but not operational” column”.
JW3: Landfill Hazardous/ non-hazardous Landfill
Unitary Authority
Site Name Capacity of applications approved during 2016/17 (tonnes)
Landfill capacity which became unavailable during 2016/17 (tonnes)
Landfill operational at 31/03/2017 (tonnes)
Landfill permitted but not started at 31/03/2017 (tonnes)
Bath & North East Somerset
N/A 0 0 0 0
Bristol City N/A 0 0 0 0
North Somerset
N/A 0 0 0 0
South Gloucestershire
Shortwood Landfill Site
0 2,000,000 / 200,000 per
annum 2007-2019
0
West of England
0 0 2,000,000 / 200,000 per
annum
0

62
Inert Landfill
Unitary Authority
Site Name Capacity of applications approved during 2016/17 (tonnes)
Landfill capacity which became unavailable during 2016/17 (tonnes)
Landfill operational at 31/03/2017 (tonnes)
Landfill permitted but not started at 31/03/2017 (tonnes)
Bath & North East Somerset
N/A 0 0 0 0
Bristol City N/A 0 0 0 0
North Somerset Lulsgate Quarry, Felton
0 0 Unspecified quantity of restoration
material and finishing top soils to be
imported to allow for
restoration of quarry to Nov 2021
0
Durnford Quarry
0 0 Approx 382,500
tonnes per annum for 20 years (2012-
2032)
0
South Gloucestershire
Shortwood Landfill Site
0 0 250,000 / 20,000
assumed to be for 12
years
0
South Gloucestershire
Berwick Farm Landfill Site
0 0 73,000 / 36,500 per
annum for 2 years
0
South Gloucestershire
Beech Hill Farm, Westerleigh
0 0 0 45,000 / 2 years
West of England
0 0
Source: The four West of England authorities
Commentary The only change to the tables on landfill from the 2015/16 situation concerns the Inert Landfill table, and North Somerset. There was approval granted on 21/7/17 for application 16/P/2915/F 17 to vary conditions of other consents so as to increase the time period (to Nov 2021) for importation of restoration materials and finishing sub and top soils to allow for restoration of Lulsgate Quarry to a community recreation area. (No details on quantity available.) While the approval was outside the 2016/17 monitoring period, it is useful information because it indicates that importation of material for restoration is still ongoing, (whereas the previous data suggested it would have ceased in 2016.)

63
Amount of municipal waste (local authority collected waste) arising, and managed by management type by waste planning authority
Year Landfill
(%)
Incineration with EfW
(%)
Incineration without EfW
(%)
Recycled / Composted
(%) Other (%)
Total waste arising
(%)
2008/2009 78,016.74 (56.4%)
14 (<0.05%) 0
60,185.15 (43.5%) 0
138,215.89 (100%)
2009/2010 73,872.12 (55.0%)
12.82 (<0.05%) 0
60,334.99 (44.9%) 0
134,219.93 (100%)
2010/2011 68,361.17 (51.4%)
281.94 (0.2%)
0 64,444.21 (48.4%)
11.17 (<0.01%)
133,098.49 (100%)
2011/2012 21,097.26 (16.1%)
21.95 (<0.1%)
0 69,771.55 (53.3%)
39,957.25 (30.5%)
130,848.01 (100%)
2012/2013 20,259.04 (16.0%)
4.86 (<0.1%)
0 65,884.32 (52.1%)
40,278.66 (31.9%)
126,426.88 (100%)
2013/2014 19,536.4
(15%)
1,822.32 (1.4%) 0
68,940.32 (52.8%)
40226.74 (30.8%)
130,525.78 (100%)
2014/2015 18,501.66 (14.7%)
41,462.88 (32.9%)
271.39 (0.2%)
62591.19 (49.7%)
3192.65 (2.5%)
126,019.77 (100%)
2015/2016 15,647.46 (12.5%)
44,331.96 (35.4%)
597.77 (0.5%)
62,270.23 (49.8%)
2,319.78 (1.8%)
125,167.20 (100%)
2016/2017 14,825 (12%)
38,811 (31%)
1,200 (1%)
62,678 (51%)
6,012 (5%)
123,547 (100%)
Table 5.5 Source: DEFRA
Commentary In 2016/17, 123,547 tonnes* of municipal waste was managed in South Gloucestershire, which is a 1% decrease when compared to the previous year. This can be attributed to improvements made to the Sort It Centre service. These improvements restrict non-resident access and trader abuse through the use of a vehicle registration system and van permit scheme. In 2016/17, 51%* of municipal waste was recycled which is an increase when compared to the previous two years. This increase is the result of increased recycling tonnage and the reduction in overall household waste which is collected. Since the start of the contract with SUEZ (previously SITA) in 2000, the amount of waste sent to landfill is for another year in succession at its lowest point. In 2016/17, only 12% of municipal waste was sent to landfill compared to around 12.5% in 2015/16. More material has been diverted from landfill to recycling during this period. Throughout 2017, changes are being made to further improve recycling rates, including weekly recycling collections which commenced in June 2017 and reducing the size of the black wheeled bins later in the year.

64
Appendix
JWCS Strategic Objectives
o To move the management of waste up the waste hierarchy by increasing waste minimisation, recycling and composting then recovering further value from any remaining waste, and only looking to landfill for the disposal of pre treated waste;
o To help enable communities and businesses in the West of England to take responsibility for the waste they generate;
o To continue to promote public awareness towards a shared commitment to waste prevention and reuse;
o To deliver the timely provision of an integrated network of waste management facilities to meet requirements in the West of England;
o To contribute to reducing and adapting to the impacts of climate change by driving waste up the hierarchy and encouraging the provision of waste management facilities at appropriate locations;
o To encourage sustainable construction and waste minimisation in new development;
o To ensure that waste management facilities do not harm the environment or endanger human health and where possible provide benefits; and
o To locate waste development in accordance with land use priorities, giving preference to previously developed land and/or urban areas.

65
66
6. Duty to Co-operate
Section 110 of the Localism Act sets out the duty to co-operate and requires authorities to
“engage constructively, actively and on an on-going basis”. It seeks to ensure that local
planning authorities lead strategic planning through their Local Plans, addressing social,
environmental and economic issues that can only be addressed effectively by working
with other local planning authorities beyond their own administrative boundaries. Local
planning authorities must give details of what action they have taken under the duty to
co-operate to their communities in their Authority’s Monitoring Reports.
During 2016/17, the authorities have undertaken the following work to articulate their
shared issues and priorities and to demonstrate their continued commitment to joint
working.
Joint Spatial Plan and Transport Study (JSP) The four West of England authorities are working together to prepare a Joint Spatial Plan
(JSP) and supporting technical evidence base. The JSP is a strategic statutory
development plan document (DPD) for the West of England.
The JSP has been developed in accordance with statutory requirements, particularly
around public consultation and engagement. It will provide the joint framework to ensure
development requirements come forward across the West of England authorities’ area
up to 2036 in a planned and co-ordinated manner. Whilst the JSP will not allocate new
sites, it does identify new Strategic Development Locations (SDLs), which will in turn be
brought forward as allocations through each authority’s new Local Plan. New site specific
allocations and policy designations in Local Plans will need to be in conformity with the
JSP. This method of approach demonstrates that the legal obligation of co-operation with
each other on strategic matters is satisfied.
This co-operation on strategic planning matters is complemented by the approach being
taken on future strategic transport issues. A review of strategic transport proposals through
the Joint Transport Study (JTS) has informed the development of future strategic transport
proposals up to 2036.
Consultation on the issues and options was undertaken between 9 November 2015 and
26 January 2016 and the results reported to members in June 2016.
The second consultation stage on the emerging spatial strategy for the West of England,
‘Towards the Emerging Spatial Strategy’ and the ‘Transport Vision Summary Document’
took place between 7 November and 19th December 2016. This document presented
the updated housing and jobs targets, together with a potential set of locations and
indicative capacities, to accommodate the level of development up to 2036, with

67
justification for their inclusion. The Transport Vision also took account of the views of
stakeholders and the public during the previous consultation and includes an ambitious
set of integrated packages to tackle current challenges on the network, as well as
addressing the impacts of developments included in the JSP.
On 22 November 2017, the Publication version of the JSP was published in line with
Regulations 19 and 20 of the Town and County Planning (Local Planning) Regulations
2012. Details of this engagement can be viewed online.
As part of preparing the Joint Spatial Plan, a number of key evidence base documents have also been published. These include:
Strategic Housing Market Assessment
The National Planning Policy Framework requires local authorities to prepare a Strategic
Housing Market Assessment (SHMA) of local housing needs. These assessments should
consider housing market areas and therefore need to be prepared jointly between
neighbouring authorities.
The SHMA documents produced to date for the JSP are:
Strategic Housing Market Assessment Volume 1
Strategic Housing Market Assessment Volume 2 Bath Strategic Housing Market Assessment: Establishing Objectively Assessed Need
Sustainability appraisal (SA) Government regulations require consultation with the Environment Agency, Historic
England and Natural England on the scope of this Appraisal. Consultation on the draft
Scoping Report was undertaken between 15th June and 20th July 2015.
A SA report has been published in support of each stage of producing the JSP, and these
can be viewed online.
Habitats Regulations Assessment (HRA)
A Habitats Regulations Assessment has been produced by the four unitary authorities. Its
purpose is to set out the process undertaken pursuant to satisfying the requirements of the
Conservation of Habitats and Species Regulations 2010 in relation to the JSP. The HRA
report has been published alongside the Publication JSP. It can be viewed online.
Infrastructure
This Infrastructure Position Statement (IPS) has been produced to support the JSP
Publication draft. The infrastructure included in this paper focusses solely on the larger,
more strategic transport schemes, strategic infrastructure provided by the utility
companies and our statutory providers, and the provision of secondary schools (due to
their cost and land requirement). Smaller scale infrastructure will be identified through
each UA’s Local Plan or site master-planning processes.

68
The IPS summarises the strategic infrastructure required to support “planned for” growth
across the WoE (to 2027), as identified in the 4 UA’s Core Strategies. This provides the
baseline position in respect of infrastructure delivery. It also provides a commentary on
the issues surrounding the delivery of strategic infrastructure to support the development
set out in the JSP.
Further details of the evidence base that has been prepared to support the JSP
Publication Plan is available to view online.
Local Aggregates Assessment (LAA)
A Local Aggregates Assessment has been prepared jointly by the four unitary authorities
which together comprise the West of England (WoE) sub region. The LAA is part of the
evidence base to inform the UAs Local Plans and covers the period 2006-2015.
Joint Planning Data Group (JaPDoG) The West of England authorities take a joint approach to research and intelligence across
the sub-region and there is a well-established joint working arrangement across a number
of areas, through the Joint Planning Data Group (JaPDoG). JaPDoG meets quarterly to
ensure consistency, best practice, share expertise and reduce duplication of effort across
the sub-region.

Appendix A: Actual and Expected House Completions - South Gloucestershire 2006 to 2027 (Net)
(See Appendix B of the 2017 AMR for Commentary on Expected Completions)
06/07 07/08 08/09 09/10 10/11 11/12 12/13 13/14 14/15 15/16 16/17 17/18 18/19 19/20 20/21 21/22 22/23 23/24 24/25 25/26 26/27 27/36 Total
RLS Ref.
Planning
Application
Number
Address
0002hn Bradley Stoke 56 34 32 122
0002hk Bradley Stoke 147 35 182
0003 Dragon Road, Winterbourne 1 1
0005 Hortham 77 107 52 25 9 270
0006a Stoke Park Hospital 1 1
0007 Filton College, Filton 51 26 77
0008a Charlton Hayes (PT09/1271/RM) - Bovis [H18] 8 43 51
0008b Charlton Hayes (PT09/0765/RM) - Bovis [H21, H22, H23] 75 18 18 111
0008c Charlton Hayes (PT10/0042/RM) - Bovis [H19, H20] 26 27 7 60
0008d Charlton Hayes (PT12/1137/RM) - Bovis [LC1] 33 33
0008e Charlton Hayes (PT11/1766/RM) - Bovis [Part MU5, Part MU6] 40 40
0008f Charlton Hayes (PT11/2687/RM) - Bovis [Part H50, Part H51] 25 28 53
0008h Charlton Hayes (PT12/0656/RM) - Barratt [H30] 31 15 46
0008i Charlton Hayes (PT12/1849/RM) - David Wilson [H27, H32] 34 6 40
0008j Charlton Hayes (PT12/0521/RM) - David Wilson [H31] 22 2 1 25
0008k Charlton Hayes (PT12/2470/RM) - Barratt [H28, H29, H33] 85 16 101
0008m Charlton Hayes (PT13/1003/RM) - Bovis [H25, H26] 10 65 75
0008n PT12/4119/RM Charlton Hayes (PT12/4119/RM) - Bellway [H34, H36] 25 56 5 86
0008o Charlton Hayes (PT13/0446/RM) - Bovis [H35, MU3] 65 65
0008p PT13/0559/RM Charlton Hayes (PT13/0559/RM) - Bovis [Part H51, Part H52 to H56] 23 78 36 137
0008r Charlton Hayes (PT13/4370/RM) - Bovis [H39] 54 54
0008s PT13/4443/RM Charlton Hayes (PT13/4443/RM) - Bovis [H8, H9, H10] 5 110 115
0008v PT15/1349/RM Charlton Hayes (PT15/1349/RM) - Bovis [MU2] 36 36
0008w PT15/3344/RM Charlton Hayes (PT15/3344/RM) - Linden [H38] 4 24 28
0008x PT15/1676/RM Charlton Hayes (PT15/1676/RM) - Bovis [H15, H16] 75 75
0009 PT02/3497/F Former Lime Works, Itchington 3 14 17
0010a Wallscourt Farm (Phase 1) 40 60 100
0010b Wallscourt Farm (Phase 2) 6 72 56 17 9 160
0010c Wallscourt Farm (Phase 3) 42 27 63 61 193
0010d Wallscourt Farm (Phase 4) 28 28 21 77
0010e Wallscourt Farm (Phase 5 part) 137 137
0010f Wallscourt Farm (Phase 7) 22 50 25 97
0010g PT15/0870/RM Wallscourt Farm (Phase 5 part) (PT15/0870/RM) 32 32
0012 162-164 Gloucester Road, Patchway -5 4 12 11
0015 Toghill Lane, Doynton 10 10
0017 46-92 Milton Road, Yate 16 16
0018 Land at Broad Lane, Yate 23 23
0020 Coopers Site, Westerleigh Road, Yate 14 46 7 67
0021a PT12/1302/RM Land at Harry Stoke, Stoke Gifford (PT12/1302/RM) 54 68 35 9 166
0022 472-478 Filton Avenue, Filton 21 21
0023 New Road, Filton 6 66 72
0024 West End, Marshfield 12 5 17
0025 Whiteshill House, Hambrook 10 10
0026 New Road, Rangeworthy 16 5 21
0027 The Galleon, Conygre Road, Filton 12 12
0028 The Lawns, Yate 14 14
0029 Fishpool Hill, Easter Compton -1 14 13
0033 Land at Siston Hill, Siston 77 211 96 63 57 504
0034 PK08/3230/F Hanham Hall Hospital, Hanham 2 25 58 78 22 185
0036aa PK13/2790/RM GHQ Emersons Green - Linden [Parcel 5] 45 45
0036ab PK13/2741/RM GHQ Emersons Green (PK13/2741/RM) - Barratt [Parcels 6 & 7] 46 62 21 129
0036ad PK13/2646/RM GHQ Emersons Green - Persimmon [Parcel 3] 52 4 56
0036ae PK13/2647/RM GHQ Emersons Green (PK13/2647/RM) - Persimmon [Parcel 8] 61 18 79
0036af PK13/2649/RM GHQ Emersons Green (PK13/2649/RM) - Taylor Wimpey [Parcels 9 & 10] 2 51 82 135
0037 North of Douglas Road, Kingswood 35 96 131
0038 Former Woodstock Special School, Courtney Road 66 66
0040 Cloverdale Drive, Longwell Green 2 2
0041 Land Off Southway Drive, Warmley 13 14 14 41
0046 Mounthill Nursery, Kingswood 8 6 14
0047 Summit Youth Centre, Kingswood 20 51 71
0048 Hanham Road DSO, Kingswood 21 3 24
0054 Church Road, Kingswood 23 23
0060 Carsons Road, Kingswood 4 4
0063 Depot Downend Road, Kingswood 14 14
0064 29-35 High Street, Kingswood 14 14
0065 R/O 1, 3 and 7 Tower Road South, Kingswood 13 13
0066 65 Cadbury Heath Road, Kingswood 1 12 13
Past Completions Years 1 to 5 Years 5 to 10

06/07 07/08 08/09 09/10 10/11 11/12 12/13 13/14 14/15 15/16 16/17 17/18 18/19 19/20 20/21 21/22 22/23 23/24 24/25 25/26 26/27 27/36 Total
RLS Ref.
Planning
Application
Number
Address
Past Completions Years 1 to 5 Years 5 to 10
0067 Jubilee Road, Kingswood -1 24 23
0068 1-3 Colston Street, Soundwell 14 14
0069 21 Portland Street, Soundwell 4 9 13
0070 Crossroads Service Station, Downend 13 13
0071 Downend Lower School, Northview, Downend 9 30 13 52
0073 Kingsway Engineering, Hanham 14 14
0074 Lintham Drive, Kingswood 20 48 68
0075 36 High Street, Staple Hill 13 13
0076 Rear of Cossham Street, Mangotsfield 13 13
0077 Former Courtaulds Factory, Staple Hill 21 24 45
0079 Bath Road, Thornbury 30 15 45
0080 Cambrian Drive/Wellington Road, Yate 60 10 70
0081 Cattle Market, Thornbury 22 22
0082 Siblands, Gillingstool, Thornbury 15 8 23
0084 BFS Diecutting, 27 Hanham Road, Kingswood 14 14
0085 Adj.22 Memorial Road, Hanham 14 14
0086 Queens Road, Cadbury Heath 9 9
0088 Priory Court, Hanham 28 28
0090 Broad Street/Beaufort Road, Staple Hill 14 14
0091 Passage Road, Almondsbury 10 2 12
0092 Adjacent to Southmead Road, Filton 65 65
0093 23 Stanbridge Road, Downend -1 12 11
0094 Factory, Morley Road, Staple Hill 3 29 32
0097 Wall Tyning Nursing Home, Bitton -2 11 9
0099 95 High Street, Kingswood 10 10
0100 148 Hanham Road, Kingswood 14 14
0101 Former Police Station, High Street, Kingswood 14 14
0102 17 and 25a Overnhill Road, Downend -1 -1 38 36
0105 Power Electrics, Morley Road, Staple Hill 14 14
0107 Roseacre, Harry Stoke Road, Stoke Gifford 14 14
0109 PT11/3811/F Rear of 13, 14 and 15 Harry Stoke Road, Stoke Gifford 4 3 6 13
0110 Soundwell Centre, Soundwell 11 11
0111 67-73 Bath Road, Longwell Green -3 29 26
0112 The Rotunda Club, Moravian Road, Kingswood 14 14
0114 894-896 Filton Avenue, Filton -2 10 8
0115 Fiveways, New Cheltenham Road, Kingswood 40 40
0116 Factory Site, Portland Street, Staple Hill 30 30
0117 Sir Bernard Lovell Playing Fields, Oldland Common 13 13
0118 Former School, Beaufort Road, Downend 63 63
0119 Land adjacent Hares Farm, Mapleridge Lane 10 10
0120 Land at Abbots Road, Hanham 14 14
0122 The Meads, Frampton Cotterell 88 73 27 188
0123 Sea Stores, Kennedy Way, Yate 4 111 60 53 228
0124 Land at Parkway North, Stoke Gifford 2 32 34
0129a PK12/1828/F Barnhill Quarry, Chipping Sodbury 60 60
0130 Land at junction of Whittucks Road and Abbots Road, Hanham 15 19 34
0131 Land off Catbrain Hill, Cribbs Causeway 2 42 6 50
0137 PK15/0718/RM Hill View and Hill Top, Woodstock Road, Kingswood -2 14 12
0139 Former Coopers Works, Westerleigh Road, Yate 82 10 92
0140 Rear of 60 Wotton Road, Charfield 6 10 16
0141 Land at Savages Wood Road, Bradley Stoke 74 74
0143 Frome Court, Thornbury 14 14
0144 Land off Broad Lane, Yate 14 14
0146 PK13/2792/RM Blackhorse Day Centre, Mangotsfield 27 4 31
0147 PK14/0120/F Rodford Primary School, Yate (PK14/0120/F) 31 26 57
0149 Prinknash Court, Abbotswood, Yate -4 -4
0150 28-50 Gloucester Road, Patchway -12 -12
0154 Police Station, Thornbury 36 36
0157 Moravian Road, Kingswood 16 16
0159a University of the West of England - Student housing 38 38
0160 PK13/2851/F Former Police Station, Staple Hill 48 48
0161 PK14/4964/F Wapley Court, Yate (PK14/4964/F) 24 24
0162 PT13/3396/F Former Police Station, Filton 3 15 18
0166 PT14/4961/F Alexandra, Midland Way, Thornbury 23 23
0174d Oldlands/Newlands, Coalpit Heath - Merlin schemes (PT14/0943/PND) -10 -10
0174f PT14/1836/F Ware Court, Winterbourne - Merlin scheme (PT14/1836/F) -4 -4
0174g PT14/0344/F Newleaze House, Filton - Merlin scheme (PT14/0344/F) -37 16 -21
0174j Oldlands/Newlands, Coalpit Heath - Merlin schemes (PT14/4451/PND) -8 -8
0174k PT14/1492/F 7 Oldlands Ave. Coalpit Heath - Merlin scheme (PT14/1492/F) 22 22
0174l PT14/1517/F 12 Oldlands Ave. Coalpit Heath - Merlin scheme (PT14/1517/F) -2 17 15
0174q PK15/1640/F Garage site, James Road, Soundwell (PK15/1640/F) 5 5
0177 PT14/3203/F Charlton House, Filton (PT14/3203/F) 22 22
0178 PK14/2628/F 17-19 Edgeware Road, Staple Hill (PK14/2628/F) 10 10
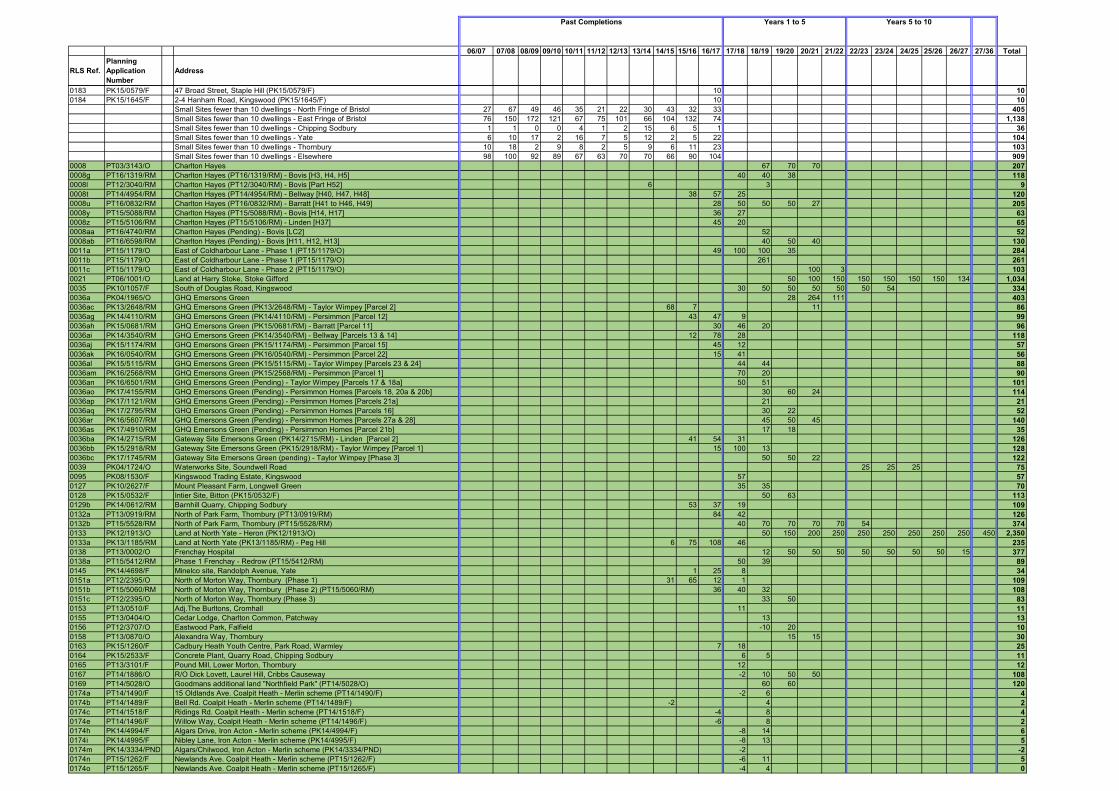
06/07 07/08 08/09 09/10 10/11 11/12 12/13 13/14 14/15 15/16 16/17 17/18 18/19 19/20 20/21 21/22 22/23 23/24 24/25 25/26 26/27 27/36 Total
RLS Ref.
Planning
Application
Number
Address
Past Completions Years 1 to 5 Years 5 to 10
0183 PK15/0579/F 47 Broad Street, Staple Hill (PK15/0579/F) 10 10
0184 PK15/1645/F 2-4 Hanham Road, Kingswood (PK15/1645/F) 10 10
Small Sites fewer than 10 dwellings - North Fringe of Bristol 27 67 49 46 35 21 22 30 43 32 33 405
Small Sites fewer than 10 dwellings - East Fringe of Bristol 76 150 172 121 67 75 101 66 104 132 74 1,138
Small Sites fewer than 10 dwellings - Chipping Sodbury 1 1 0 0 4 1 2 15 6 5 1 36
Small Sites fewer than 10 dwellings - Yate 6 10 17 2 16 7 5 12 2 5 22 104
Small Sites fewer than 10 dwellings - Thornbury 10 18 2 9 8 2 5 9 6 11 23 103
Small Sites fewer than 10 dwellings - Elsewhere 98 100 92 89 67 63 70 70 66 90 104 909
0008 PT03/3143/O Charlton Hayes 67 70 70 207
0008g PT16/1319/RM Charlton Hayes (PT16/1319/RM) - Bovis [H3, H4, H5] 40 40 38 118
0008l PT12/3040/RM Charlton Hayes (PT12/3040/RM) - Bovis [Part H52] 6 3 9
0008t PT14/4954/RM Charlton Hayes (PT14/4954/RM) - Bellway [H40, H47, H48] 38 57 25 120
0008u PT16/0832/RM Charlton Hayes (PT16/0832/RM) - Barratt [H41 to H46, H49] 28 50 50 50 27 205
0008y PT15/5088/RM Charlton Hayes (PT15/5088/RM) - Bovis [H14, H17] 36 27 63
0008z PT15/5106/RM Charlton Hayes (PT15/5106/RM) - Linden [H37] 45 20 65
0008aa PT16/4740/RM Charlton Hayes (Pending) - Bovis [LC2] 52 52
0008ab PT16/6598/RM Charlton Hayes (Pending) - Bovis [H11, H12, H13] 40 50 40 130
0011a PT15/1179/O East of Coldharbour Lane - Phase 1 (PT15/1179/O) 49 100 100 35 284
0011b PT15/1179/O East of Coldharbour Lane - Phase 1 (PT15/1179/O) 261 261
0011c PT15/1179/O East of Coldharbour Lane - Phase 2 (PT15/1179/O) 100 3 103
0021 PT06/1001/O Land at Harry Stoke, Stoke Gifford 50 100 150 150 150 150 150 134 1,034
0035 PK10/1057/F South of Douglas Road, Kingswood 30 50 50 50 50 50 54 334
0036a PK04/1965/O GHQ Emersons Green 28 264 111 403
0036ac PK13/2648/RM GHQ Emersons Green (PK13/2648/RM) - Taylor Wimpey [Parcel 2] 68 7 11 86
0036ag PK14/4110/RM GHQ Emersons Green (PK14/4110/RM) - Persimmon [Parcel 12] 43 47 9 99
0036ah PK15/0681/RM GHQ Emersons Green (PK15/0681/RM) - Barratt [Parcel 11] 30 46 20 96
0036ai PK14/3540/RM GHQ Emersons Green (PK14/3540/RM) - Bellway [Parcels 13 & 14] 12 78 28 118
0036aj PK15/1174/RM GHQ Emersons Green (PK15/1174/RM) - Persimmon [Parcel 15] 45 12 57
0036ak PK16/0540/RM GHQ Emersons Green (PK16/0540/RM) - Persimmon [Parcel 22] 15 41 56
0036al PK15/5115/RM GHQ Emersons Green (PK15/5115/RM) - Taylor Wimpey [Parcels 23 & 24] 44 44 88
0036am PK16/2568/RM GHQ Emersons Green (PK15/2568/RM) - Persimmon [Parcel 1] 70 20 90
0036an PK16/6501/RM GHQ Emersons Green (Pending) - Taylor Wimpey [Parcels 17 & 18a] 50 51 101
0036ao PK17/4155/RM GHQ Emersons Green (Pending) - Persimmon Homes [Parcels 18, 20a & 20b] 30 60 24 114
0036ap PK17/1121/RM GHQ Emersons Green (Pending) - Persimmon Homes [Parcels 21a] 21 21
0036aq PK17/2795/RM GHQ Emersons Green (Pending) - Persimmon Homes [Parcels 16] 30 22 52
0036ar PK16/5607/RM GHQ Emersons Green (Pending) - Persimmon Homes [Parcels 27a & 28] 45 50 45 140
0036as PK17/4910/RM GHQ Emersons Green (Pending) - Persimmon Homes [Parcel 21b] 17 18 35
0036ba PK14/2715/RM Gateway Site Emersons Green (PK14/2715/RM) - Linden [Parcel 2] 41 54 31 126
0036bb PK15/2918/RM Gateway Site Emersons Green (PK15/2918/RM) - Taylor Wimpey [Parcel 1] 15 100 13 128
0036bc PK17/1745/RM Gateway Site Emersons Green (pending) - Taylor Wimpey [Phase 3] 50 50 22 122
0039 PK04/1724/O Waterworks Site, Soundwell Road 25 25 25 75
0095 PK08/1530/F Kingswood Trading Estate, Kingswood 57 57
0127 PK10/2627/F Mount Pleasant Farm, Longwell Green 35 35 70
0128 PK15/0532/F Intier Site, Bitton (PK15/0532/F) 50 63 113
0129b PK14/0612/RM Barnhill Quarry, Chipping Sodbury 53 37 19 109
0132a PT13/0919/RM North of Park Farm, Thornbury (PT13/0919/RM) 84 42 126
0132b PT15/5528/RM North of Park Farm, Thornbury (PT15/5528/RM) 40 70 70 70 70 54 374
0133 PK12/1913/O Land at North Yate - Heron (PK12/1913/O) 50 150 200 250 250 250 250 250 250 450 2,350
0133a PK13/1185/RM Land at North Yate (PK13/1185/RM) - Peg Hill 6 75 108 46 235
0138 PT13/0002/O Frenchay Hospital 12 50 50 50 50 50 50 50 15 377
0138a PT15/5412/RM Phase 1 Frenchay - Redrow (PT15/5412/RM) 50 39 89
0145 PK14/4698/F Minelco site, Randolph Avenue, Yate 1 25 8 34
0151a PT12/2395/O North of Morton Way, Thornbury (Phase 1) 31 65 12 1 109
0151b PT15/5060/RM North of Morton Way, Thornbury (Phase 2) (PT15/5060/RM) 36 40 32 108
0151c PT12/2395/O North of Morton Way, Thornbury (Phase 3) 33 50 83
0153 PT13/0510/F Adj.The Burltons, Cromhall 11 11
0155 PT13/0404/O Cedar Lodge, Charlton Common, Patchway 13 13
0156 PT12/3707/O Eastwood Park, Falfield -10 20 10
0158 PT13/0870/O Alexandra Way, Thornbury 15 15 30
0163 PK15/1260/F Cadbury Heath Youth Centre, Park Road, Warmley 7 18 25
0164 PK15/2533/F Concrete Plant, Quarry Road, Chipping Sodbury 6 5 11
0165 PT13/3101/F Pound Mill, Lower Morton, Thornbury 12 12
0167 PT14/1886/O R/O Dick Lovett, Laurel Hill, Cribbs Causeway -2 10 50 50 108
0169 PT14/5028/O Goodmans additional land "Northfield Park" (PT14/5028/O) 60 60 120
0174a PT14/1490/F 15 Oldlands Ave. Coalpit Heath - Merlin scheme (PT14/1490/F) -2 6 4
0174b PT14/1489/F Bell Rd. Coalpit Heath - Merlin scheme (PT14/1489/F) -2 4 2
0174c PT14/1518/F Ridings Rd. Coalpit Heath - Merlin scheme (PT14/1518/F) -4 8 4
0174e PT14/1496/F Willow Way, Coalpit Heath - Merlin scheme (PT14/1496/F) -6 8 2
0174h PK14/4994/F Algars Drive, Iron Acton - Merlin scheme (PK14/4994/F) -8 14 6
0174i PK14/4995/F Nibley Lane, Iron Acton - Merlin scheme (PK14/4995/F) -8 13 5
0174m PK14/3334/PND Algars/Chilwood, Iron Acton - Merlin scheme (PK14/3334/PND) -2 -2
0174n PT15/1262/F Newlands Ave. Coalpit Heath - Merlin scheme (PT15/1262/F) -6 11 5
0174o PT15/1265/F Newlands Ave. Coalpit Heath - Merlin scheme (PT15/1265/F) -4 4 0

06/07 07/08 08/09 09/10 10/11 11/12 12/13 13/14 14/15 15/16 16/17 17/18 18/19 19/20 20/21 21/22 22/23 23/24 24/25 25/26 26/27 27/36 Total
RLS Ref.
Planning
Application
Number
Address
Past Completions Years 1 to 5 Years 5 to 10
0174p PT15/2099/F Coalville Rd. Coalpit Heath - Merlin scheme (PT15/2099/F) 4 4
0174t PT15/5447/PND Collins Avenue, Little Stoke (Merlin Phase 2) -10 -10
0174t PT17/4327/F Collins Avenue, Little Stoke (Merlin Phase 2) 15 15
0174u PT15/5376/PND Rossall Avenue, Little Stoke (Merlin Phase 2) -2 -2
0174w PK15/1651/F Irving Close, Staple Hill (PK15/1651/F) -20 25 5
0174x PK16/4486/F 28 Blackhorse Lane, Downend -1 5 4
0174y PK16/4492/F Land off Beaufort Road, Downend 16 16
0175 PT14/0760/F Extra Care scheme Charlton Hayes (PT14/0760/F) [H24, LC3] 24 29 53
0182 PT14/4404/F 98 Gloucester Road, Filton (PT14/4404/F) -1 10 9
0185 PT16/0462/O Land at Day House Leaze, Wotton Road, Charfield 20 24 20 64
0186 PT14/2849/F Bonnington Walk, Stoke Gifford (PT14/2849/F) 1 64 30 95
0187 PT16/1503/RM South of Wotton Road, Charfield (PT16/1503/RM) 6 50 50 106
0188 PT15/3219/F 29 Cabot Court, Filton 11 11
0189 PK15/3950/F Land off High Street, Hanham 54 54
0190 PT16/4055/RM Land at Post Farm, Thornbury (PT16/4055/RM) 15 55 55 125
0191 PT15/0510/F Lockleaze Recreation Ground, Stoke Gifford (PT15/0510/F) 26 50 50 26 152
0192 PK15/4995/F Wesleyan Chapel, Blackhorse Road, Kingswood (PK15/4995/F) 15 15
0193 PT15/5521/F The Gables, Costers Close, Alveston (PT15/5521/F) 9 9
0036c Safeguarded land, Emersons Green 50 75 100 75 50 350
0036d Residual allocated land, Emersons Green 50 100 50 200
0133 Land at North Yate - Taylor Wimpey 30 150 120 300
0134a PT14/0565/O Cribbs/Patchway NN - West of A4018 (PT14/0565/O) 100 100 100 100 100 100 100 100 200 1,000
0134ba PT12/1930/O Cribbs/Patchway NN - Wyke Beck Rd/Fishpool Hill (PT12/1930/O) 100 150 150 150 150 150 150 100 1,100
0134bb PT15/4165/F Cribbs/Patchway NN - Charlton Common (PT15/4165/F) 80 80
0134c PT14/3867/O Cribbs/Patchway - Former Filton Airfield (PT14/3867/O) 100 250 250 250 250 250 250 250 825 2,675
0135a PT16/4782/O New Neighbourhood - East of Harry Stoke - Crest [South of railway] 50 100 100 100 150 150 150 490 1,290
0135b PT16/4928/O New Neighbourhood - East of Harry Stoke - Crest [North of railway] 25 50 75 75 50 52 327
0135c PT16/6182/F New Neighbourhood - East of Harry Stoke - Keepmoat etal [Hambrook Ln/Curtis Ln] 25 48 73
0135d New Neighbourhood - East of Harry Stoke [Residual land] 50 75 90 50 45 310
0194 PK16/4006/O South of Poplar Lane, Wickwar (PK16/4006/O) 40 40 80
0195 PK16/2577/O Rear of 61-67 Cleeve Hill, Downend (PK16/2577/O) 12 12
0174s Rodney Crescent, Filton (Merlin Phase 2) -8 15 7
0174? Downend (Merlin Phase 3) 10 10
0174z PT17/2270/F Langdale Court, Consiton Road, Patchway -17 12 -5
0197 PK16/5889/F Kerr House, Morley Road, Staple Hill 21 21
0198 PT16/4976/F Junction Hayes Way / Charlton Boulevard, Patchway Site 1 42 42
0199 PT16/4975F Junction Hayes Way / Charlton Boulevard, Patchway Site 2 60 60
0200 PT17/0217/O Filton Road, Winterbourne 20 20
0201 PK17/0807/F Oaktree Avenue, Puckelchurch Site A 38 38
0202 PK16/2566/F Cecil Road, Kingswood 29 29
0203 PK17/0808/F Oaktree Avenue, Puckelchurch Site B 20 20
0204 PT16/4774/O West of Gloucester Road, Thornbury 30 50 50 130
0205 Staple Hill Primary School, Staple Hill 32 32
0206 PT16/0982/F Former Council Offices, Castle Street, Thornbury -1 62 61
Small Sites * 210 210 210 210 210 210 210 210 210 210 2,100
Small Sites * 1,890 1,890
689 1,003 916 742 714 923 823 1,095 1,224 1,107 1,630 1,441 2,163 2,160 2,296 1,709 1,589 1,611 1,515 1,535 1,379 3,855 32,119
Key
Sites fully complete. This category comprises Large sites of 10 homes or more which are listed individually
and Small sites of fewer than 10 homes which are aggregated by area.
Sites with planning permission. This category comprises Large sites of 10 homes or more with outline,
detailed, and/or reserved matters permission which are listed individually.
Sites awaiting the completion of a S106 agreement, allocated in the South Gloucestershire Local Plan,
identified in the Core Strategy, or allocated in the Policies Sites and Places Plan.
Sites currently progressing through the development management process.
Note
Small
Sites *
Small sites are sites fewer than 10 homes and total 816 with planning permission (outline, detailed, and/or
reserved matters) of which 317 are under construction (April 2017). Monitoring of past completions of small
sites reveals an annual average of 245 units since the start of the SGC Core Strategy period. To reflect these
figures a conservative allowance of 210 dwellings per annum, has been assumed.
10,866 9,769 7,629
28,264
Total 2006 to 2017 Total 2017 to 2022 Total 2022 to 2027

Appendix B: Commentary on Expected House Completions - 2017
RLS Ref Location Commentary on DeliverabilityAssessment
0008 Northfield
Filton Aerodrome
Patchway
April 2017 Outline planning permission granted (2008), with a Deed of Variation approved in Dec 2010 to address viability concerns regarding the site and ensuring the scheme is NPPF compliant. Succession of reserved matters applications submitted to date, all determined by SGC in a timely manner and thereafter implemented. Masterplans for phases 2 and 3 approved and design codes submitted under conditions attached to the outline, thereafter reserved matters applications for those phases can be submitted. Overall completions expected to be in the region of 250 dwellings per annum over the whole site with site fully complete within the "Five Year" period. Further Reserved Matters application awaiting decision for 52 apartments leaving an overall balance of 281 homes covered by Outline. October Update - Further Reserved Matters application awaiting decision for 182 homes leaving an overall balance of 207 homes covered by Outline.
Suitable
Available
Achievable
"Charlton Hayes"
0008aa North Field
Filton Aerodrome
Patchway
April 2017 Pending decision on RM application PT16/4740/RM. October Update - Planning permission granted May 2017. Construction not commenced.
Suitable
Available
Achievable
0008ab North Field
Filton Aerodrome
Patchway
April 2017 Pending decision on RM planning application PT16/6598/RM. October Update - Planning permission granted July 2017. Construction not commenced.
Suitable
Available
Achievable
0008g Northfield
Filton Aerodrome
Patchway
April 2017 Site part of original Outline planning permission. Construction under way. October Update - No change.
Suitable
Available
Achievable
"Charlton Hayes"
1

RLS Ref Location Commentary on DeliverabilityAssessment
0008l Northfield
Filton Aerodrome
Patchway
April 2017 Three homes remain to be completed on site of sales centre. October Update - No change.
Suitable
Available
Achievable
"Charlton Hayes"
0008t Northfield
Filton Airfield
Patchway
April 2017 Construction well advanced. October Update - Almost 80% of site complete and remainder of site under construction.
Suitable
Available
Achievable
"Charlton Hayes"
0008u Northfield
Filton Airfield
Patchway
April 2017 Construction commenced. October Update - First homes complete.
Suitable
Available
Achievable
"Charlton Hayes"
0008y Northfield
Filton Airfield
Patchway
April 2017 Site well advanced. October Update - Site complete.
Suitable
Available
Achievable
"Charlton Hayes"
0008z Northfield
Filton Airfield
Patchway
April 2017 Construction well advanced. October Update - Site complete.
Suitable
Available
Achievable
"Charlton Hayes"
2

RLS Ref Location Commentary on DeliverabilityAssessment
0011a Land east of
Coldharbour Lane
Stoke Gifford
April 2017 First homes complete. See also sites 0011b and 0011c. October Update - Construction well advanced with over 40% of homes complete.
Independent assessment by BNP Paribas confirms unit numbers are robust for Phase 1 and developer positive
Suitable
Available
Achievable
0011b Land east of
Coldharbour Lane
Stoke Gifford
April 2017 Site has planning permission. Extra Care housing element of phase 1 of a hybrid application (See also site 0011a and 0011c ). Whole site under construction. October Update - Site well advanced.
Independent assessment by BNP Paribas states site sold to Extra Care Charitable Trust and confirms unit numbers are robust.
Suitable
Available
Achievable
0011c Land east of
Coldharbour Lane
Stoke Gifford
April 2017 Site has planning permission. Phase 2 of a hybrid application (See also site 0011a and 0011b). October Update - See below.
Independent assessment by BNP Paribas advise that site cannot accommodate originally suggested numbers and suggest capacity reduced by 40 units to 103 units. Numbers therefore amended.
Suitable
Available
Achievable
3

RLS Ref Location Commentary on DeliverabilityAssessment
0021 Land at
Harry Stoke
Stoke Gifford
April 2017 Outline planning permission granted (2007) initial phase "Highbrook Park" (see site 0021a) complete. To reflect delay due to developer led delays only 300 new homes expected within the 5 Year period. October Update - Next Reserved Matters applications expected December 2017.
Independent assessment by BNP Paribas advises Reserved Matters submitted. Delivery start 2019/2020 reasonably expected. Recommencement of construction and forecast robust.
Suitable
Available
Achievable
0035 South of
Douglas Road
Kingswood
April 2017 Full planning permission granted. Viability was addressed at planning stage and so available, but only likely to proceed as a small single block conversion in the Five Year period. October Update - First homes complete and a small number under construction.
Independent assessment by BNP Paribas confrims construction has started and approximately 30 completions are expected for year 2017/2018. Forecast updated accordingly.
Suitable
Available
Achievable
4

RLS Ref Location Commentary on DeliverabilityAssessment
0036a, 0036ao,0036aq,0036ar,0036as
Emersons Green April 2017 Outline planning permission approved. A number of Reserved Matters applications approved and construction well advanced. Reserved Matters application PK16/6501/RM pending decision on site for 101 homes leaving a balance of 765 homes covered by the Outline planning permission. October Update - Further RM applications for 341 homes (0036ao 114 units, 0036aq 52 units, 0036ar 140 units, 0036as 35 units) leaving a balance of 403 homes (0036a) covered by the Outline planning permission.
Independent assessment by BNP Paribas confirms balance of Outline as 403 units. All outlets selling well and forecast robust.
Independent assessment by BNP Paribas confirms RMs 0036ao application rec'd 25/09/2017 and forecast robust. 0036aq RM application under original Emersons Green Outline. 0036ar application rec'd but refused on design code matters. Case officer is positive about this being resolved and forecast delivery is robust. 0036as application not yet determined. Delivery start 18/19 reasonable given feedback from case officers.
Suitable
Available
Achievable
0036ac Parcel 2
Emersons Green East
April 2017 90 percent of homes complete. October Update - No change.
Independent assessment by PNB Paribas advise figures are robust given discussion with housebuilder. Small proportion of units fall within 5 year period.
Suitable
Available
Achievable
0036ag Parcel 12
Emersons Green
April 2017 Construction well advanced and almost all the homes complete. October update - Site complete.
Independent assessment by BNP Paribas advises forecast robust.Suitable
Available
Achievable
5
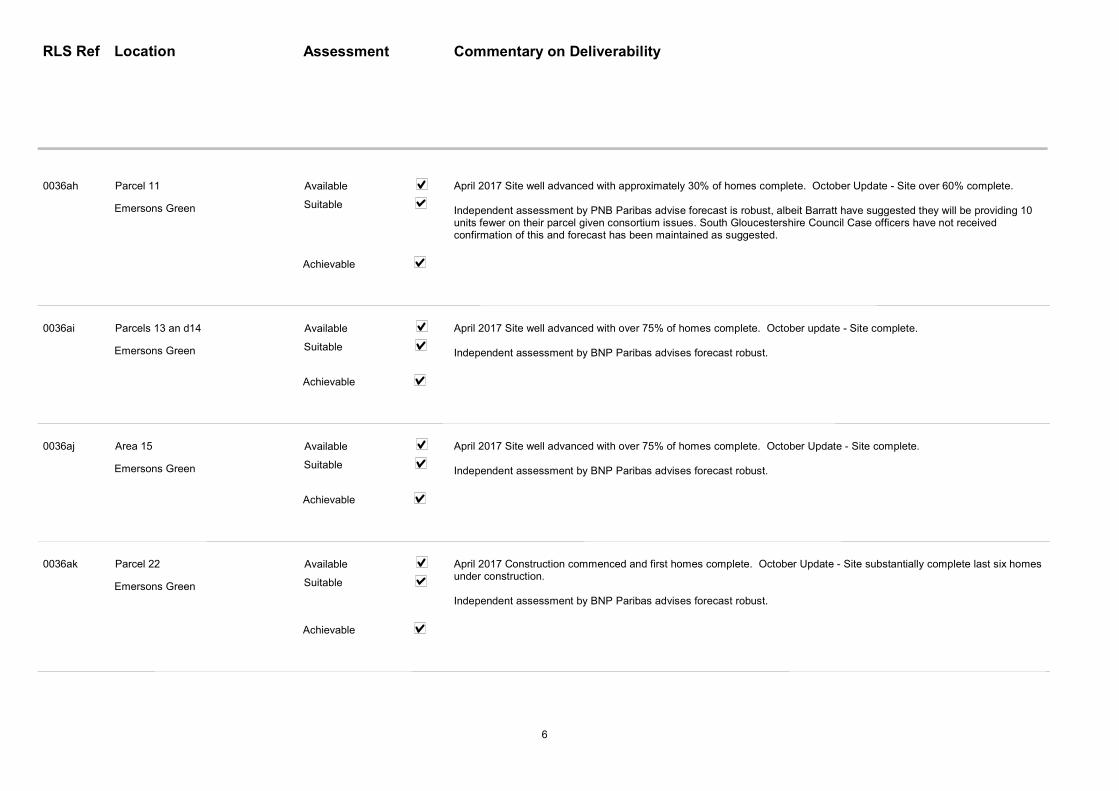
RLS Ref Location Commentary on DeliverabilityAssessment
0036ah Parcel 11
Emersons Green
April 2017 Site well advanced with approximately 30% of homes complete. October Update - Site over 60% complete.
Independent assessment by PNB Paribas advise forecast is robust, albeit Barratt have suggested they will be providing 10 units fewer on their parcel given consortium issues. South Gloucestershire Council Case officers have not received confirmation of this and forecast has been maintained as suggested.
Suitable
Available
Achievable
0036ai Parcels 13 an d14
Emersons Green
April 2017 Site well advanced with over 75% of homes complete. October update - Site complete.
Independent assessment by BNP Paribas advises forecast robust.Suitable
Available
Achievable
0036aj Area 15
Emersons Green
April 2017 Site well advanced with over 75% of homes complete. October Update - Site complete.
Independent assessment by BNP Paribas advises forecast robust.Suitable
Available
Achievable
0036ak Parcel 22
Emersons Green
April 2017 Construction commenced and first homes complete. October Update - Site substantially complete last six homes under construction.
Independent assessment by BNP Paribas advises forecast robust.
Suitable
Available
Achievable
6

RLS Ref Location Commentary on DeliverabilityAssessment
0036al Parcels 23 & 24
Emersons Green
April 2017 Construction commenced. October Update - Over 60% of site either complete or under construction.
Independent assessment by BNP Paribas advise robust given feedback from housebuilder. Taylor Wimpey positive about projected unit numbers.
Suitable
Available
Achievable
0036am Area 1
Emersons Green
April 2017 Construction commenced. October Update - Over 30% of homes complete and the majority of the remaining homes under construction.
Independent assessment by BNP Paribas advises new application PK17/1374/RM amends and revises capacity from 90 to 95. Capacity however not amended as application refused.
Suitable
Available
Achievable
0036an Parcels 17 and 18a
Emersons Green
April 2017 - Pending decision on RM application PK16/6501/RM. October Update - Planning permission granted May 2017. Construction not commenced.
Independent assessment by BNP Paribas advises application approved 11/05/2017 - forecast robust given feedback from Taylor Wimpey.
Suitable
Available
Achievable
0036ap Parcel 21a
Emersons Green
April 2017 Pending decision on RM application PK17/1121/RM. October Update - Planning permission granted September 2017. Construction not commenced.
Independent assessment by BNP Paribas advises RM application under original Emersons Green Outline.
Suitable
Available
Achievable
7

RLS Ref Location Commentary on DeliverabilityAssessment
0036ba Gateway Site
Emersons Green East
April 2017 Site well advanced and approximately 75% of homes complete. October Update - Site nearing completion.
Independent assessment by BNP Paribas advise consortium positive and unit numbers forecast are robustSuitable
Available
Achievable
0036bb Gateway Site
Emersons Green East
April 2017 Construction commenced and first homes complete. October Update - Site 70% complete.
Independent assessment by BNP Paribas advise consortium positive and unit numbers and delivery rate are robust.Suitable
Available
Achievable
0036bc Emersons Green April 2017 Outline planning permission approved and S106 Agreement signed. First two Reserved Matters applications approved and construction well advanced. Application PK17/1745/RM for 122 dwellings pending decision. October Update - Application PK17/1745/RM pending decision, subsequently approved 03/11/2017.
Independent assessment by BNP Paribas advise application received April for 122 dwellings and approved in November. Unit numbers robust
Suitable
Available
Achievable
0036c Emersons Green April 2017 Site expected to follow completion of other Emersons Green sites. October Update - Overall capacity reduced to take account of site constraints. Site remains outside Five Year period.
Suitable
Available
Achievable
8

RLS Ref Location Commentary on DeliverabilityAssessment
0036d Residual Land
Emersons Green East
Emersons Green
April 2017 Site expected to be delivered alongside completion of other Emersons Green sites. October Update - Pending decision on planning application PK17/1112/F 120 dwellings on part of site. Overall capacity for the whole site expected to be in the region of 200 homes.
Suitable
Available
Achievable
0039 Waterworks Site
Soundwell Road
Kingswood
April 2017 Site remains occupied by Bristol Water. Outline planning approval gained in December 2008. The illustrative layout shows how the site could accommodate 75 units. Consent for extension of time K11/3750/EXT 31/07/2015. Whilst there is no evidence to suggest the site will not come forward within the "Five year" period, it is considered prudent to discount the site's contribution to housing supply within the "Five year" period. October Update - No change.
Suitable
Available
Achievable
0095 Kingswood Trading Estate
Elmtree Way
Kingswood
April 2017 Site nearing completion. October Update - Site complete.
Independent assessment by BNP Paribas advises forecast robust and developer completed site.Suitable
Available
Achievable
0127 Mount Pleasant Farm
Longwell Green
April 2017 Construction well advanced and first homes nearing completion. October Update - 2 homes complete and remainder under construction most well advanced.
Suitable
Available
Achievable
9

RLS Ref Location Commentary on DeliverabilityAssessment
0128 Former Intier Site
Bath Road
Bitton
April 2017 Site clearance and decontamination works underway. October Update - 24 homes under construction.
Independent assessment by BNP Paribas indicates that Linden are positive and unit numbers are robust.Suitable
Available
Achievable
0129b Land at
Barnhill Quarry
Chipping Sodbury
April 2017 Site well advanced and over 80% of homes complete. October Update - Site complete.
Suitable
Available
Achievable
"Barnhill Gate"
0132a Park Farm
Butt Lane
Thornbury
April 2017 Site well advanced over 65% of homes complete. October Update - All site except 1 home (site of show house car park) complete.
Suitable
Available
Achievable
"Phase 1"
0132b Land north of
Park Farm
Butt Lane
April 2017 first homes under construction. October Update - Approximately 25% of site under construction.
Suitable
Available
Achievable
Thornbury
10

RLS Ref Location Commentary on DeliverabilityAssessment
0133 New Neighbourhood
Yate
April 2017 Submission of infrastructure Reserved Matters expected and first housebuilder Reserved Matters expected by Autumn 2017 with first occupations in 2018. Taylor Wimpey part of site (300 homes) expected to come forward as the back end of the main site is opened up. October Update - Barratt / David Wilson now control whole site and have commenced advertising site.
Independent assessment by BNP Paribas advises that start on site will be summer 2018 and overall capacity should be reduced given the detailed layout. Capacity reduced by 100 units and build rates amended as advised. Barratt have purchased site and expect delivery through a number of outlets. Progress made through RM application for infrastructure.
Suitable
Available
Achievable
0133a Land north of
Peg Hill
Yate
April 2017 Construction well advanced with approximately 80% of site complete. October Update - Site almost complete final 3 homes under construction.
Independent assessment by BNP Paribas advise completion of site, and unit numbers robust .
Suitable
Available
Achievable
11

RLS Ref Location Commentary on DeliverabilityAssessment
0134a, 0134ba, 0134bb, 0134c
New Neighbourhood
Cribbs/Patchway
Site comprises four main parcels: 0134a, 0134ba, 0134bb and 0134c
Site 0134a. April 2017 Developer has land acquisition and planning challenges which are causing delays. Outline planning applicatiion PT14/0565/O for 1,000 homes currently being considered. October Update - No Change. Independent assessment by BNP Paribas advises SGC and developers seeking to agree Framework Agreement. Forecast robust.
Site 0134ba. April 2017 Application PT12/1930/O for 1,100 homes. Start on site delayed due to land owner delays. Developer progressing their acquisition process, first infrastructure completion expected. October Update - No change.
Independent assessment by BNP Paribas advises forecast robust given feedback from housebuilder.
Site 0134bb. April 2017 Full application PT15/4165/O requires developer at Fishpool Hill to complete first phase infrastructure before delivery of this site. October Update - No Change. Independent assessment by BNP Paribas advises Redrow site at rear of main Persimmon allocation as follow on phase - full application received subject to S106. All parties working to resolve remaining issues.
Site 0134c. April 2017 Planning permisssion approved subject S106 for 2,675 homes. October Update - No Change. Independent assessment by BNP Paribas advises Outline for 2,675 reduced from 2,750. YTL expect delivery in 2019/2020 and forecast robust.
Suitable
Available
Achievable
0135a ,0135b, 0135c , 0135d
New Neighbourhood
East of Harry Stoke
April 2017 Land owners SGC/Crest/Private - Master planning Stage pre-application but constrained due to landowner delays. Two applications PT16/4928/O (327 units) and PT16/4782/O (1,290 units) received. October update - Site subdivided into four areas all but the residual area site 0135d (approximately 310 dwellings) is subject of current applications.
Independent assessment by BNP Paribas advise: Site 135a Outline application submitted. Expect determination in spring/early summer 2018. Unit numbers robust; Site 135b Hybrid application submitted. Expect determination spring/early summer 2018. Unit numbers are robust; Site 135c Developer positive and delivery brought forward to 18/19 and 19/20. Supported by feedback from case officer; Site 135d Residual of Outline - numbers robust.
Suitable
Available
Achievable
12

RLS Ref Location Commentary on DeliverabilityAssessment
0138 Frenchay Hospital
Park Road
Frenchay
April 2017 Outline consent granted for the redevelopment of the hospital site for a mix of residential and community uses. Hospital closed May 2014. Development likely to take place in a number of different phases. Reserved Matters application PT15/5412/RM for 88 dwellings site 0138a under construction. October Update - See below.
Independent assessment by BNP Paribas advises total unit number (over 4 phases) is 466 total balance of outline therefore 377 (given projections for Phase 1 of 89). Consent now granted for Phase 2 which will be starting Q4 2017. Unit completions likely Q1-Q2 2018. Unit numbers robust given feedback from Redrow.
Suitable
Available
Achievable
0138a Phase 1
Frenchay Hopsital
Park Road
April 2017 Construction commenced. October Update - 11 homes and approximately 70% of remaining site under construction.
Independent assessment by BNP Paribas confirms 89 units phase 1. Redrow on site and delivery underway. Forecast robust given feedback from Redrow.
Suitable
Available
Achievable
Frenchay
0145 Land off
Randolph Avenue
Yate
April 2017 Site well advanced and nearing completion. October Update - Site complete.
Suitable
Available
Achievable
0151a Land at
Morton Way North
Thornbury
April 2017 Site nearing completion. All homes except 1 plot (site of show home car park) complete. October Update - No change.
Suitable
Available
Achievable
13
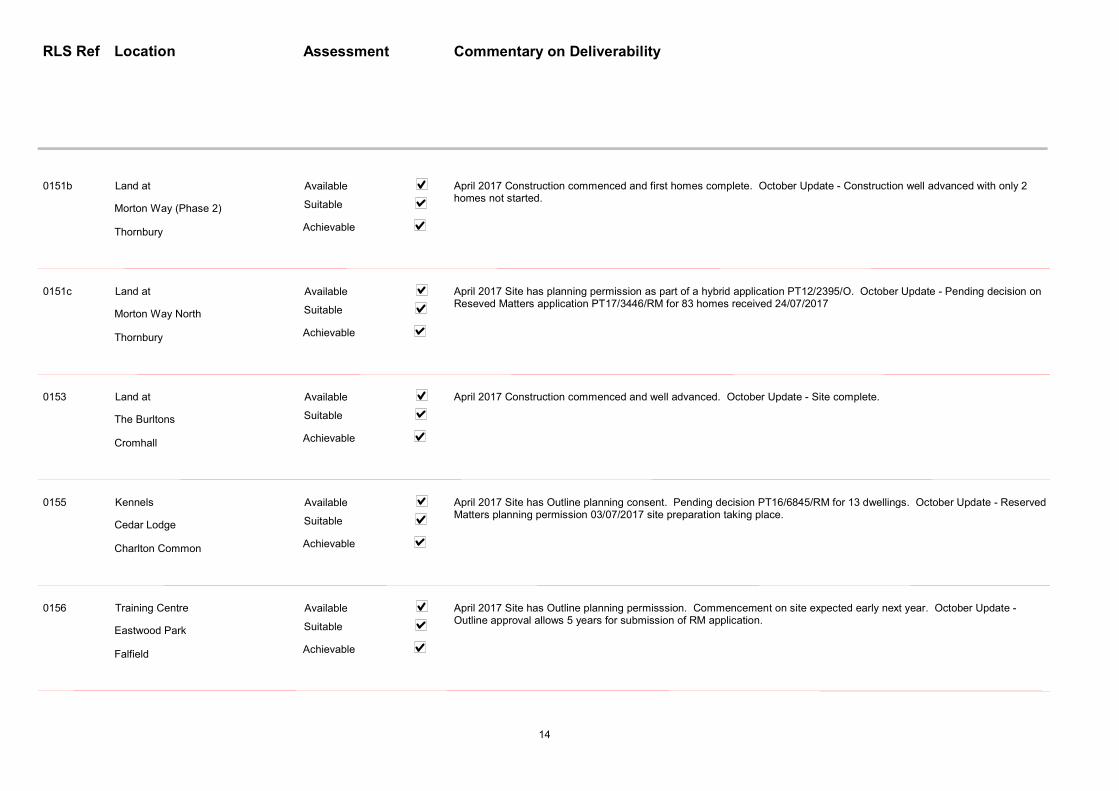
RLS Ref Location Commentary on DeliverabilityAssessment
0151b Land at
Morton Way (Phase 2)
Thornbury
April 2017 Construction commenced and first homes complete. October Update - Construction well advanced with only 2 homes not started.
Suitable
Available
Achievable
0151c Land at
Morton Way North
Thornbury
April 2017 Site has planning permission as part of a hybrid application PT12/2395/O. October Update - Pending decision on Reseved Matters application PT17/3446/RM for 83 homes received 24/07/2017
Suitable
Available
Achievable
0153 Land at
The Burltons
Cromhall
April 2017 Construction commenced and well advanced. October Update - Site complete.
Suitable
Available
Achievable
0155 Kennels
Cedar Lodge
Charlton Common
April 2017 Site has Outline planning consent. Pending decision PT16/6845/RM for 13 dwellings. October Update - Reserved Matters planning permission 03/07/2017 site preparation taking place.
Suitable
Available
Achievable
0156 Training Centre
Eastwood Park
Falfield
April 2017 Site has Outline planning permisssion. Commencement on site expected early next year. October Update - Outline approval allows 5 years for submission of RM application.
Suitable
Available
Achievable
14

RLS Ref Location Commentary on DeliverabilityAssessment
0158 Care Home
Alexandra Way
Thornbury
April 2017 Site has Outline planning permission. Expected to be implemented upon disposal of the elderly persons home by the Council. Site requires demolition following closure of home. October Update - No change, however site adjacent and linked to adjacent Park Farm development from which a link to Alexandra Way is to built secured through "Grampian" condition.
Suitable
Available
Achievable
BS35 1LA
0163 Cadbury Heath
Youth Centre
Park Road
April 2017 Site under construction and first homes complete. October Update - Site complete.
Suitable
Available
Achievable
Warmley
0164 Concrete Plant
Quarry Road
Chipping Sodbury
April 2017 Site preparations underway. October Update - Site preparations well advanced.
Suitable
Available
Achievable
0165 Land west of
Pound Mill Centre
Lower Morton
April 2017 site under construction. October Update - No change.
Suitable
Available
Achievable
Thornbury
15

RLS Ref Location Commentary on DeliverabilityAssessment
0167 Rear of
Dick Lovett
Cribbs Causeway
April 2017 Site has outline planning approval. October Update - RM expected.
Suitable
Available
Achievable
0169 Northfield Park
Charlton Hayes
Filton
April 2017 Site has outline planning permission. October Update - Reserved Matters application expected October 2017.
Suitable
Available
Achievable
0174 Merlin redevelopment schemes April 2017 Merlin Housing association is currently engaged in a private rented re-development project which runs from summer 2014 until 2022, which will see an investment of £100m within South Gloucestershire. The scheme will operate in phases focusing upon geographic areas of the district. A number of planning applications have already been approved (see site details below) showing positive progress with the Merlin re-development project. The additional homes on sites at Downend and Filton are expected to be completed in the Five Year period as per Merlin's programme. October Update - No change.
Suitable
Available
Achievable
0174a 15
Oldlands Avenue
Coalpit Heath
April 2017 site has planning permission. Completion expected within the Five year period as per Merlin's programme. October Update - Existing houses demolished and new homes under construction.
Suitable
Available
Achievable
16

RLS Ref Location Commentary on DeliverabilityAssessment
0174b 33
Bell Road
Coalpit Heath
April 2017 site under construction. October Update - Site under construction.
Suitable
Available
Achievable
0174c 37
Ridings Road
Coalpit Heath
April 2017 site under construction. October update - Site under construction.
Suitable
Available
Achievable
0174e 11
Willow Way
Coalpit Heath
April 2017 site under construction. October update - Site under construction.
Suitable
Available
Achievable
0174h 10
Algars Drive
Iron Acton
April 2017 site has planning permission. Completion expected within the Five year period as per Merlin's programme. October update - Existing houses demolished and site under construction.
Suitable
Available
Achievable
0174i 38
Nibley Lane
Iron Acton
April 2017 site has planning permission. Completion expected within the Five year period as per Merlin's programme. October update - Existing houses demolished and site under construction.
Suitable
Available
Achievable
BS37 9UP
17
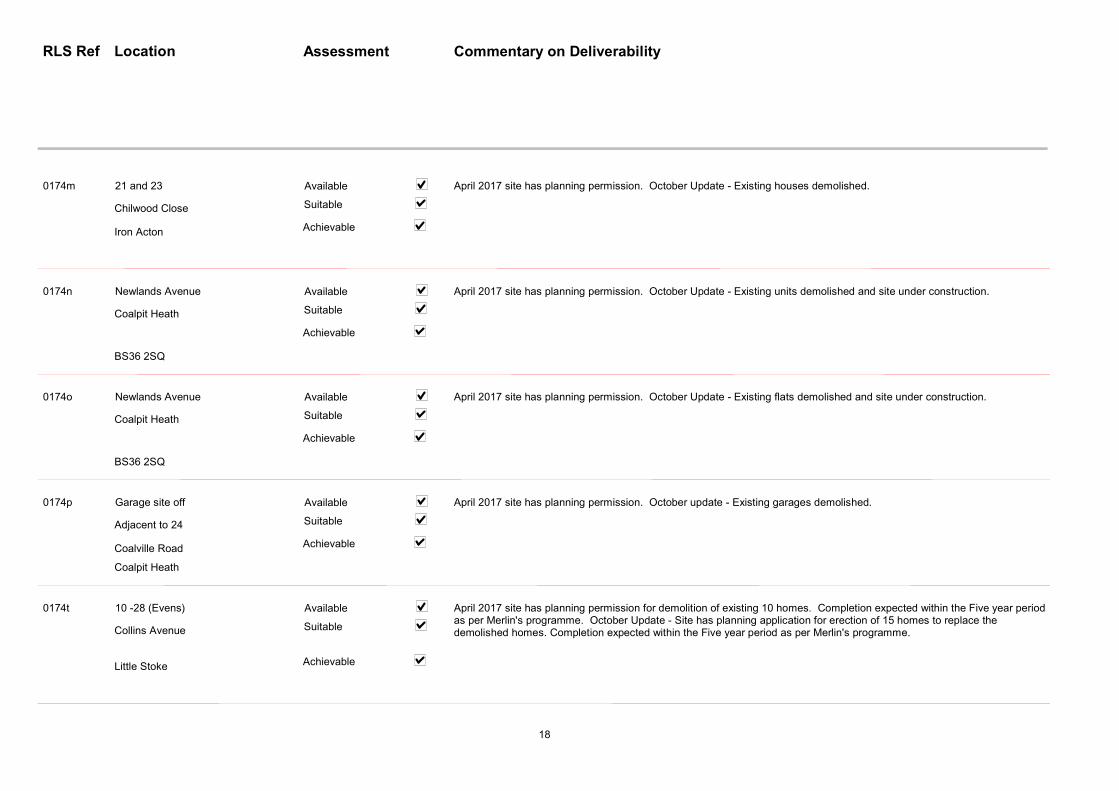
RLS Ref Location Commentary on DeliverabilityAssessment
0174m 21 and 23
Chilwood Close
Iron Acton
April 2017 site has planning permission. October Update - Existing houses demolished.
Suitable
Available
Achievable
0174n Newlands Avenue
Coalpit Heath
April 2017 site has planning permission. October Update - Existing units demolished and site under construction.
Suitable
Available
Achievable
BS36 2SQ
0174o Newlands Avenue
Coalpit Heath
April 2017 site has planning permission. October Update - Existing flats demolished and site under construction.
Suitable
Available
Achievable
BS36 2SQ
0174p Garage site off
Adjacent to 24
Coalville Road
April 2017 site has planning permission. October update - Existing garages demolished.
Suitable
Available
Achievable
Coalpit Heath
0174t 10 -28 (Evens)
Collins Avenue
Little Stoke
April 2017 site has planning permission for demolition of existing 10 homes. Completion expected within the Five year period as per Merlin's programme. October Update - Site has planning application for erection of 15 homes to replace the demolished homes. Completion expected within the Five year period as per Merlin's programme.
Suitable
Available
Achievable
18
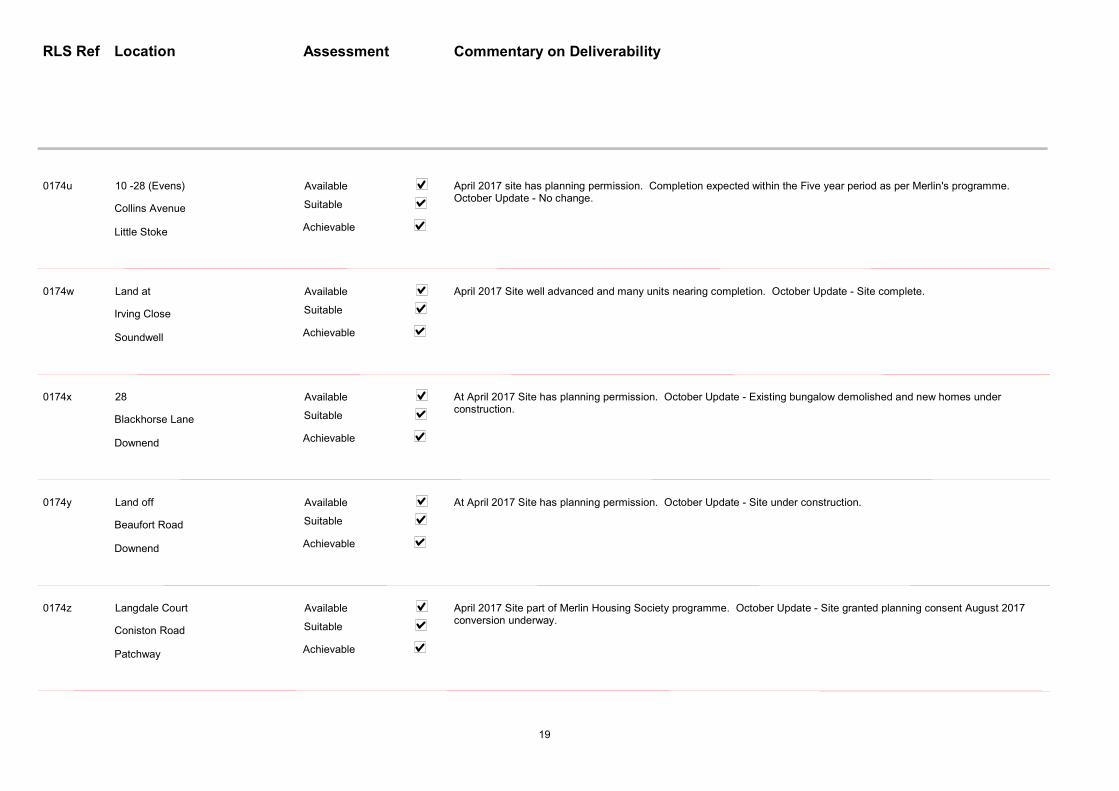
RLS Ref Location Commentary on DeliverabilityAssessment
0174u 10 -28 (Evens)
Collins Avenue
Little Stoke
April 2017 site has planning permission. Completion expected within the Five year period as per Merlin's programme. October Update - No change.
Suitable
Available
Achievable
0174w Land at
Irving Close
Soundwell
April 2017 Site well advanced and many units nearing completion. October Update - Site complete.
Suitable
Available
Achievable
0174x 28
Blackhorse Lane
Downend
At April 2017 Site has planning permission. October Update - Existing bungalow demolished and new homes under construction.
Suitable
Available
Achievable
0174y Land off
Beaufort Road
Downend
At April 2017 Site has planning permission. October Update - Site under construction.
Suitable
Available
Achievable
0174z Langdale Court
Coniston Road
Patchway
April 2017 Site part of Merlin Housing Society programme. October Update - Site granted planning consent August 2017 conversion underway.
Suitable
Available
Achievable
19

RLS Ref Location Commentary on DeliverabilityAssessment
0175 Extra Care Scheme
Charlton Hayes
H24 and LC3
At April 2017 site 24 flats complete. October Update - No change.
Suitable
Available
Achievable
Patchway
0182 98
Gloucester Road
Filton
April 2017 Site nearing completion. October update - Site complete.
Suitable
Available
Achievable
BS34 7PF
0185 Day House Leaze
Wotton Road
Charfield
April 2017 Site has Outline planning permission and pending decision on Reserved Matters application PT16/6580/RM. October Update - Reserved Matters permission 16/06/2017. First homes under construction.
Suitable
Available
Achievable
0186 Playing Fields
Bonnington Walk
Stoke Gifford
April 2017 Site well advanced almost 70% of homes complete. October Update - Site complete.
Suitable
Available
Achievable
BS7 9YU
0187 Land at
Wotton Road
Charfield
April 2017 Construction on site commenced and first homes complete. October Update - Over 50% of site either under construction or complete.
Suitable
Available
Achievable
20

RLS Ref Location Commentary on DeliverabilityAssessment
0188 29
Cabot Court
Filton
April 2017 Site has planning permission. October Update - Alternative proposals PT17/0685/F approved 08/05/2017 for 9 units, but no construction taken place.
Suitable
Available
Achievable
0189 Land at
High Street
Hanham
April 2017 Site preparation works underway. October Update - No change.
Suitable
Available
Achievable
0190 Land at
Post Farm
Thornbury
April 2017 Site has planning permission. October Update - First homes under construction.
Suitable
Available
Achievable
0191 Lockleaze Recreation Ground
Stoke Gifford
April 2017 Construction on site commenced. October Update - First homes complete.
Suitable
Available
Achievable
0192 Wesleyan Chapel
Blackhorse Road
Kingswood
April 2017 Site has planning permission. October Update - Site under construction.
Suitable
Available
Achievable
21

RLS Ref Location Commentary on DeliverabilityAssessment
0193 The Gables
Costers Close
Aleveston
April 2017 Site has planning permission. October Update - No change.
Suitable
Available
Achievable
0194 Land south of
Poplar Lane
Wickwar
April 2017 Site has resolution to grant Outline planning permission. October Update - Planning consent granted 24/05/2017
Suitable
Available
Achievable
0195 Rear of 61-67
Cleeve Hill
Downend
April 2017 Site has resolution to grant Outline planning permission. October Update - Outline planning consent 28/07/2017.
Suitable
Available
Achievable
0197 Kerr House
Morley Road
Staple Hill
April 2017 Pending decision on application PK16/5889/F October Update - Planning consent granted May 2017. Construction not commenced.
Suitable
Available
Achievable
0198 Junction of Hayes Way
Charlton Boulevard
Patchway
April 2017 Pending decision on Planning application PT16/4976/F. October Update - Site has planning permission and all units are under construction.
Suitable
Available
Achievable
22

RLS Ref Location Commentary on DeliverabilityAssessment
0199 Junction of Hayes Way
Charlton Boulevard
Patchway
April 2017 Pending decision on Planning application PT16/4975/F. October Update - Site has planning permission.
Suitable
Available
Achievable
0200 Filton Road
Winterbourne
April 2017 Pending decision on Planning application PT17/0217/O. October Update - Site has planning permission.
Suitable
Available
Achievable
0201 Oaktree Avenue
Pucklechurch
April 2017 Pending decision on Affordable Housing funded scheme Planning application PK17/0807/F. October Update - Site has planning permission.
Suitable
Available
Achievable
0202 Rawlings and Sons
Cecil Road
Kingswood
April 2017 Affordable Housing funded scheme. October Update - Site has planning permission.
Suitable
Available
Achievable
0203 Land at
Oaktree Avenue
Pucklechurch
April 2017 Pending decision on Affordable Housing funded scheme Planning application PK17/0808/F. October Update - Site has resolution to grant planning permission subject to S106 Agreement.
Suitable
Available
Achievable
23

RLS Ref Location Commentary on DeliverabilityAssessment
0204 Land west of
Gloucester Road
Thornbury
April 2017 Pending decision PT16/4774/O. October Update - Site has resolution to grant planning permission subject to S106 Agreement.
Suitable
Available
Achievable
0205 Staple Hill Primary School
Staple Hill
April 2107 Site identified as Affordable Housing funded scheme. October Update - Full application due shortly period of local area consultation already taken place.
Suitable
Available
Achievable
0206 Former Council Offices
Castle Street
Thornbury
April 2017 Appeal lodged. October Update - Appeal allowed 30/05/2017 existing buildings demolished and site under construction.
Suitable
Available
Achievable
24

Appendix C: Future Monitoring Indicators The table below outlines the new monitoring indicators for the new suite of policies introduced by the Council upon adoption of the Policies, Sites and Places (PSP) Plan on the 8 November 2017. Monitoring will begin once a full monitoring year (between 1 April and 31 March) has been completed with the PSP Plan adopted. This will give the Council an indication of the success of the policies adopted and implemented through the PSP Plan.
Development Management Policy
New or additional monitoring arrangements
PSP2 Landscape Appeals won/lost where PSP2 was a material consideration*
PSP3 Trees and Woodland
Number of Trees given Tree Preservation Orders*
Area of SSSI lost as a result of built development
PSP4 Designated Local Green Spaces
Number of permissions on Local Green Space that are contrary to Policy PSP4*
PSP6 Onsite Renewable and Low Carbon Energy
Renewable energy generation
PSP7 Development in the Green Belt
Statutory Greenbelt change Number of permissions in the Green Belt that are contrary to Policy PSP7*
PSP8 Residential Amenity Appeals won/lost where PSP8 was a material consideration*
PSP9 Health Impact Assessments
Number of Very Major Developments and other qualifying developments that submit Health Impact Assessments as part of a planning application*
PSP15 Park and Ride/Share
Number of permissions for park and ride/park and share/kiss and ride*
PSP17 Heritage Assets and the Historic Environment
Conservation Areas/ Listed buildings/ Scheduled Monuments on the at risk register*
Appeals won/lost where PSP17 was a material consideration*
PSP18 Statutory Wildlife Sites: European Sites and Sites of Special Scientific Interest (SSSI’s)
Area of SSSI’s lost as a result of built development
PSP19 Wider Biodiversity Change in priority habitats and species, by type
UK Priority Species
PSP20 Flood Risk, Surface Water and Watercourse Management
Number of planning permissions granted contrary to Environment Agency advice on flooding or water quality
PSP21 Environmental Pollution and Impacts
Number of monitoring sites exceeding the annual mean nitrogen dioxide objective (40 µg/m3) in South Gloucestershire
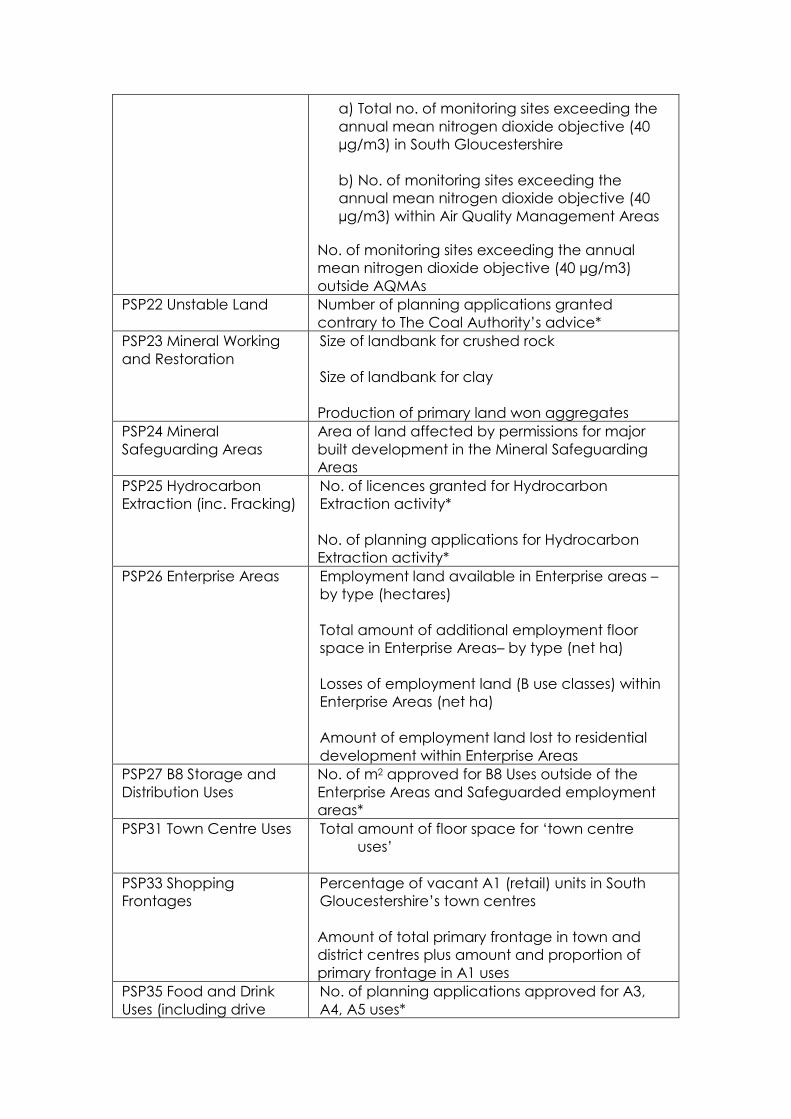
a) Total no. of monitoring sites exceeding the annual mean nitrogen dioxide objective (40 µg/m3) in South Gloucestershire
b) No. of monitoring sites exceeding the annual mean nitrogen dioxide objective (40 µg/m3) within Air Quality Management Areas
No. of monitoring sites exceeding the annual mean nitrogen dioxide objective (40 µg/m3) outside AQMAs
PSP22 Unstable Land Number of planning applications granted contrary to The Coal Authority’s advice*
PSP23 Mineral Working and Restoration
Size of landbank for crushed rock
Size of landbank for clay
Production of primary land won aggregates
PSP24 Mineral Safeguarding Areas
Area of land affected by permissions for major built development in the Mineral Safeguarding Areas
PSP25 Hydrocarbon Extraction (inc. Fracking)
No. of licences granted for Hydrocarbon Extraction activity*
No. of planning applications for Hydrocarbon Extraction activity*
PSP26 Enterprise Areas Employment land available in Enterprise areas – by type (hectares)
Total amount of additional employment floor space in Enterprise Areas– by type (net ha)
Losses of employment land (B use classes) within Enterprise Areas (net ha)
Amount of employment land lost to residential development within Enterprise Areas
PSP27 B8 Storage and Distribution Uses
No. of m2 approved for B8 Uses outside of the Enterprise Areas and Safeguarded employment areas*
PSP31 Town Centre Uses Total amount of floor space for ‘town centre uses’
PSP33 Shopping Frontages
Percentage of vacant A1 (retail) units in South Gloucestershire’s town centres
Amount of total primary frontage in town and district centres plus amount and proportion of primary frontage in A1 uses
PSP35 Food and Drink Uses (including drive
No. of planning applications approved for A3, A4, A5 uses*

through takeaway facilities)
Total number of A3, A4, A5 uses within Town Centres*
PSP36 Telecommunications Infrastructure
No. of permissions granted for new telecommunications infrastructure
PSP37 Internal Space and Accessibility Standards for Affordable Dwellings
Appeals won/lost where PSP37 was a material consideration
PSP41 Rural Workers Dwellings
No. of planning applications for rural workers dwellings approved*
PSP42 Self-Build and Custom Housebuilding
No. of self/custom build plots granted permission*
PSP43 Private Amenity Space Standards
Appeals won/lost where PSP37 was a material consideration*
PSP44 Open Space, Sport and Recreation
Loss/gain of space used for sport and recreational uses*
* Indicates proposed new indicator

Recommended