August’21 Ad Volume Analysis
...

Ad Volumes in August’21 on a robust growth trajectory. ...
2
157
135
126
145
158
Ad Vol (Mn Sec)
Apr-21 ●
May-21 ●
Jun-21 ●
Jul-21 ●
Aug-21●
17%
Excluding: ASSOCIATIONS/SOCIAL/CULTURAL ORG, Fillers, SOCIAL ADVERTISEMENTS-NGOS
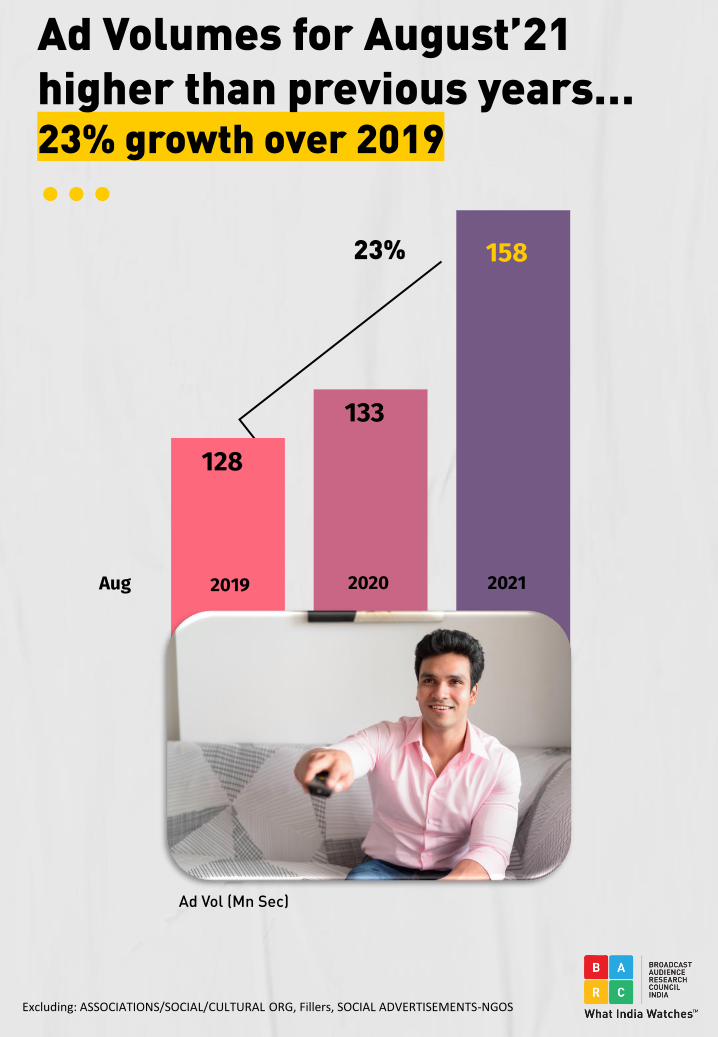
Ad Volumes for August’21 higher than previous years… 23% growth over 2019...
Excluding: ASSOCIATIONS/SOCIAL/CULTURAL ORG, Fillers, SOCIAL ADVERTISEMENTS-NGOS
Ad Vol (Mn Sec)
128
133
158
2019 2020 2021
23%
Aug

Number of Advertisers & Brands also on the rise. Highest in 2021.
Number of Advertisers & Brands in August’21 higher than the previous two years. ...
Excluding: ASSOCIATIONS/SOCIAL/CULTURAL ORG, Fillers, SOCIAL ADVERTISEMENTS-NGOS
Jul-21
May-21
Jun-21
2584
2137
Apr-21
Aug-21
1839
2159
2793
4198
3574
3070
3557
4390
Advertisers Active in 2021
Brands Active in 2021
Jul-21
May-21
Jun-21
Apr-21
Aug-21

Growth witnessed across spectrum of Advertisers.
...Excluding: ASSOCIATIONS/SOCIAL/CULTURAL ORG, Fillers, SOCIAL ADVERTISEMENTS-NGOS
Top 10 & Next 40 Excludes: Govt, Media & Film Trailor Advertisers
Top 10 Advertisers
51
Aug -2019
61
Aug-2020
66
Aug -202129%
19%
32
Next 40 Advertisers
27
Aug -2019Aug -2021
28
Aug -2020
22%
Others
44
Aug -2020
49
Aug-2019
60
Aug -2021
Ad Vol (Mn Sec)
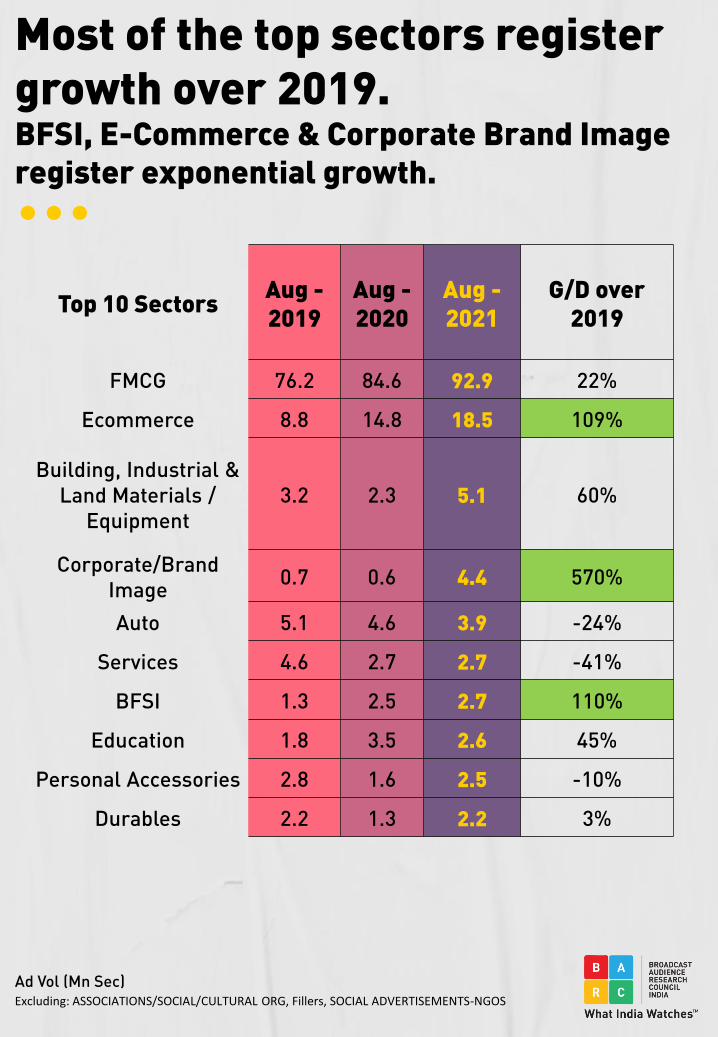
Most of the top sectors register growth over 2019.BFSI, E-Commerce & Corporate Brand Image register exponential growth. ...
Excluding: ASSOCIATIONS/SOCIAL/CULTURAL ORG, Fillers, SOCIAL ADVERTISEMENTS-NGOS
Top 10 SectorsAug -2019
Aug -2020
Aug -2021
G/D over 2019
FMCG 76.2 84.6 92.9 22%
Ecommerce 8.8 14.8 18.5 109%
Building, Industrial &
Land Materials /
Equipment
3.2 2.3 5.1 60%
Corporate/Brand
Image0.7 0.6 4.4 570%
Auto 5.1 4.6 3.9 -24%
Services 4.6 2.7 2.7 -41%
BFSI 1.3 2.5 2.7 110%
Education 1.8 3.5 2.6 45%
Personal Accessories 2.8 1.6 2.5 -10%
Durables 2.2 1.3 2.2 3%
Ad Vol (Mn Sec)

BFSI, Durables, Building Industrial & Land Materials/Equipment has seen a sharp increase in August post COVID-19 slowdown. ...
Excluding: ASSOCIATIONS/SOCIAL/CULTURAL ORG, Fillers, SOCIAL ADVERTISEMENTS-NGOS
Ad Vol (Mn Sec)
May-21 ● Jun-21 ● Jul-21 ● Aug-21●
0.90.6 0.9
2.2144%
1.2
1.6 1.6
2.7125%
BFSI
DURABLES
3.22.7
3
5.159%
Building Industrial & Land Material/Equipment
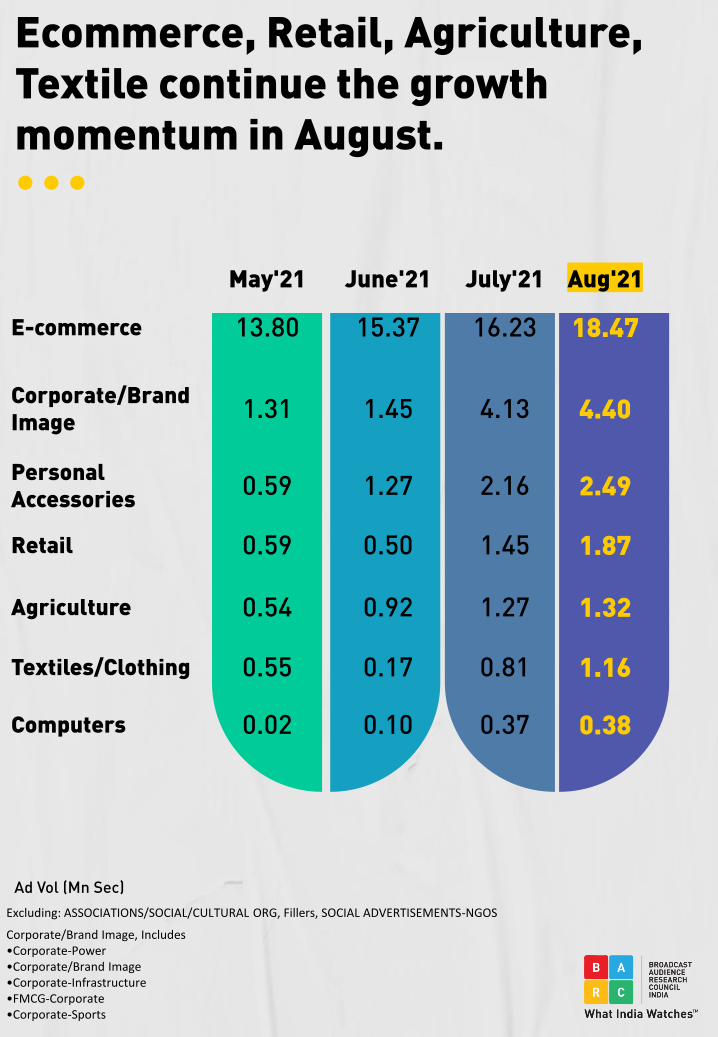
Ecommerce, Retail, Agriculture, Textile continue the growth momentum in August....
Excluding: ASSOCIATIONS/SOCIAL/CULTURAL ORG, Fillers, SOCIAL ADVERTISEMENTS-NGOS
May'21 June'21 July'21 Aug'21
E-commerce 13.80 15.37 16.23 18.47
Corporate/Brand Image
1.31 1.45 4.13 4.40
Personal Accessories
0.59 1.27 2.16 2.49
Retail 0.59 0.50 1.45 1.87
Agriculture 0.54 0.92 1.27 1.32
Textiles/Clothing 0.55 0.17 0.81 1.16
Computers 0.02 0.10 0.37 0.38
Corporate/Brand Image, Includes•Corporate-Power•Corporate/Brand Image•Corporate-Infrastructure•FMCG-Corporate•Corporate-Sports
Ad Vol (Mn Sec)

Most Language Channels register growth over 2019. ...
Excluding: ASSOCIATIONS/SOCIAL/CULTURAL ORG, Fillers, SOCIAL ADVERTISEMENTS-NGOS
Aug - 2019 Aug - 2020 Aug - 2021 G/D over 2019
HINDI 38 43 49 28%
TAMIL 13 12 17 28%
TELUGU 12 10 13 7%
BENGALI 11 11 12 8%
KANNADA 10 10 11 12%
MALAYALAM 8 7 9 13%
MARATHI 6 7 8 32%
PUNJABI 5 6 7 47%
BHOJPURI 3 5 7 113%
Does not include multiple language channels
Ad Vol (Mn Sec)

HUL continue to lead followed by RBG
...
Excluding: ASSOCIATIONS/SOCIAL/CULTURAL ORG, Fillers, SOCIAL ADVERTISEMENTS-NGOS
Aug - 2019 Aug - 2020 Aug– 2021
HINDUSTAN UNILEVER
LTD20 25 28
RECKITT BENCKISER
GROUP10 15 17
PROCTER & GAMBLE 5 3 4
CADBURYS INDIA LTD 3 2 3
GODREJ GROUP 3 3 3
ASIAN PAINTS (I) LTD 1 0 2
GLAXOSMITHKLINE
GROUP OF COMPA3 1 2
COLGATE PALMOLIVE
INDIA LTD2 3 2
ITC LTD 3 3 2
PEPSI FOODS (G) 1 1 2
Ad Vol (Mn Sec)
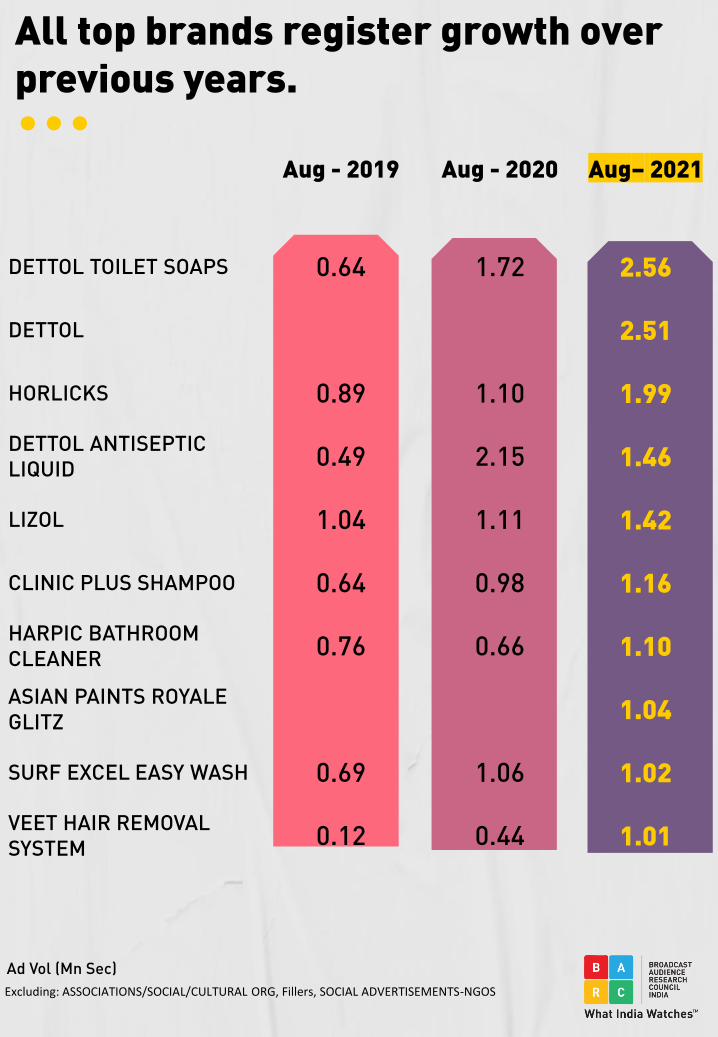
All top brands register growth over previous years. ...
Excluding: ASSOCIATIONS/SOCIAL/CULTURAL ORG, Fillers, SOCIAL ADVERTISEMENTS-NGOS
Aug - 2019 Aug - 2020 Aug– 2021
DETTOL TOILET SOAPS 0.64 1.72 2.56
DETTOL 2.51
HORLICKS 0.89 1.10 1.99
DETTOL ANTISEPTIC
LIQUID0.49 2.15 1.46
LIZOL 1.04 1.11 1.42
CLINIC PLUS SHAMPOO 0.64 0.98 1.16
HARPIC BATHROOM
CLEANER0.76 0.66 1.10
ASIAN PAINTS ROYALE
GLITZ1.04
SURF EXCEL EASY WASH 0.69 1.06 1.02
VEET HAIR REMOVAL
SYSTEM0.12 0.44 1.01
Ad Vol (Mn Sec)
Start of festive Season brings cheer to Ad Volumes
12
...

Ad Volumes during Onam Week 2021 increased by 22% compared to previous 4 weeks on Malayalam Channels....
1.71
1.63
1.831.991.84
2.24
2019 2020 2021
Prv 4Wk Avg Onam Wk Prv 4Wk Avg Onam Wk Prv 4Wk Avg Onam Wk
Onam Week: 2019 – 26th Aug-1st Sep, 2020 -24th-30th Aug, 2021- 16th-22nd Aug
Mazhavil Manorama(v) is considered as Malayalam ChannelsExcludes: ASSOCIATIONS/SOCIAL/CULTURAL ORG; SOCIAL ADVERTISEMENTS-NGOS & FILLER
16%
13%
22%
Ad Vol (Mn Sec)

28% more Advertisers,24% more Brands, during Onam Week 2021 as compared to previous 4 weeks.
Number of Advertisers & Brands during Onam Week 2021 higher than previous years
...
420
346
393
284
422
330
Prv 4Wk Avg
Onam Wk
Prv 4Wk Avg
Onam Wk
Prv 4Wk Avg
Onam Wk
698
584
648
503
712
574
Prv 4Wk Avg
Onam Wk
Prv 4Wk Avg
Onam Wk
Prv 4Wk Avg
Onam Wk
Advertiser Count (Malayalam Channels)
Brand Count (Malayalam
Channels)
Onam Week: 2019 – 26th Aug-1st Sep, 2020 -24th-30th Aug, 2021- 16th-22nd Aug
Mazhavil Manorama(v) is considered as Malayalam ChannelsExcludes: ASSOCIATIONS/SOCIAL/CULTURAL ORG; SOCIAL ADVERTISEMENTS-NGOS & FILLER
Aug 2019 ●
Aug 2020 ●
Aug 2021 ●

CONTACT [email protected] usLinkedIn | Twitter | Instagram | Facebook
Website: https://barcindia.co.in/
Legal Disclaimer
The information, data and insights contained herein are the sole and exclusive Intellectual Property of BARC India. Any
creation of any derivative work/s in any manner whatsoever, is strictly prohibited without the prior written and explicit
consent of BARC India.
The images used are for representation purposes only and are not for use outside this BARC India Aug 2021 Ad Volumes
deck for any purpose and/or manner whatsoever. 15
...
Recommended