EARNINGS DATA AND GENERAL INFORMATION
Unit
Q1-3 2014/15
Q1-3 2015/16
Change in %
Revenue
€ in millions
489.4
584.3
19.4%
thereof produced in Asia
%
79%
81%
–
thereof produced in Europe
%
21%
19%
–
Cost of sales
€ in millions
372.3
455.7
22.4%
Gross profit
€ in millions
117.1
128.7
9.9%
Gross profit margin
%
23.9%
22.0%
–
EBITDA
€ in millions
127.3
140.2
10.2%
EBITDA margin
%
26.0%
24.0%
–
EBIT
€ in millions
70.8
76.1
7.4%
EBIT margin
%
14.5%
13.0%
–
Profit for the period
€ in millions
50.3
60.2
19.6%
Profit for the period attributable to owners of the parent company
€ in millions
50.3
60.1
19.6%
Cash earnings
€ in millions
106.8
124.3
16.4%
ROE (Return on equity)
1)
%
15.0%
13.3%
–
ROCE (Return on capital employed)
1)
%
12.6%
11.0%
–
ROS (Return on sales)
%
10.3%
10.3%
–
Cashflow from operating activities (OCF)
€ in millions
95.4
129.9
36.2%
Net CAPEX
€ in millions
130.4
176.9
35.6%
Employees (incl. leased personnel), end of reporting period
–
7,977
9,016
13.0%
Employees (incl. leased personnel), average
–
7,526
8,688
15.4%
BALANCE SHEET DATA
31 Mar 2015
31 Dec 2015
Total assets
€ in millions
1,220.8
1,476.1
20.9%
Total equity
€ in millions
604.4
599.6
(0.8%)
Equity attributable to owners of the parent company
€ in millions
604.3
599.5
(0.8%)
Equity ratio
%
49.5%
40.6%
–
Net debt
€ in millions
130.5
192.4
47.4%
Net gearing
%
21.6%
32.1%
–
Net working capital
€ in millions
95.3
81.3
(14.7%)
Net working capital per revenue
%
14.3%
10.4%
–
STOCK EXCHANGE DATA
Q1-3 2014/15
Q1-3 2015/16
Shares outstanding, end of reporting period
–
38,850,000
38,850,000
–
Weighted average number of shares outstanding
–
38,850,000
38,850,000
–
Earnings per shares outstanding end of reporting period
€
1.29
1.55
19.6%
Earnings per average number of shares outstanding
€
1.29
1.55
19.6%
Cash earnings per average number of shares
€
2.75
3.20
16.4%
Market capitalisation, end of reporting period
€ in millions
347.7
565.7
62.7%
Market capitalisation per equity
2)
%
69.2%
3)
94.4%
–
1) Calculated on the basis of average values. 2) Equity attributable to owners of the parent company. 3) Calculated on the basis of the Equity as per 31 Dec 2014.
Key figures

Overall good demand and high capacity utilisation in first nine months, slight slow-down of demand for mobile devices at the end of the third quarter
Revenue again clearly higher than average revenue growth of the PCB industry of 1.5%: Revenue increase of 19.4% to € 584.3 million, organic growth accounts for € 37.0 million and currency translation effects for € 57.9 million
EBITDA rose by 10.2% to € 140.2 million based on high capacity utilisation, a good product mix and positive currency translation ef-fects of € 10.9 million
EBITDA was 24.0% and 2.0 percentage points below last year’s very high level (which included a one-off payment in Q2 and an extraor-dinary high demand for mobile devices in Q3)
Profit for the period improved by 19.6% to € 60.2 million compared to last year’s period
Earnings per share increased from € 1.29 to € 1.55
Investments in tangible and intangible assets were up to € 177.0 million in the first nine months
Cash flow from operating activities before changes in working capi-tal was up 6.6% to € 123.4 million
Net debt rose by 47.4% to € 192.4 million; this expected increase is the result of high investment activities and paid dividends; gearing ratio was 32.1%
Set-up of the two plants in Chongqing proceeded according to plan – certification for the IC substrate plant in final phase and is ex-pected shortly
Highlights

04
Dear Ladies and Gentlemen, Dear Shareholders,
In the first nine months of the financial year 2015/16 AT&S clearly increased revenue and operative results compared to last year’s period. This development was primarily based on an untypically high demand for mobile devices in the first half of the year, but also on the consistent high demand in the automotive applica-tions. However, AT&S was unable to completely detach itself from the slightly weaker development of de-mand in the high-end mobile devices segment (smartphones, tablets, notebooks) at the end of the third quarter of the financial year 2015/16.
Statement of the Management Board

05
Overall continuous good volume and the associated high capacity utilisation in the Business Units Mobile Devices & Substrates and Automotive, Industrial, Medical, coupled with favourable currency translation effects, contributed to an increase in revenue by 19.4% or € 94.9 million to € 584.3 million. Organic revenue growth amounted to 7.6% or € 37.0 million, thus clearly exceeding the average of the printed circuit board industry, which amounted to roughly 1.5% before adjustments for currency effects.
Earnings before interest, taxes, depreciation and amortisation (EBITDA) rose by 10.2% to € 140.2 million, of which € 10.9 million of positive contributions to earnings resulted from currency translation effects. The EBITDA margin, at 24.0%, was at a very high level, though 2.0 percentage points lower than in the first nine months of the previous year. This exceptional level of the previous year was characterised by an above-average demand for high-end printed circuit boards for mobile devices and the proceeds from a compensa-tion payment. With a margin level of 24.0%, AT&S is still one of the most profitable printed circuit board manufacturers worldwide.
Additions to assets for the set-up of the two new plants in Chongqing totalled € 154.5 million in the first nine months. These planned investments led to an increase in net debt from € 130.5 million to € 192.4 million. CAPEX requirements for Chongqing until mid 2017 are covered by existing financing activities.
The set-up of the two new plants in Chongqing proceeded according to schedule in the first nine months. The phase of qualification of the IC Substrates plant (determination of all parameters under serial production conditions) is completed. The certification by the initial customer, which was expected beginning of the cal-endar year 2016, is currently in the final phase with last tests for fine adjustments of single parameters. Certi-fication is shortly expected. This milestone is the prerequisite for the gradual start-up of the first production line for IC substrates. IC substrates are produced as a connection between chips and printed circuit boards for applications such as notebooks and PCs. The expected impact related to the ramp-up of this plant will be-come effective starting in the fourth quarter of the AT&S financial year (01 Jan – 31 Mar 2016) and has been taken into account in the guidance for the financial year 2015/16. Infrastructure for the second plant which will produce substrate-like PCBs starting second half 2016, is being completed.
We still see good demand by all customer segments, although – as previously announced – we assume there will be the usual seasonality in the last quarter of the financial year (01 Jan – 31 Mar 2016), characterized by the Chinese New Year break.
Based on the organic growth of the first nine months and an expected seasonality in the next three months we confirm the revenue target of € 740 million. Influenced by the above-mentioned costs of the ramp-up of the new plants in Chongqing, the EBITDA margin is expected to exceed 19%. This includes an EBITDA margin in the core business at a similar level of the previous year.
We thank all our customers and shareholders for the trust they have put in AT&S again and all our employees for their excellent performance in the first nine months of the financial year 2015/16.
With best regards
Andreas Gerstenmayer m.p. Chief Executive Officer
Karl Asamer m.p. Chief Financial Officer
Heinz Moitzi m.p. Chief Operations Officer

06
DIRECTORS’ DEALINGS Karl Asamer, Deputy Chairman of the Management Board of AT & S Austria Technologie & Systemtechnik Aktiengesellschaft, sold 2,000 shares of the company on 06 November 2015 at a price of € 15.83 per share. Karl Asamer has therefore held a total of 9,000 shares of the company since this date, which corresponds to a share in capital of roughly 0.02% in relation to 38,850,000 shares issued.
The relevant directors’ dealings notifications can be viewed in the FMA Directors’ Dealings Database, at https://www.fma.gv.at/en/companies/issuers/directors-dealings/directorsdealings-database.html
Corporate governance information

07
SHAREHOLDER STRUCTURE
MARKET AND SHARE PRICE DEVELOPMENT IN THE THIRD QUARTER OF 2015/16 The volatile development in the international financial markets continued in the third quarter of the AT&S financial year 2015/16. In mid-December the US Federal Reserve signalled confidence in the stability of the economic development by a widely expected interest rate increase, the first in nearly ten years, thus trigger-ing positive reactions in the markets. In contrast, the ECB did not meet expectations regarding an expansion of the buyback programmes, which led to clearly negative price fluctuations on short notice. At the same time, growing geopolitical tensions, especially between Turkey and Russia, led to uncertainties.
Against the backdrop of these developments, the European stock benchmark Eurostoxx 50 recorded an in-crease by 5.4% in the last calendar quarter. The American lead index Dow Jones Industrial (DJI) improved by 7.0%. The Austrian ATX exceeded the 2,500 point mark again for a short period in December and ended the quarter clearly positive with a 7.5% increase.
AT&S AGAINST ATX-PRIME AND TEC DAX
AT&S stock
14.9% of Free Float not identified

08
In the third quarter of 2015/16, the price of the AT&S share moved within a range of the quarterly low of € 12.90 in early October and the quarterly high of € 16.00 in late October. Following another volatile devel-opment throughout the quarter, the share closed at € 14.56 on 31 December 2015. The closing price is there-fore nearly identical with the price at the beginning of the financial year on 01 April 2015 (€ 14.62).
At the Vienna Stock Exchange, a daily average of 58,915 AT&S shares was traded in the first three quarters of the financial year, which corresponds to a 6.7% increase per day in comparison with the same period of the previous year.
As in the preceding months, capital market communication in the third quarter of 2015/16 focused on the progress made at the new plant for IC substrates in Chongqing. AT&S was able to report on developments according to schedule. Talks with analysts and investors were held at the financial centers of Vienna, Frank-furt, London, Warsaw, Prague, San Francisco and Chicago in the period from 01 October to 31 December 2015. In addition, AT&S organised a series of teleconferences and personal talks with existing and potential investors.
The AT&S share is currently covered by nine analysts, and received four “buy” and three “hold” recommenda-tions, as well as one “neutral” and one “reduce” recommendation.
KEY STOCK FIGURES FOR THE FIRST NINE MONTHS (€)
31 December 2015 31 December 2014
Earnings per share 1.55 1.29
High 16.35 10.44
Low 12.80 7.68
Close 14.56 8.95
AT&S SHARE Vienna Stock Exchange
Shares outstanding 38,850,000
Security ID number 969985
ISIN-Code AT0000969985
Symbol ATS
Reuters RIC ATSV.VI
Bloomberg ATS AV
Indices ATX Prime, WBI SME
FINANCIAL CALENDAR
10 May 2016 Publication of annual results 2015/16
07 July 2016 22nd Annual General Meeting
CONTACT INVESTOR RELATIONS
Elke Koch Phone: +43 (0) 3842 200 5925 [email protected]

09
BUSINESS DEVELOPMENTS AND SITUATION AT&S recorded a successful business development in the first nine months of the financial year 2015/16. Based on good sales volume and the high utilisation in all business units, revenue increased by € 94.9 million or 19.4%, from € 489.4 million to € 584.3 million. The organic growth of € 37.0 million or 7.6% was primarily based on an untypically high demand for printed circuit boards for mobile end devices in the first six months of the financial year 2015/16 (the first quarter of the financial year is usually characterised by lower seasonal demand), and the continued high demand for printed circuit boards for the automotive sector. In addition to this organic growth, higher exchange rates compared with the previous year also contributed € 57.9 million or 11.8% to the increase. The share of products manu-factured in Asia in revenue rose from 79% in the previous year to 81% in the current financial year.
Result key data € in millions (unless otherwise stated)
Q1-3 2015/16
Q1-3 2014/15
±
Revenue 584.3
489.4
19.4%
Operating result before interest, tax, depreciation and amortisation (EBITDA)
140.2
127.3
10.2%
EBITDA margin (%) 24.0%
26.0%
Operating result (EBIT) 76.1
70.8
7.4%
EBIT margin (%) 13.0%
14.5%
Profit for the year 60.2
50.3
19.6%
Earnings per share (€) 1.55
1.29
19.6%
Additions to property, plant and equipment and intangible assets 224.2
122.3
83.3%
Average number of staff (incl. leased personnel) 8,688
7,526
15.4%
EBITDA rose by € 12.9 million or 10.2% from € 127.3 million to € 140.2 million in the first nine months of the financial year 2015/16. In addition to a high production performance a good product mix also contributed to this very positive result. Negative currency translation effects, derived from revenue in euro and correspond-ing cost of sales in Indian rupee, South Korean won and Chinese renminbi, have been overcompensated by positive currency translation effects of the US dollar and led to an overall positive effect of € 10.9 million.
The EBITDA margin amounted to 24.0% in the first nine months, thus 2.0 percentage points below the very high level of 26.0% in the previous year, which was characterised by an income from a compensation pay-ment in the second quarter and above-average demand for mobile devices in the third quarter.
Group Interim Management Report
Development of revenue € in millions
Development of EBITDA € in millions
489.
4
58
4.3
Q1-3 2014/15 Q1-3 2015/16
127.
3
140.
2Q1-3 2014/15 Q1-3 2015/16

10
Development of profit € in millions
Q1-3 2014/15 One-off effects
1) Currency effects
2) Organic Q1-3 2015/16
Revenue 489.4
–
57.9
37.0
584.3
Cost of sales (372.4)
–
(52.1)
(31.2)
(455.7)
Gross profit 117.1
–
5.8
5.8
128.7
Distribution costs (23.1)
–
(1.9)
(1.1)
(26.1)
General and administrative costs (20.3)
–
(0.8)
(0.7)
(21.8)
Other operating result (2.8)
(4.2)
(1.0)
3.2
(4.7)
Operating result before interest, tax, depreciation and amortisation (EBITDA)
127.3
(0.5)
10.9
2.5
140.2
Operating result (EBIT) 70.8
(4.2)
2.2
7.2
76.1
Finance costs - net (4.4)
(0.9)
3.5
(0.9)
(2.7)
Profit before tax 66.4
(5.0)
5.7
6.3
73.4
Income taxes (16.1)
1.9
(1.8)
2.8
(13.2)
Profit for the year (result after tax) 50.3
(3.1)
3.9
9.1
60.2
1) Plant construction of Chongqing 2) Translation and valuation effects included in the consolidated financial statements
Depreciation and amortisation was higher by € 7.7 million or 13.6% in comparison to the previous year, in-creasing from € 56.5 million to € 64.2 million. The increase is primarily based on currency translation effects, but also on higher depreciation of administrative buildings in Chongqing which has started in the third quar-ter of the financial year 2014/15.
Finance costs improved significantly from € -4.4 million to € -2.7 million. The increase in interest expenses of € 0.9 million or 8.8% from € 10.4 million to € 11.3 million is based on higher borrowings as a result of the successful placement of promissory notes in October 2015, amounting to € 221.0 million. This increase was more than offset by € 0.7 million higher interest income and € 2.6 million higher interest capitalisation of qualifying assets. The Group’s tax rate, at 18.0%, was significantly lower than the value of 24.2% in the previ-ous year. This reduction is primarily attributable to a lower tax rate of AT&S (China) Company Limited, which in the previous financial year received again the favourable tax status of a “high-tech company” as of January 2015 (with retroactive effect for the calendar year 2014).
The profit for the period increased by € 9.9 million or 19.6%, from € 50.3 million to € 60.2 million due to the positive business development, very good finance costs and the low tax rate. As a result, earnings per share improved from € 1.29 to € 1.55.
FINANCIAL POSITION Total assets increased by € 255.3 million or 20.9% in the first nine months of the financial year 2015/16, from € 1,220.8 million to € 1,476.1 million. The increase was caused by additions to assets of € 154.5 million for the new plant in Chongqing, technology upgrades of € 69.7 million at other sites (thereof € 177.0 million CAPEX) and higher cash and cash equivalents € 426.2 million (31 March 2015: € 273.9 million) resulted by the aforementioned issuing of promissory notes were offset by currency transla-tion effects, depreciation and a decrease by € 20.9 million in trade and other receivables.
Equity declined by € 4.8 million or 0.8%, from € 604.4 million to € 599.6 million. The higher profit for the period of € 60.2 million did not fully offset negative currency differences from translation of the net asset position of subsidiaries and translation of long-term loans to subsidiaries, which resulted mostly from a slight
EBITDA margin in %
EBIT margin in %
26.0
24.0
Q1-3 2014/15 Q1-3 2015/16
14
.5
13.0
Q1-3 2014/15 Q1-3 2015/16

11
appreciation of the euro against Chinese renminbi since 31 March 2015. The resulting equity ratio of 40.6% due to the sharp rise in total assets was 8.9 percentage points lower than the value at 31 March 2015.
Net debt rose by € 61.9 million or 47.4%, from € 130.5 million to € 192.4 million. This expected increase resulted due to high investing activities and dividend payment. The significant improvement in cash flow from operating activities before changes in working capital by € 7.6 million or 6.6%, which reflects the operational-ly very strong first nine months of the current financial year, influenced positively the net debts.
Net gearing, at 32.1%, was at a higher level at 31 December 2015 than at 31 March 2015 with 21.6%. This results from an increase in net debt and the slightly reduced equity caused by negative currency differences.
As of 22 October 2015 AT&S made a premature repayment of the corporate bond due in November 2016, which has fixed yearly interest rate of 5.0%, with a nominal amount of € 18.0 million.
As of 23 October 2015 a promissory note loan was successfully placed in the total amount of € 221.0 million. Due to the high demand the former issuing volume of € 100 million, which should ensure the premature refunding of the bond due to favorable current interest rates, has been increased up to € 221.0 million. The promissory note loan comprises several tranches with terms to maturity of five and seven years carrying fixed and variable interest in euro and US dollar with an average interest rate of 1.6% valid as at the date of emis-sion.
As a result of these actions AT&S is able to optimize further its financial structure, both in the terms of ma-turity and regarding the finance costs.
Liquidity remains very good at AT&S. The company has both sufficient long-term financial resources and short-term credit facilities at its disposal to cover the planned investments and working capital. Possibilities to optimise financing are reviewed on an ongoing basis.
BUSINESS DEVELOPMENT BY SEGMENTS The AT&S Group breaks its operating activities down into three business units: “Mobile Devices & Substrates”, “Automotive, Industrial, Medical” and “Others”. At the beginning of the financial year 2015/16, the business unit Industrial & Automotive was renamed to Au-tomotive, Industrial, Medical. For further information on the segments and segment reporting please refer to the Annual Report 2014/15.
AT&S has successfully positioned itself in all three segments as a high-end manufacturer and all three seg-ments show a very positive development in revenue. The share of the business unit Mobile Devices & Sub-strates in total external revenue increased from 56.7% to 60.2%. The share of the Automotive, Industrial, Medical segment in revenue was at 39.4% after 43.0% despite significant increases in absolute figures. The importance of the Others segment remained constant with 0.4%.
Revenue from external customers by segment in %
56.7% 60.2%
43.0% 39.4%
0.3% 0.4%
Q1-3 2014/15 Q1-3 2015/16

12
MOBILE DEVICES & SUBSTRATES SEGMENT Accumulated demand for high-end HDI printed circuit boards in the first nine months was still good, but experienced a slight slow-down at the end of the third quarter. This segment benefited from stronger demand by the other business segments. Moreover, exchange rates, which are still favourable from a euro perspective, had a positive impact. Overall, this led to a substantial increase in revenue by € 88.6 million or 26.8%, from € 331.0 million to € 419.6 million.
Mobile Devices & Substrates segment – overview € in millions (unless otherwise stated)
Q1-3 2015/16
Q1-3 2014/15
±
Segment revenue 419.6
331.0
26.8%
Revenue from external customers 351.5
277.6
26.6%
Operating result before interest, tax, depreciation and amortisation (EBITDA)
109.1
95.9
13.8%
EBITDA margin (%) 26.0%
29.0%
Operating result (EBIT) 53.9
46.7
15.5%
EBIT margin (%) 12.9%
14.1%
Additions to property, plant and equipment and intangible assets 202.1
98.7
104.7%
Employees (incl. leased personnel), average 5,916
4,911
20.5%
EBITDA rose by € 13.2 million or 13.8%, from € 95.9 million to € 109.1 million, due to increase of revenue. The EBITDA margin was burdened by sales in Euro and the corresponding production costs in Chinese renminbi.
Depreciation and amortisation in the segment rose by € 6.0 million or 12.2%, from € 49.2 million to € 55.2 million. Apart from currency translation effects of € 8.4 million, depreciation and amortisation in Chongqing also contributed to the increase. As a result, the segment’s EBIT amounted to € 53.9 million, which exceeded the prior year figure by € 7.2 million or 15.5%. The segment’s EBIT margin was reduced by 1.2 percentage points from 14.1% to 12.9%.
The project Chongqing resulted in additions to assets of € 154.5 million (previous year: € 60.5 million). The remaining additions were related to technology upgrades at the Shanghai site. The increase in the number of employees by 1,005 persons is primarily attributable to the establishment of the Chongqing plant according to plan.
AUTOMOTIVE, INDUSTRIAL, MEDICAL SEGMENT With revenue growth by € 22.6 million or 10.1%, this segment suceeded the good prior year value from € 224.1 million to € 246.7 million. The main driver was the continuously increasing demand by the automotive sector, which reflects the trend towards more electronic components in vehicles, and by the medical sector. Demand in the industrial sector was slightly below the high level of the previous year.
Mobile Devices & Substrates Development of revenue
€ in millions
Mobile Devices & Substrates EBITDA Development
€ in millions
Automotive, Industrial, Medical
Development of revenue € in millions
331.
0
419.
6
Q1-3 2014/15 Q1-3 2015/16
95
.9 10
9.1
Q1-3 2014/15 Q1-3 2015/16
224.
1
246.
7
Q1-3 2014/15 Q1-3 2015/16

13
Automotive, Industrial, Medical segment – overview € in millions (unless otherwise stated)
Q1-3 2015/16
Q1-3 2014/15
±
Segment revenue 246.7
224.1
10.1%
Revenue from external customers 230.0
210.3
9.4%
Operating result before interest, tax, depreciation and amortisation (EBITDA)
24.9
27.2
(8.3%)
EBITDA margin (%) 10.1%
12.1%
Operating result (EBIT) 17.0
20.8
(18.1%)
EBIT margin (%) 6.9%
9.3%
Additions to property, plant and equipment and intangible assets 16.3
21.9
(25.4%)
Employees (incl. leased personnel), average 2,619
2,485
5.4%
Utilisation of the production sites of this segment was at the high level of the previous year. The segment benefited from increasing intercompany sales. The segment was impacted by currency-related increases in production costs in India and Korea which could only partially be passed on to customers. Overall, this led to a decline in EBITDA by € 2.3 million or 8.3%, from € 27.2 million to € 24.9 million. The EBITDA margin de-creased by 2.0 percentage points from 12.1% to 10.1%.
Due to the EBITDA reduction and based on a higher depreciation and amortisation by € 1.5 million or 23.2%, the segment’s EBIT declined slightly by € 3.8 million or 18.1%, from € 20.8 million to € 17.0 million.
The additions to assets, at € 16.3 million, are significantly lower than the prior year value of € 21.9 million.
OTHERS SEGMENT The business unit Advanced Packaging, which is part of the Others segment, contin-ued the positive development of the previous year and recorded a significant increase in revenue of € 8.8 million or 117.1% compared with the previous year. Revenue rose from € 7.6 million to € 16.4 million. The increase in revenue reflects the outstanding positioning of AT&S in this segment and the trend of em-bedding active and passive electronic components into printed circuit boards, which AT&S identified at an early stage.
Based on this highly favourable development, the segment generated clearly positive EBITDA and EBIT. The costs of the general holding activities, which are included in the Others segment, were maintained stable in comparison with the previous year; earnings increased significantly.
Others segment – overview € in millions (unless otherwise stated)
Q1-3 2015/16
Q1-3 2014/15
±
Segment revenue 16.4
7.6
117.1%
Revenue from external customers 2.9
1.6
82.8%
Operating result before interest, tax, depreciation and amortisation (EBITDA)
6.1
4.2
46.3%
EBITDA margin (%) 37.2%
55.2%
Operating result (EBIT) 5.0
3.3
53.5%
EBIT margin (%) 30.6%
43.2%
Additions to property, plant and equipment and intangible assets 5.8
1.8
233.0%
Employees (incl. leased personnel), average 153
131
16.8%
Automotive, Industrial, Medical EBITDA Development € in millions
27
.2
24
.9
Q1-3 2014/15 Q1-3 2015/16

14
SIGNIFICANT EVENTS AFTER THE END OF THE INTERIM REPORTING PERIOD AT&S prematurely terminated the variable tranche of the promissory note loan placed in February 2014 with effec-tiveness by 15 February 2016 in the amount of € 87.0 million to further optimise finance costs.
SIGNIFICANT RISKS, UNCERTAINTIES AND OPPORTUNITIES There were no significant changes in the risk categories compared with those described in detail in section 6 “Risk and opportunities management” of the Group Management Report of the consolidated financial statements 2014/15.
With respect to opportunities and risks related to developments in the external environment for the full financial year 2015/16, it is still assumed that total revenues in the printed circuit board industry will increase worldwide.
OUTLOOK On the basis of the organic growth in the first nine months and expected seasonality in the next three months, the Management Board confirms its revenue target of € 740 million.
Influenced by the expected costs of the start-up of the new plants in Chongqing, the EBITDA margin should exceed 19% (guidance at the beginning of the financial year: 18-20%). This includes an EBITDA margin in the core business at a similar level of the previous year.
Leoben-Hinterberg, 27 January 2016
Management Board
Andreas Gerstenmayer m.p. Karl Asamer m.p. Heinz Moitzi m.p.

15
€ in thousands 01 Oct - 31 Dec 2015 01 Oct - 31 Dec 2014 01 Apr - 31 Dec 2015 01 Apr - 31 Dec 2014
Revenue 197,204
187,339
584,333
489,416
Cost of sales (153,407)
(136,493)
(455,662)
(372,349)
Gross profit 43,797
50,846
128,671
117,067
Distribution costs (8,923)
(8,362)
(26,115)
(23,130)
General and administrative costs (8,251)
(6,843)
(21,789)
(20,338)
Other operating result (1,291)
(4,758)
(4,693)
(2,788)
Operating result 25,332
30,883
76,074
70,811
Finance income 1,279
1,079
6,174
4,889
Finance costs (3,968)
(3,092)
(8,838)
(9,265)
Finance costs - net (2,689)
(2,013)
(2,664)
(4,376)
Profit before tax 22,643
28,870
73,410
66,435
Income taxes (4,552)
(6,976)
(13,182)
(16,097)
Profit for the period 18,091
21,894
60,228
50,338
Attributable to owners of the parent company 18,067
21,863
60,133
50,279
Attributable to non-controlling interests 24
31
95
59
Earnings per share attributable to equity holders of the parent company (in € per share):
- basic 0.47
0.56
1.55
1.29
- diluted 0.47
0.56
1.55
1.29
Weighted average number of shares outstanding - basic (in thousands)
38,850
38,850
38,850
38,850
Weighted average number of shares outstanding - diluted (in thousands)
38,850
38,850
38,850
38,850
Consolidated Statement of Comprehensive Income
€ in thousands 01 Oct - 31 Dec 2015 01 Oct - 31 Dec 2014 01 Apr - 31 Dec 2015 01 Apr - 31 Dec 2014
Profit for the period 18,091
21,894
60,228
50,338
Items to be reclassified:
Currency translation differences
7,257 16,122
(50,484)
71,875
(Losses) from the fair value measurement of hedging instruments for cash flow hedges, net of tax
(825)
(353)
(467)
(2,320)
Other comprehensive income for the period 6,432
15,769
(50,951)
69,555
Total comprehensive income for the period 24,523
37,663
9,277
119,893
Attributable to owners of the parent company 24,489
37,632
9,198
119,821
Attributable to non-controlling interests 34
31
79
72
Interim Financial Report (IFRS)
Consolidated Statement of Profit or Loss
16
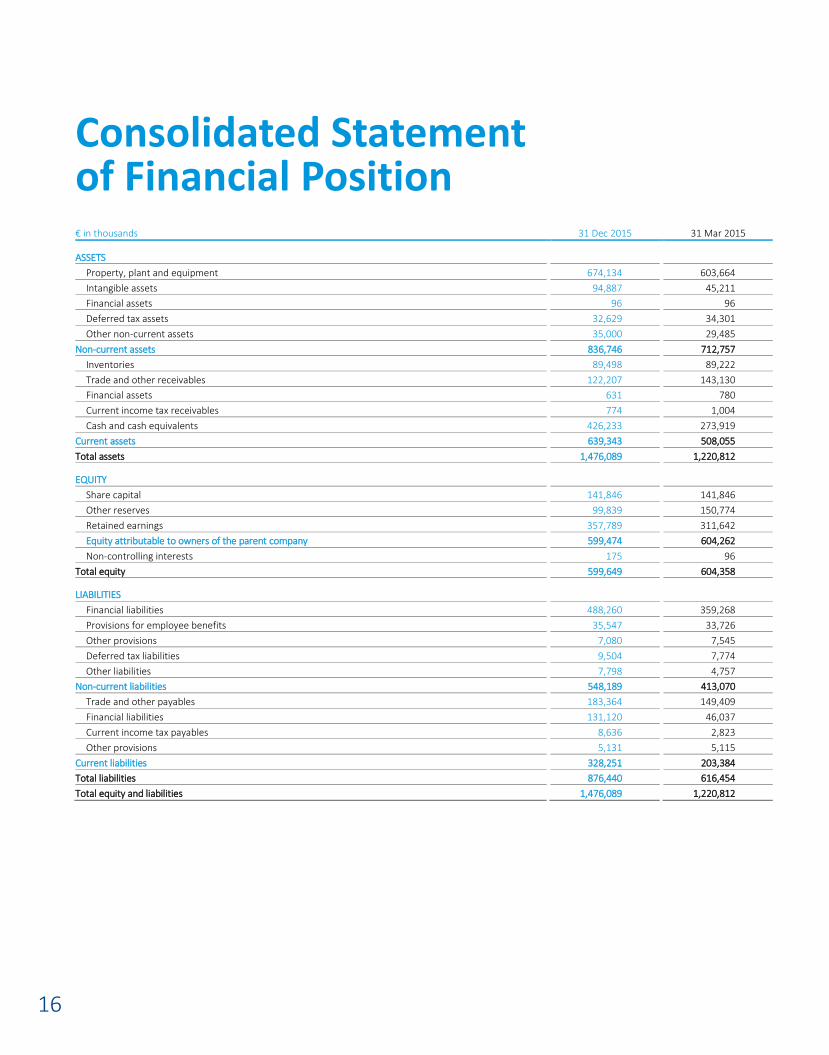
€ in thousands 31 Dec 2015 31 Mar 2015
ASSETS Property, plant and equipment 674,134
603,664
Intangible assets 94,887
45,211
Financial assets 96
96
Deferred tax assets 32,629
34,301
Other non-current assets 35,000
29,485
Non-current assets 836,746
712,757
Inventories 89,498
89,222
Trade and other receivables 122,207
143,130
Financial assets 631
780
Current income tax receivables 774
1,004
Cash and cash equivalents 426,233
273,919
Current assets 639,343
508,055
Total assets 1,476,089
1,220,812
EQUITY
Share capital 141,846
141,846
Other reserves 99,839
150,774
Retained earnings 357,789
311,642
Equity attributable to owners of the parent company 599,474
604,262
Non-controlling interests 175
96
Total equity 599,649
604,358
LIABILITIES
Financial liabilities 488,260
359,268
Provisions for employee benefits 35,547
33,726
Other provisions 7,080
7,545
Deferred tax liabilities 9,504
7,774
Other liabilities 7,798
4,757
Non-current liabilities 548,189
413,070
Trade and other payables 183,364
149,409
Financial liabilities 131,120
46,037
Current income tax payables 8,636
2,823
Other provisions 5,131
5,115
Current liabilities 328,251
203,384
Total liabilities 876,440
616,454
Total equity and liabilities 1,476,089
1,220,812
Consolidated Statement of Financial Position

17
€ in thousands 01 Apr - 31 Dec 2015 01 Apr - 31 Dec 2014
Profit for the period 60,228
50,338
Depreciation, amortisation and impairment of property, plant and equipment and intangible assets 64,159
56,473
Changes in non-current provisions 1,611
(680)
Income taxes 13,182
16,097
Finance costs/income 2,664
4,376
Gains/losses from the sale of fixed assets 279
100
Release of government grants (1,067)
(937)
Other non-cash expense/(income), net (3,215)
3,958
Interest paid (10,151)
(8,639)
Interest and dividends received 2,308
1,628
Income taxes paid (6,575)
(6,934)
Cash flow from operating activities before changes in working capital 123,423
115,780
Inventories (3,811)
(11,629)
Trade and other receivables 10,679
(32,764)
Trade and other payables (542)
24,266
Other provisions 149
(279)
Cash flow from operating activities 129,898
95,374
Capital expenditure for property, plant and equipment and intangible assets (177,022)
(130,597)
Proceeds from the sale of property, plant and equipment and intangible assets 105
165
Capital expenditure for financial assets (221)
(1)
Proceeds from the sale of financial assets 1,471
–
Cash flow from investing activities (175,667)
(130,433)
Proceeds from borrowings 244,148
29,915
Repayments of borrowings (29,746)
(6,349)
Proceeds from government grants 3,701
1,042
Dividends paid (13,986)
(7,770)
Cash flow from financing activities 204,117
16,838
Change in cash and cash equivalents 158,348
(18,221)
Cash and cash equivalents at beginning of the year 273,919
260,133
Exchange gains/(losses) on cash and cash equivalents (6,034)
7,813
Cash and cash equivalents at end of the period 426,233
249,725
Consolidated Statement of Cash Flows
18
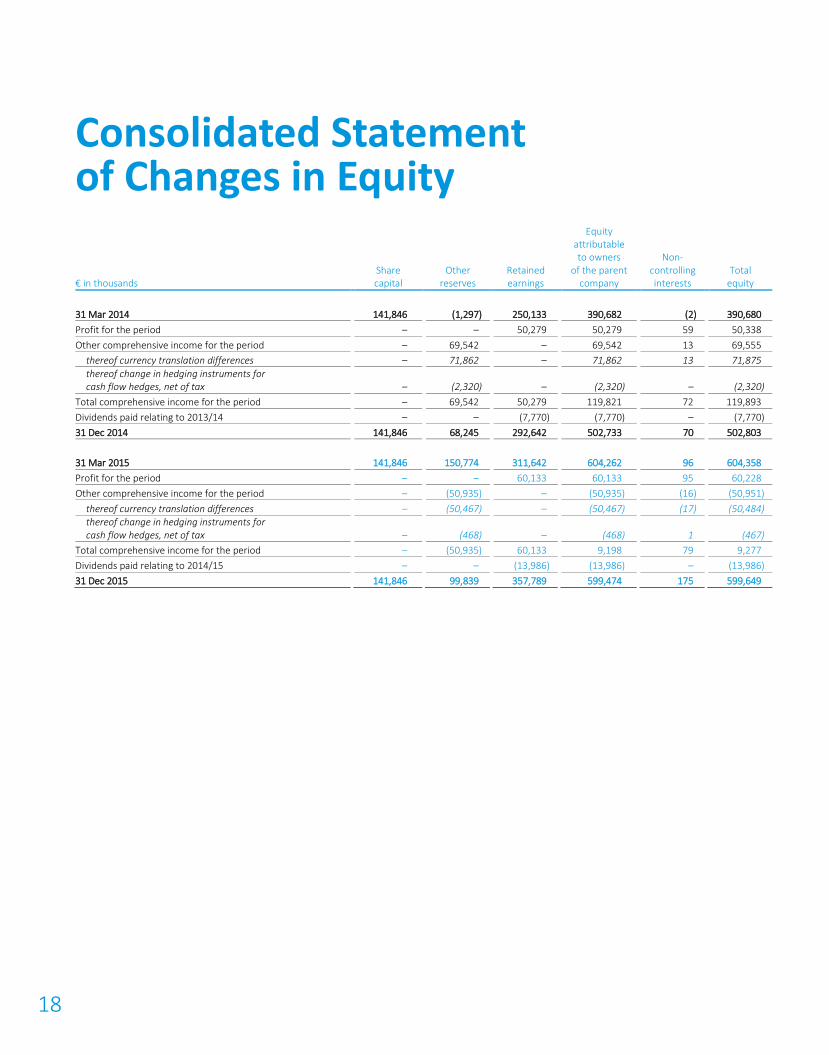
€ in thousands Share capital
Other reserves
Retained earnings
Equity attributable to owners
of the parent company
Non- controlling interests
Total equity
31 Mar 2014 141,846
(1,297)
250,133
390,682
(2)
390,680
Profit for the period –
–
50,279
50,279
59
50,338
Other comprehensive income for the period –
69,542
–
69,542
13
69,555
thereof currency translation differences –
71,862
–
71,862
13
71,875
thereof change in hedging instruments for cash flow hedges, net of tax
–
(2,320)
–
(2,320)
–
(2,320)
Total comprehensive income for the period –
69,542
50,279
119,821
72
119,893
Dividends paid relating to 2013/14 –
–
(7,770)
(7,770)
–
(7,770)
31 Dec 2014 141,846
68,245
292,642
502,733
70
502,803
31 Mar 2015 141,846
150,774
311,642
604,262
96
604,358
Profit for the period –
–
60,133
60,133
95
60,228
Other comprehensive income for the period –
(50,935)
–
(50,935)
(16)
(50,951)
thereof currency translation differences –
(50,467)
–
(50,467)
(17)
(50,484)
thereof change in hedging instruments for cash flow hedges, net of tax
–
(468)
–
(468)
1
(467)
Total comprehensive income for the period –
(50,935)
60,133
9,198
79
9,277
Dividends paid relating to 2014/15 –
–
(13,986)
(13,986)
–
(13,986)
31 Dec 2015 141,846
99,839
357,789
599,474
175
599,649
Consolidated Statement of Changes in Equity

19
01 Apr - 31 Dec 2015
€ in thousands Mobile Devices &
Substrates Automotive,
Industrial, Medical Others Elimination/
Consolidation Group
Segment revenue
419,579 246,744
16,394
(98,384)
584,333
Intersegment revenue
(68,075) (16,785)
(13,524)
98,384
–
Revenue from external customers
351,504 229,959
2,870
–
584,333
Operating result before depreciation/amortisation
109,127 24,916
6,096
94
140,233
Depreciation/amortisation
(55,202) (7,873)
(1,084)
–
(64,159)
Operating result
53,925 17,043
5,012
94
76,074
Finance costs - net
(2,664)
Profit before tax
73,410
Income taxes
(13,182)
Profit for the period
60,228
Property, plant and equipment and intangible assets
677,228
76,105
15,688
–
769,021
Additions to property, plant and equipment and intangible assets
202,090
16,316
5,835
–
224,241
01 Apr - 31 Dec 2014
€ in thousands Mobile Devices &
Substrates Automotive,
Industrial, Medical Others Elimination/
Consolidation Group
Segment revenue
331,012 224,074
7,551
(73,221)
489,416
Intersegment revenue
(53,412) (13,828)
(5,981)
73,221
–
Revenue from external customers
277,600 210,246
1,570
–
489,416
Operating result before depreciation/amortisation
95,870 27,191
4,167
56
127,284
Depreciation/amortisation
(49,179) (6,392)
(902)
–
(56,473)
Operating result
46,691 20,799
3,265
56
70,811
Finance costs - net
(4,376)
Profit before tax
66,435
Income taxes
(16,097)
Profit for the period
50,338
Property, plant and equipment and intangible assets *)
567,909
70,036
10,930
–
648,875
Additions to property, plant and equipment and intangible assets
98,701
21,885
1,752
–
122,338
*) Value as of 31 March 2015
Information by geographic region Revenues broken down by customer region, based on ship-to-region:
01 Apr - 31 Dec
€ in thousands 2015 2014
Austria 15,629
16,771
Germany 98,419
99,066
Other European countries 70,561
61,730
China 286,101
190,631
Other Asian countries 84,822
97,434
Americas 28,801
23,784
Revenue 584,333
489,416
Property, plant and equipment and intangible assets broken down by domicile:
€ in thousands 31 Dec 2015 31 Mar 2015
Austria 60,121
49,019
China 677,188
567,867
Others 31,712
31,989
Property, plant and equipment and intangible assets
769,021
648,875
Segment Reporting

20
GENERAL INFORMATION ACCOUNTING AND MEASUREMENT POLICIES The interim report for the nine months ended 31 December 2015 has been prepared in accordance with the standards (IFRS and IAS) and interpretations (IFRIC and SIC) of the International Accounting Standards Board (IASB), taking IAS 34 into account, as adopted by the European Union.
The interim consolidated financial statements do not include all the information contained in the annual consolidated financial statements and should be read in conjunction with the consolidated annual financial statements for the year ended 31 March 2015.
Due to the increasing importance of the sector medical the business unit Industrial & Automotive has been renamed into Automotive, Industrial, Medical.
The interim consolidated statements ended 31 December 2015 are unaudited and have not been the subject of external audit review.
NOTES TO THE STATEMENT OF PROFIT OR LOSS REVENUE Group revenue in the nine months of the current financial year increased by 19.4% from € 489.4 million in the same period last year up to € 584.3 million.
GROSS PROFIT The actual gross profit of € 128.7 million was considerably higher than the € 117.1 million achieved in the same period last year. This is an increase of 9.9%. This highly satisfactory outcome results from increased group revenue, efficient capacity utilisation and continuous efficency improvement programs.
OPERATING RESULT On the basis of the improved gross profit and higher start-up costs for new plant in Chongqing, AT&S was able to improve its consolidated operating result also to € 76.1 million or 13.0% of revenue.
FINANCE COSTS - NET The finance costs of € 8.8 million were under the last year level. The financial income from investment of free cash and gains from foreign exchange were € 6.2 million. As a consequence the net finance costs of € -2.7 million decreased by € 1.7 million in comparison to the same period last year. In the net finance costs € 4.7 million (previous year: € 2.1 million) gains for capitalised interest are included. Net interest expense on personnel-related liabilities amounted € 0.5 million is presented in the “finance costs – net”. Last year’s figures have not been restated due to insignificance
INCOME TAXES The change of the effective tax rate on consolidated level compared with the same period last year is mainly resulting from the reapplied reduced tax rate of 15% for AT&S (China) Company Limited, compared to the general tax rate of 25% in the first nine months of the previous year, as well as the variation of proportions of Group earnings contributed by individual companies with different tax rates.
NOTES TO THE STATEMENT OF COMPREHENSIVE INCOME CURRENCY TRANSLATION DIFFERENCES The decrease in the foreign currency translation reserve in the current financial year (€ -50.5 million) was the result of the changes in exchange rates of the Group’s functional currencies, the Chinese renminbi, the Hong Kong dollar, the US dollar, the Indian rupee and the South Korean won against the Group reporting currency, the euro.
Notes to the Interim Financial Report

21
Closing rate
Average rate
31 Dec 2015 31 Mar 2015 Change in % 01 Apr -
31 Dec 2015 01 Apr -
31 Dec 2014 Change in %
Chinese yuan renminbi 7.0728
6.6572
6.2%
6.8883
8.1243
(15.2%)
Hong Kong dollar 8.4426
8.3285
1.4%
8.5225
10.1840
(16.3%)
Indian rupee 72.0666
67.2055
7.2%
71.2456
79.9364
(10.9%)
Japanese yen 131.1200
128.7780
1.8%
133.5638
140.7600
(5.1%)
South Korean won 1,281.4865
1,191.6030
7.5%
1,255.9165
1,377.9306
(8.9%)
US dollar 1.0892
1.0740
1.4%
1.0997
1.3133
(16.3%)
Taiwan dollar 35.8196
33.6151
6.6%
35.0324
39.8909
(12.2%)
NOTES TO THE STATEMENT OF FINANCIAL POSITION ASSETS AND FINANCES Net debt of € 192.4 million increased versus the € 130.5 million outstanding at 31 March 2015. The increase was caused by investments in the new facility in Chongqing as well as technolo-gy upgrades in the other plants and paid dividends. Net working capital of € 95.3 million as at 31 March 2015 decreased to € 81.3 million mainly due to decreased receivables. The net gearing ratio was with 32.1% above the 21.6% at 31 March 2015.
VALUATION HIERARCHIES FOR FINANCIAL INSTRUMENTS MEASURED AT FAIR VALUE Three valuation hierarchies have to be distinguished in the valuation of financial instruments measured at fair value. Level 1: fair values are determined on the basis of publicly quoted prices in active markets for identical
financial instruments. Level 2: if no publicly quoted prices in active markets exist, then fair values are determined on the basis of
valuation methods based to the greatest possible extent on market prices. Level 3: in this case, the models used to determine fair value are based on inputs not observable in the
market.
The financial instruments valued at fair value at the end of the reporting period at the three valuation levels were as follows:
€ in thousands 31 Dec 2015 Level 1 Level 2 Level 3 Total
Financial assets
Financial assets at fair value through profit or loss:
- Bonds 631
–
–
631
Available-for-sale financial assets –
96
–
96
Financial liabilities
Derivative financial instruments –
3,420
–
3,420
€ in thousands 31 Mar 2015 Level 1 Level 2 Level 3 Total
Financial assets
Financial assets at fair value through profit or loss:
- Bonds 780
–
–
780
Available-for-sale financial assets –
96
–
96
Financial liabilities
Derivative financial instruments –
3,777
–
3,777

22
Bonds, export loans, government loans and other bank borrowings amounting to € 616.0 million (31 March 2015: € 401.5 million) are measured at amortised cost. The fair value of these liabilities was € 626.6 million (31 March 2015: € 408.3 million).
OTHER FINANCIAL COMMITMENTS At 31 December 2015 the Group had other financial commit-ments amounting to € 111.3 million, in connection with contractually binding investment commitments, the greater part of which related to the continuing construction of the new site in Chongqing and investments in the Shanghai and Leoben plants. As at 31 March 2015 other financial commitments stood at € 32.9 million.
EQUITY Consolidated equity decreased from € 604.4 million at 31 March 2015 to € 599.6 million. The high consolidated profit for the period of € 60.2 million, confronted with a negative change for hedging instru-ments of € -0.5 million and negative impacts from currency translation differences of € -50.5 million, contrib-uted to the consolidated total comprehensive income of € 9.3 million.
In the 20th Annual General Meeting on 3 July 2014 the Management Board was authorised until 2 July 2019 to increase the share capital of the Company, subject to the approval of the Supervisory Board, by up to € 21,367,500 by way of issuing up to 19,425,000 no-par value bearer shares, for contributions in cash or kind, in one or more tranches, including issue by means of an indirect share offering via banks in accordance with section 153 para 6 Austrian Companies Act (AktG). The Management Board was authorised, subject to the approval of the Supervisory Board, to determine the detailed terms and conditions of issue (in particular, issue price, nature of contributions in kind, rights attaching to shares, exclusion of subscription rights, etc.) (approved capital). The Supervisory Board was authorised to approve changes in the Articles of Association required by the issue of shares out of authorised capital. The Annual General Meeting approved a resolution amending Section 4 (Nominal Capital) of the Articles of Association to reflect this change.
In addition, in the 20th Annual General Meeting of 3 July 2014 the resolution of the Annual General Meeting of 7 July 2010 authorising the issue of convertible loan stock was rescinded and at the same time the Man-agement Board was authorised until 2 July 2019, and with the approval of the Supervisory Board, to issue up to a maximum nominal value of € 150,000,000 of bearer convertible loan stock in one or more tranches, and to grant the holders of the loan stock subscription and/or conversion rights for up to 19,425,000 new no-par value bearer shares in the Company in accordance with the terms and conditions of the convertible loan stock to be determined by the Management Board. For this purpose, in accordance with section 159 para 2 item 1 AktG, the share capital of the Company was also conditionally increased by up to € 21,367,500 in the form of up to 19,425,000 new no-par value bearer shares. This capital increase will only take place to the extent that holders of convertible loan stock exercise their conversion or subscription rights in accordance with the resolution of the Annual General Meeting of 3 July 2014. The Management Board was also author-ised, subject to the approval of the Supervisory Board, to determine further details of the conditional capital increase (in particular, the amount of the issue and the rights attaching to shares).
With respect to the authorised share capital increase and/or the conditional capital increase, the following restrictions on the amounts of the increases are to be observed, as required under the resolutions of the Annual General Meeting of 3 July 2014: The total of (i) the number of new shares actually issued or potential-ly issuable out of conditional capital under the terms and conditions of the convertible bonds, and (ii) the number of shares issued out of authorised capital may not exceed 19,425,000.
TREASURY SHARES In the 21st Annual General Meeting of 9 July 2015 the Management Board was again authorised for a period of 30 months from the date of the resolution to acquire and retire the Company’s own shares up to a maximum amount of 10% of the share capital. The Management Board was also again authorised – for a period of five years (i.e., until 8 July 2020), upon approval of the Supervisory Board – to sell treasury shares otherwise than through the stock exchange or by means of public offerings, and in particular

23
for the purpose of enabling the exercise of employee stock options or the conversion of convertible bonds, or as consideration for the acquisition of businesses or other assets, or for any other legally permissible purpose.
On 31 December 2015, the Group held no treasury shares.
NOTES TO THE STATEMENT OF CASH FLOWS The cash flow from operating activities amount-ed to € 129.9 million compared with € 95.4 million in the same period last year. The increase is mainly due to the increase in the profit of the period and the decreased net working capital.
The cash flow from investing activities of € -175.7 million is above the level of € -130.4 million reached in the same period last year. This year’s capital expenditures are predominantly in the new factory in Chongqing as well as technology upgrades in the other plants.
The cash flow from financing activities amounted to € 204.1 million and is mainly attributable to the obtain-ing of promissory note with an amount of € 221.0 million loan in October 2015.
OTHER INFORMATION DIVIDENDS The Annual General Meeting of 9 July 2015 resolved on a dividend payment of € 0.36 per share out of retained earnings as at 31 March 2015. The dividend distribution of € 14.0 million took place on 30 July 2015.
RELATED PARTY TRANSACTIONS In connection with various projects, the Group received consulting services from companies where Supervisory Board chairman Mr. Androsch (AIC Androsch International Man-agement Consulting GmbH) and Supervisory Board deputy chairman Mr. Dörflinger (Dörflinger Management & Beteiligungs GmbH) are managing directors with the power of sole representation. The Group also received in previous year legal advice from Frotz Riedl Rechtsanwälte, where Supervisory Board member Mr. Riedl works as an independent lawyer. The fees charged are as follows:
€ in thousands 01 Apr - 31 Dec 2015 01 Apr - 31 Dec 2014
AIC Androsch International Management Consulting GmbH 304
289
Dörflinger Management & Beteiligungs GmbH 4
6
Frotz Riedl Rechtsanwälte –
3
Total fees 308
298
At the balance sheet date, there are no outstanding balances or obligations to the above mentioned legal and consulting companies.
Leoben-Hinterberg, 27 January 2016
Management Board
Andreas Gerstenmayer m.p. Karl Asamer m.p. Heinz Moitzi m.p.

24
We confirm to the best of our knowledge that the interim financial statements give a true and fair view of the assets, liabilities, financial position and profit or loss of the group as required by the applicable accounting standards and that the group interim management report gives a true and fair view of important events that have occurred during the first nine months of the financial year and their impact on the interim financial statements, of the principal risks and uncertainties for the remaining three months of the financial year and of the major related party transactions to be disclosed.
Leoben-Hinterberg, 27 January 2016
The Management Board
Andreas Gerstenmayer m.p. Chief Executive Officer
Karl Asamer m.p. Chief Financial Officer
Heinz Moitzi m.p. Chief Operations Officer
Statement of all Legal Representatives
25
CONTACT AT & S Austria Technologie & Systemtechnik Aktiengesellschaft Fabriksgasse 13 A-8700 Leoben Austria Tel: +43 (0) 3842 200-0 www.ats.net
INVESTOR RELATIONS & COMMUNICATIONS Elke Koch Phone +43 (0) 3842 200-5925 [email protected]
PUBLISHED BY AND RESPONSIBLE FOR CONTENT AT & S Austria Technologie & Systemtechnik Aktiengesellschaft Fabriksgasse 13 A-8700 Leoben Austria www.ats.net
PHOTOS Klaus Vyhnalek Fotografie, Vienna Werbeagentur DMP, Maria Enzersdorf DISCLAIMER This report contains forward-looking statements which were made on the basis of the information available at the time of publication. These can be identified by the use of such expressions as “expects”, “plans”, “an-ticipates”, “intends”, “could”, “will”, “aim” and “estimation” or other similar words. These statements are based on current expectations and assumptions. Such statements are by their very nature subject to known and unknown risks and uncertainties. As a result, actual developments may vary significantly from the for-ward-looking statements made in this report. Recipients of this report are expressly cautioned not to place undue reliance on such statements. Neither AT&S nor any other entity accept any responsibility for the cor-rectness and completeness of the forward-looking statements contained in this report. AT&S undertakes no obligation to update or revise any forward-looking statements, whether as a result of changed assumptions or expectations, new information or future events.
Percentages and individual items presented in this report are rounded which may result in rounding differences.
Formulations attributable to people are to be understood as gender-neutral.
This report in no way represents an invitation or recommendation to buy or sell shares in AT&S.
The report is published in German and English. In case of doubt, the German version is binding.
No responsibility accepted for errors or omissions.
Contact/Publication details

26
Recommended