1
Atmospheric viral load is crucial to understanding
transmission of airborne respiratory viruses, including SARS
CoV-2, and levels of infections & deaths including COVID-19
Neil Catto FRMetS
Copyright Weather Research Ltd © 2021

2
Abstract:
Airborne respiratory viruses have occurred throughout history; the deadliest to humans being
the Spanish flu of 1918-19 with 40-55 million deaths. All airborne respiratory virus outbreaks,
including SARS CoV-2, are seasonal. Ultraviolet (UVB) is a prolific killer of airborne viruses.
In winter, low levels of sunshine, and shorter length of day (LOD) reduces levels of UVA/B.
Low temperatures restrict vertical lift. Increased cloud cover and higher humidity, trap virus
particles (virions) in the lower atmosphere, thereby increasing the viral load. Increased viral
load significantly increases the risk of infection and the possibility of death.
Conversely, in summer, greater levels of sunshine/LOD, increase UVA/B radiation, lowers
humidity, and increases temperatures in the atmosphere. Virions are then raised vertically by
thermal convection to levels where they are irradiated by UVB, lowering the viral load nearer
the surface. Lower viral load in the lower atmosphere significantly reduces risk of infection
and deaths. When the viral load is low, the few virions in circulation, if inhaled by a human,
will cause mild infection, often asymptomatic, with an extremely low risk of death.
In all previous airborne respiratory seasons up to SARS CoV-2 virus/COVID-19 disease, there
were no lockdowns, or social distancing, or group control, or compulsory facemask wearing,
and natural herd immunity was allowed to develop. During these times, the human innate
immune system uses antibodies, B-cells to identify the virus and killer T-cells to eliminate
the virions and thus gains herd immunity. Lockdown, social distancing, group control and
wearing facemasks prevent herd immunity from occurring. These actions caused 64,000
excess deaths.

3
A Summary of Airborne Respiratory Viruses
including SARS CoV-2 virus and COVID-19 disease
1. What are SARS CoV-2 and COVID-19
2. History of airborne respiratory viruses (ARV)
3. Patterns in nature and UV radiation
4. The Diamond Princess and Sweden “petri-dish” examples
5. NHS Hospitals unfortunate transmissions and mistakes
6. Nightingale Hospitals
7. Cov-2/COVID-19 Progression and Benchmarks
8. PCR testing and R0 rate
9. Lockdowns, social distancing, group control & facemasks
10. A need for accurate data
11. Excess deaths
12. Vaccines did not “turn the curve”
Considerations
Conclusions
4
1. What are SARS CoV-2 and COVID-19?
Severe Acute Respiratory Syndrome (SARS) CoV-2 is the name of the current seasonal
airborne respiratory virus, COVID-19 is the name of the respiratory disease acquired from
actions of the virus. SARS CoV-2 is a coronavirus, part of a family of viruses which cause
respiratory illness in humans and animals. There are seven known coronaviruses which affect
humans. Severe acute respiratory syndrome (SARS); SARS CoV; MERS-CoV; Middle East
respiratory syndrome (MERS); HCoV-NL63; HCoV-229E; HCoV-OC43; HKU1; SARS CoV-2.
Coronaviruses also include influenza and the common cold, although the common cold may
often be a rhinovirus. All the following viruses are airborne and use the atmosphere for
transportation, both laterally and vertically.
Symptoms of COVID-19 are, a hacking cough, high temperature with profuse sweating,
interspersed with uncontrollable shivering. This is followed by upper respiratory infection
then lower respiratory infection, and in worst cases pneumonia and death. This viral attack
often leads to respiratory bacterial infection, with lack of breath, which can be treated by
antibiotics. There have been reported occasions with some people having a loss of smell
and/or taste. Seasonal airborne viruses mostly affect the elderly, often with comorbidities.
The effects of COVID-19 can be shown by X-rays and/or CT scans and are sometimes confused
with signs of lung cancer. Virus particles (virions) are inhaled through the nose and/or mouth,
enter the respiratory tract and bind to cells via ACE2 receptor cells. Type I pneumocytes
facilitate gas exchange and Type II pneumocytes secrete surfactants. In a moderate infection
Pneumonia (IB) the virus damages cells linings in the alveoli, inflammation causes fluids to
collect in and around the alveoli, impairing transfer of oxygen. A severe infection causes

5
critical damage to alveoli (IC). In this case fluid and mucous collect in the air sacs, which can
also cause blood clots.
Also in severe cases, other organs, apart from the lungs, can be infected by collateral damage
of the immune system which may cause kidney failure and potentially affect the liver, heart,
and brain.
As these airborne viruses lack the necessary machinery to self-replicate, they need a host’s
cells for replication. SARS CoV-2 is an airborne respiratory virus (ARV) with a size of ~0.1μm.
A billion SARS CoV-2 virus particles (virions) can fit on a pinhead. Collected into a single ball,
the viral material from all the confirmed COVID-19 cases in the world, would weigh less than
2g and occupy the volume of a large pea.
6
2. History of airborne respiratory viruses (ARV)
In terms of the number of deaths deemed as pandemics the following are in order of highest
to lowest deaths:
200m Black Death (Bubonic Plague) 1347-1351
56m Smallpox 1520
40-50m Spanish Flu 1918-1919
30-50m Plague of Justinian 541-542
25-35m HIV/AIDS 1981-present
12m The Third Plague 1855
5m Antonine Plague 165-180
4.28m SARS CoV-2 2019-ongoing
3m 17th Century Great Plagues 1600
1.1m Asian Flu 1957-1958
1m Russian Flu 1889-1890
1m Hong Kong Flu 1968-1970
1m Cholera 6 1817-1923
1m Japanese Smallpox 735-737
600k 18th Century Great Plagues 1700
200k Swine Flu 2009-2010
100-150k Yellow Fever Late 1800s
11.3k Ebola 2014-2016
866 MERS 2012-present
774 SARS 2002-2003
(Bold indicates - Airborne Respiratory Viruses)
Considering population sizes for the years indicated, Spanish Flu was by far the biggest
airborne killer virus dwarfing the latest airborne CoV-2 virus/COVID-19 disease. The
advancement of medical knowledge, technology, information, and drug development has
also greatly increased with the passing of time, significantly reducing deaths.
7
Learning from history:
Research of how past outbreaks of airborne respiratory viruses behaved is critical to
understanding how current and future airborne respiratory viruses will react. The following is
a history of respiratory deaths in England & Wales, from the second half of 2009/10 season
and full 2010/11 – 2019/20 seasons, before the current SARS CoV-2/COVID-19 outbreaks.
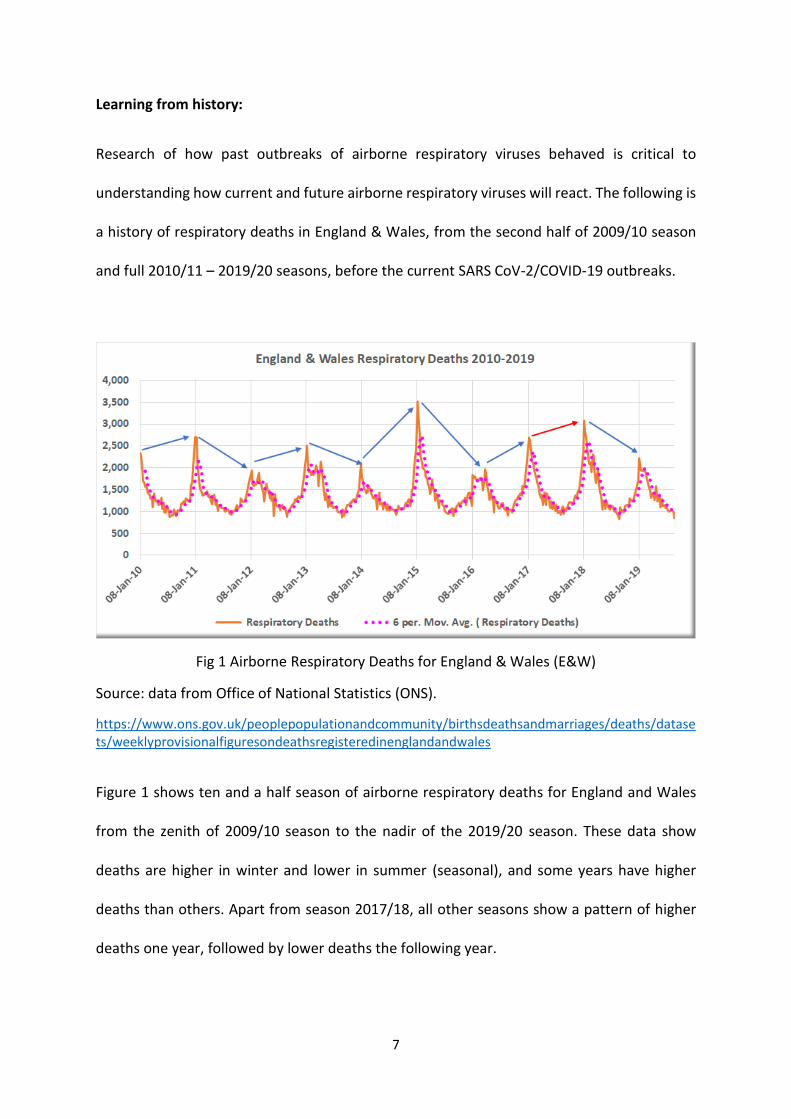
Fig 1 Airborne Respiratory Deaths for England & Wales (E&W)
Source: data from Office of National Statistics (ONS).
https://www.ons.gov.uk/peoplepopulationandcommunity/birthsdeathsandmarriages/deaths/datasets/weeklyprovisionalfiguresondeathsregisteredinenglandandwales
Figure 1 shows ten and a half season of airborne respiratory deaths for England and Wales
from the zenith of 2009/10 season to the nadir of the 2019/20 season. These data show
deaths are higher in winter and lower in summer (seasonal), and some years have higher
deaths than others. Apart from season 2017/18, all other seasons show a pattern of higher
deaths one year, followed by lower deaths the following year.
8
There is only one Gompertz curve per season. To appreciate this natural pattern, there needs
to be a good knowledge of how weather, particularly sunshine (UV), temperature, humidity
and wind affects airborne viruses.
The zenith of deaths is usually around the first two weeks of January and the nadir of deaths
occurs around the end of August/beginning of September as shown in figure 6.
9
3. Patterns in nature and UV radiation
There are multitudes of patterns which occur in nature, some of which are not always obvious
such as geological formations of rivers and the growth of trees. These patterns are known as
fractals; a form of geometry discovered by Benoit Mandelbrot.
The one thing which is common in nature, is the weather; it has always existed since the
formation of Earth. Airborne respiratory viruses are seasonal. Seasonality is caused by
changes in weather instigated by the position of Earth to the Sun. It is important to
understand this effect.
Airborne respiratory virus deaths also have a distinct pattern, the Gompertz curve, which has
occurred every year throughout history as seen in figure 1.
Most airborne viruses are exceedingly small in size and weight, SARS CoV-2 is <0.1μm. As such
they can travel within the atmosphere over long distances, particularly if they rise to high
levels in the atmosphere, as it is possible for them to become caught in the Jet streams which
can travel around the globe at speeds in excess of 200mph. However, at those heights, most
of the virus particles are likely to have been irradiated by UVB radiation.
There are three levels of UV radiation, UVA (315-400nm), UVB (280-315nm) and UVC 100-
280nm). UVA reaches the surface of Earth, UVB can reach the surface under certain
conditions, e. g. when the sun is close to overhead during summer on clear days but is
generally found higher in the atmosphere but below the tropopause. UVC almost never enters
the troposphere as it very rarely penetrates the ozone layer. In terms of how each of these
different wavelengths of radiation have the ability to kill airborne viruses UVC is the deadliest,
However, UVB irradiates airborne viruses, and UVA has little ability to destroy viruses.
10
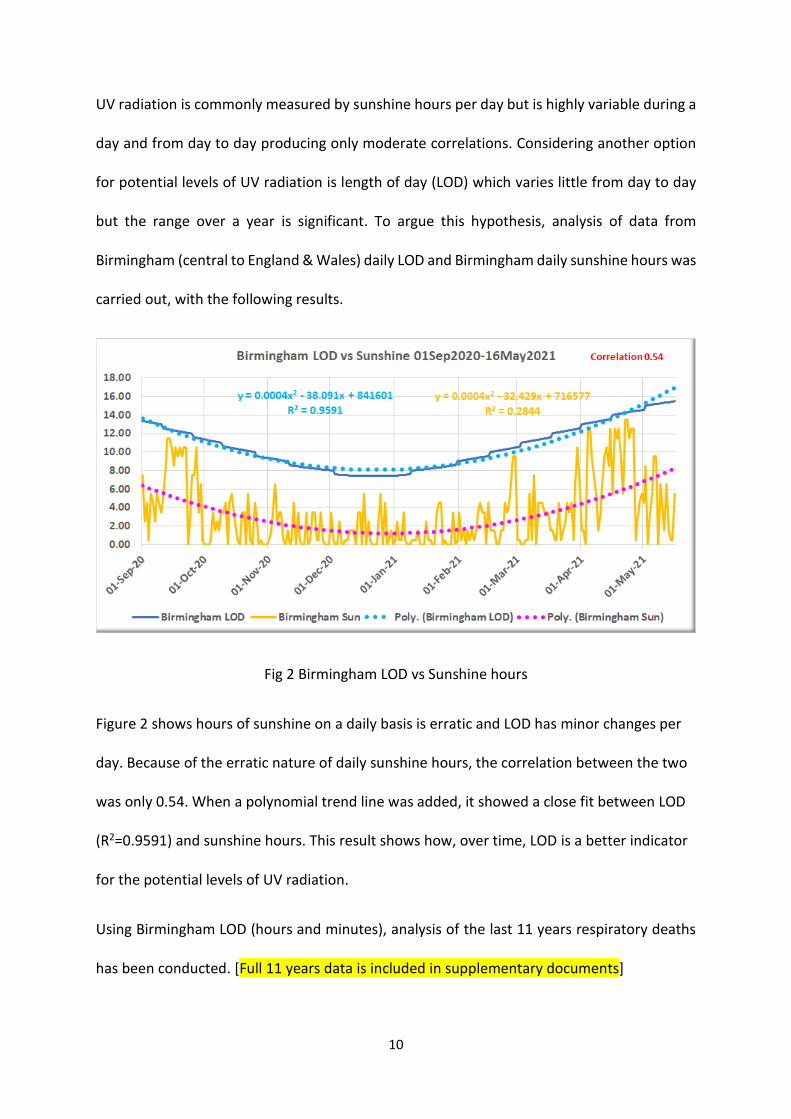
UV radiation is commonly measured by sunshine hours per day but is highly variable during a
day and from day to day producing only moderate correlations. Considering another option
for potential levels of UV radiation is length of day (LOD) which varies little from day to day
but the range over a year is significant. To argue this hypothesis, analysis of data from
Birmingham (central to England & Wales) daily LOD and Birmingham daily sunshine hours was
carried out, with the following results.
Fig 2 Birmingham LOD vs Sunshine hours
Figure 2 shows hours of sunshine on a daily basis is erratic and LOD has minor changes per
day. Because of the erratic nature of daily sunshine hours, the correlation between the two
was only 0.54. When a polynomial trend line was added, it showed a close fit between LOD
(R2=0.9591) and sunshine hours. This result shows how, over time, LOD is a better indicator
for the potential levels of UV radiation.
Using Birmingham LOD (hours and minutes), analysis of the last 11 years respiratory deaths
has been conducted. [Full 11 years data is included in supplementary documents]
11
This exercise showed similar patterns for each of the last 11 years for airborne respiratory
deaths a single Gompertz curve each year.
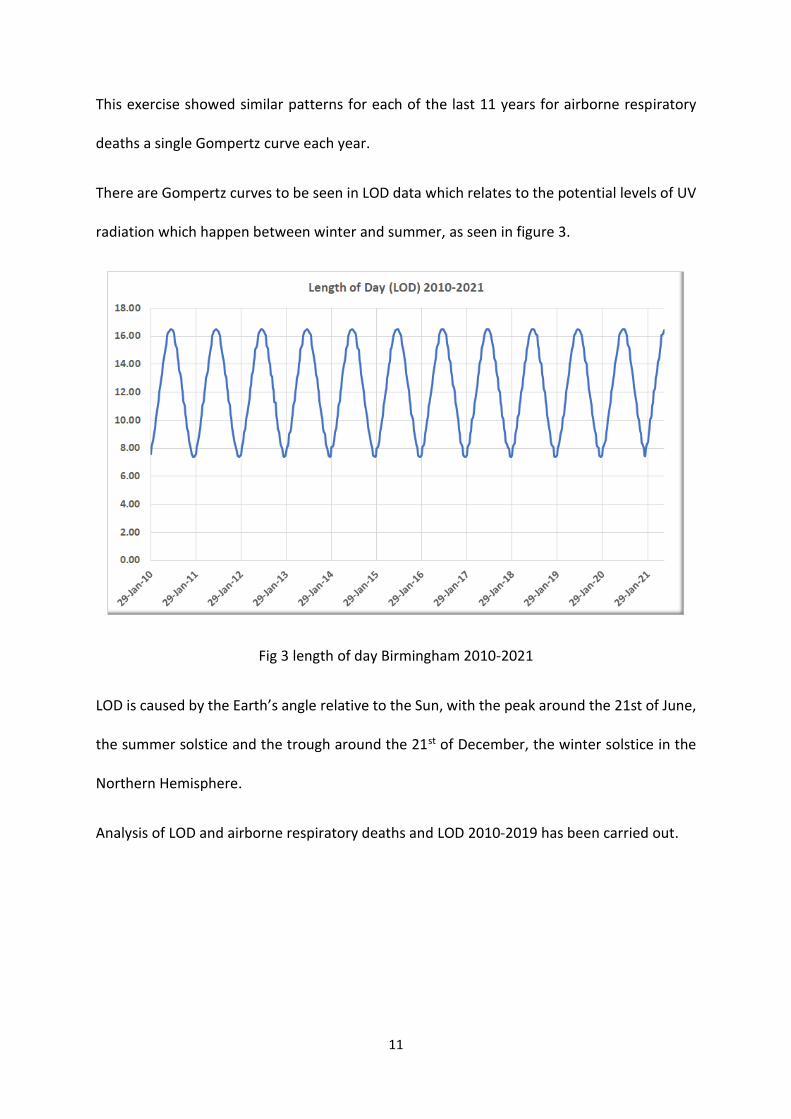
There are Gompertz curves to be seen in LOD data which relates to the potential levels of UV
radiation which happen between winter and summer, as seen in figure 3.
Fig 3 length of day Birmingham 2010-2021
LOD is caused by the Earth’s angle relative to the Sun, with the peak around the 21st of June,
the summer solstice and the trough around the 21st of December, the winter solstice in the
Northern Hemisphere.
Analysis of LOD and airborne respiratory deaths and LOD 2010-2019 has been carried out.

12
Fig 4 England & Wales respiratory deaths vs Birmingham LOD 2010-2019
With a correlation of -0.84 there is a strong to extremely strong negative relationship between
respiratory deaths and length of day. This provide strong evidence of the relationship
between respiratory deaths and UV radiation. This is further explained in the following image,
figure 5.
13
Fig 5 viral load in the atmosphere winter and summer
During winter there is less light (shorter days, less sunshine (UV radiation), higher humidity
(more cloud), lower temperatures, lower pressure, and higher wind speeds. The left side of
figure 5 shows how virions during winter are trapped in the lower atmosphere, closer to
humans. With more virions to breathe in, more infection occurs. Once these virus particles
have been inhaled, they multiply in the respiratory system, and are exhaled adding to the viral
load in the lower atmosphere. This can be explained by considering small levels of thermal
convection in winter, providing the strong negative correlation with temperature -0.74. This
means the virions remain in the lower atmosphere due to insignificant vertical movement,
which increases the viral load.
With higher wind speeds in winter, the viral load can be moved laterally, blown in the
direction of the wind, and provide greater transmission spread. Higher viral load is prime time
for more serious respiratory infection and higher deaths to occur. The zeniths of seasonal
airborne virus outbreaks are strongly aligned to the nadir of LOD.
14
On the right of figure 5, with higher levels of sunshine (increased UVA/B radiation), longer
daylight, drier air and higher temperatures, the virus particles can rise, due to thermal
convection, to high levels in the atmosphere, out of reach of humans on the surface. The
higher the virions rise the more they are exposed to UVB radiation which irradiates the virus
particles by breaking down their mRNA. This leads to significantly reduced viral load near the
surface. This is the most effective time to gain natural herd immunity. Because there are
fewer virions in the lower atmosphere at this time of year, if a few particles are inhaled the
consequences are, at worst a mild infection often without displaying symptoms. There are
simply not enough virions in the lower atmosphere to cause serious illness.
Periodic rises in deaths during summer can be explained by more cloud, higher humidity,
slightly lower temperatures, and lower levels of UV radiation, similar to the winter effect but
still with some vertical movement of virions and trapping others.
15
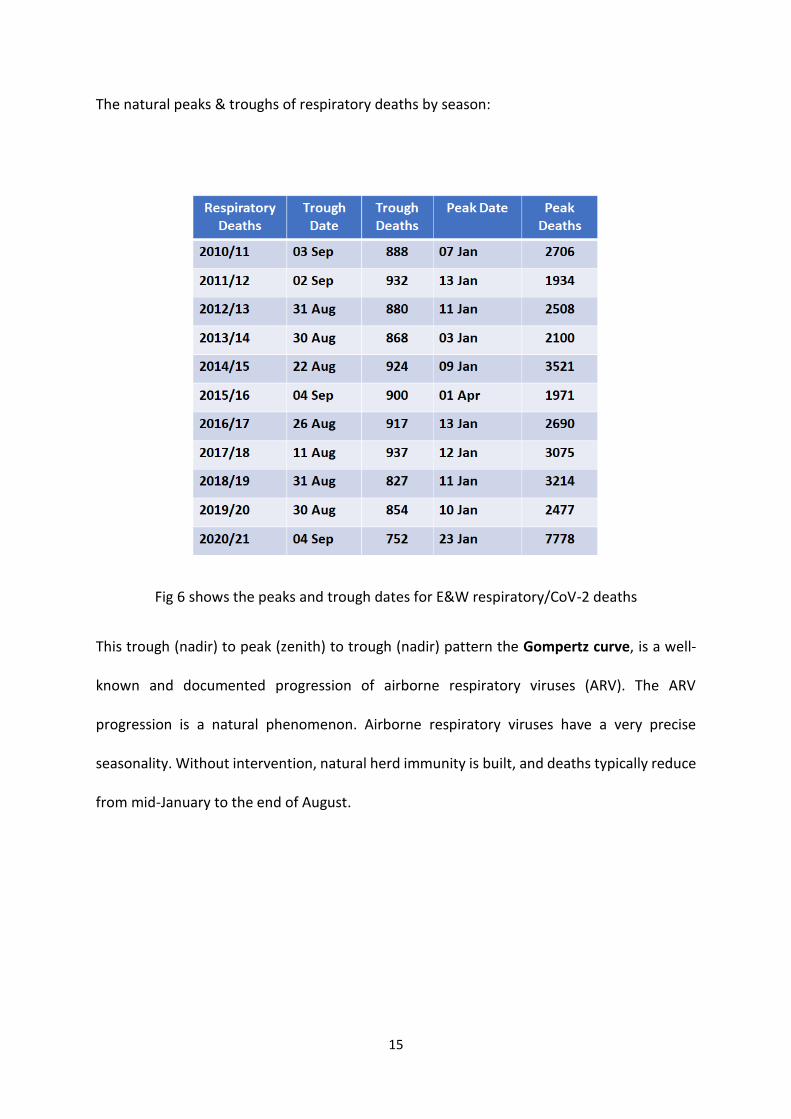
The natural peaks & troughs of respiratory deaths by season:
Fig 6 shows the peaks and trough dates for E&W respiratory/CoV-2 deaths
This trough (nadir) to peak (zenith) to trough (nadir) pattern the Gompertz curve, is a well-
known and documented progression of airborne respiratory viruses (ARV). The ARV
progression is a natural phenomenon. Airborne respiratory viruses have a very precise
seasonality. Without intervention, natural herd immunity is built, and deaths typically reduce
from mid-January to the end of August.
16
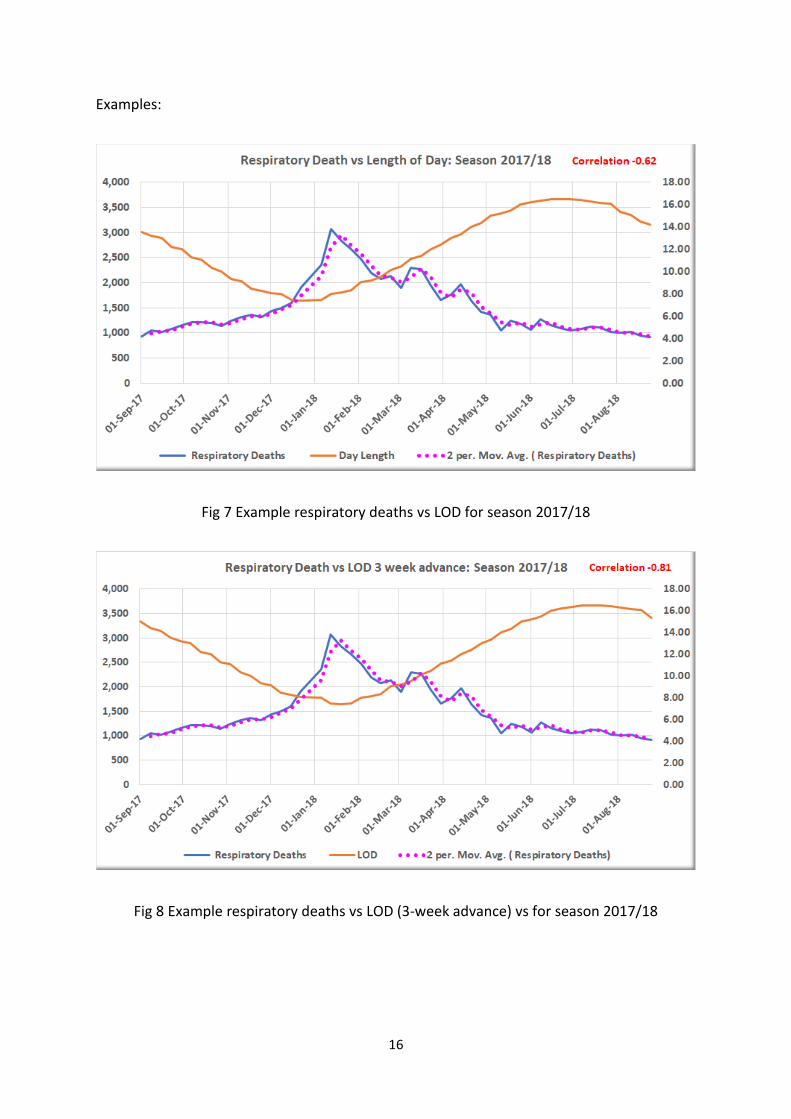
Examples:
Fig 7 Example respiratory deaths vs LOD for season 2017/18
Fig 8 Example respiratory deaths vs LOD (3-week advance) vs for season 2017/18
17
Noticeable for every previous season, is a lag of approximately three-weeks (18days) between
minimum LOD and peak deaths, as shown in figures 7 & 8 and 9 & 10. This is another natural
pattern. [Data for each season 2010/11 – 2020/21 are located in supplementary information].
Advancing the LOD for season 2017/18 by three weeks shows the correlation increase from
-0.62 (moderate/strong relationship) to -0.81 (strong/extremely strong relationship). This
approximately 18-day difference can be explained as the time from inhaling the virus, through
the infection stages, upper and then lower respiratory disease, and in severe cases the chance
of death.
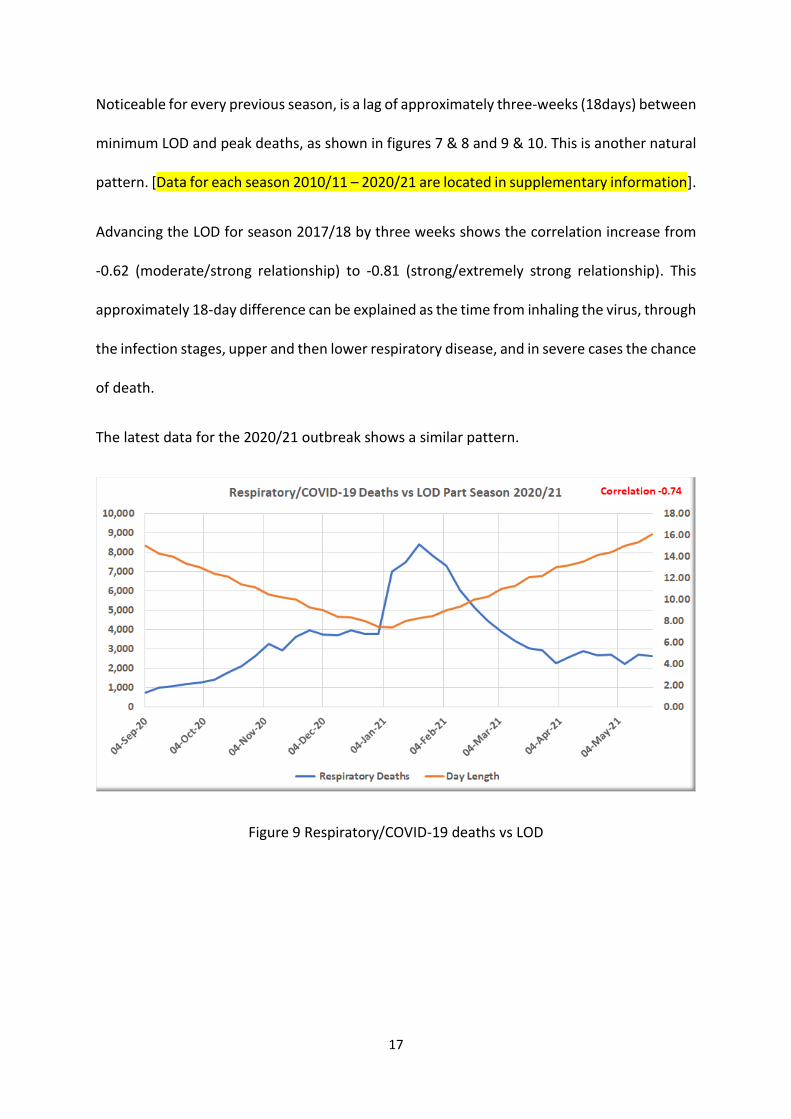
The latest data for the 2020/21 outbreak shows a similar pattern.
Figure 9 Respiratory/COVID-19 deaths vs LOD
18
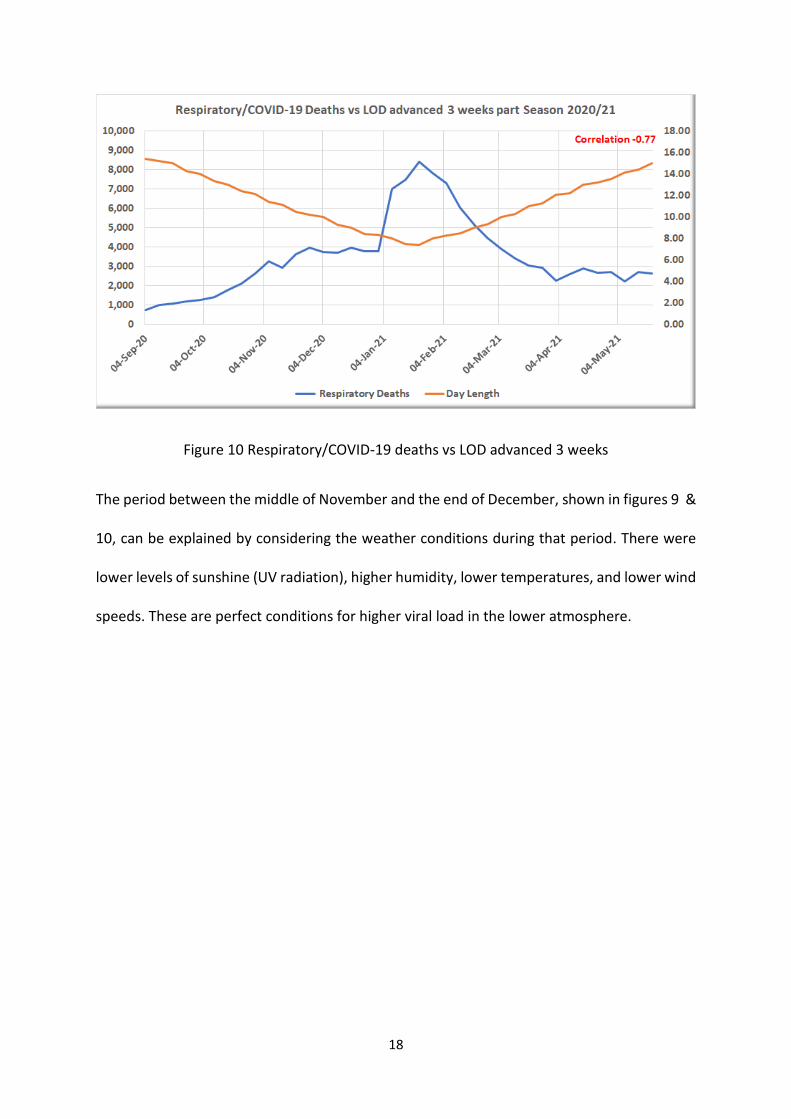
Figure 10 Respiratory/COVID-19 deaths vs LOD advanced 3 weeks
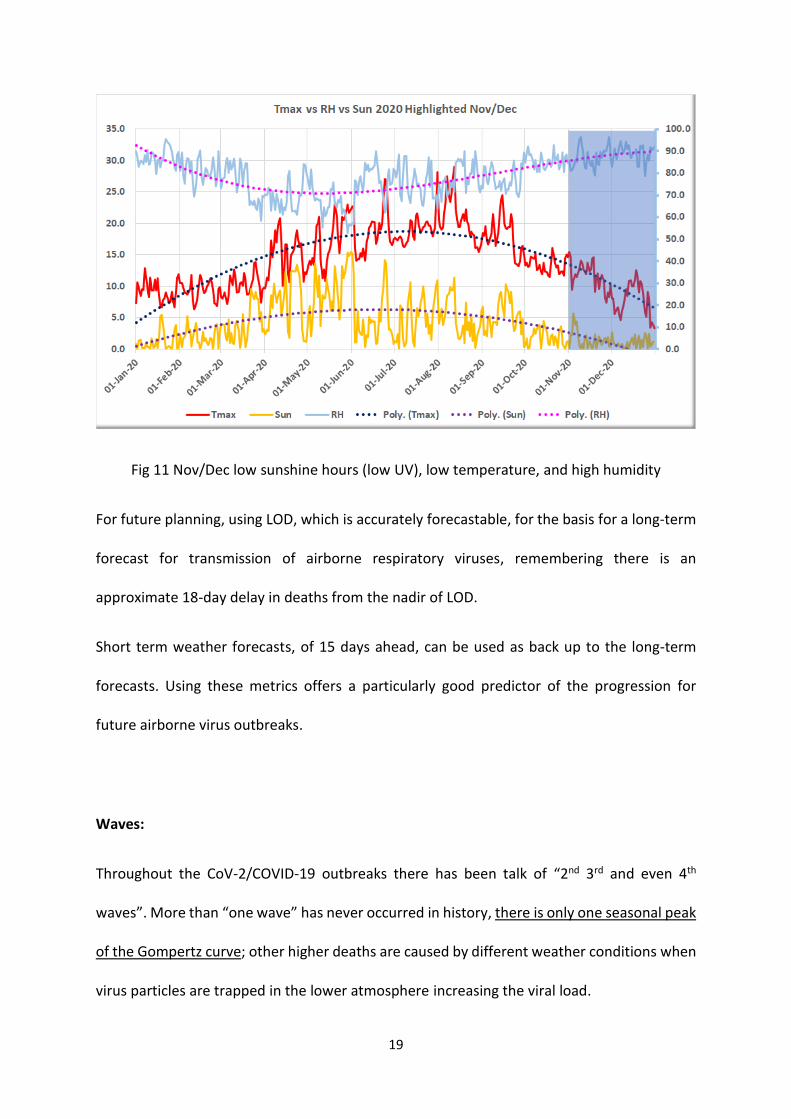
The period between the middle of November and the end of December, shown in figures 9 &
10, can be explained by considering the weather conditions during that period. There were
lower levels of sunshine (UV radiation), higher humidity, lower temperatures, and lower wind
speeds. These are perfect conditions for higher viral load in the lower atmosphere.
19
Fig 11 Nov/Dec low sunshine hours (low UV), low temperature, and high humidity
For future planning, using LOD, which is accurately forecastable, for the basis for a long-term
forecast for transmission of airborne respiratory viruses, remembering there is an
approximate 18-day delay in deaths from the nadir of LOD.
Short term weather forecasts, of 15 days ahead, can be used as back up to the long-term
forecasts. Using these metrics offers a particularly good predictor of the progression for
future airborne virus outbreaks.
Waves:
Throughout the CoV-2/COVID-19 outbreaks there has been talk of “2nd 3rd and even 4th
waves”. More than “one wave” has never occurred in history, there is only one seasonal peak
of the Gompertz curve; other higher deaths are caused by different weather conditions when
virus particles are trapped in the lower atmosphere increasing the viral load.
20
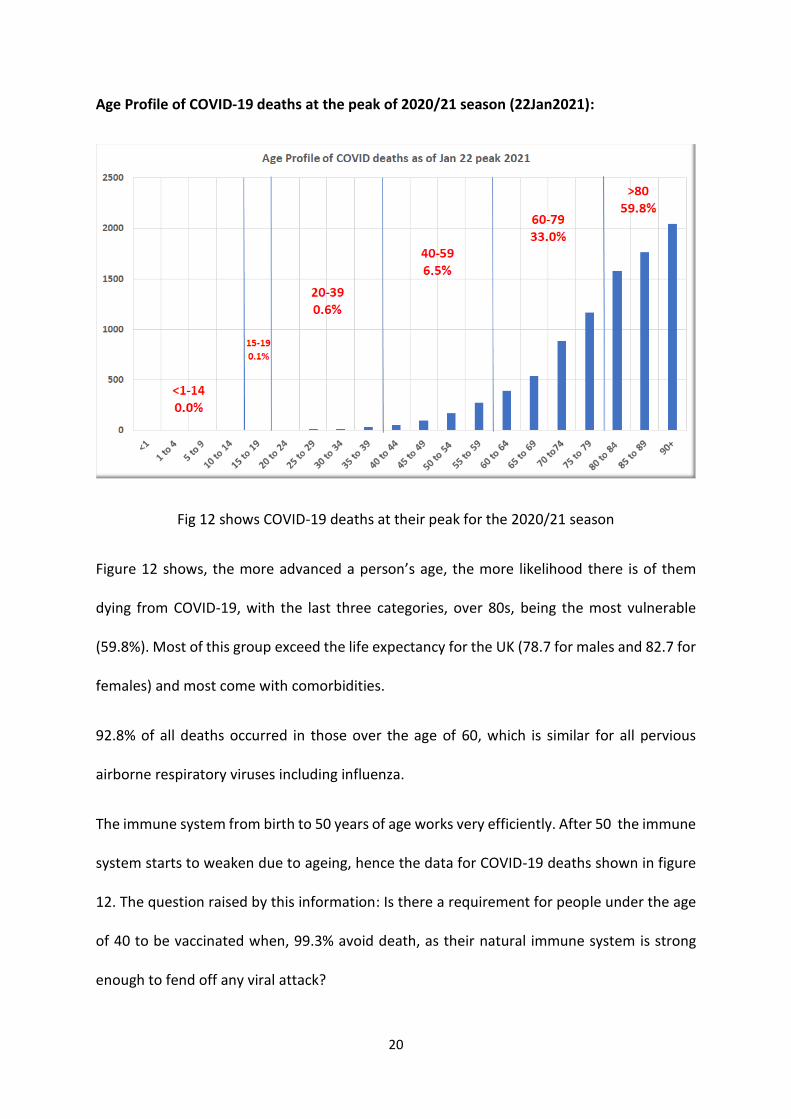
Age Profile of COVID-19 deaths at the peak of 2020/21 season (22Jan2021):
Fig 12 shows COVID-19 deaths at their peak for the 2020/21 season
Figure 12 shows, the more advanced a person’s age, the more likelihood there is of them
dying from COVID-19, with the last three categories, over 80s, being the most vulnerable
(59.8%). Most of this group exceed the life expectancy for the UK (78.7 for males and 82.7 for
females) and most come with comorbidities.
92.8% of all deaths occurred in those over the age of 60, which is similar for all pervious
airborne respiratory viruses including influenza.
The immune system from birth to 50 years of age works very efficiently. After 50 the immune
system starts to weaken due to ageing, hence the data for COVID-19 deaths shown in figure
12. The question raised by this information: Is there a requirement for people under the age
of 40 to be vaccinated when, 99.3% avoid death, as their natural immune system is strong
enough to fend off any viral attack?
21
4. The Diamond Princess, and Sweden “petri dish” examples
https://www.ship-technology.com/features/timeline-covid-spread-aboard-diamond-
princess-cruise-ship/
On the 23Jan2020 an 80-year-old man, who embarked the Diamond Princess on 20Jan2020
in Yokohama, Japan started to present with coughing symptoms. Two days later he
disembarked in Hong Kong and visited hospital, while the Diamond Princess carried on its
scheduled journey to Vietnam, Taiwan, and back to Yokohama on 05Feb2020 after a 24-hour
delay.
The ship’s owner confirmed on 01Feb2020 the passenger had tested positive for Covid-19.
Although still in hospital, his condition remained stable.
After that announcement, between 03-04Feb2020 quarantine officers started testing
passengers and crew members, collecting upper-respiratory specimens from those exhibiting
Covid-19 related symptoms.
On 05Feb2020 there was a total of 3,711 passengers and crew. The Japanese Government
asked 3,600 of them to quarantine for 14 days, until 19Feb2020. The cruise ship owners
reported an increase in the number of cases.
20Feb2020, 600 passengers were allowed to disembark, after testing negative for Covid-19.
By 27Feb2020 all guests had disembarked, leaving 500 crew on board, waiting either for
government flights or to be transferred to a quarantine facility in Japan.
By 08March2020, researchers from Tokyo’s National Institute of Infectious Diseases
estimated the total number of cases was 697, with 7 passengers having died. The final toll on
the Diamond Princess was 712 people were infected (19.2%) and 14 died (0.38%).
22
As the viral load would have been excessively high, with spread through the ventilation
system, everyone aboard the ship would have been in close contact with the virions. It can be
argued, given the above data, 80.8% of passengers and crew must have gained natural herd
immunity. Using this data with the population numbers in the UK would have meant 13m
people would have been infected, with 49,000 deaths.
Professor Michael Levitt is with the Structural Biology department at Stanford School of
Medicine, and winner of the 2013 Nobel Prize for Chemistry for “the development of
multiscale models for complex chemical systems.” Levitt predicted deaths for the UK, based
on the Diamond Princess analysis, of 50,000 for 2019/20 season. The UK actual number of
deaths from COVID-19 was 41,566.
Sweden a country with limited restrictions:
Comparing deaths per million for both 2019/20 and 2020/21 seasons in Sweden, a country
which did not lockdown (so gaining natural herd immunity), with the UK was an interesting
exercise. Sweden, as of 11May2021 has had 1,405 deaths/m and the UK 1872/m a difference
of 467 deaths/m. This equates to 31,756 more deaths, based on a UK population of 68m.
https://www.worldometers.info/world-population/uk-population/
https://www.worldometers.info/world-population/sweden-population/
Summing up, taking both the 49,000 Diamond Princes/UK equivalent and 31,000 Sweden/UK
equivalent would mean deaths would have been 40,000 per season. With a total for both
seasons of 129,000 (as of 31Jul2021) means the UK has 49,000 excess deaths due to lockdown
and restrictions.
23
5. NHS Hospitals unfortunate transmissions and mistakes
It is highly likely the CoV-2 virus was in circulation long before the UK and other governments
realised. Certainly, before December 2019.
A case study:
Between 9th and 12th December 2019, a couple in their late 60s, who lived in England, spent
three days in Lisbon. On 30th December the husband had a pre-planned MRI scan and that
same evening he developed a hacking cough with profuse sweating/shivering which lasted
for four days. The only thing he could ingest at that time was salt water. When his GP checked
him for a chest infection, he was sent to the local hospital for an X-Ray. When the GP saw the
results, he immediately had the patient attend the main hospital for a CT scan to test for
suspected lung cancer. Happily, this was negative, and the man was given a course of
antibiotics which did little to clear the infection. A further visit to a different GP resulted in
more specifically targeted antibiotics. The man also visited the respiratory unit at the hospital
for tests. It was another week before significant improvement was seen. During this period,
he had been in the company of countless medical practitioners in various settings and,
because the epidemic had not yet been recognised, most were not equipped with PPE. Later,
when the pandemic became more widespread, the man received a letter from his consultant
confirming what he had was almost certainly the SARS CoV2 virus/COVID-19 disease. It was
two months after his recovery Public Health England and the government announced there
was an airborne respiratory virus epi/pandemic.
Three months too late, the virus was obviously rampant in the NHS and the community
already. As death rates in December 2019, January and February 2020 were low, it can only
be assumed most people recovered naturally, or with the aid of antibiotics. Herd immunity
24
was gaining traction, more than the authorities realised in March 2020 when they locked
down. The NHS being an epicentre for COVID-19, starting in December 2019-March 2020
contributed to an excess of 20,000 deaths.
A major error of judgement:
The NHS’ biggest error was transferring elderly patients, most likely to have been infected by
COVID-19 in hospital, into care homes. These care homes were ill equipped to deal with the
situation. Elderly people in care homes were the most vulnerable to be infected and die. This
added to the exceedingly high excess deaths in care homes, estimated at 26,000 deaths.

25
6. Nightingale Hospitals:
When gaining the first knowledge of the CoV-2 virus/CODID-19 disease, which should have
been recognised much earlier, Nightingale hospitals should have been prepared for the intake
of any patient showing serious symptoms of a respiratory problem and those who tested
positive with COVID-19. These patients should have been sent directly to these hospitals.
Surely, elderly patients tested positive for COVID-19 or showing signs of serious respiratory
problems should have been treated in Nightingale hospitals rather than sent to care homes?
These supposedly, specialised hospitals were hardly used, for various reasons, mainly lack of
trained staff in respiratory diseases and the shortage of equipment (X-ray and CT scanners)
and PPE. Many were not used at all.
26
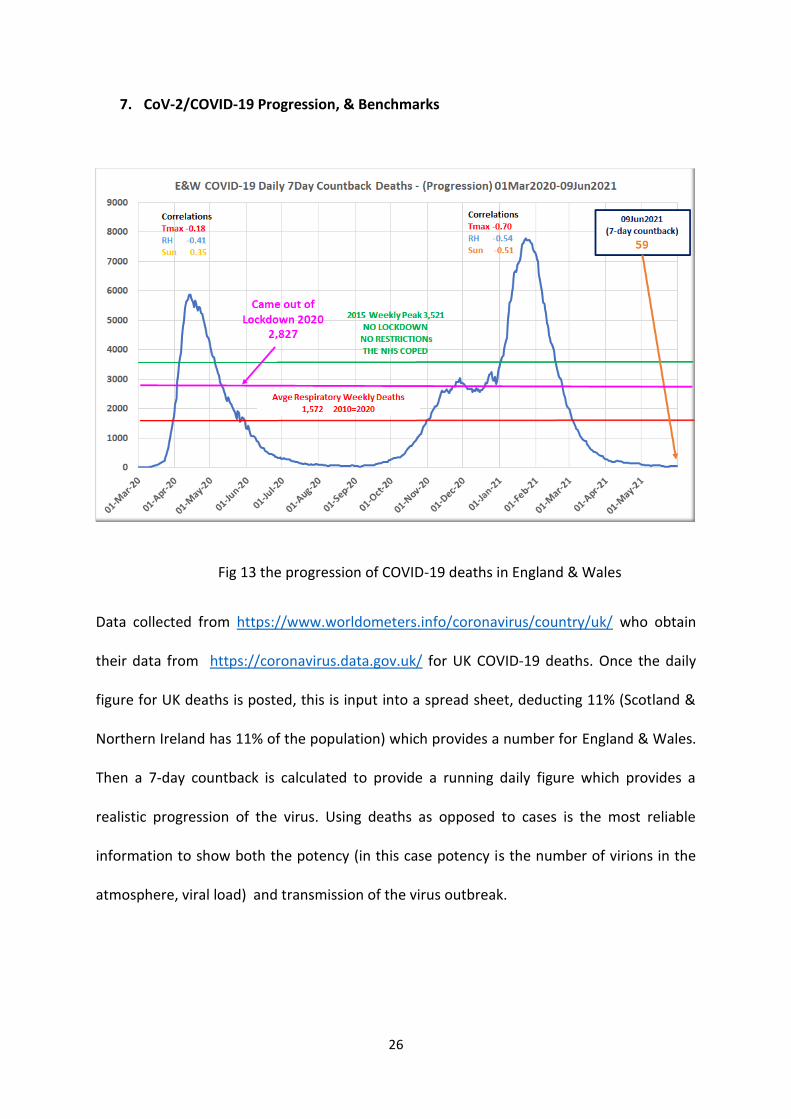
7. CoV-2/COVID-19 Progression, & Benchmarks
Fig 13 the progression of COVID-19 deaths in England & Wales
Data collected from https://www.worldometers.info/coronavirus/country/uk/ who obtain
their data from https://coronavirus.data.gov.uk/ for UK COVID-19 deaths. Once the daily
figure for UK deaths is posted, this is input into a spread sheet, deducting 11% (Scotland &
Northern Ireland has 11% of the population) which provides a number for England & Wales.
Then a 7-day countback is calculated to provide a running daily figure which provides a
realistic progression of the virus. Using deaths as opposed to cases is the most reliable
information to show both the potency (in this case potency is the number of virions in the
atmosphere, viral load) and transmission of the virus outbreak.
27
Variants:
There has been a hype of reporting, both in the media and government briefings, about
variants of the CoV-2 virus. To date there have been twelve variants reported by the
government including, the Kent, the South Africa, Brazil, Philippines and Indian. However,
when the data in figure 13 is observed, none of these has had any effect on the decline in
deaths (the Gompertz curve down slope).
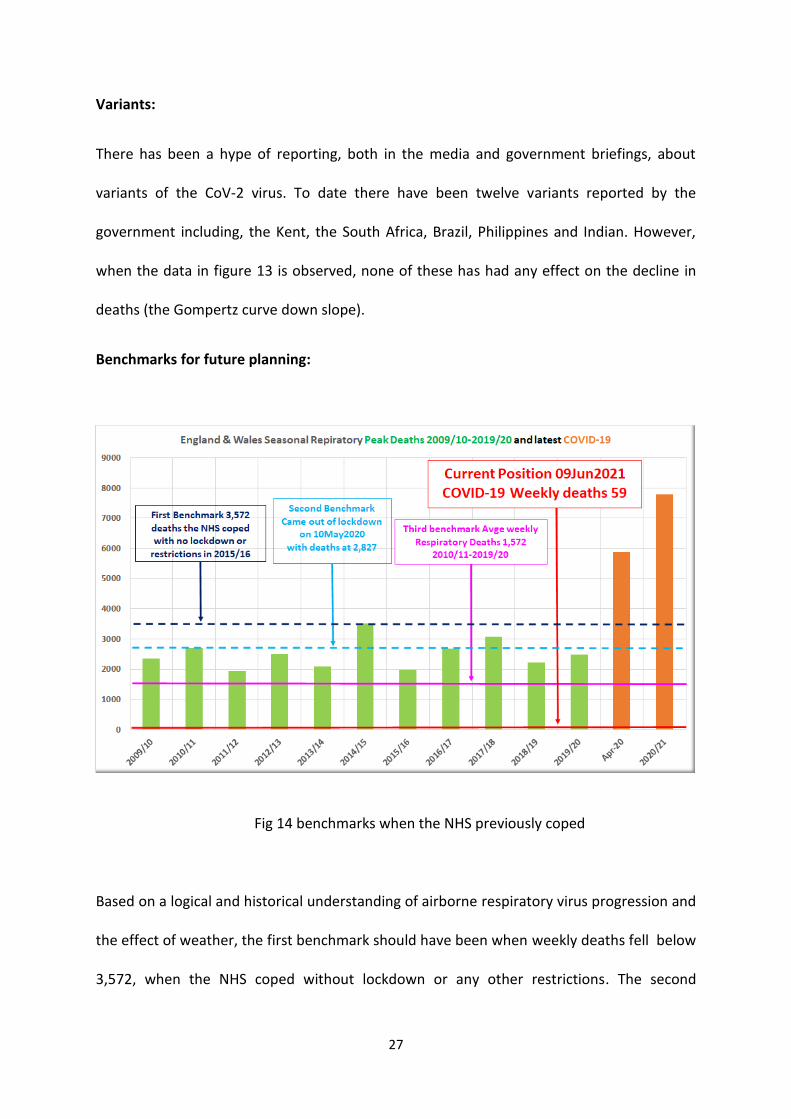
Benchmarks for future planning:
Fig 14 benchmarks when the NHS previously coped
Based on a logical and historical understanding of airborne respiratory virus progression and
the effect of weather, the first benchmark should have been when weekly deaths fell below
3,572, when the NHS coped without lockdown or any other restrictions. The second
28
benchmark could have been when the UK was unlocked in the 2020 outbreak with weekly
deaths at 2,827. The third benchmark should have been, when all previous peak weekly
deaths over the last 11 years (1,934) was achieved. The fourth benchmark should have been,
when weekly deaths fell below the 11-year average for respiratory deaths. As of 10Jun2021
with deaths at just 59 per week – 1,510 below the 11-year average (1,572) for airborne
respiratory virus deaths for E&W.
Benchmarks should be used for future indications of when to lockdown, if necessary, because
the “NHS cannot cope”. With an ever-increasing population the NHS should be brought up to
a standard where they can cope. Nightingale hospitals with the right equipment and fully
trained staff should be used properly in future.
When lockdowns, social distancing, group control and wearing of face masks are mandated
by law, the one major effect is, reducing the build-up of natural herd immunity, which has
worked adequately for all previous airborne respiratory virus outbreaks in history.
N.B. see data changes and the confusion of cases of respiratory disease with or without
COVID-19, remembering SARS CoV-2 is an airborne virus with COVID-19 being the respiratory
disease.[changes to reporting in supplementary information]
29
8. PCR testing, R0 rates
From The Lancet:
“RTPCR tests to detect severe acute respiratory syndrome coronavirus 2 (SARSCoV2) RNA
are the operational gold standard for detecting COVID19 disease in clinical practice. RTPCR
assays in the UK have analytical sensitivity and specificity of greater than 95%, but no single
gold standard assay exists. New assays are verified across panels of material, confirmed as
COVID19 by multiple testing with other assays, together with a consistent clinical and
radiological picture.
These new assays are often tested under idealised conditions with hospital samples
containing higher viral loads than those from asymptomatic individuals living in the
community. As such, diagnostic or operational performance of swab tests in the real world
might differ substantially from the analytical sensitivity and specificity.”
“Any diagnostic test result should be interpreted in the context of the pre=test probability of
disease. For COVID19, the pre-test probability assessment includes symptoms, previous
medical history of COVID19 or presence of antibodies, any potential exposure to COVID19,
and likelihood of an alternative diagnosis. When low pre-test probability exists, positive
results should be interpreted with caution and a second specimen tested for confirmation.
Notably, current policies in the UK and globally do not include special provisions for those
who test positive despite being societal levels (panel). Several measures might help to
minimise false-positive results and mitigate possible consequences. Firstly, stricter standards
should be imposed in laboratory testing. This includes the development and implementation
of external quality assessment schemes and internal quality systems, such as automatic
blinded replication of a small number of tests for performance monitoring to ensure
30
falsepositive and false-negative rates remain low, and to permit withdrawal of a
malfunctioning test at the earliest possibility. Secondly, pre-test probability assessments
should be considered, and clear evidence-based guidelines on interpretation of test results
developed. Thirdly, policies regarding the testing and prevention of virus transmission in
healthcare workers might need adjustments, with an immediate second test implemented
for any healthcare worker testing positive. Finally, research is urgently required into the
clinical and epidemiological significance of prolonged virus shedding and the role of people
recovering from COVID19 in disease transmission.”
www.thelancet.com/respiratory Vol 8 December 2020
Another problem arising in these testing procedures is that of the test itself.
From Fullfact:
“During a PCR test for SARS CoV-2 that causes Covid-19, viral genetic material on the swab
sample is purified, stabilised, and concentrated. If the genetic material of interest is present
in the sample, it is then copied again and again by heating and cooling the material in the
presence of various substances. Each iteration of this is called a thermal cycle. If these cycles
go above 23, it is possible to find trace genetic materials of CoV-2/COVID-19”
“As genetic material is amplified (with real time PCR) fluorescence is produced; how this
happens exactly varies by PCR method, but basically involves those substances added to the
test releasing fluorescent particles or becoming more fluorescent.
Eventually the fluorescence is strong enough to be detected. The number of thermal cycles
required to reach this point is known as the cycle threshold.
31
The fewer cycles required before that fluorescence is observed, the greater the concentration
of viral genetic material in the original sample, roughly speaking. Conversely, the more cycles
that are required, the smaller the concentration of viral material on the original sample.”
https://fullfact.org/health/cycle-threshold-values/
From AACC (American Association of Clinical Chemistry):
The UK uses Ct34, almost the highest cycle (Ct40), which means it is highly likely to pick up
exceedingly small fragments of SARS C0V-2 genetic material. This increases the number of
false positive tests and also could pick up traces from people who have recovered from
COVID-19.
“Ct refers to the number of cycles needed to amplify viral RNA to reach a detectable level.
Certain testing platforms reveal Ct, but labs generally do not provide the Ct value when
reporting test results. It is unclear how Ct should be applied in clinical settings. No
standardization for Ct values exists across RT-PCR platforms, making it difficult to compare
results among different tests. Researchers in clinical studies also haven’t validated using Ct
to guide management of COVID-19 cases.”
https://www.aacc.org/cln/cln-stat/2020/december/3/sars-cov-2-cycle-threshold-a-metric-
that-matters-or-not
From the BMJ (British Medical Journal):
“Sadly, not all forms of PCR testing provide a measurable cycle threshold; and the privatised
labs used for “pillar 2” testing in England cannot or will not routinely share CT values, making
32
it much harder to assess the likelihood that a positive result represents infection is a repeat
infection.
This matters because the consequences of being deemed infectious are not trivial. If you test
healthcare workers, and decide they are potentially infectious, they have to self-isolate for 10
days: and their household and other significant contacts for 14 days.
This can have a profoundly serious impact on the workforce, with significant economic and
personal implications. And, in care homes, it can again be very disruptive if residents are
deemed to have re-infection.
We need greater clarity about the purposes of and strategy for testing.
And we need to be better able to make decisions about when we can dismiss “positive” results
as being due to leftover RNA, rather than current infection.”
https://www.bmj.com/content/370/bmj.m3262/rr
R0-Rate:
The R value is the number of “cases”, people who have tested positive through PCR testing.
If PCR testing is not accurate, as mentioned above, how can case rates be of value? The main
problem is government advisors do not understand the implications of how weather
conditions control the viral load in the atmosphere.
A better measurement for understanding the SARS CoV-2 virus/COVID-19 disease and all
other airborne virus outbreaks can be achieved.
33
If nature is left to its course, as per all previous years, to build up herd immunity, there should
be no reason for any tests.
34
9. Lockdown, social distancing, group control, and facemasks
Logical days of lockdown vs reality:
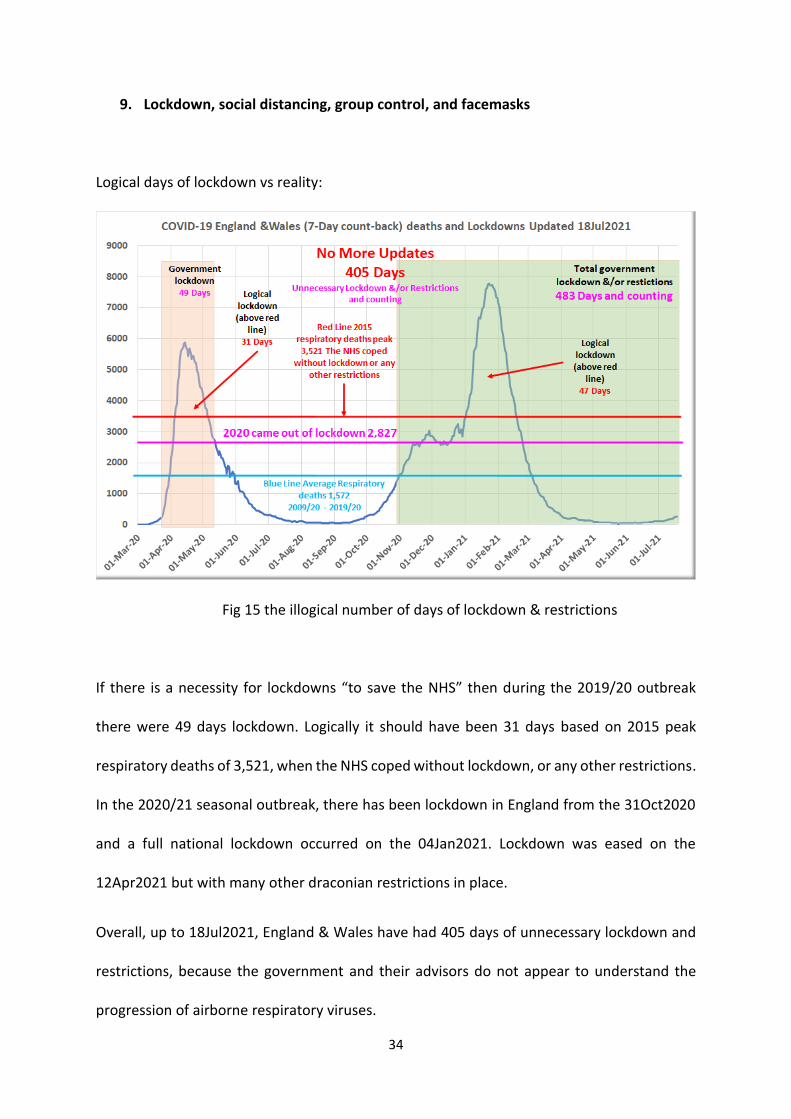
Fig 15 the illogical number of days of lockdown & restrictions
If there is a necessity for lockdowns “to save the NHS” then during the 2019/20 outbreak
there were 49 days lockdown. Logically it should have been 31 days based on 2015 peak
respiratory deaths of 3,521, when the NHS coped without lockdown, or any other restrictions.
In the 2020/21 seasonal outbreak, there has been lockdown in England from the 31Oct2020
and a full national lockdown occurred on the 04Jan2021. Lockdown was eased on the
12Apr2021 but with many other draconian restrictions in place.
Overall, up to 18Jul2021, England & Wales have had 405 days of unnecessary lockdown and
restrictions, because the government and their advisors do not appear to understand the
progression of airborne respiratory viruses.
35
The most illogical reasoning of this current outbreak is, in the first outbreak the country was
unlocked on the 10May2020 when the weekly deaths were 2,827. This figure was passed (on
the down slope of the Gompertz curve) on 23Feb2021, 162 days ago up to 04Aug2021.
From a different perspective, both outbreaks followed the same natural progression, the
Gompertz Curve.
Face Masks:
There is a particularly good reason humans did not evolve wearing a face mask. The human
body needs to get rid of pathogens, either inhaled, absorbed, or synthesised in the body.
These include viruses, bacteria, and fungi, plus unwanted gases such as carbon dioxide, and
water vapour. Humans breathe out these pathogens and gases in order to maintain
homeostasis.
As mentioned earlier, SARS CoV-2 is an exceedingly small airborne respiratory virus measuring
just 0.1μm or 1 micron, a billion virus particles would fit on a pinhead. Even the best face
masks, the N95, can only stop 98.5% of SARS CoV-2 virus particles. All other masks used at
the start of the two outbreaks had little chance of preventing users from inhaling this virus.
Because there are gaps between the mask and the edge of the nose, billions of virions can
enter through that gap, as well as the material the mask is made of.
When CoV-2 virus particles enter through a mask when inhaling, a person can become
infected, as the virus particles multiply in the respiratory tract. When exhaling, water particles
block the channels of escape, and are then re-inhaled into the respiratory tract causing more
severe infection. This process further unbalances homeostasis which leads to compromise of
36
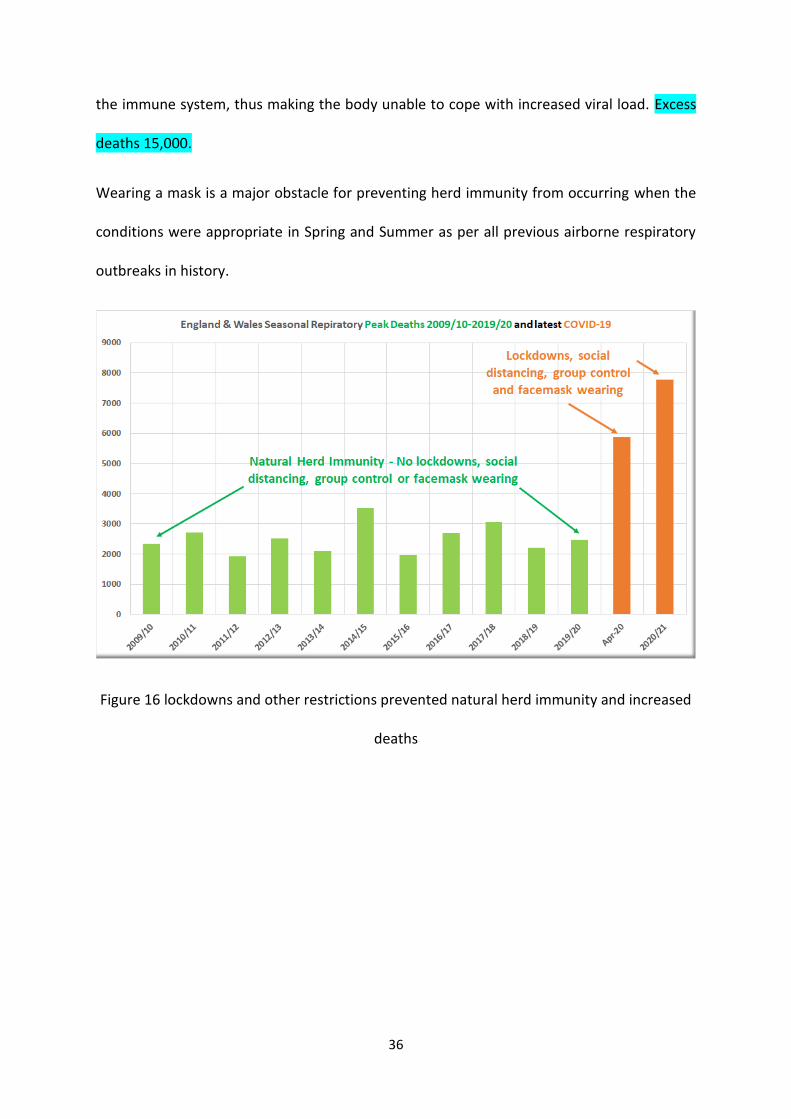
the immune system, thus making the body unable to cope with increased viral load. Excess
deaths 15,000.
Wearing a mask is a major obstacle for preventing herd immunity from occurring when the
conditions were appropriate in Spring and Summer as per all previous airborne respiratory
outbreaks in history.
Figure 16 lockdowns and other restrictions prevented natural herd immunity and increased
deaths
37
10. A need for accurate data:
Data:
Source: https://www.weather-research.com/articles/uk-cov-2-update-no-logical-reason-for-
lockdown-from-18feb2021
Other weekly data is from the Office of National Statistics (ONS) for the whole of the UK.
https://www.ons.gov.uk/peoplepopulationandcommunity/birthsdeathsandmarriages/death
s/datasets/weeklyprovisionalfiguresondeathsregisteredinenglandandwales
This data changed drastically week ending 01Jan2021 respiratory deaths were 678, the
following week 08Jan2021, this had become 7,025. It is difficult to understand what they
have done, as COVID-19 deaths on these two dates went from 3,114 to 6,057. Average
respiratory deaths from 2010-2020 on 01January were 2,011 and on 08January 2,307. There
appears to be something very amiss with ONS data.
Assuming numbers of all COVID-19 deaths had been added to the total of respiratory deaths
within the 7,025 the data shows an increase of 3,404 respiratory deaths, making 4,718 more
than the 10-year average, which is not credible. Considering, in the first outbreak the highest
respiratory deaths were recorded as 2,477 on 10Jan2020 for the 2019/20 season, before any
COVID-19 was even recorded. The highest respiratory deaths for E&W at the peak of the Mar-
May outbreak was 1,970 with 5,870 (7-day countback) COVID-19 deaths on 14Apr2020. The
data appears to make no sense unless all deaths with COVID-19 somewhere on the death
certificate are being included. This makes a nonsense of understanding how this airborne
respiratory virus has progressed and what can be learned for another similar epi/pandemic.
38
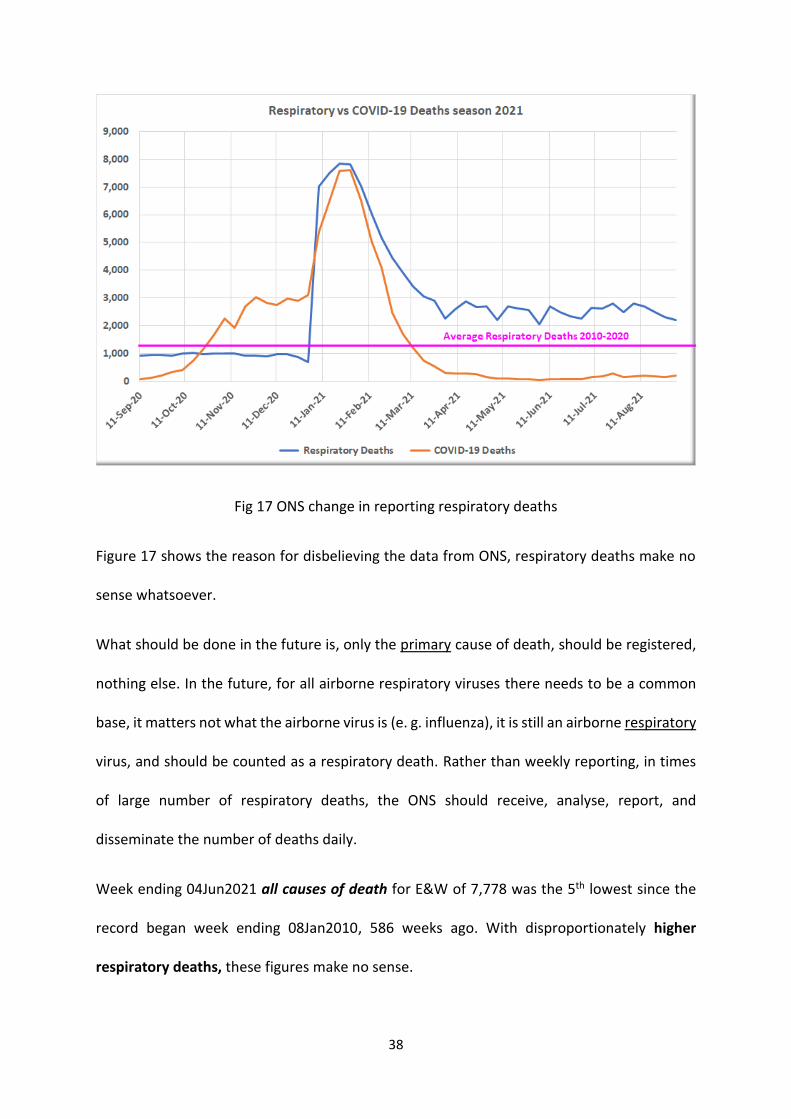
Fig 17 ONS change in reporting respiratory deaths
Figure 17 shows the reason for disbelieving the data from ONS, respiratory deaths make no
sense whatsoever.
What should be done in the future is, only the primary cause of death, should be registered,
nothing else. In the future, for all airborne respiratory viruses there needs to be a common
base, it matters not what the airborne virus is (e. g. influenza), it is still an airborne respiratory
virus, and should be counted as a respiratory death. Rather than weekly reporting, in times
of large number of respiratory deaths, the ONS should receive, analyse, report, and
disseminate the number of deaths daily.
Week ending 04Jun2021 all causes of death for E&W of 7,778 was the 5th lowest since the
record began week ending 08Jan2010, 586 weeks ago. With disproportionately higher
respiratory deaths, these figures make no sense.
39
During 2019/20 season daily data from worldometers via https://coronavirus.data.gov.uk/
total COVID-19 deaths were 31,712:
Weekly reporting via
https://www.ons.gov.uk/peoplepopulationandcommunity/birthsdeathsandmarriages/death
s/datasets/weeklyprovisionalfiguresondeathsregisteredinenglandandwales
COVID-19 deaths were 40,583. This equates to a difference of 8,622 more deaths.
During 2020/21 season daily COVID-19 total deaths are 69,054 but weekly ONS deaths are
88,704. This equates to a difference of 19,650 more deaths.
In total this is 28,272 difference. Along with the ridiculous one week rise in respiratory deaths
as shown in figure 17 above, there can be little trust in the data the government have posted.
Another interesting anomaly is the difference between total deaths and respiratory/COVID-
19 deaths.
Total all causes of deaths COVID-19 + Respiratory compared with
compared with 2017/18; Respiratory virus 2017/18
2019/20 was 32,289 more 2019/20 was 30,002 more
2020/21 was 14,880* more 2020/21 was 79,937* more
• Estimated forecast from 23July 2021 until 01August2021
Whilst season 2019/20 only had 5,452 of a difference between all causes of death and
respiratory/COVID, season 2020/21 had fewer overall deaths but significantly higher COVID-
19 deaths, giving 65,057 of a difference. Why were there such large discrepancies? See figure
18 for more detail.
40
UK government updates and changes to reporting: (12 pages of them).
May 20 (GMT)
• 2,874 new cases and 7 new deaths in the United Kingdom. NOTE: "Revision to
historical case data in England: The introduction of a new system disrupted the
removal of cases where a positive rapid lateral flow test (LFD) was followed by all
negative laboratory (PCR) tests taken within 3 days, as reported earlier this week.
Therefore a further 180 cases have been removed today. Regions and local authorities
do not show the actual number of new cases reported. UK and England numbers of
newly reported cases have been adjusted and correctly reflect new cases reported. This
issue will be ongoing over the next few days." [source] [source]
*Other “Updates” are listed in supplementary information – 12 pages.
41
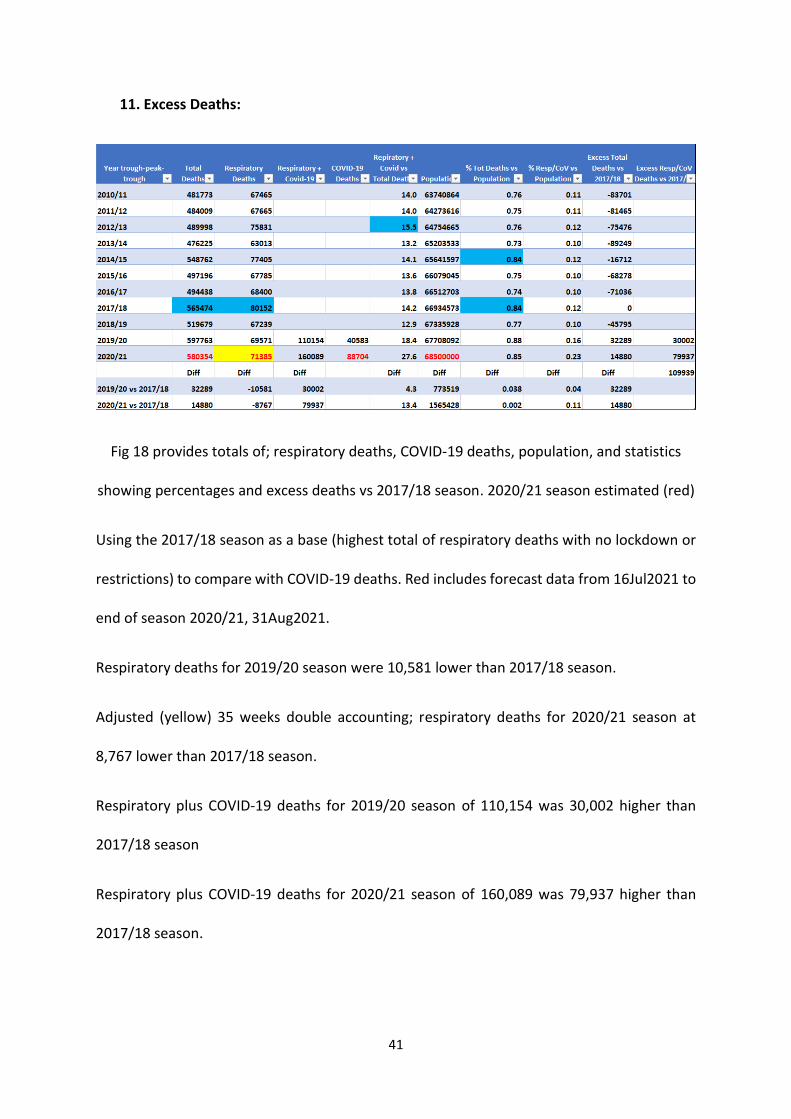
11. Excess Deaths:
Fig 18 provides totals of; respiratory deaths, COVID-19 deaths, population, and statistics
showing percentages and excess deaths vs 2017/18 season. 2020/21 season estimated (red)
Using the 2017/18 season as a base (highest total of respiratory deaths with no lockdown or
restrictions) to compare with COVID-19 deaths. Red includes forecast data from 16Jul2021 to
end of season 2020/21, 31Aug2021.
Respiratory deaths for 2019/20 season were 10,581 lower than 2017/18 season.
Adjusted (yellow) 35 weeks double accounting; respiratory deaths for 2020/21 season at
8,767 lower than 2017/18 season.
Respiratory plus COVID-19 deaths for 2019/20 season of 110,154 was 30,002 higher than
2017/18 season
Respiratory plus COVID-19 deaths for 2020/21 season of 160,089 was 79,937 higher than
2017/18 season.
42
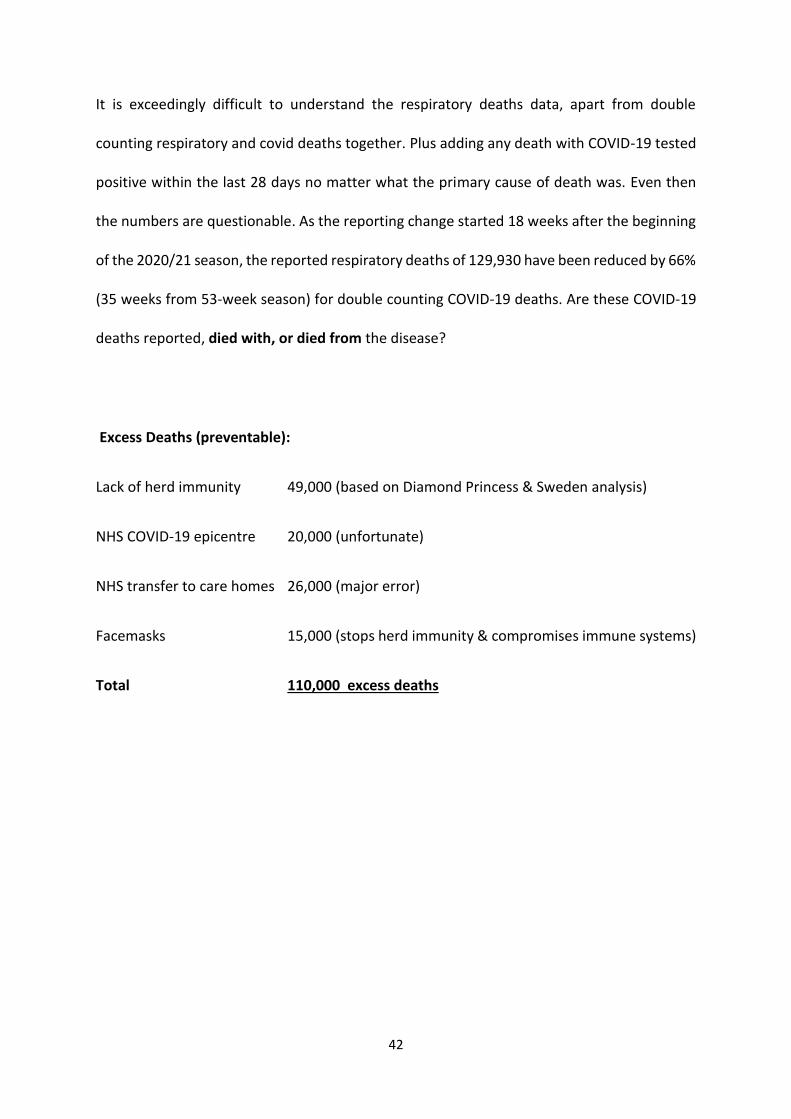
It is exceedingly difficult to understand the respiratory deaths data, apart from double
counting respiratory and covid deaths together. Plus adding any death with COVID-19 tested
positive within the last 28 days no matter what the primary cause of death was. Even then
the numbers are questionable. As the reporting change started 18 weeks after the beginning
of the 2020/21 season, the reported respiratory deaths of 129,930 have been reduced by 66%
(35 weeks from 53-week season) for double counting COVID-19 deaths. Are these COVID-19
deaths reported, died with, or died from the disease?
Excess Deaths (preventable):
Lack of herd immunity 49,000 (based on Diamond Princess & Sweden analysis)
NHS COVID-19 epicentre 20,000 (unfortunate)
NHS transfer to care homes 26,000 (major error)
Facemasks 15,000 (stops herd immunity & compromises immune systems)
Total 110,000 excess deaths
43
12. Vaccines did not “turn the curve”:
There has been much publicity about how the effectiveness of vaccines has stopped COVID-
19 deaths in its tracks. Vaccinations started 08Dec2020.
Virus vaccines normally take at least 5 years to go through the rigorous clinical trials process
as follows:
Preclinical: Testing of a drug/vaccine in non-human subjects to gather efficacy, toxicity, and
pharmacokinetic information: No humans involved, in-vitro or in-vivo (animal) testing.
Phase 0: recently added by the FDA, for eliciting more information about pharmacokinetics
particularly oral bioavailability and half-life of the drug; using 10 People.
Phase I: Dose-ranging on healthy volunteers for safety; using between 20-100 people.
Phase II: Testing of drug on participants to assess efficacy and side effects; using between
100-300 with specific disease.
Phase III: testing of drug on participants to assess efficacy, effectiveness, and safety; using
300-3,000 people.
Phase IV: Surveillance of public; anyone seeking treatment from, physician
Phase I, usually takes several months, Phase II, several months to 2 years, Phase III, one to
four years.
The, so called vaccines for COVID-19 took just six months and are not vaccines in the true
sense of the word, as they do not contain any virus particles, but make changes to mRNA,
genetic engineering.
44
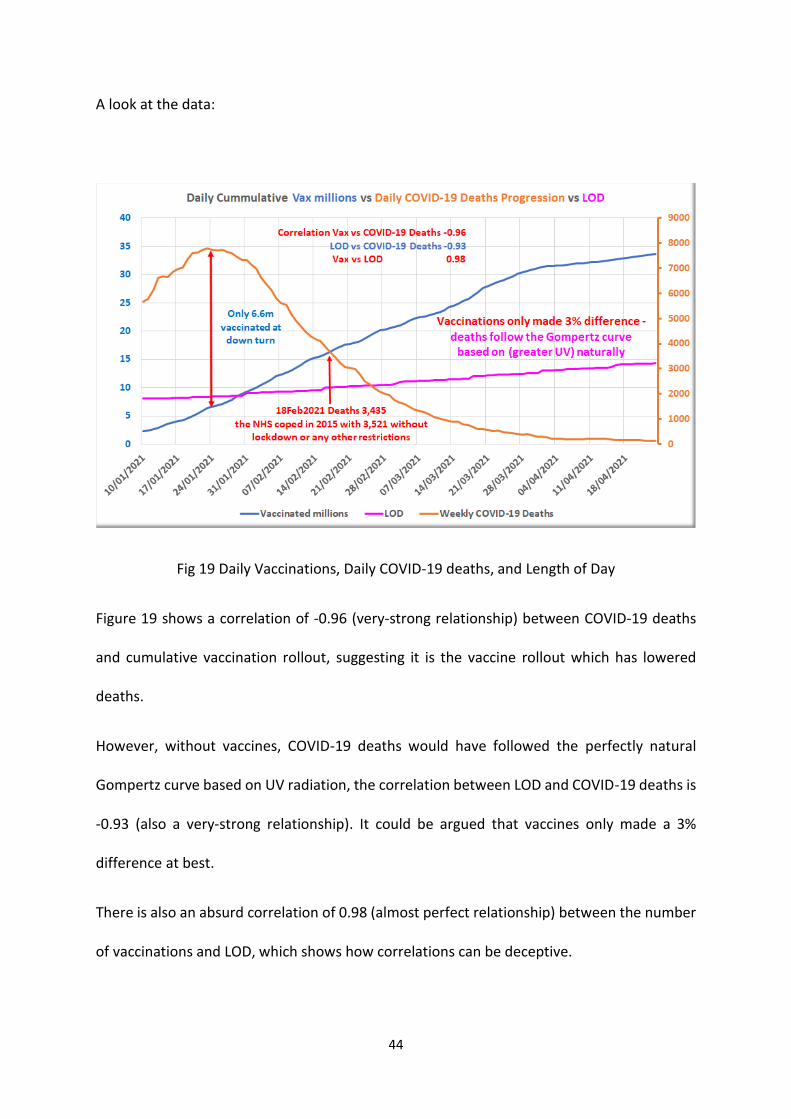
A look at the data:
Fig 19 Daily Vaccinations, Daily COVID-19 deaths, and Length of Day
Figure 19 shows a correlation of -0.96 (very-strong relationship) between COVID-19 deaths
and cumulative vaccination rollout, suggesting it is the vaccine rollout which has lowered
deaths.
However, without vaccines, COVID-19 deaths would have followed the perfectly natural
Gompertz curve based on UV radiation, the correlation between LOD and COVID-19 deaths is
-0.93 (also a very-strong relationship). It could be argued that vaccines only made a 3%
difference at best.
There is also an absurd correlation of 0.98 (almost perfect relationship) between the number
of vaccinations and LOD, which shows how correlations can be deceptive.
45
Considerations:
Historically all seasonal airborne respiratory virus deaths follow the same path, from roughly
the end of August/beginning of September, deaths start rising up to around the second week
in January the following year, and then fall away until approximately the last week in August.
This pattern which has occurred throughout history, happens naturally through herd
immunity, without lockdown, social distancing, restricted groups, compulsory facemask
wearing or vaccines.
SARS CoV-2/COVID-19 was in circulation before December 2019. People with respiratory
problems went to hospitals for X-Rays and CT scans. Later it was discovered they had COVID-
19. Therefore, many of the staff and other patients in NHS hospitals were unfortunately
infected with the disease before COVID-19 was even known about. With low respiratory
deaths between December 2019 and March 2021, it indicated, SARS CoV-2 was no more
virulent than previous years, secondly it showed there was some natural herd immunity trying
to develop.
NHS hospitals became epicentres for COVID-19 infection for three months before the
epidemic was realised causing.20,000 unfortunate excess deaths
Transferring elderly patients from hospitals, where they were highly likely to have contracted
COVID-19, to care homes, allowing them to infect the most vulnerable residents caused
26,000 excess deaths
Based on the Diamond Princess and Sweden analysis, lockdowns, and other restrictions such
as social distancing: the population being largely confined to their homes prevented them
from gaining natural herd immunity, resulting in 49,000 excess deaths over both 2019/20 and
46
2020/21 seasons. Also, with many people not being able to obtain UV radiation they were
unable to synthesise natural vitamin D, compromising their natural immune systems which
made them more vulnerable to viral infections such as COVID-19.
Facemasks prevent pathogens, such as SARS CoV-2 virus, from escaping into the air, trapped
inside the masks by the exhaled water vapour and are re-inhaled back into the body,
compromising homeostasis and the natural immune system. Impaired immune systems are
prone to developing other diseases, as well as COVID-19. Preventing herd immunity and
increased susceptibility of infection caused 15,000 excess deaths.
47
Conclusions:
In total government actions of lockdown, social distancing, group control, compulsory
facemask wearing, NHS unfortunate epicentre for COVID-19, NHS mistake of sending elderly
patients to care homes, resulted in 110,000 total excess deaths between both the 2019/20
and 2020/21 COVID-19 outbreaks. Most of these excess deaths were people nearing the end
of their lives, many over the age of average life expectancy in the UK.
So called vaccines made little difference to deaths. Deaths, as in all previous years, followed
the natural Gompertz curve.
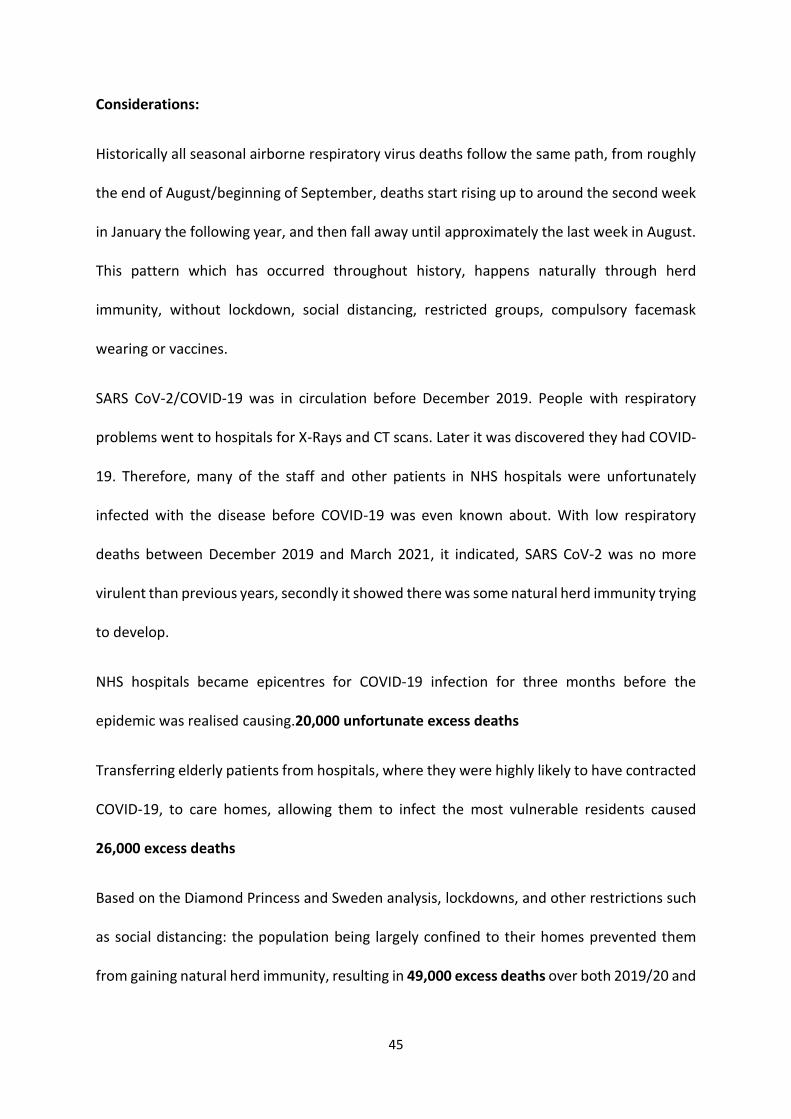
Fig 20 shows all causes of death, respiratory deaths, and COVID-19 deaths by season
Figure 20 shows the comparison of deaths from all causes, respiratory deaths for the last 11
years and COVID-19 deaths for 2019/20 & 2020/21.
48
Season 2020/21 respiratory/COVID-19 deaths makes little sense as overall deaths were lower
than 2019/20 and similar to seasons 2014/15 and 2017/18. Two government departments,
Coronavirus.gov.uk and ONS reported different data, a lot of which made little sense.
Government, their advisors, and media reporting of COVID-19 UK epidemic has been full of
hyperbole due to lack of understanding of the progression of seasonal airborne respiratory
viruses. Government data is spurious to say the least. There has been little or no
trustworthy empirical evidence published throughout. A fearful population will accept
anything which is projected, as truth.
Recommended