Comprising
Tables of Country RankingsShowing highest and lowest 20 countries in several measures
191 Country Report CardsWith national childhood obesity risk scores and probability of meeting the WHO 2025 targets
Atlas of Childhood ObesityOctober 2019
www.worldobesity.org

Compiled by Tim Lobstein and Hannah Brinsden
World Obesity Federation Charles Darwin 2, 107 Gray’s Inn Road, London, WC1 X8TZ
www.worldobesity.org
We are grateful to the World Health Organization, UNICEF and the NCD Risk Collaboration (NCD-RisC) for the data we have used in this Atlas. Please refer to page 210 of this Atlas for the data sources.
© World Obesity Federation 2019
2Atlas of Childhood Obesity

Atlas of Childhood Obesity
Contents Page
Foreword 4
Introduction 5
Tables of Country Rankings 6
Predicted numbers of children with obesity in 2030 7
Country Rankings (highest and lowest 20) 8-13
Country Report Cards 14
Country List 15
Country Report Cards 17-207
Appendix 208
Colour-coding Definitions 209
Data Sources 210
3Atlas of Childhood Obesity | Contents

Welcome to this, our first Atlas of Childhood Obesity, showing details of childhood obesity, risk factors and policies for virtually every country worldwide. We also show the likelihood of meeting the globally agreed target of ‘no increase in childhood obesity prevalence by 2025’ and our assessment of the risk for each country of having or acquiring a high proportion of children living with obesity over the coming decade.
“What gets measured gets done” is commonly cited as a justification for monitoring progress, and lies behind our publication of this Atlas. There is no doubt that a lack of measurement makes it very hard to assess the impact of any interventions, and may lead to nothing being done. But equally, measurement alone is no guarantee of progress.
Without substantial interventions to prevent and to treat childhood obesity, the numbers of school-age children and adolescents living with obesity is predicted to rise from the current estimates of around 150m worldwide, to over 250m by 2030. Obesity in childhood is closely associated with obesity in adulthood, and with more years living with obesity, both of which are linked to a high level of consequential disease.
The continuing increase in childhood obesity will overwhelm the health services of many countries. The increase shows a critical failure of government to respect and protect our children’s rights to good health. We can do better, and we must.
Foreword
Donna Ryan President
Johanna Ralston Chief Executive
4Atlas of Childhood Obesity | Foreword

Introduction
This Atlas of Childhood Obesity provides the latest estimates of infant, child and adolescent obesity prevalence in 191 countries.
It also provides estimates of the prevalence and numbers of children living with obesity in 2030, along with an estimate of the probability of achieving the World Health Organization (WHO) target of ‘no increase in obesity prevalence by 2025’ on the assumption that present trends continue.
As some countries may have a low level of childhood obesity prevalence yet fail to prevent it climbing before 2025, the World Obesity Federation (WOF) has calculated a ‘risk score’ for each country’s likelihood of having or acquiring a major childhood obesity problem during the 2020s, taking account of current prevalence levels and risk for future obesity (based on stunting among infants, maternal obesity, maternal smoking, and breastfeeding rates).
Throughout the Atlas we have used colour-coding to indicate worse (red), moderate (amber) or better (green) levels for each of the indicators shown. Details for the colour-coding thresholds are given in the Atlas appendix.
The Atlas follows the 2018 joint WHO-WOF publication of Taking Action on Childhood Obesity http://s3-eu-west-1.amazonaws.com/wof-files/Report_-_Childhood_Obesity.pdf and continues our commitment to monitor and promote the recommendations of the WHO Commission on Ending Childhood Obesity https://www.who.int/end-childhood-obesity/publications/echo-plan-executive-summary/en/.
This present Atlas is the first of its type. It is launched as UN agencies are compiling a mid-term review of progress on the United Nations Decade of Action on Nutrition (2016-2025), to be tabled at the United Nations General Assembly in December 2019.
We are indebted to the NCD Collaboration http://ncdrisc.org/, and especially James Bentham, for assistance in providing predictions for future childhood obesity around the world. Both we and the Collaboration earnestly hope that the predictions turn out to be wrong, and that policies are enacted to ensure that far fewer children are living with obesity by the year 2030.
Tim Lobstein Hannah Brinsden
Note: In this document we use the term ‘infants’ to refer to children aged 0-5 years old.
We use the term ‘obesity’ to refer to a body mass index (BMI) at least two standard deviations above the mean, based on the World Health Organization’s growth standards and reference tables (https://www.who.int/nutgrowthdb/en/).
5Atlas of Childhood Obesity | Introduction

6Atlas of Childhood Obesity | Tables of Country Rankings
Tables of Country Rankings

7Atlas of Childhood Obesity | Tables of Country Rankings
Country
Number of persons with
obesity, aged 5-19, 2030
China 61,987,920India 27,481,141United States of America 16,986,603Indonesia 9,076,416Brazil 7,664,422Egypt 6,818,532Mexico 6,550,276Nigeria 6,020,182Pakistan 5,412,457South Africa 4,146,329Bangladesh 3,555,050Iraq 3,477,305Turkey 3,389,941Philippines 3,376,420Iran 3,023,603Algeria 2,703,722Russian Federation 2,550,607DR Congo 2,421,404Argentina 2,248,509Tanzania 2,185,879Thailand 2,152,598
Year 2020 2025 2030
World 158m 206m 254m
Predicted numbers of children with obesity in 2030Numbers of children age 5-19 years old living with obesity, predicted for the next decade.
Countries predicted to have over 1 million school-age children and youth living with obesity in 2030.
Country
Number of persons with
obesity, aged 5-19, 2030
Vietnam 1,939,173Ethiopia 1,926,697Saudi Arabia 1,864,250Malaysia 1,770,631Sudan 1,757,471Morocco 1,757,152Yemen 1,646,485Venezuela 1,611,444Colombia 1,583,123Syrian Arab Republic 1,552,255Kenya 1,463,954France 1,368,893Uganda 1,345,197Germany 1,318,415United Kingdom 1,309,702Italy 1,307,765Myanmar 1,288,929Afghanistan 1,286,177Guatemala 1,262,281Canada 1,109,002Peru 1,079,543

Country 20 at Highest Risk
Cook Islands 11
Kiribati 11
Micronesia 11
Niue 11
Palau 11
Puerto Rico 11
Swaziland 11
Tokelau 11
Bahamas 10.5
New Zealand 10.5
Taiwan 10.5
Tonga 10.5
United Arab Emirates 10.5
Dominica 10
Libya 10
Marshall Islands 10
Nauru 10
Palestine 10
Saint Vincent & the Grenadines 10
Tuvalu 10
Country 20 at Lowest Risk
Ethiopia 3.5
Bangladesh 4
India 4
Kenya 4
Liberia 4
Malawi 4
Niger 4
Burundi 4.5
Cambodia 4.5
Ghana 4.5
Japan 4.5
Madagascar 4.5
Nepal 4.5
Nigeria 4.5
Rwanda 4.5
Senegal 4.5
Tanzania 4.5
Uganda 4.5
Vietnam 5
Zambia 5
COUNTRY RANKINGS Twenty Highest And Lowest Countries
Child and adolescent obesity risk scoresRisk of having or acquiring a significant childhood obesity problem in the coming decade.
Risk score calculated from combined factors: maximum score is 11.
8Atlas of Childhood Obesity | Tables of Country Rankings

Country Latest Survey Highest 20
Ukraine 26.5
Libya 22.4
Montenegro 22.3
Georgia 19.9
Syrian Arab Republic 17.9
Bosnia and Herzegovina 17.4
Tonga 17.3
Lebanon 16.7
Albania 16.4
Kiribati 15.9
Egypt 15.7
Tunisia 14.2
Azerbaijan 14.1
Serbia 13.9
Papua New Guinea 13.7
Armenia 13.7
Bulgaria 13.6
South Africa 13.3
Paraguay 12.4
Algeria 12.4
Country Latest Survey Lowest 20
Senegal 0.9
Madagascar 1.1
Niger 1.1
Nepal 1.2
Mauritania 1.3
Burundi 1.4
Timor-Leste 1.4
Ivory Coast 1.5
Japan 1.5
Myanmar 1.5
Nigeria 1.5
Bangladesh 1.6
Burkina Faso 1.7
Benin 1.9
Central African Republic 1.9
Mali 1.9
Eritrea 2
Laos 2
Sri Lanka 2
Togo 2
COUNTRY RANKINGS Twenty Highest And Lowest Countries
Infant % overweight
9Atlas of Childhood Obesity | Tables of Country Rankings

CountryChildren aged 5-9
Highest 20
Cook Islands 40.7
Nauru 40.6
Palau 40.0
Niue 37.9
Tuvalu 35.4
Marshall Islands 35.3
Tonga 34.2
Tokelau 31.7
Kiribati 31.3
Micronesia 28.9
Samoa 28.5
Kuwait 25.7
Qatar 25.6
Puerto Rico 25.5
United States of America 25.4
Egypt 24.7
Argentina 24.4
Bahamas 23.9
United Arab Emirates 23.0
Bahrain 22.7
CountryChildren aged 5-9
Lowest 20
Burkina Faso 1.6
Ethiopia 2.1
Niger 2.3
Chad 2.5
Guinea 2.8
Rwanda 2.9
Uganda 2.9
Congo 3
Senegal 3
Burundi 3.1
Nigeria 3.1
Liberia 3.2
Malawi 3.2
Nepal 3.2
Madagascar 3.3
Togo 3.4
Eritrea 3.5
Ghana 3.5
DR Congo 3.6
Equatorial Guinea 3.7
COUNTRY RANKINGS Twenty Highest And Lowest Countries
Child obesity %, 2017
10Atlas of Childhood Obesity | Tables of Country Rankings

CountryChildren
aged 10-19 Highest 20
Nauru 32.3
Cook Islands 31.3
Palau 30.4
Niue 28.8
Tuvalu 26.4
Tonga 25.8
Marshall Islands 25.3
Tokelau 23.8
Kuwait 23.0
Kiribati 21.9
United States of America 21.0
Samoa 20.8
Micronesia 19.8
Qatar 17.9
Puerto Rico 17.6
Saudi Arabia 17.1
Bahamas 15.9
Bahrain 15.8
Egypt 15.6
New Zealand 15.3
CountryChildren
aged 10-19 Lowest 20
Ethiopia 0.8
Burkina Faso 0.9
Niger 1.1
Chad 1.2
Guinea 1.3
Madagascar 1.4
Nepal 1.4
Rwanda 1.4
Uganda 1.4
Burundi 1.5
Liberia 1.5
Senegal 1.5
India 1.6
Nigeria 1.6
Togo 1.6
Eritrea 1.7
Ghana 1.7
Malawi 1.7
Congo 1.8
Vietnam 1.8
COUNTRY RANKINGS Twenty Highest And Lowest Countries
Adolescent obesity %, 2017
11Atlas of Childhood Obesity | Tables of Country Rankings

CountryChildren aged 5-9
Highest 20
Cook Islands 45.9
Niue 44.8
Palau 44.7
Nauru 43.3
Tuvalu 42.8
Marshall Islands 41.1
Tonga 41.0
Tokelau 40.5
Kiribati 38.7
Micronesia 37.6
Samoa 37.1
China 32.0
Egypt 29.5
South Africa 28.2
Dominican Republic 27.7
Qatar 27.5
Puerto Rico 27.4
Argentina 27.2
Bahamas 27.1
Kuwait 26.9
CountryChildren aged 5-9
Lowest 20
Burkina Faso 5.5
Japan 5.5
Chad 5.9
Ethiopia 6
Niger 6
Senegal 6
Liberia 6.2
Guinea 6.4
Congo 6.6
Ghana 6.6
Uganda 7.1
Rwanda 7.2
Mozambique 7.3
Togo 7.3
Nigeria 7.5
Malawi 7.6
Sierra Leone 7.7
Equatorial Guinea 7.8
Central African Republic 7.9
Madagascar 8
COUNTRY RANKINGS Twenty Highest And Lowest Countries
Child obesity %, predicted 2030
12Atlas of Childhood Obesity | Tables of Country Rankings
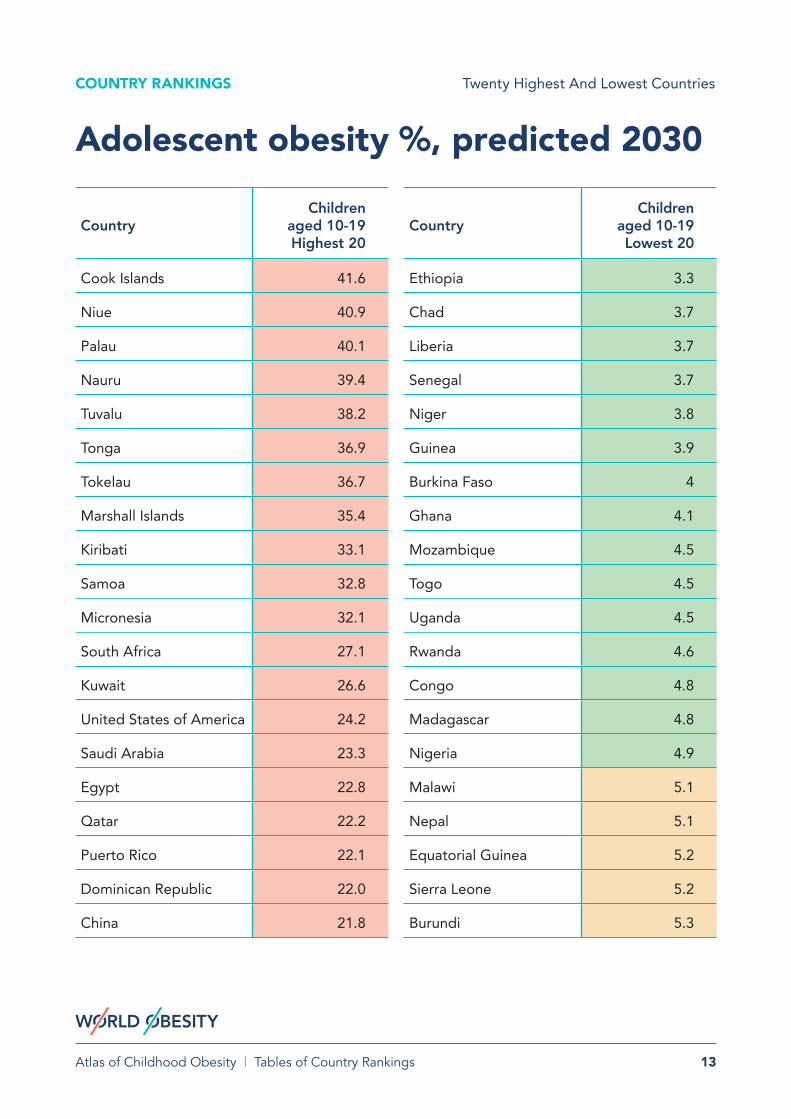
CountryChildren
aged 10-19 Highest 20
Cook Islands 41.6
Niue 40.9
Palau 40.1
Nauru 39.4
Tuvalu 38.2
Tonga 36.9
Tokelau 36.7
Marshall Islands 35.4
Kiribati 33.1
Samoa 32.8
Micronesia 32.1
South Africa 27.1
Kuwait 26.6
United States of America 24.2
Saudi Arabia 23.3
Egypt 22.8
Qatar 22.2
Puerto Rico 22.1
Dominican Republic 22.0
China 21.8
CountryChildren
aged 10-19 Lowest 20
Ethiopia 3.3
Chad 3.7
Liberia 3.7
Senegal 3.7
Niger 3.8
Guinea 3.9
Burkina Faso 4
Ghana 4.1
Mozambique 4.5
Togo 4.5
Uganda 4.5
Rwanda 4.6
Congo 4.8
Madagascar 4.8
Nigeria 4.9
Malawi 5.1
Nepal 5.1
Equatorial Guinea 5.2
Sierra Leone 5.2
Burundi 5.3
COUNTRY RANKINGS Twenty Highest And Lowest Countries
Adolescent obesity %, predicted 2030
13Atlas of Childhood Obesity | Tables of Country Rankings

14Atlas of Childhood Obesity | Country Report Cards
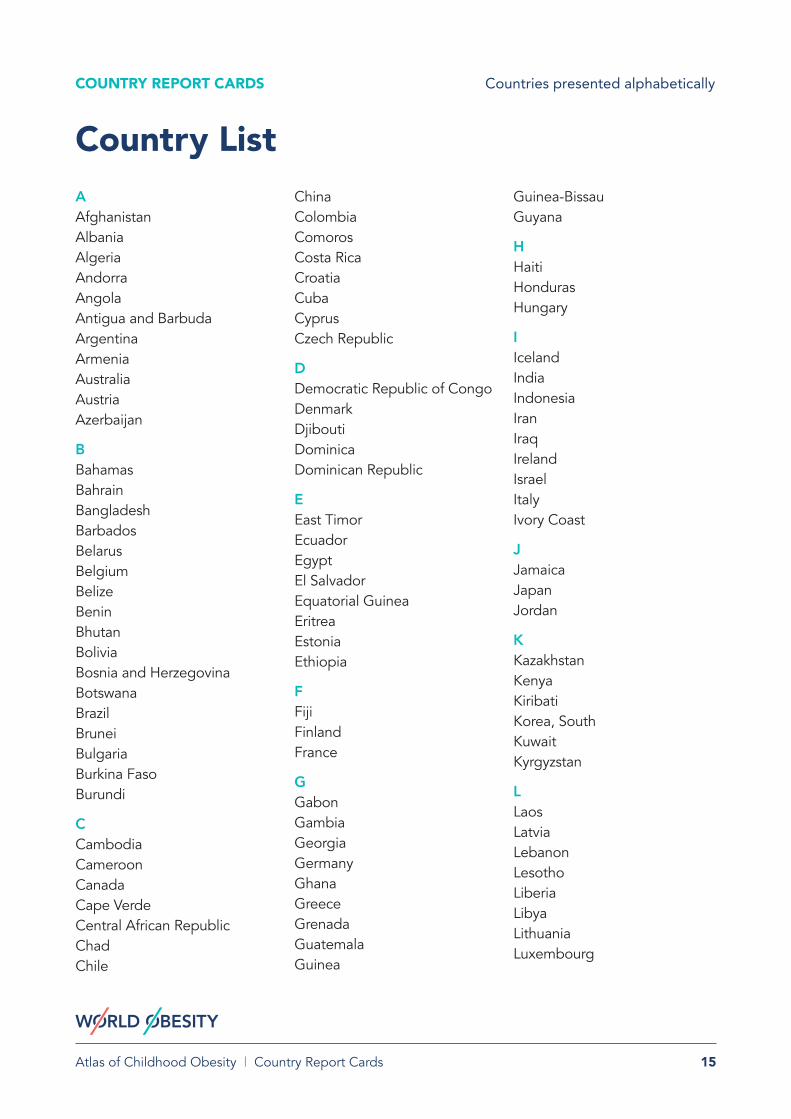
Country Report CardsCountries presented alphabetically
AAfghanistanAlbaniaAlgeriaAndorraAngolaAntigua and BarbudaArgentinaArmeniaAustraliaAustriaAzerbaijan
BBahamasBahrainBangladeshBarbadosBelarusBelgiumBelizeBeninBhutanBoliviaBosnia and HerzegovinaBotswanaBrazilBruneiBulgariaBurkina FasoBurundi
CCambodiaCameroonCanadaCape VerdeCentral African RepublicChadChile
ChinaColombiaComorosCosta RicaCroatiaCubaCyprusCzech Republic
DDemocratic Republic of CongoDenmarkDjiboutiDominicaDominican Republic
EEast TimorEcuadorEgyptEl SalvadorEquatorial GuineaEritreaEstoniaEthiopia
FFijiFinlandFrance
GGabonGambiaGeorgiaGermanyGhanaGreeceGrenadaGuatemalaGuinea
Guinea-BissauGuyana
HHaitiHondurasHungary
IIcelandIndiaIndonesiaIranIraqIrelandIsraelItalyIvory Coast
JJamaicaJapanJordan
KKazakhstanKenyaKiribatiKorea, SouthKuwaitKyrgyzstan
LLaosLatviaLebanonLesothoLiberiaLibyaLithuaniaLuxembourg
COUNTRY REPORT CARDS Countries presented alphabetically
Country List
15Atlas of Childhood Obesity | Country Report Cards

MMacedoniaMadagascarMalawiMalaysiaMaldivesMaliMaltaMarshall IslandsMauritaniaMauritiusMexicoMicronesiaMoldovaMongoliaMontenegroMoroccoMozambiqueMyanmar
NNamibiaNauruNepalNetherlandsNew ZealandNicaraguaNigerNigeriaNorway
OOman
PPakistanPalauPalestinePanamaPapua New Guinea
ParaguayPeruPhilippinesPolandPortugal
QQatar
RRepublic of the CongoRomaniaRussiaRwanda
SSaint Kitts and NevisSaint LuciaSaint Vincent and the GrenadinesSamoaSão Tomé and PríncipeSaudi ArabiaSenegalSerbiaSeychellesSierra LeoneSingaporeSlovakiaSloveniaSolomon IslandsSomaliaSouth AfricaSpainSri LankaSudanSurinameSwazilandSwedenSwitzerlandSyria
TTaiwanTajikistanTanzaniaThailandTogoTongaTrinidad and TobagoTunisiaTurkeyTurkmenistanTuvalu
U UgandaUkraineUnited Arab EmiratesUnited KingdomUnited StatesUruguayUzbekistan
VWXYVanuatuVenezuelaVietnamYemen
ZZambiaZimbabwe
COUNTRY REPORT CARDS Countries presented alphabetically
Country List
16Atlas of Childhood Obesity | Country Report Cards

17Atlas of Childhood Obesity | Country Report Cards
Afghanistan Latest survey: % infants overweight 5.4
2016: % boys aged 5-9 with obesity 4.2
2016: % girls aged 5-9 with obesity 4.2
2016: % boys aged 10-19 with obesity 2.3
2016: % girls aged 10-19 with obesity 2.5
2010: % adolescent boys insufficient physical activity
2010: % adolescent girls insufficient physical activity
2016: % women with obesity 8.0
Latest survey: % early initiation of breast-feeding 40.9
2020 estimate: % women smoking
Latest survey: % infants with stunting 40.9
Predicted 2030: % children aged 5-9 with obesity 11.5
Predicted 2030: % children aged 10-19 with obesity 7.9
Predicted 2030: number of children aged 5-9 with obesity 551,950
Predicted 2030: number of children aged 10-19 with obesity 734,227
Predicted 2030: number of children aged 5-19 with obesity 1,286,177
Existence of any policies on marketing of foods to children, 2017
Existence of policies to reduce physical inactivity, 2017
Existence of policies to reduce unhealthy diet related to NCDs, 2017
CHO RISK SCORE 4.5/11
CHANCE OF MEETING WHO 2025 TARGET
0%

18Atlas of Childhood Obesity | Country Report Cards
Albania Latest survey: % infants overweight 16.4
2016: % boys aged 5-9 with obesity 13.3
2016: % girls aged 5-9 with obesity 7.9
2016: % boys aged 10-19 with obesity 8
2016: % girls aged 10-19 with obesity 4.6
2010: % adolescent boys insufficient physical activity
2010: % adolescent girls insufficient physical activity
2016: % women with obesity 22.7
Latest survey: % early initiation of breast-feeding 43.0
2020 estimate: % women smoking 6.6
Latest survey: % infants with stunting 11.3
Predicted 2030: % children aged 5-9 with obesity 21.4
Predicted 2030: % children aged 10-19 with obesity 15.8
Predicted 2030: number of children aged 5-9 with obesity 44,406
Predicted 2030: number of children aged 10-19 with obesity 62,515
Predicted 2030: number of children aged 5-19 with obesity 106,921
Existence of any policies on marketing of foods to children, 2017
Existence of policies to reduce physical inactivity, 2017
Existence of policies to reduce unhealthy diet related to NCDs, 2017
CHO RISK SCORE 6.5/11
CHANCE OF MEETING WHO 2025 TARGET
0%

19Atlas of Childhood Obesity | Country Report Cards
Algeria Latest survey: % infants overweight 12.4
2016: % boys aged 5-9 with obesity 17.6
2016: % girls aged 5-9 with obesity 15.4
2016: % boys aged 10-19 with obesity 12
2016: % girls aged 10-19 with obesity 10.9
2010: % adolescent boys insufficient physical activity 75.9
2010: % adolescent girls insufficient physical activity 92.4
2016: % women with obesity 36.2
Latest survey: % early initiation of breast-feeding
2020 estimate: % women smoking
Latest survey: % infants with stunting 11.7
Predicted 2030: % children aged 5-9 with obesity 24.9
Predicted 2030: % children aged 10-19 with obesity 19.3
Predicted 2030: number of children aged 5-9 with obesity 986,824
Predicted 2030: number of children aged 10-19 with obesity 1,716,898
Predicted 2030: number of children aged 5-19 with obesity 2,703,722
Existence of any policies on marketing of foods to children, 2017
Existence of policies to reduce physical inactivity, 2017
Existence of policies to reduce unhealthy diet related to NCDs, 2017
CHO RISK SCORE 8/11
CHANCE OF MEETING WHO 2025 TARGET
2%

20Atlas of Childhood Obesity | Country Report Cards
Latest survey: % infants overweight
2016: % boys aged 5-9 with obesity 18.3
2016: % girls aged 5-9 with obesity 13
2016: % boys aged 10-19 with obesity 13.1
2016: % girls aged 10-19 with obesity 9
2010: % adolescent boys insufficient physical activity
2010: % adolescent girls insufficient physical activity
2016: % women with obesity 26.3
Latest survey: % early initiation of breast-feeding
2020 estimate: % women smoking 26.8
Latest survey: % infants with stunting
Predicted 2030: % children aged 5-9 with obesity 16.9
Predicted 2030: % children aged 10-19 with obesity 12.2
Predicted 2030: number of children aged 5-9 with obesity 639
Predicted 2030: number of children aged 10-19 with obesity 1,067
Predicted 2030: number of children aged 5-19 with obesity 1,706
Andorra
Existence of any policies on marketing of foods to children, 2017
Existence of policies to reduce physical inactivity, 2017
Existence of policies to reduce unhealthy diet related to NCDs, 2017
CHO RISK SCORE 7/11
CHANCE OF MEETING WHO 2025 TARGET
44%

21Atlas of Childhood Obesity | Country Report Cards
Angola Latest survey: % infants overweight 3.4
2016: % boys aged 5-9 with obesity 2.5
2016: % girls aged 5-9 with obesity 4
2016: % boys aged 10-19 with obesity 1.4
2016: % girls aged 10-19 with obesity 2.4
2010: % adolescent boys insufficient physical activity
2010: % adolescent girls insufficient physical activity
2016: % women with obesity 12.6
Latest survey: % early initiation of breast-feeding 48.3
2020 estimate: % women smoking
Latest survey: % infants with stunting 37.6
Predicted 2030: % children aged 5-9 with obesity 9.1
Predicted 2030: % children aged 10-19 with obesity 6.2
Predicted 2030: number of children aged 5-9 with obesity 444,281
Predicted 2030: number of children aged 10-19 with obesity 512,065
Predicted 2030: number of children aged 5-19 with obesity 956,345
Existence of any policies on marketing of foods to children, 2017
Existence of policies to reduce physical inactivity, 2017
Existence of policies to reduce unhealthy diet related to NCDs, 2017
CHO RISK SCORE 4/11
CHANCE OF MEETING WHO 2025 TARGET
1%
22Atlas of Childhood Obesity | Country Report Cards
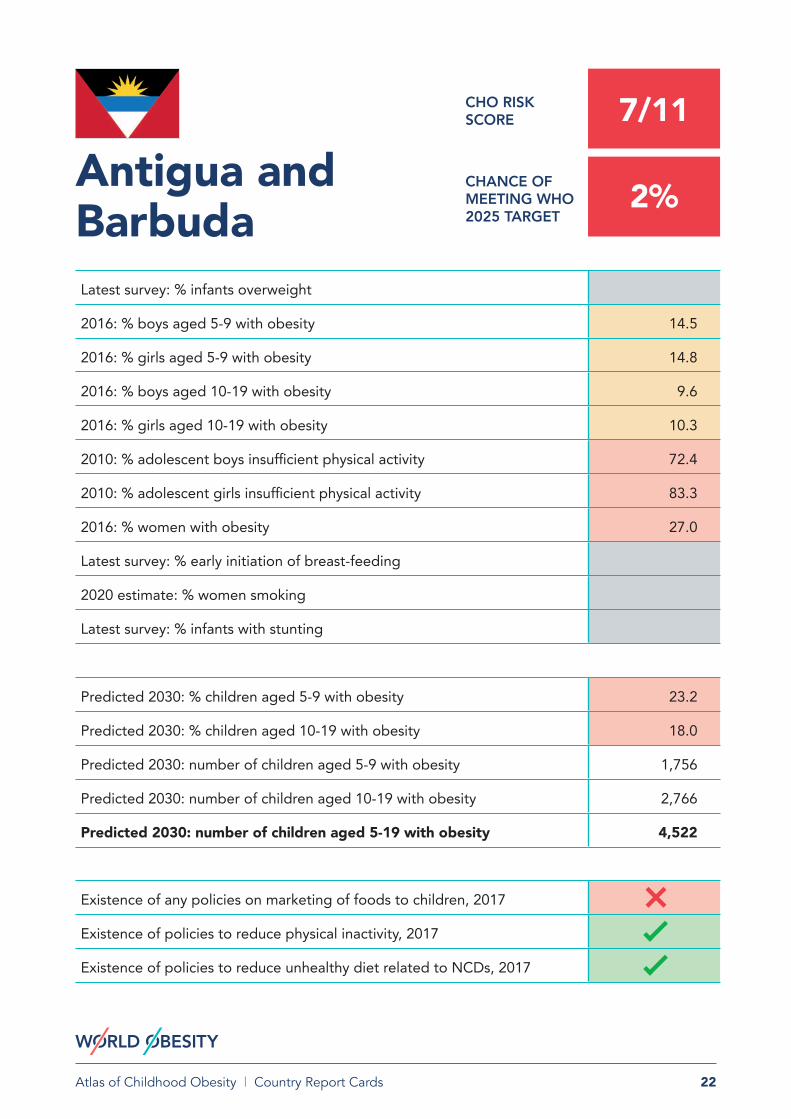
Antigua and Barbuda Latest survey: % infants overweight
2016: % boys aged 5-9 with obesity 14.5
2016: % girls aged 5-9 with obesity 14.8
2016: % boys aged 10-19 with obesity 9.6
2016: % girls aged 10-19 with obesity 10.3
2010: % adolescent boys insufficient physical activity 72.4
2010: % adolescent girls insufficient physical activity 83.3
2016: % women with obesity 27.0
Latest survey: % early initiation of breast-feeding
2020 estimate: % women smoking
Latest survey: % infants with stunting
Predicted 2030: % children aged 5-9 with obesity 23.2
Predicted 2030: % children aged 10-19 with obesity 18.0
Predicted 2030: number of children aged 5-9 with obesity 1,756
Predicted 2030: number of children aged 10-19 with obesity 2,766
Predicted 2030: number of children aged 5-19 with obesity 4,522
Existence of any policies on marketing of foods to children, 2017
Existence of policies to reduce physical inactivity, 2017
Existence of policies to reduce unhealthy diet related to NCDs, 2017
CHO RISK SCORE 7/11
CHANCE OF MEETING WHO 2025 TARGET
2%

23Atlas of Childhood Obesity | Country Report Cards
Argentina Latest survey: % infants overweight 9.9
2016: % boys aged 5-9 with obesity 25.6
2016: % girls aged 5-9 with obesity 17.8
2016: % boys aged 10-19 with obesity 18.3
2016: % girls aged 10-19 with obesity 10.4
2010: % adolescent boys insufficient physical activity 78
2010: % adolescent girls insufficient physical activity 87.7
2016: % women with obesity 30.1
Latest survey: % early initiation of breast-feeding
2020 estimate: % women smoking 15
Latest survey: % infants with stunting 8.2
Predicted 2030: % children aged 5-9 with obesity 27.2
Predicted 2030: % children aged 10-19 with obesity 20.0
Predicted 2030: number of children aged 5-9 with obesity 898,630
Predicted 2030: number of children aged 10-19 with obesity 1,349,879
Predicted 2030: number of children aged 5-19 with obesity 2,248,509
Existence of any policies on marketing of foods to children, 2017
Existence of policies to reduce physical inactivity, 2017
Existence of policies to reduce unhealthy diet related to NCDs, 2017
CHO RISK SCORE 8.5/11
CHANCE OF MEETING WHO 2025 TARGET
10%

24Atlas of Childhood Obesity | Country Report Cards
Armenia Latest survey: % infants overweight 13.7
2016: % boys aged 5-9 with obesity 7.4
2016: % girls aged 5-9 with obesity 5.8
2016: % boys aged 10-19 with obesity 4.2
2016: % girls aged 10-19 with obesity 3.4
2010: % adolescent boys insufficient physical activity 73
2010: % adolescent girls insufficient physical activity 79.8
2016: % women with obesity 24.0
Latest survey: % early initiation of breast-feeding 40.9
2020 estimate: % women smoking 1.3
Latest survey: % infants with stunting 9.4
Predicted 2030: % children aged 5-9 with obesity 10.9
Predicted 2030: % children aged 10-19 with obesity 7.1
Predicted 2030: number of children aged 5-9 with obesity 17,431
Predicted 2030: number of children aged 10-19 with obesity 26,242
Predicted 2030: number of children aged 5-19 with obesity 43,673
Existence of any policies on marketing of foods to children, 2017
Existence of policies to reduce physical inactivity, 2017
Existence of policies to reduce unhealthy diet related to NCDs, 2017
CHO RISK SCORE 6/11
CHANCE OF MEETING WHO 2025 TARGET
11%
25Atlas of Childhood Obesity | Country Report Cards
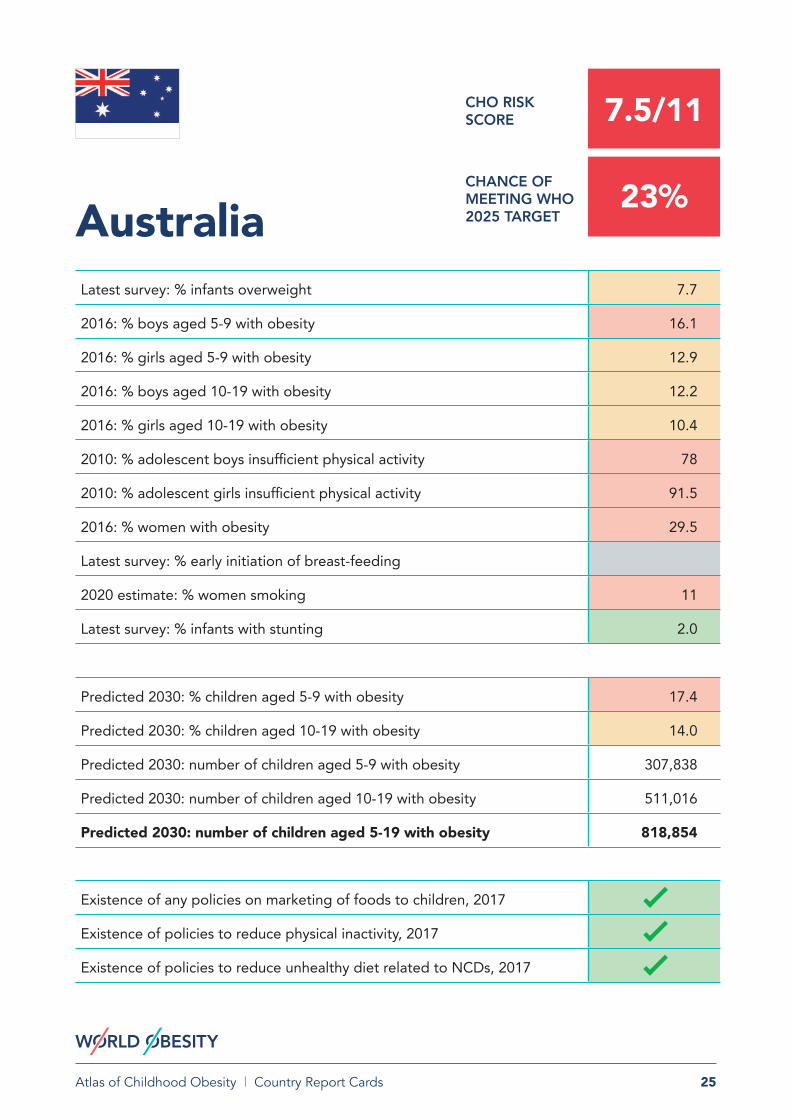
Australia Latest survey: % infants overweight 7.7
2016: % boys aged 5-9 with obesity 16.1
2016: % girls aged 5-9 with obesity 12.9
2016: % boys aged 10-19 with obesity 12.2
2016: % girls aged 10-19 with obesity 10.4
2010: % adolescent boys insufficient physical activity 78
2010: % adolescent girls insufficient physical activity 91.5
2016: % women with obesity 29.5
Latest survey: % early initiation of breast-feeding
2020 estimate: % women smoking 11
Latest survey: % infants with stunting 2.0
Predicted 2030: % children aged 5-9 with obesity 17.4
Predicted 2030: % children aged 10-19 with obesity 14.0
Predicted 2030: number of children aged 5-9 with obesity 307,838
Predicted 2030: number of children aged 10-19 with obesity 511,016
Predicted 2030: number of children aged 5-19 with obesity 818,854
Existence of any policies on marketing of foods to children, 2017
Existence of policies to reduce physical inactivity, 2017
Existence of policies to reduce unhealthy diet related to NCDs, 2017
CHO RISK SCORE 7.5/11
CHANCE OF MEETING WHO 2025 TARGET
23%

26Atlas of Childhood Obesity | Country Report Cards
Austria Latest survey: % infants overweight
2016: % boys aged 5-9 with obesity 13
2016: % girls aged 5-9 with obesity 7.8
2016: % boys aged 10-19 with obesity 10.3
2016: % girls aged 10-19 with obesity 5.1
2010: % adolescent boys insufficient physical activity 65.6
2010: % adolescent girls insufficient physical activity 84.9
2016: % women with obesity 19.1
Latest survey: % early initiation of breast-feeding
2020 estimate: % women smoking 33.3
Latest survey: % infants with stunting
Predicted 2030: % children aged 5-9 with obesity 14.5
Predicted 2030: % children aged 10-19 with obesity 11.4
Predicted 2030: number of children aged 5-9 with obesity 66,047
Predicted 2030: number of children aged 10-19 with obesity 103,164
Predicted 2030: number of children aged 5-19 with obesity 169,212
Existence of any policies on marketing of foods to children, 2017
Existence of policies to reduce physical inactivity, 2017
Existence of policies to reduce unhealthy diet related to NCDs, 2017
CHO RISK SCORE 7/11
CHANCE OF MEETING WHO 2025 TARGET
11%
27Atlas of Childhood Obesity | Country Report Cards
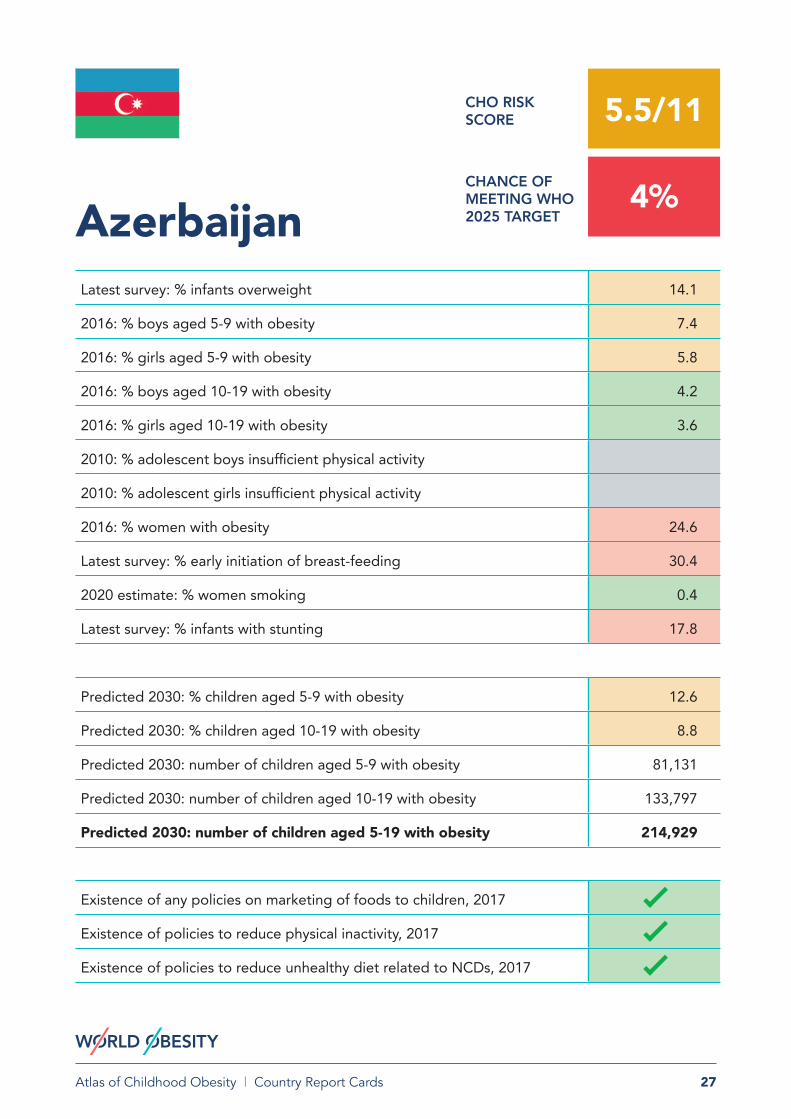
Latest survey: % infants overweight 14.1
2016: % boys aged 5-9 with obesity 7.4
2016: % girls aged 5-9 with obesity 5.8
2016: % boys aged 10-19 with obesity 4.2
2016: % girls aged 10-19 with obesity 3.6
2010: % adolescent boys insufficient physical activity
2010: % adolescent girls insufficient physical activity
2016: % women with obesity 24.6
Latest survey: % early initiation of breast-feeding 30.4
2020 estimate: % women smoking 0.4
Latest survey: % infants with stunting 17.8
Predicted 2030: % children aged 5-9 with obesity 12.6
Predicted 2030: % children aged 10-19 with obesity 8.8
Predicted 2030: number of children aged 5-9 with obesity 81,131
Predicted 2030: number of children aged 10-19 with obesity 133,797
Predicted 2030: number of children aged 5-19 with obesity 214,929
Azerbaijan
Existence of any policies on marketing of foods to children, 2017
Existence of policies to reduce physical inactivity, 2017
Existence of policies to reduce unhealthy diet related to NCDs, 2017
CHO RISK SCORE 5.5/11
CHANCE OF MEETING WHO 2025 TARGET
4%

28Atlas of Childhood Obesity | Country Report Cards
Latest survey: % infants overweight
2016: % boys aged 5-9 with obesity 22.2
2016: % girls aged 5-9 with obesity 20.3
2016: % boys aged 10-19 with obesity 15.7
2016: % girls aged 10-19 with obesity 14.9
2010: % adolescent boys insufficient physical activity 81
2010: % adolescent girls insufficient physical activity 87.9
2016: % women with obesity 39.5
Latest survey: % early initiation of breast-feeding
2020 estimate: % women smoking
Latest survey: % infants with stunting
Predicted 2030: % children aged 5-9 with obesity 27.1
Predicted 2030: % children aged 10-19 with obesity 21.5
Predicted 2030: number of children aged 5-9 with obesity 8,025
Predicted 2030: number of children aged 10-19 with obesity 12,749
Predicted 2030: number of children aged 5-19 with obesity 20,774
Bahamas
Existence of any policies on marketing of foods to children, 2017
Existence of policies to reduce physical inactivity, 2017
Existence of policies to reduce unhealthy diet related to NCDs, 2017
CHO RISK SCORE 8.5/11
CHANCE OF MEETING WHO 2025 TARGET
10%

29Atlas of Childhood Obesity | Country Report Cards
Bahrain Latest survey: % infants overweight 7.5
2016: % boys aged 5-9 with obesity 22
2016: % girls aged 5-9 with obesity 18.3
2016: % boys aged 10-19 with obesity 16.4
2016: % girls aged 10-19 with obesity 14.5
2010: % adolescent boys insufficient physical activity
2010: % adolescent girls insufficient physical activity
2016: % women with obesity 38.2
Latest survey: % early initiation of breast-feeding
2020 estimate: % women smoking 9
Latest survey: % infants with stunting 13.6
Predicted 2030: % children aged 5-9 with obesity 25.8
Predicted 2030: % children aged 10-19 with obesity 21.0
Predicted 2030: number of children aged 5-9 with obesity 22,499
Predicted 2030: number of children aged 10-19 with obesity 41,752
Predicted 2030: number of children aged 5-19 with obesity 64,251
Existence of any policies on marketing of foods to children, 2017
Existence of policies to reduce physical inactivity, 2017
Existence of policies to reduce unhealthy diet related to NCDs, 2017
CHO RISK SCORE 7.5/11
CHANCE OF MEETING WHO 2025 TARGET
8%

30Atlas of Childhood Obesity | Country Report Cards
Bangladesh Latest survey: % infants overweight 1.6
2016: % boys aged 5-9 with obesity 4.4
2016: % girls aged 5-9 with obesity 3.2
2016: % boys aged 10-19 with obesity 2.3
2016: % girls aged 10-19 with obesity 1.8
2010: % adolescent boys insufficient physical activity
2010: % adolescent girls insufficient physical activity
2016: % women with obesity 5.2
Latest survey: % early initiation of breast-feeding 50.8
2020 estimate: % women smoking 0.3
Latest survey: % infants with stunting 36.2
Predicted 2030: % children aged 5-9 with obesity 10.6
Predicted 2030: % children aged 10-19 with obesity 7.0
Predicted 2030: number of children aged 5-9 with obesity 1,495,618
Predicted 2030: number of children aged 10-19 with obesity 2,059,431
Predicted 2030: number of children aged 5-19 with obesity 3,555,050
Existence of any policies on marketing of foods to children, 2017
Existence of policies to reduce physical inactivity, 2017
Existence of policies to reduce unhealthy diet related to NCDs, 2017
CHO RISK SCORE 3/11
CHANCE OF MEETING WHO 2025 TARGET
0%

31Atlas of Childhood Obesity | Country Report Cards
Latest survey: % infants overweight 12.2
2016: % boys aged 5-9 with obesity 15.8
2016: % girls aged 5-9 with obesity 15.1
2016: % boys aged 10-19 with obesity 10.6
2016: % girls aged 10-19 with obesity 10.9
2010: % adolescent boys insufficient physical activity 75.3
2010: % adolescent girls insufficient physical activity 86.7
2016: % women with obesity 32.6
Latest survey: % early initiation of breast-feeding
2020 estimate: % women smoking 0.8
Latest survey: % infants with stunting 7.7
Predicted 2030: % children aged 5-9 with obesity 25.0
Predicted 2030: % children aged 10-19 with obesity 19.8
Predicted 2030: number of children aged 5-9 with obesity 4,477
Predicted 2030: number of children aged 10-19 with obesity 7,171
Predicted 2030: number of children aged 5-19 with obesity 11,648
Barbados
Existence of any policies on marketing of foods to children, 2017
Existence of policies to reduce physical inactivity, 2017
Existence of policies to reduce unhealthy diet related to NCDs, 2017
CHO RISK SCORE 7.5/11
CHANCE OF MEETING WHO 2025 TARGET
1%

32Atlas of Childhood Obesity | Country Report Cards
Belarus Latest survey: % infants overweight 9.7
2016: % boys aged 5-9 with obesity 13
2016: % girls aged 5-9 with obesity 6.4
2016: % boys aged 10-19 with obesity 8.7
2016: % girls aged 10-19 with obesity 3.9
2010: % adolescent boys insufficient physical activity
2010: % adolescent girls insufficient physical activity
2016: % women with obesity 27.3
Latest survey: % early initiation of breast-feeding
2020 estimate: % women smoking 9.8
Latest survey: % infants with stunting 4.5
Predicted 2030: % children aged 5-9 with obesity 15.5
Predicted 2030: % children aged 10-19 with obesity 11.3
Predicted 2030: number of children aged 5-9 with obesity 67,452
Predicted 2030: number of children aged 10-19 with obesity 111,244
Predicted 2030: number of children aged 5-19 with obesity 178,695
Existence of any policies on marketing of foods to children, 2017
Existence of policies to reduce physical inactivity, 2017
Existence of policies to reduce unhealthy diet related to NCDs, 2017
CHO RISK SCORE 5/11
CHANCE OF MEETING WHO 2025 TARGET
7%

33Atlas of Childhood Obesity | Country Report Cards
Latest survey: % infants overweight
2016: % boys aged 5-9 with obesity 9.8
2016: % girls aged 5-9 with obesity 7.4
2016: % boys aged 10-19 with obesity 7.2
2016: % girls aged 10-19 with obesity 4.9
2010: % adolescent boys insufficient physical activity 77.5
2010: % adolescent girls insufficient physical activity 87.5
2016: % women with obesity 21.9
Latest survey: % early initiation of breast-feeding
2020 estimate: % women smoking 18.9
Latest survey: % infants with stunting
Predicted 2030: % children aged 5-9 with obesity 9.7
Predicted 2030: % children aged 10-19 with obesity 7.0
Predicted 2030: number of children aged 5-9 with obesity 63,072
Predicted 2030: number of children aged 10-19 with obesity 94,355
Predicted 2030: number of children aged 5-19 with obesity 157,426
Belgium
Existence of any policies on marketing of foods to children, 2017
Existence of policies to reduce physical inactivity, 2017
Existence of policies to reduce unhealthy diet related to NCDs, 2017
CHO RISK SCORE 7/11
CHANCE OF MEETING WHO 2025 TARGET
42%

34Atlas of Childhood Obesity | Country Report Cards
Latest survey: % infants overweight 7.3
2016: % boys aged 5-9 with obesity 16
2016: % girls aged 5-9 with obesity 14.7
2016: % boys aged 10-19 with obesity 10.8
2016: % girls aged 10-19 with obesity 10.4
2010: % adolescent boys insufficient physical activity 75.1
2010: % adolescent girls insufficient physical activity 82.2
2016: % women with obesity 32.7
Latest survey: % early initiation of breast-feeding
2020 estimate: % women smoking
Latest survey: % infants with stunting 15.0
Predicted 2030: % children aged 5-9 with obesity 23.3
Predicted 2030: % children aged 10-19 with obesity 18.1
Predicted 2030: number of children aged 5-9 with obesity 9,639
Predicted 2030: number of children aged 10-19 with obesity 14,674
Predicted 2030: number of children aged 5-19 with obesity 24,313
Belize
Existence of any policies on marketing of foods to children, 2017
Existence of policies to reduce physical inactivity, 2017
Existence of policies to reduce unhealthy diet related to NCDs, 2017
CHO RISK SCORE 7.5/11
CHANCE OF MEETING WHO 2025 TARGET
4%

35Atlas of Childhood Obesity | Country Report Cards
Latest survey: % infants overweight 1.9
2016: % boys aged 5-9 with obesity 2.1
2016: % girls aged 5-9 with obesity 5.1
2016: % boys aged 10-19 with obesity 1.1
2016: % girls aged 10-19 with obesity 3.1
2010: % adolescent boys insufficient physical activity 72.8
2010: % adolescent girls insufficient physical activity 76.8
2016: % women with obesity 14.8
Latest survey: % early initiation of breast-feeding
2020 estimate: % women smoking 0.8
Latest survey: % infants with stunting 32.2
Predicted 2030: % children aged 5-9 with obesity 8.3
Predicted 2030: % children aged 10-19 with obesity 5.6
Predicted 2030: number of children aged 5-9 with obesity 158,819
Predicted 2030: number of children aged 10-19 with obesity 189,830
Predicted 2030: number of children aged 5-19 with obesity 348,650
Benin
Existence of any policies on marketing of foods to children, 2017
Existence of policies to reduce physical inactivity, 2017
Existence of policies to reduce unhealthy diet related to NCDs, 2017
CHO RISK SCORE 4.5/11
CHANCE OF MEETING WHO 2025 TARGET
3%

36Atlas of Childhood Obesity | Country Report Cards
Latest survey: % infants overweight 7.6
2016: % boys aged 5-9 with obesity 5.8
2016: % girls aged 5-9 with obesity 3.5
2016: % boys aged 10-19 with obesity 3.2
2016: % girls aged 10-19 with obesity 1.9
2010: % adolescent boys insufficient physical activity
2010: % adolescent girls insufficient physical activity
2016: % women with obesity 8.9
Latest survey: % early initiation of breast-feeding
2020 estimate: % women smoking
Latest survey: % infants with stunting 33.5
Predicted 2030: % children aged 5-9 with obesity 12.1
Predicted 2030: % children aged 10-19 with obesity 8.2
Predicted 2030: number of children aged 5-9 with obesity 7,923
Predicted 2030: number of children aged 10-19 with obesity 11,270
Predicted 2030: number of children aged 5-19 with obesity 19,193
Bhutan
Existence of any policies on marketing of foods to children, 2017
Existence of policies to reduce physical inactivity, 2017
Existence of policies to reduce unhealthy diet related to NCDs, 2017
CHO RISK SCORE 4.5/11
CHANCE OF MEETING WHO 2025 TARGET
0%
37Atlas of Childhood Obesity | Country Report Cards
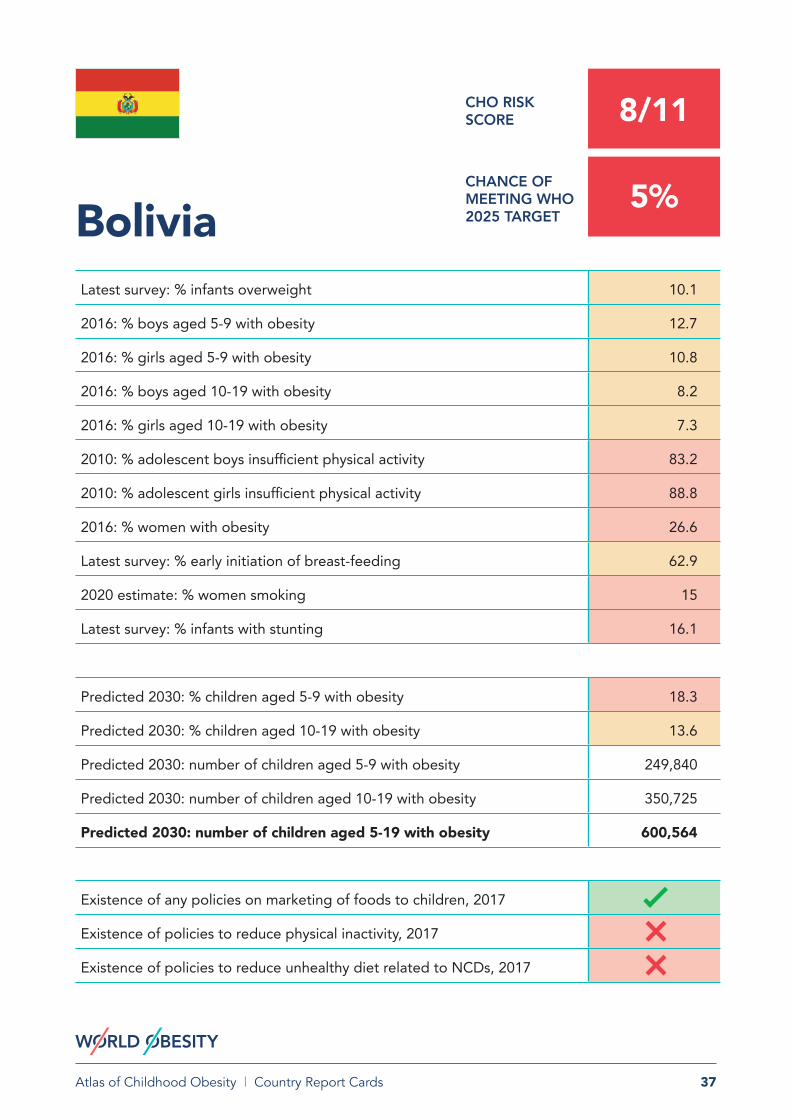
Latest survey: % infants overweight 10.1
2016: % boys aged 5-9 with obesity 12.7
2016: % girls aged 5-9 with obesity 10.8
2016: % boys aged 10-19 with obesity 8.2
2016: % girls aged 10-19 with obesity 7.3
2010: % adolescent boys insufficient physical activity 83.2
2010: % adolescent girls insufficient physical activity 88.8
2016: % women with obesity 26.6
Latest survey: % early initiation of breast-feeding 62.9
2020 estimate: % women smoking 15
Latest survey: % infants with stunting 16.1
Predicted 2030: % children aged 5-9 with obesity 18.3
Predicted 2030: % children aged 10-19 with obesity 13.6
Predicted 2030: number of children aged 5-9 with obesity 249,840
Predicted 2030: number of children aged 10-19 with obesity 350,725
Predicted 2030: number of children aged 5-19 with obesity 600,564
Bolivia
Existence of any policies on marketing of foods to children, 2017
Existence of policies to reduce physical inactivity, 2017
Existence of policies to reduce unhealthy diet related to NCDs, 2017
CHO RISK SCORE 8/11
CHANCE OF MEETING WHO 2025 TARGET
5%

38Atlas of Childhood Obesity | Country Report Cards
Latest survey: % infants overweight 17.4
2016: % boys aged 5-9 with obesity 9.6
2016: % girls aged 5-9 with obesity 6.3
2016: % boys aged 10-19 with obesity 5.4
2016: % girls aged 10-19 with obesity 3.7
2010: % adolescent boys insufficient physical activity
2010: % adolescent girls insufficient physical activity
2016: % women with obesity 19.3
Latest survey: % early initiation of breast-feeding
2020 estimate: % women smoking 28.6
Latest survey: % infants with stunting 8.9
Predicted 2030: % children aged 5-9 with obesity 15.8
Predicted 2030: % children aged 10-19 with obesity 11.1
Predicted 2030: number of children aged 5-9 with obesity 29,031
Predicted 2030: number of children aged 10-19 with obesity 38,749
Predicted 2030: number of children aged 5-19 with obesity 67,779
Bosnia and Herzegovina
Existence of any policies on marketing of foods to children, 2017
Existence of policies to reduce physical inactivity, 2017
Existence of policies to reduce unhealthy diet related to NCDs, 2017
CHO RISK SCORE 6.5/11
CHANCE OF MEETING WHO 2025 TARGET
1%

39Atlas of Childhood Obesity | Country Report Cards
Botswana Latest survey: % infants overweight 11.2
2016: % boys aged 5-9 with obesity 5
2016: % girls aged 5-9 with obesity 11.6
2016: % boys aged 10-19 with obesity 2.7
2016: % girls aged 10-19 with obesity 7.8
2010: % adolescent boys insufficient physical activity 87.3
2010: % adolescent girls insufficient physical activity 88.7
2016: % women with obesity 30.5
Latest survey: % early initiation of breast-feeding
2020 estimate: % women smoking
Latest survey: % infants with stunting 31.4
Predicted 2030: % children aged 5-9 with obesity 17.5
Predicted 2030: % children aged 10-19 with obesity 12.9
Predicted 2030: number of children aged 5-9 with obesity 39,270
Predicted 2030: number of children aged 10-19 with obesity 59,066
Predicted 2030: number of children aged 5-19 with obesity 98,336
Existence of any policies on marketing of foods to children, 2017
Existence of policies to reduce physical inactivity, 2017
Existence of policies to reduce unhealthy diet related to NCDs, 2017
CHO RISK SCORE 7/11
CHANCE OF MEETING WHO 2025 TARGET
1%

40Atlas of Childhood Obesity | Country Report Cards
Latest survey: % infants overweight 6.4
2016: % boys aged 5-9 with obesity 17.6
2016: % girls aged 5-9 with obesity 12.4
2016: % boys aged 10-19 with obesity 10.1
2016: % girls aged 10-19 with obesity 7.8
2010: % adolescent boys insufficient physical activity 82
2010: % adolescent girls insufficient physical activity 91.4
2016: % women with obesity 26.4
Latest survey: % early initiation of breast-feeding 29.8
2020 estimate: % women smoking 9.7
Latest survey: % infants with stunting 7.0
Predicted 2030: % children aged 5-9 with obesity 22.8
Predicted 2030: % children aged 10-19 with obesity 15.7
Predicted 2030: number of children aged 5-9 with obesity 3,146,604
Predicted 2030: number of children aged 10-19 with obesity 4,517,818
Predicted 2030: number of children aged 5-19 with obesity 7,664,422
Brazil
Existence of any policies on marketing of foods to children, 2017
Existence of policies to reduce physical inactivity, 2017
Existence of policies to reduce unhealthy diet related to NCDs, 2017
CHO RISK SCORE 8/11
CHANCE OF MEETING WHO 2025 TARGET
2%

41Atlas of Childhood Obesity | Country Report Cards
Latest survey: % infants overweight 8.3
2016: % boys aged 5-9 with obesity 22.9
2016: % girls aged 5-9 with obesity 12.5
2016: % boys aged 10-19 with obesity 16
2016: % girls aged 10-19 with obesity 8.6
2010: % adolescent boys insufficient physical activity 80.6
2010: % adolescent girls insufficient physical activity 94.6
2016: % women with obesity 16.4
Latest survey: % early initiation of breast-feeding
2020 estimate: % women smoking 2.7
Latest survey: % infants with stunting 19.7
Predicted 2030: % children aged 5-9 with obesity 26.7
Predicted 2030: % children aged 10-19 with obesity 20.8
Predicted 2030: number of children aged 5-9 with obesity 8,325
Predicted 2030: number of children aged 10-19 with obesity 13,313
Predicted 2030: number of children aged 5-19 with obesity 21,637
Brunei
Existence of any policies on marketing of foods to children, 2017
Existence of policies to reduce physical inactivity, 2017
Existence of policies to reduce unhealthy diet related to NCDs, 2017
CHO RISK SCORE 8.5/11
CHANCE OF MEETING WHO 2025 TARGET
2%

42Atlas of Childhood Obesity | Country Report Cards
Latest survey: % infants overweight 13.6
2016: % boys aged 5-9 with obesity 17.1
2016: % girls aged 5-9 with obesity 10.2
2016: % boys aged 10-19 with obesity 11.8
2016: % girls aged 10-19 with obesity 6.6
2010: % adolescent boys insufficient physical activity 68.3
2010: % adolescent girls insufficient physical activity 79.9
2016: % women with obesity 25.3
Latest survey: % early initiation of breast-feeding
2020 estimate: % women smoking 24.9
Latest survey: % infants with stunting 8.8
Predicted 2030: % children aged 5-9 with obesity 21.4
Predicted 2030: % children aged 10-19 with obesity 16.2
Predicted 2030: number of children aged 5-9 with obesity 61,686
Predicted 2030: number of children aged 10-19 with obesity 104,217
Predicted 2030: number of children aged 5-19 with obesity 165,903
Bulgaria
Existence of any policies on marketing of foods to children, 2017
Existence of policies to reduce physical inactivity, 2017
Existence of policies to reduce unhealthy diet related to NCDs, 2017
CHO RISK SCORE 7.5/11
CHANCE OF MEETING WHO 2025 TARGET
3%

43Atlas of Childhood Obesity | Country Report Cards
Latest survey: % infants overweight 1.7
2016: % boys aged 5-9 with obesity 1.1
2016: % girls aged 5-9 with obesity 1.5
2016: % boys aged 10-19 with obesity 0.6
2016: % girls aged 10-19 with obesity 1.1
2010: % adolescent boys insufficient physical activity
2010: % adolescent girls insufficient physical activity
2016: % women with obesity 8.5
Latest survey: % early initiation of breast-feeding 42.2
2020 estimate: % women smoking 3.6
Latest survey: % infants with stunting 21.1
Predicted 2030: % children aged 5-9 with obesity 5.5
Predicted 2030: % children aged 10-19 with obesity 4.0
Predicted 2030: number of children aged 5-9 with obesity 194,042
Predicted 2030: number of children aged 10-19 with obesity 243,895
Predicted 2030: number of children aged 5-19 with obesity 437,937
Burkina Faso
Existence of any policies on marketing of foods to children, 2017
Existence of policies to reduce physical inactivity, 2017
Existence of policies to reduce unhealthy diet related to NCDs, 2017
CHO RISK SCORE 4/11
CHANCE OF MEETING WHO 2025 TARGET
0%

44Atlas of Childhood Obesity | Country Report Cards
Latest survey: % infants overweight 1.4
2016: % boys aged 5-9 with obesity 1.7
2016: % girls aged 5-9 with obesity 3.4
2016: % boys aged 10-19 with obesity 0.9
2016: % girls aged 10-19 with obesity 1.9
2010: % adolescent boys insufficient physical activity
2010: % adolescent girls insufficient physical activity
2016: % women with obesity 9.0
Latest survey: % early initiation of breast-feeding 85.1
2020 estimate: % women smoking
Latest survey: % infants with stunting 55.9
Predicted 2030: % children aged 5-9 with obesity 8.1
Predicted 2030: % children aged 10-19 with obesity 5.3
Predicted 2030: number of children aged 5-9 with obesity 183,052
Predicted 2030: number of children aged 10-19 with obesity 211,145
Predicted 2030: number of children aged 5-19 with obesity 394,196
Burundi
Existence of any policies on marketing of foods to children, 2017
Existence of policies to reduce physical inactivity, 2017
Existence of policies to reduce unhealthy diet related to NCDs, 2017
CHO RISK SCORE 3/11
CHANCE OF MEETING WHO 2025 TARGET
1%

45Atlas of Childhood Obesity | Country Report Cards
Latest survey: % infants overweight 2.2
2016: % boys aged 5-9 with obesity 7
2016: % girls aged 5-9 with obesity 1.9
2016: % boys aged 10-19 with obesity 4.1
2016: % girls aged 10-19 with obesity 0.8
2010: % adolescent boys insufficient physical activity 91.6
2010: % adolescent girls insufficient physical activity 94.8
2016: % women with obesity 5.1
Latest survey: % early initiation of breast-feeding 62.6
2020 estimate: % women smoking 2
Latest survey: % infants with stunting 32.4
Predicted 2030: % children aged 5-9 with obesity 11.5
Predicted 2030: % children aged 10-19 with obesity 7.7
Predicted 2030: number of children aged 5-9 with obesity 194,018
Predicted 2030: number of children aged 10-19 with obesity 269,353
Predicted 2030: number of children aged 5-19 with obesity 463,371
Cambodia
Existence of any policies on marketing of foods to children, 2017
Existence of policies to reduce physical inactivity, 2017
Existence of policies to reduce unhealthy diet related to NCDs, 2017
CHO RISK SCORE 4.5/11
CHANCE OF MEETING WHO 2025 TARGET
1%

46Atlas of Childhood Obesity | Country Report Cards
Cameroon Latest survey: % infants overweight 6.7
2016: % boys aged 5-9 with obesity 2.2
2016: % girls aged 5-9 with obesity 5.3
2016: % boys aged 10-19 with obesity 1.2
2016: % girls aged 10-19 with obesity 3.4
2010: % adolescent boys insufficient physical activity
2010: % adolescent girls insufficient physical activity
2016: % women with obesity 17.2
Latest survey: % early initiation of breast-feeding
2020 estimate: % women smoking 0.9
Latest survey: % infants with stunting 31.7
Predicted 2030: % children aged 5-9 with obesity 8.2
Predicted 2030: % children aged 10-19 with obesity 5.5
Predicted 2030: number of children aged 5-9 with obesity 344,566
Predicted 2030: number of children aged 10-19 with obesity 410,945
Predicted 2030: number of children aged 5-19 with obesity 755,511
Existence of any policies on marketing of foods to children, 2017
Existence of policies to reduce physical inactivity, 2017
Existence of policies to reduce unhealthy diet related to NCDs, 2017
CHO RISK SCORE 4.5/11
CHANCE OF MEETING WHO 2025 TARGET
5%
46
47Atlas of Childhood Obesity | Country Report Cards
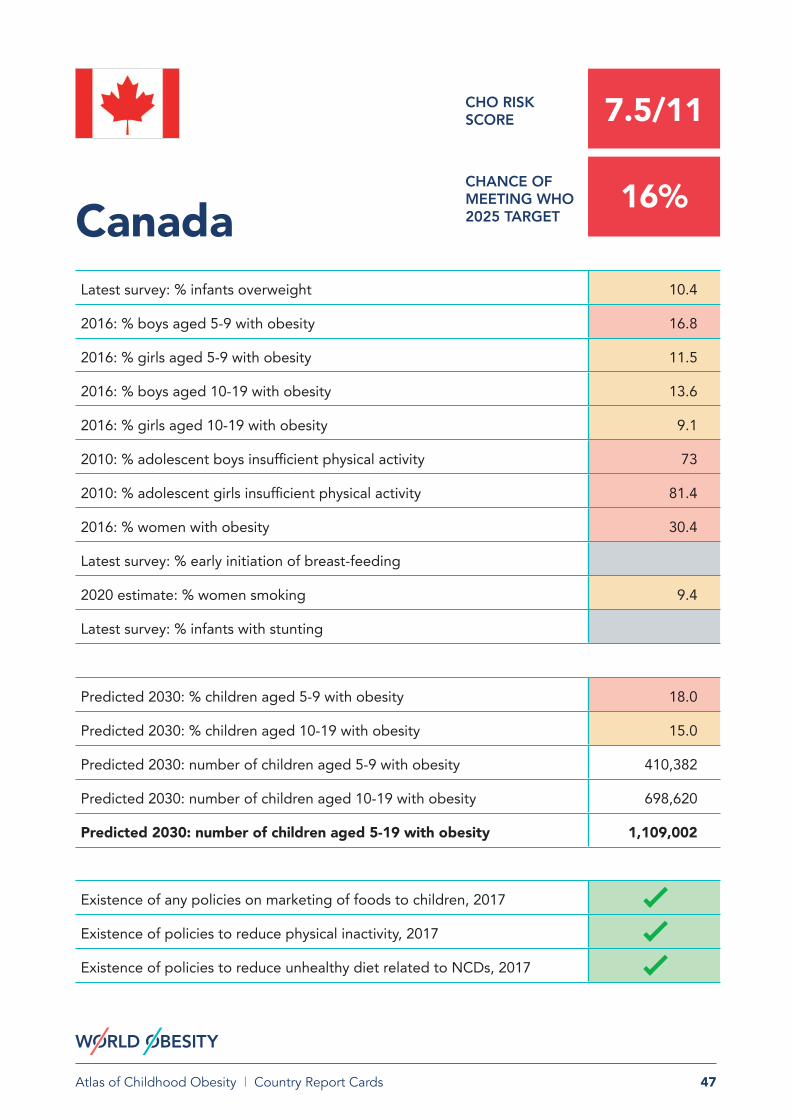
Latest survey: % infants overweight 10.4
2016: % boys aged 5-9 with obesity 16.8
2016: % girls aged 5-9 with obesity 11.5
2016: % boys aged 10-19 with obesity 13.6
2016: % girls aged 10-19 with obesity 9.1
2010: % adolescent boys insufficient physical activity 73
2010: % adolescent girls insufficient physical activity 81.4
2016: % women with obesity 30.4
Latest survey: % early initiation of breast-feeding
2020 estimate: % women smoking 9.4
Latest survey: % infants with stunting
Predicted 2030: % children aged 5-9 with obesity 18.0
Predicted 2030: % children aged 10-19 with obesity 15.0
Predicted 2030: number of children aged 5-9 with obesity 410,382
Predicted 2030: number of children aged 10-19 with obesity 698,620
Predicted 2030: number of children aged 5-19 with obesity 1,109,002
Canada
Existence of any policies on marketing of foods to children, 2017
Existence of policies to reduce physical inactivity, 2017
Existence of policies to reduce unhealthy diet related to NCDs, 2017
CHO RISK SCORE 7.5/11
CHANCE OF MEETING WHO 2025 TARGET
16%

48Atlas of Childhood Obesity | Country Report Cards
Latest survey: % infants overweight
2016: % boys aged 5-9 with obesity 3.3
2016: % girls aged 5-9 with obesity 5.5
2016: % boys aged 10-19 with obesity 1.7
2016: % girls aged 10-19 with obesity 3.3
2010: % adolescent boys insufficient physical activity
2010: % adolescent girls insufficient physical activity
2016: % women with obesity 17.0
Latest survey: % early initiation of breast-feeding 47.6
2020 estimate: % women smoking 3
Latest survey: % infants with stunting 21.4
Predicted 2030: % children aged 5-9 with obesity 9.2
Predicted 2030: % children aged 10-19 with obesity 6.1
Predicted 2030: number of children aged 5-9 with obesity 3,961
Predicted 2030: number of children aged 10-19 with obesity 5,388
Predicted 2030: number of children aged 5-19 with obesity 9,349
Cape Verde
Existence of any policies on marketing of foods to children, 2017
Existence of policies to reduce physical inactivity, 2017
Existence of policies to reduce unhealthy diet related to NCDs, 2017
CHO RISK SCORE 6/11
CHANCE OF MEETING WHO 2025 TARGET
5%

49Atlas of Childhood Obesity | Country Report Cards
Latest survey: % infants overweight 1.9
2016: % boys aged 5-9 with obesity 2.3
2016: % girls aged 5-9 with obesity 3.9
2016: % boys aged 10-19 with obesity 1.2
2016: % girls aged 10-19 with obesity 2.3
2010: % adolescent boys insufficient physical activity
2010: % adolescent girls insufficient physical activity
2016: % women with obesity 11.4
Latest survey: % early initiation of breast-feeding
2020 estimate: % women smoking
Latest survey: % infants with stunting 39.6
Predicted 2030: % children aged 5-9 with obesity 7.9
Predicted 2030: % children aged 10-19 with obesity 5.3
Predicted 2030: number of children aged 5-9 with obesity 57,964
Predicted 2030: number of children aged 10-19 with obesity 71,349
Predicted 2030: number of children aged 5-19 with obesity 129,313
Central African Republic
Existence of any policies on marketing of foods to children, 2017
Existence of policies to reduce physical inactivity, 2017
Existence of policies to reduce unhealthy diet related to NCDs, 2017
CHO RISK SCORE 3.5/11
CHANCE OF MEETING WHO 2025 TARGET
2%

50Atlas of Childhood Obesity | Country Report Cards
Latest survey: % infants overweight 2.8
2016: % boys aged 5-9 with obesity 1.4
2016: % girls aged 5-9 with obesity 2.9
2016: % boys aged 10-19 with obesity 0.7
2016: % girls aged 10-19 with obesity 1.6
2010: % adolescent boys insufficient physical activity
2010: % adolescent girls insufficient physical activity
2016: % women with obesity 9.3
Latest survey: % early initiation of breast-feeding 23.0
2020 estimate: % women smoking
Latest survey: % infants with stunting 39.8
Predicted 2030: % children aged 5-9 with obesity 5.9
Predicted 2030: % children aged 10-19 with obesity 3.7
Predicted 2030: number of children aged 5-9 with obesity 177,538
Predicted 2030: number of children aged 10-19 with obesity 186,246
Predicted 2030: number of children aged 5-19 with obesity 363,784
Chad
Existence of any policies on marketing of foods to children, 2017
Existence of policies to reduce physical inactivity, 2017
Existence of policies to reduce unhealthy diet related to NCDs, 2017
CHO RISK SCORE 4/11
CHANCE OF MEETING WHO 2025 TARGET
3%

51Atlas of Childhood Obesity | Country Report Cards
Latest survey: % infants overweight 9.3
2016: % boys aged 5-9 with obesity 21.4
2016: % girls aged 5-9 with obesity 15.8
2016: % boys aged 10-19 with obesity 15.6
2016: % girls aged 10-19 with obesity 11.5
2010: % adolescent boys insufficient physical activity 79.6
2010: % adolescent girls insufficient physical activity 90.6
2016: % women with obesity 32.1
Latest survey: % early initiation of breast-feeding
2020 estimate: % women smoking 34.1
Latest survey: % infants with stunting 1.8
Predicted 2030: % children aged 5-9 with obesity 24.8
Predicted 2030: % children aged 10-19 with obesity 19.8
Predicted 2030: number of children aged 5-9 with obesity 294,235
Predicted 2030: number of children aged 10-19 with obesity 480,412
Predicted 2030: number of children aged 5-19 with obesity 774,647
Chile
Existence of any policies on marketing of foods to children, 2017
Existence of policies to reduce physical inactivity, 2017
Existence of policies to reduce unhealthy diet related to NCDs, 2017
CHO RISK SCORE 8.5/11
CHANCE OF MEETING WHO 2025 TARGET
7%

52Atlas of Childhood Obesity | Country Report Cards
Latest survey: % infants overweight 9.1
2016: % boys aged 5-9 with obesity 22.3
2016: % girls aged 5-9 with obesity 11.8
2016: % boys aged 10-19 with obesity 11.8
2016: % girls aged 10-19 with obesity 4.7
2010: % adolescent boys insufficient physical activity 79.4
2010: % adolescent girls insufficient physical activity 87.9
2016: % women with obesity 6.8
Latest survey: % early initiation of breast-feeding
2020 estimate: % women smoking 1.4
Latest survey: % infants with stunting 8.1
Predicted 2030: % children aged 5-9 with obesity 32.0
Predicted 2030: % children aged 10-19 with obesity 21.8
Predicted 2030: number of children aged 5-9 with obesity 24,100,911
Predicted 2030: number of children aged 10-19 with obesity 37,887,009
Predicted 2030: number of children aged 5-19 with obesity 61,987,920
China
Existence of any policies on marketing of foods to children, 2017
Existence of policies to reduce physical inactivity, 2017
Existence of policies to reduce unhealthy diet related to NCDs, 2017
CHO RISK SCORE 6/11
CHANCE OF MEETING WHO 2025 TARGET
0%
53Atlas of Childhood Obesity | Country Report Cards
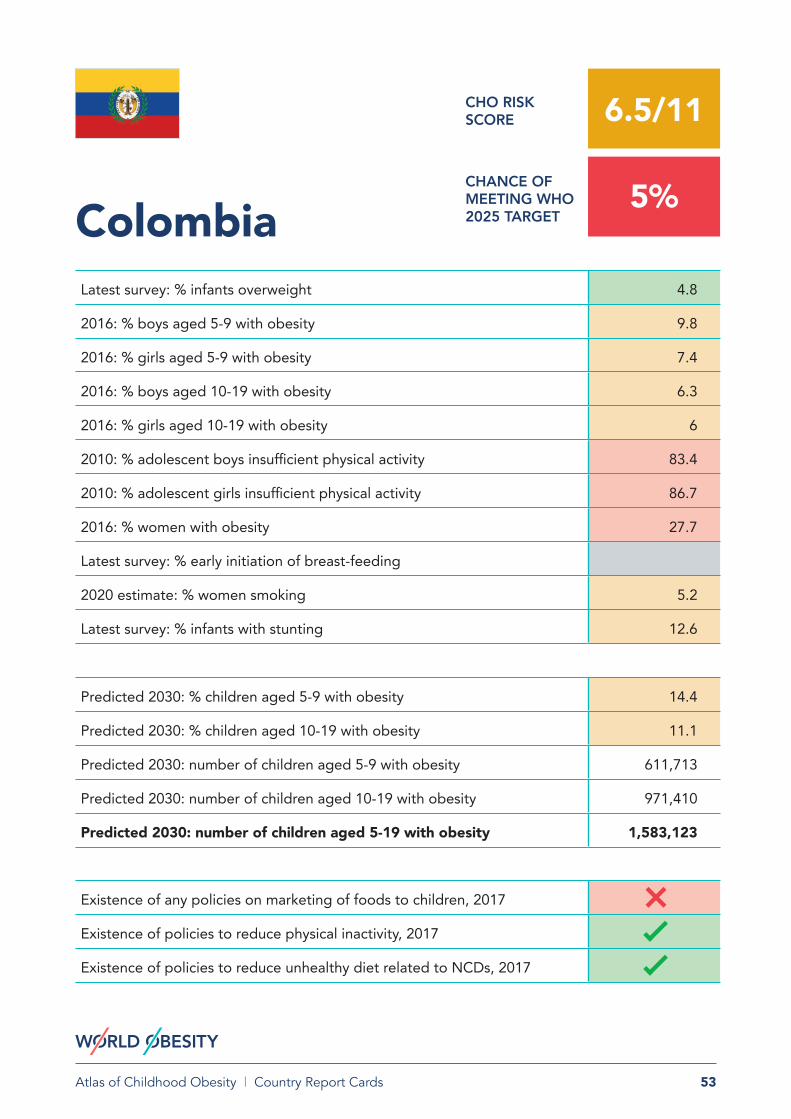
Latest survey: % infants overweight 4.8
2016: % boys aged 5-9 with obesity 9.8
2016: % girls aged 5-9 with obesity 7.4
2016: % boys aged 10-19 with obesity 6.3
2016: % girls aged 10-19 with obesity 6
2010: % adolescent boys insufficient physical activity 83.4
2010: % adolescent girls insufficient physical activity 86.7
2016: % women with obesity 27.7
Latest survey: % early initiation of breast-feeding
2020 estimate: % women smoking 5.2
Latest survey: % infants with stunting 12.6
Predicted 2030: % children aged 5-9 with obesity 14.4
Predicted 2030: % children aged 10-19 with obesity 11.1
Predicted 2030: number of children aged 5-9 with obesity 611,713
Predicted 2030: number of children aged 10-19 with obesity 971,410
Predicted 2030: number of children aged 5-19 with obesity 1,583,123
Colombia
Existence of any policies on marketing of foods to children, 2017
Existence of policies to reduce physical inactivity, 2017
Existence of policies to reduce unhealthy diet related to NCDs, 2017
CHO RISK SCORE 6.5/11
CHANCE OF MEETING WHO 2025 TARGET
5%

54Atlas of Childhood Obesity | Country Report Cards
Latest survey: % infants overweight 10.6
2016: % boys aged 5-9 with obesity 2.4
2016: % girls aged 5-9 with obesity 5.1
2016: % boys aged 10-19 with obesity 1.3
2016: % girls aged 10-19 with obesity 3.2
2010: % adolescent boys insufficient physical activity
2010: % adolescent girls insufficient physical activity
2016: % women with obesity 12.7
Latest survey: % early initiation of breast-feeding 33.8
2020 estimate: % women smoking 4.6
Latest survey: % infants with stunting 31.1
Predicted 2030: % children aged 5-9 with obesity 9.1
Predicted 2030: % children aged 10-19 with obesity 6.1
Predicted 2030: number of children aged 5-9 with obesity 11,557
Predicted 2030: number of children aged 10-19 with obesity 14,050
Predicted 2030: number of children aged 5-19 with obesity 25,607
Comoros
Existence of any policies on marketing of foods to children, 2017
Existence of policies to reduce physical inactivity, 2017
Existence of policies to reduce unhealthy diet related to NCDs, 2017
CHO RISK SCORE 5/11
CHANCE OF MEETING WHO 2025 TARGET
1%

55Atlas of Childhood Obesity | Country Report Cards
Latest survey: % infants overweight
2016: % boys aged 5-9 with obesity 36.9
2016: % girls aged 5-9 with obesity 35.1
2016: % boys aged 10-19 with obesity 31.5
2016: % girls aged 10-19 with obesity 29.1
2010: % adolescent boys insufficient physical activity 76.4
2010: % adolescent girls insufficient physical activity 84.6
2016: % women with obesity 60.9
Latest survey: % early initiation of breast-feeding
2020 estimate: % women smoking
Latest survey: % infants with stunting
Predicted 2030: % children aged 5-9 with obesity 45.9
Predicted 2030: % children aged 10-19 with obesity 41.6
Predicted 2030: number of children aged 5-9 with obesity 878
Predicted 2030: number of children aged 10-19 with obesity 1,583
Predicted 2030: number of children aged 5-19 with obesity 2,461
Cook Islands
Existence of any policies on marketing of foods to children, 2017
Existence of policies to reduce physical inactivity, 2017
Existence of policies to reduce unhealthy diet related to NCDs, 2017
CHO RISK SCORE 9/11
CHANCE OF MEETING WHO 2025 TARGET
1%

56Atlas of Childhood Obesity | Country Report Cards
Latest survey: % infants overweight 8.1
2016: % boys aged 5-9 with obesity 16.2
2016: % girls aged 5-9 with obesity 15
2016: % boys aged 10-19 with obesity 11
2016: % girls aged 10-19 with obesity 10.5
2010: % adolescent boys insufficient physical activity 75.3
2010: % adolescent girls insufficient physical activity 88.1
2016: % women with obesity 31.5
Latest survey: % early initiation of breast-feeding
2020 estimate: % women smoking 7.2
Latest survey: % infants with stunting 5.6
Predicted 2030: % children aged 5-9 with obesity 24.2
Predicted 2030: % children aged 10-19 with obesity 18.9
Predicted 2030: number of children aged 5-9 with obesity 84,607
Predicted 2030: number of children aged 10-19 with obesity 139,643
Predicted 2030: number of children aged 5-19 with obesity 224,250
Costa Rica
Existence of any policies on marketing of foods to children, 2017
Existence of policies to reduce physical inactivity, 2017
Existence of policies to reduce unhealthy diet related to NCDs, 2017
CHO RISK SCORE 7.5/11
CHANCE OF MEETING WHO 2025 TARGET
2%

57Atlas of Childhood Obesity | Country Report Cards
Latest survey: % infants overweight
2016: % boys aged 5-9 with obesity 18.3
2016: % girls aged 5-9 with obesity 11.6
2016: % boys aged 10-19 with obesity 11.6
2016: % girls aged 10-19 with obesity 6.1
2010: % adolescent boys insufficient physical activity 72.6
2010: % adolescent girls insufficient physical activity 85.4
2016: % women with obesity 25.6
Latest survey: % early initiation of breast-feeding
2020 estimate: % women smoking 36.1
Latest survey: % infants with stunting
Predicted 2030: % children aged 5-9 with obesity 23.2
Predicted 2030: % children aged 10-19 with obesity 16.4
Predicted 2030: number of children aged 5-9 with obesity 43,602
Predicted 2030: number of children aged 10-19 with obesity 64,825
Predicted 2030: number of children aged 5-19 with obesity 108,427
Croatia
Existence of any policies on marketing of foods to children, 2017
Existence of policies to reduce physical inactivity, 2017
Existence of policies to reduce unhealthy diet related to NCDs, 2017
CHO RISK SCORE 8/11
CHANCE OF MEETING WHO 2025 TARGET
2%

58Atlas of Childhood Obesity | Country Report Cards
Latest survey: % infants overweight
2016: % boys aged 5-9 with obesity 16.7
2016: % girls aged 5-9 with obesity 14
2016: % boys aged 10-19 with obesity 10.7
2016: % girls aged 10-19 with obesity 8.7
2010: % adolescent boys insufficient physical activity
2010: % adolescent girls insufficient physical activity
2016: % women with obesity 31.6
Latest survey: % early initiation of breast-feeding
2020 estimate: % women smoking 15.1
Latest survey: % infants with stunting 7.0
Predicted 2030: % children aged 5-9 with obesity 21.1
Predicted 2030: % children aged 10-19 with obesity 15.1
Predicted 2030: number of children aged 5-9 with obesity 99,172
Predicted 2030: number of children aged 10-19 with obesity 148,279
Predicted 2030: number of children aged 5-19 with obesity 247,451
Cuba
Existence of any policies on marketing of foods to children, 2017
Existence of policies to reduce physical inactivity, 2017
Existence of policies to reduce unhealthy diet related to NCDs, 2017
CHO RISK SCORE 7/11
CHANCE OF MEETING WHO 2025 TARGET
9%

59Atlas of Childhood Obesity | Country Report Cards
Latest survey: % infants overweight
2016: % boys aged 5-9 with obesity 19.6
2016: % girls aged 5-9 with obesity 12
2016: % boys aged 10-19 with obesity 13.6
2016: % girls aged 10-19 with obesity 7.2
2010: % adolescent boys insufficient physical activity
2010: % adolescent girls insufficient physical activity
2016: % women with obesity 22.5
Latest survey: % early initiation of breast-feeding
2020 estimate: % women smoking
Latest survey: % infants with stunting
Predicted 2030: % children aged 5-9 with obesity 19.5
Predicted 2030: % children aged 10-19 with obesity 14.0
Predicted 2030: number of children aged 5-9 with obesity 13,272
Predicted 2030: number of children aged 10-19 with obesity 19,367
Predicted 2030: number of children aged 5-19 with obesity 32,638
Cyprus
Existence of any policies on marketing of foods to children, 2017
Existence of policies to reduce physical inactivity, 2017
Existence of policies to reduce unhealthy diet related to NCDs, 2017
CHO RISK SCORE 6.5/11
CHANCE OF MEETING WHO 2025 TARGET
22%

60Atlas of Childhood Obesity | Country Report Cards
Latest survey: % infants overweight 4.4
2016: % boys aged 5-9 with obesity 15.7
2016: % girls aged 5-9 with obesity 8.8
2016: % boys aged 10-19 with obesity 10.7
2016: % girls aged 10-19 with obesity 5.3
2010: % adolescent boys insufficient physical activity 72.9
2010: % adolescent girls insufficient physical activity 80.6
2016: % women with obesity 26.5
Latest survey: % early initiation of breast-feeding
2020 estimate: % women smoking 28.9
Latest survey: % infants with stunting 2.6
Predicted 2030: % children aged 5-9 with obesity 19.1
Predicted 2030: % children aged 10-19 with obesity 14.0
Predicted 2030: number of children aged 5-9 with obesity 106,261
Predicted 2030: number of children aged 10-19 with obesity 168,713
Predicted 2030: number of children aged 5-19 with obesity 274,974
Czechia
Existence of any policies on marketing of foods to children, 2017
Existence of policies to reduce physical inactivity, 2017
Existence of policies to reduce unhealthy diet related to NCDs, 2017
CHO RISK SCORE 7/11
CHANCE OF MEETING WHO 2025 TARGET
4%

61Atlas of Childhood Obesity | Country Report Cards
Democratic Republic of Congo Latest survey: % infants overweight 4.4
2016: % boys aged 5-9 with obesity 1.9
2016: % girls aged 5-9 with obesity 4.2
2016: % boys aged 10-19 with obesity 1
2016: % girls aged 10-19 with obesity 2.4
2010: % adolescent boys insufficient physical activity
2010: % adolescent girls insufficient physical activity
2016: % women with obesity 10.1
Latest survey: % early initiation of breast-feeding 52.0
2020 estimate: % women smoking
Latest survey: % infants with stunting 42.7
Predicted 2030: % children aged 5-9 with obesity 8.2
Predicted 2030: % children aged 10-19 with obesity 5.4
Predicted 2030: number of children aged 5-9 with obesity 1,141,245
Predicted 2030: number of children aged 10-19 with obesity 1,280,160
Predicted 2030: number of children aged 5-19 with obesity 2,421,404
Existence of any policies on marketing of foods to children, 2017
Existence of policies to reduce physical inactivity, 2017
Existence of policies to reduce unhealthy diet related to NCDs, 2017
CHO RISK SCORE 3.5/11
CHANCE OF MEETING WHO 2025 TARGET
2%

62Atlas of Childhood Obesity | Country Report Cards
Latest survey: % infants overweight
2016: % boys aged 5-9 with obesity 11.9
2016: % girls aged 5-9 with obesity 6.6
2016: % boys aged 10-19 with obesity 8.2
2016: % girls aged 10-19 with obesity 4
2010: % adolescent boys insufficient physical activity 87.1
2010: % adolescent girls insufficient physical activity 89.4
2016: % women with obesity 17.7
Latest survey: % early initiation of breast-feeding
2020 estimate: % women smoking 12.9
Latest survey: % infants with stunting
Predicted 2030: % children aged 5-9 with obesity 10.6
Predicted 2030: % children aged 10-19 with obesity 7.3
Predicted 2030: number of children aged 5-9 with obesity 36,931
Predicted 2030: number of children aged 10-19 with obesity 49,148
Predicted 2030: number of children aged 5-19 with obesity 86,079
Denmark
Existence of any policies on marketing of foods to children, 2017
Existence of policies to reduce physical inactivity, 2017
Existence of policies to reduce unhealthy diet related to NCDs, 2017
CHO RISK SCORE 7/11
CHANCE OF MEETING WHO 2025 TARGET
39%
63Atlas of Childhood Obesity | Country Report Cards
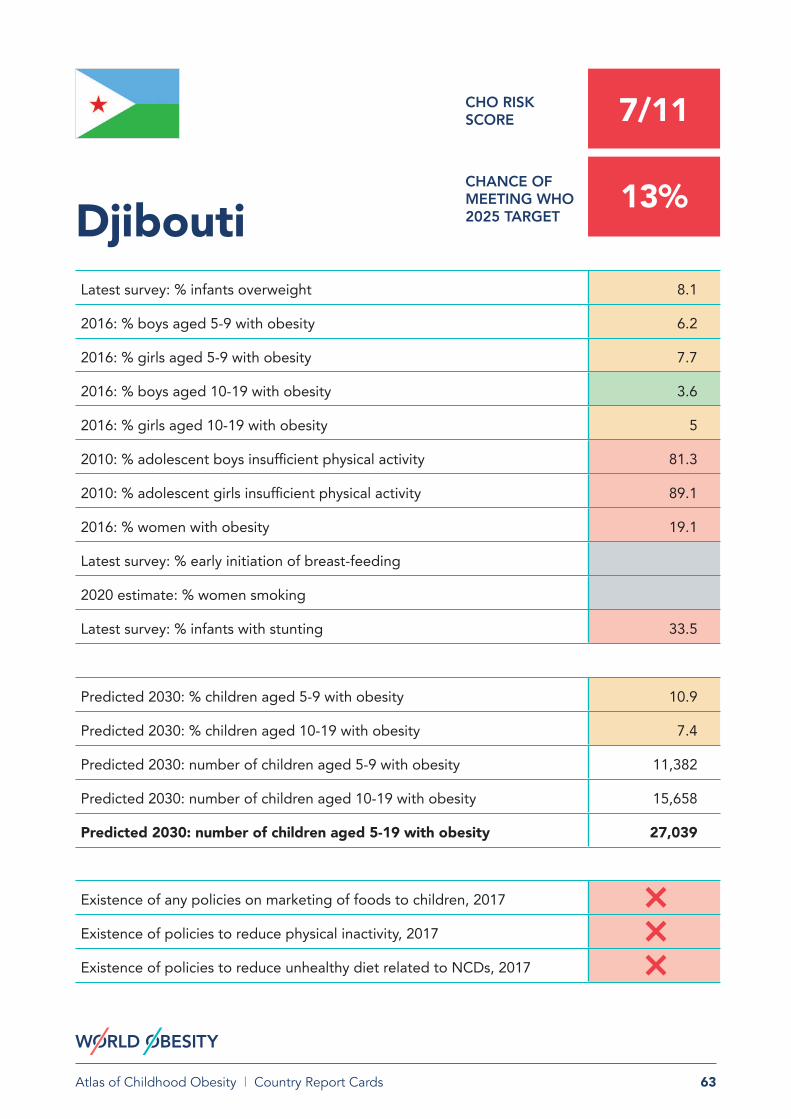
Latest survey: % infants overweight 8.1
2016: % boys aged 5-9 with obesity 6.2
2016: % girls aged 5-9 with obesity 7.7
2016: % boys aged 10-19 with obesity 3.6
2016: % girls aged 10-19 with obesity 5
2010: % adolescent boys insufficient physical activity 81.3
2010: % adolescent girls insufficient physical activity 89.1
2016: % women with obesity 19.1
Latest survey: % early initiation of breast-feeding
2020 estimate: % women smoking
Latest survey: % infants with stunting 33.5
Predicted 2030: % children aged 5-9 with obesity 10.9
Predicted 2030: % children aged 10-19 with obesity 7.4
Predicted 2030: number of children aged 5-9 with obesity 11,382
Predicted 2030: number of children aged 10-19 with obesity 15,658
Predicted 2030: number of children aged 5-19 with obesity 27,039
Djibouti
Existence of any policies on marketing of foods to children, 2017
Existence of policies to reduce physical inactivity, 2017
Existence of policies to reduce unhealthy diet related to NCDs, 2017
CHO RISK SCORE 7/11
CHANCE OF MEETING WHO 2025 TARGET
13%

64Atlas of Childhood Obesity | Country Report Cards
Latest survey: % infants overweight
2016: % boys aged 5-9 with obesity 18.5
2016: % girls aged 5-9 with obesity 18.6
2016: % boys aged 10-19 with obesity 12.7
2016: % girls aged 10-19 with obesity 14
2010: % adolescent boys insufficient physical activity 82.9
2010: % adolescent girls insufficient physical activity 84.7
2016: % women with obesity 36.9
Latest survey: % early initiation of breast-feeding
2020 estimate: % women smoking
Latest survey: % infants with stunting
Predicted 2030: % children aged 5-9 with obesity 26.1
Predicted 2030: % children aged 10-19 with obesity 20.8
Predicted 2030: number of children aged 5-9 with obesity 1,448
Predicted 2030: number of children aged 10-19 with obesity 2,339
Predicted 2030: number of children aged 5-19 with obesity 3,787
Dominica
Existence of any policies on marketing of foods to children, 2017
Existence of policies to reduce physical inactivity, 2017
Existence of policies to reduce unhealthy diet related to NCDs, 2017
CHO RISK SCORE 8/11
CHANCE OF MEETING WHO 2025 TARGET
5%

65Atlas of Childhood Obesity | Country Report Cards
Dominican Republic Latest survey: % infants overweight 7.6
2016: % boys aged 5-9 with obesity 19.7
2016: % girls aged 5-9 with obesity 17.4
2016: % boys aged 10-19 with obesity 13.7
2016: % girls aged 10-19 with obesity 12.5
2010: % adolescent boys insufficient physical activity
2010: % adolescent girls insufficient physical activity
2016: % women with obesity 35.4
Latest survey: % early initiation of breast-feeding
2020 estimate: % women smoking 8.2
Latest survey: % infants with stunting 7.1
Predicted 2030: % children aged 5-9 with obesity 27.7
Predicted 2030: % children aged 10-19 with obesity 22.0
Predicted 2030: number of children aged 5-9 with obesity 275,798
Predicted 2030: number of children aged 10-19 with obesity 443,798
Predicted 2030: number of children aged 5-19 with obesity 719,596
Existence of any policies on marketing of foods to children, 2017
Existence of policies to reduce physical inactivity, 2017
Existence of policies to reduce unhealthy diet related to NCDs, 2017
CHO RISK SCORE 7/11
CHANCE OF MEETING WHO 2025 TARGET
2%

66Atlas of Childhood Obesity | Country Report Cards
East Timor Latest survey: % infants overweight 1.4
2016: % boys aged 5-9 with obesity 7.6
2016: % girls aged 5-9 with obesity 4.1
2016: % boys aged 10-19 with obesity 4.3
2016: % girls aged 10-19 with obesity 2.2
2010: % adolescent boys insufficient physical activity
2010: % adolescent girls insufficient physical activity
2016: % women with obesity 5.2
Latest survey: % early initiation of breast-feeding 75.3
2020 estimate: % women smoking
Latest survey: % infants with stunting 50.9
Predicted 2030: % children aged 5-9 with obesity 14.7
Predicted 2030: % children aged 10-19 with obesity 10.0
Predicted 2030: number of children aged 5-9 with obesity 33,098
Predicted 2030: number of children aged 10-19 with obesity 38,690
Predicted 2030: number of children aged 5-19 with obesity 71,788
Existence of any policies on marketing of foods to children, 2017
Existence of policies to reduce physical inactivity, 2017
Existence of policies to reduce unhealthy diet related to NCDs, 2017
CHO RISK SCORE 3.5/11
CHANCE OF MEETING WHO 2025 TARGET
0%

67Atlas of Childhood Obesity | Country Report Cards
Ecuador Latest survey: % infants overweight 8.0
2016: % boys aged 5-9 with obesity 13.8
2016: % girls aged 5-9 with obesity 10.5
2016: % boys aged 10-19 with obesity 8.9
2016: % girls aged 10-19 with obesity 7.2
2010: % adolescent boys insufficient physical activity 85.9
2010: % adolescent girls insufficient physical activity 93.4
2016: % women with obesity 25.6
Latest survey: % early initiation of breast-feeding 29.3
2020 estimate: % women smoking 2.8
Latest survey: % infants with stunting 23.9
Predicted 2030: % children aged 5-9 with obesity 18.9
Predicted 2030: % children aged 10-19 with obesity 14.0
Predicted 2030: number of children aged 5-9 with obesity 302,892
Predicted 2030: number of children aged 10-19 with obesity 447,663
Predicted 2030: number of children aged 5-19 with obesity 750,556
Existence of any policies on marketing of foods to children, 2017
Existence of policies to reduce physical inactivity, 2017
Existence of policies to reduce unhealthy diet related to NCDs, 2017
CHO RISK SCORE 8/11
CHANCE OF MEETING WHO 2025 TARGET
5%

68Atlas of Childhood Obesity | Country Report Cards
Latest survey: % infants overweight 15.7
2016: % boys aged 5-9 with obesity 20.5
2016: % girls aged 5-9 with obesity 23.2
2016: % boys aged 10-19 with obesity 13.2
2016: % girls aged 10-19 with obesity 17.1
2010: % adolescent boys insufficient physical activity 80.6
2010: % adolescent girls insufficient physical activity 92.9
2016: % women with obesity 42.5
Latest survey: % early initiation of breast-feeding 27.1
2020 estimate: % women smoking 0.2
Latest survey: % infants with stunting 22.3
Predicted 2030: % children aged 5-9 with obesity 29.5
Predicted 2030: % children aged 10-19 with obesity 22.8
Predicted 2030: number of children aged 5-9 with obesity 2,643,046
Predicted 2030: number of children aged 10-19 with obesity 4,175,486
Predicted 2030: number of children aged 5-19 with obesity 6,818,532
Egypt
Existence of any policies on marketing of foods to children, 2017
Existence of policies to reduce physical inactivity, 2017
Existence of policies to reduce unhealthy diet related to NCDs, 2017
CHO RISK SCORE 9.5/11
CHANCE OF MEETING WHO 2025 TARGET
2%

69Atlas of Childhood Obesity | Country Report Cards
Latest survey: % infants overweight 6.4
2016: % boys aged 5-9 with obesity 14.2
2016: % girls aged 5-9 with obesity 15.3
2016: % boys aged 10-19 with obesity 9.4
2016: % girls aged 10-19 with obesity 11.1
2010: % adolescent boys insufficient physical activity 83.7
2010: % adolescent girls insufficient physical activity 90.1
2016: % women with obesity 30.0
Latest survey: % early initiation of breast-feeding
2020 estimate: % women smoking
Latest survey: % infants with stunting 13.6
Predicted 2030: % children aged 5-9 with obesity 22.1
Predicted 2030: % children aged 10-19 with obesity 17.2
Predicted 2030: number of children aged 5-9 with obesity 126,469
Predicted 2030: number of children aged 10-19 with obesity 202,578
Predicted 2030: number of children aged 5-19 with obesity 329,047
El Salvador
Existence of any policies on marketing of foods to children, 2017
Existence of policies to reduce physical inactivity, 2017
Existence of policies to reduce unhealthy diet related to NCDs, 2017
CHO RISK SCORE 7.5/11
CHANCE OF MEETING WHO 2025 TARGET
4%

70Atlas of Childhood Obesity | Country Report Cards
Equatorial GuineaLatest survey: % infants overweight 9.7
2016: % boys aged 5-9 with obesity 2.3
2016: % girls aged 5-9 with obesity 3.9
2016: % boys aged 10-19 with obesity 1.2
2016: % girls aged 10-19 with obesity 2.3
2010: % adolescent boys insufficient physical activity
2010: % adolescent girls insufficient physical activity
2016: % women with obesity 13.2
Latest survey: % early initiation of breast-feeding
2020 estimate: % women smoking
Latest survey: % infants with stunting 26.2
Predicted 2030: % children aged 5-9 with obesity 7.8
Predicted 2030: % children aged 10-19 with obesity 5.2
Predicted 2030: number of children aged 5-9 with obesity 10,299
Predicted 2030: number of children aged 10-19 with obesity 12,424
Predicted 2030: number of children aged 5-19 with obesity 22,723
Existence of any policies on marketing of foods to children, 2017
Existence of policies to reduce physical inactivity, 2017
Existence of policies to reduce unhealthy diet related to NCDs, 2017
CHO RISK SCORE 4/11
CHANCE OF MEETING WHO 2025 TARGET
3%

71Atlas of Childhood Obesity | Country Report Cards
Latest survey: % infants overweight 2.0
2016: % boys aged 5-9 with obesity 1.8
2016: % girls aged 5-9 with obesity 4
2016: % boys aged 10-19 with obesity 0.9
2016: % girls aged 10-19 with obesity 2.4
2010: % adolescent boys insufficient physical activity
2010: % adolescent girls insufficient physical activity
2016: % women with obesity 7.9
Latest survey: % early initiation of breast-feeding
2020 estimate: % women smoking
Latest survey: % infants with stunting 52.0
Predicted 2030: % children aged 5-9 with obesity 8.4
Predicted 2030: % children aged 10-19 with obesity 5.5
Predicted 2030: number of children aged 5-9 with obesity 100,011
Predicted 2030: number of children aged 10-19 with obesity 123,780
Predicted 2030: number of children aged 5-19 with obesity 223,791
Eritrea
Existence of any policies on marketing of foods to children, 2017
Existence of policies to reduce physical inactivity, 2017
Existence of policies to reduce unhealthy diet related to NCDs, 2017
CHO RISK SCORE 3.5/11
CHANCE OF MEETING WHO 2025 TARGET
1%

72Atlas of Childhood Obesity | Country Report Cards
Estonia Latest survey: % infants overweight
2016: % boys aged 5-9 with obesity 10.3
2016: % girls aged 5-9 with obesity 6.5
2016: % boys aged 10-19 with obesity 6.3
2016: % girls aged 10-19 with obesity 3.7
2010: % adolescent boys insufficient physical activity 82.7
2010: % adolescent girls insufficient physical activity 89
2016: % women with obesity 22.7
Latest survey: % early initiation of breast-feeding
2020 estimate: % women smoking 24.3
Latest survey: % infants with stunting
Predicted 2030: % children aged 5-9 with obesity 13.4
Predicted 2030: % children aged 10-19 with obesity 9.1
Predicted 2030: number of children aged 5-9 with obesity 8,682
Predicted 2030: number of children aged 10-19 with obesity 12,497
Predicted 2030: number of children aged 5-19 with obesity 21,179
Existence of any policies on marketing of foods to children, 2017
Existence of policies to reduce physical inactivity, 2017
Existence of policies to reduce unhealthy diet related to NCDs, 2017
CHO RISK SCORE 7/11
CHANCE OF MEETING WHO 2025 TARGET
9%

73Atlas of Childhood Obesity | Country Report Cards
EthiopiaLatest survey: % infants overweight 2.9
2016: % boys aged 5-9 with obesity 1.2
2016: % girls aged 5-9 with obesity 2.3
2016: % boys aged 10-19 with obesity 0.5
2016: % girls aged 10-19 with obesity 1
2010: % adolescent boys insufficient physical activity
2010: % adolescent girls insufficient physical activity
2016: % women with obesity 7.3
Latest survey: % early initiation of breast-feeding 73.3
2020 estimate: % women smoking 0.5
Latest survey: % infants with stunting 38.4
Predicted 2030: % children aged 5-9 with obesity 6.0
Predicted 2030: % children aged 10-19 with obesity 3.3
Predicted 2030: number of children aged 5-9 with obesity 945,912
Predicted 2030: number of children aged 10-19 with obesity 980,785
Predicted 2030: number of children aged 5-19 with obesity 1,926,697
Existence of any policies on marketing of foods to children, 2017
Existence of policies to reduce physical inactivity, 2017
Existence of policies to reduce unhealthy diet related to NCDs, 2017
CHO RISK SCORE 2.5/11
CHANCE OF MEETING WHO 2025 TARGET
0%

74Atlas of Childhood Obesity | Country Report Cards
Fiji Latest survey: % infants overweight 5.1
2016: % boys aged 5-9 with obesity 14.5
2016: % girls aged 5-9 with obesity 13.9
2016: % boys aged 10-19 with obesity 9.7
2016: % girls aged 10-19 with obesity 10.2
2010: % adolescent boys insufficient physical activity 84.2
2010: % adolescent girls insufficient physical activity 89.4
2016: % women with obesity 36.5
Latest survey: % early initiation of breast-feeding
2020 estimate: % women smoking 11.9
Latest survey: % infants with stunting 7.5
Predicted 2030: % children aged 5-9 with obesity 21.3
Predicted 2030: % children aged 10-19 with obesity 16.5
Predicted 2030: number of children aged 5-9 with obesity 16,150
Predicted 2030: number of children aged 10-19 with obesity 26,923
Predicted 2030: number of children aged 5-19 with obesity 43,073
Existence of any policies on marketing of foods to children, 2017
Existence of policies to reduce physical inactivity, 2017
Existence of policies to reduce unhealthy diet related to NCDs, 2017
CHO RISK SCORE 7.5/11
CHANCE OF MEETING WHO 2025 TARGET
5%

75Atlas of Childhood Obesity | Country Report Cards
Finland Latest survey: % infants overweight
2016: % boys aged 5-9 with obesity 15.6
2016: % girls aged 5-9 with obesity 7.8
2016: % boys aged 10-19 with obesity 10.8
2016: % girls aged 10-19 with obesity 4.5
2010: % adolescent boys insufficient physical activity 68.2
2010: % adolescent girls insufficient physical activity 85.3
2016: % women with obesity 21.5
Latest survey: % early initiation of breast-feeding
2020 estimate: % women smoking 16.7
Latest survey: % infants with stunting
Predicted 2030: % children aged 5-9 with obesity 14.7
Predicted 2030: % children aged 10-19 with obesity 10.4
Predicted 2030: number of children aged 5-9 with obesity 45,815
Predicted 2030: number of children aged 10-19 with obesity 66,210
Predicted 2030: number of children aged 5-19 with obesity 112,025
Existence of any policies on marketing of foods to children, 2017
Existence of policies to reduce physical inactivity, 2017
Existence of policies to reduce unhealthy diet related to NCDs, 2017
CHO RISK SCORE 7/11
CHANCE OF MEETING WHO 2025 TARGET
24%

76Atlas of Childhood Obesity | Country Report Cards
France Latest survey: % infants overweight
2016: % boys aged 5-9 with obesity 11.7
2016: % girls aged 5-9 with obesity 8.9
2016: % boys aged 10-19 with obesity 7.4
2016: % girls aged 10-19 with obesity 6.4
2010: % adolescent boys insufficient physical activity 84.4
2010: % adolescent girls insufficient physical activity 91.7
2016: % women with obesity 22.0
Latest survey: % early initiation of breast-feeding
2020 estimate: % women smoking 24.9
Latest survey: % infants with stunting
Predicted 2030: % children aged 5-9 with obesity 13.9
Predicted 2030: % children aged 10-19 with obesity 10.0
Predicted 2030: number of children aged 5-9 with obesity 560,091
Predicted 2030: number of children aged 10-19 with obesity 808,801
Predicted 2030: number of children aged 5-19 with obesity 1,368,893
Existence of any policies on marketing of foods to children, 2017
Existence of policies to reduce physical inactivity, 2017
Existence of policies to reduce unhealthy diet related to NCDs, 2017
CHO RISK SCORE 7.5/11
CHANCE OF MEETING WHO 2025 TARGET
21%
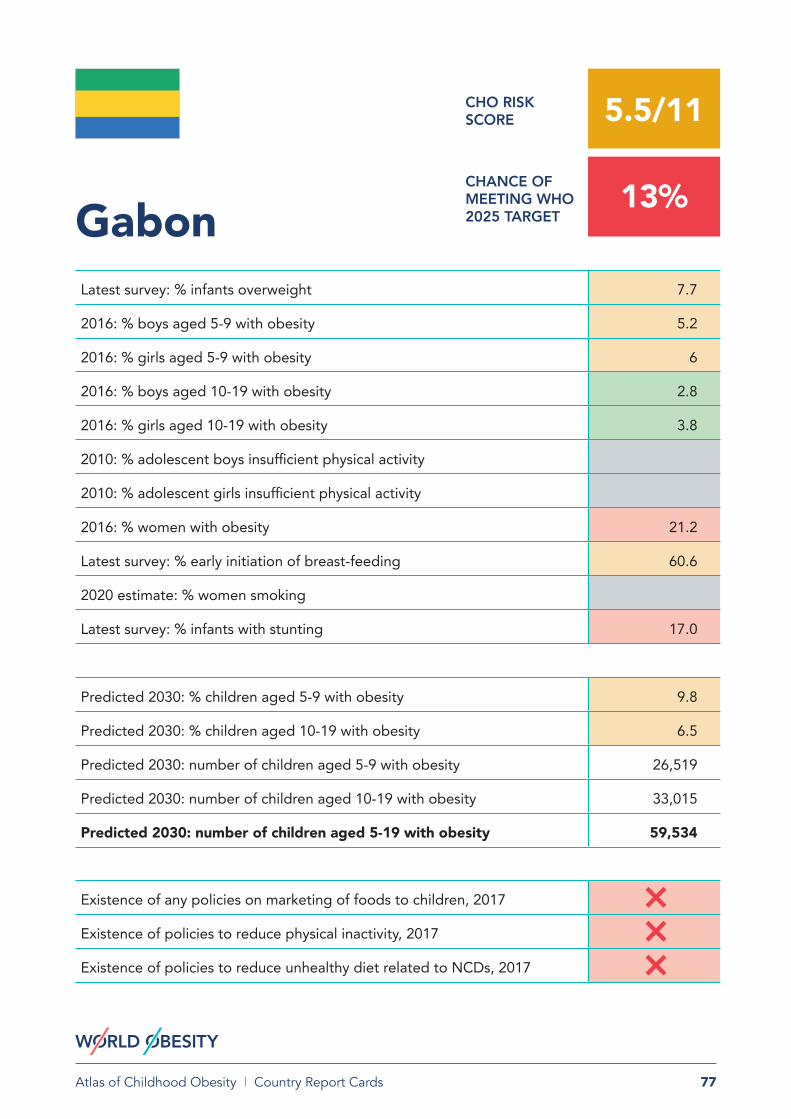
77Atlas of Childhood Obesity | Country Report Cards
Latest survey: % infants overweight 7.7
2016: % boys aged 5-9 with obesity 5.2
2016: % girls aged 5-9 with obesity 6
2016: % boys aged 10-19 with obesity 2.8
2016: % girls aged 10-19 with obesity 3.8
2010: % adolescent boys insufficient physical activity
2010: % adolescent girls insufficient physical activity
2016: % women with obesity 21.2
Latest survey: % early initiation of breast-feeding 60.6
2020 estimate: % women smoking
Latest survey: % infants with stunting 17.0
Predicted 2030: % children aged 5-9 with obesity 9.8
Predicted 2030: % children aged 10-19 with obesity 6.5
Predicted 2030: number of children aged 5-9 with obesity 26,519
Predicted 2030: number of children aged 10-19 with obesity 33,015
Predicted 2030: number of children aged 5-19 with obesity 59,534
Gabon
Existence of any policies on marketing of foods to children, 2017
Existence of policies to reduce physical inactivity, 2017
Existence of policies to reduce unhealthy diet related to NCDs, 2017
CHO RISK SCORE 5.5/11
CHANCE OF MEETING WHO 2025 TARGET
13%

78Atlas of Childhood Obesity | Country Report Cards
Gambia Latest survey: % infants overweight 3.2
2016: % boys aged 5-9 with obesity 3
2016: % girls aged 5-9 with obesity 4.6
2016: % boys aged 10-19 with obesity 1.7
2016: % girls aged 10-19 with obesity 2.8
2010: % adolescent boys insufficient physical activity
2010: % adolescent girls insufficient physical activity
2016: % women with obesity 15.5
Latest survey: % early initiation of breast-feeding 51.5
2020 estimate: % women smoking
Latest survey: % infants with stunting 24.6
Predicted 2030: % children aged 5-9 with obesity 8.5
Predicted 2030: % children aged 10-19 with obesity 5.6
Predicted 2030: number of children aged 5-9 with obesity 36,585
Predicted 2030: number of children aged 10-19 with obesity 40,805
Predicted 2030: number of children aged 5-19 with obesity 77,390
Existence of any policies on marketing of foods to children, 2017
Existence of policies to reduce physical inactivity, 2017
Existence of policies to reduce unhealthy diet related to NCDs, 2017
CHO RISK SCORE 4/11
CHANCE OF MEETING WHO 2025 TARGET
4%

79Atlas of Childhood Obesity | Country Report Cards
Georgia Latest survey: % infants overweight 19.9
2016: % boys aged 5-9 with obesity 10.9
2016: % girls aged 5-9 with obesity 6
2016: % boys aged 10-19 with obesity 7.4
2016: % girls aged 10-19 with obesity 3.8
2010: % adolescent boys insufficient physical activity
2010: % adolescent girls insufficient physical activity
2016: % women with obesity 24.8
Latest survey: % early initiation of breast-feeding
2020 estimate: % women smoking 5.5
Latest survey: % infants with stunting 11.3
Predicted 2030: % children aged 5-9 with obesity 15.4
Predicted 2030: % children aged 10-19 with obesity 11.6
Predicted 2030: number of children aged 5-9 with obesity 32,738
Predicted 2030: number of children aged 10-19 with obesity 58,862
Predicted 2030: number of children aged 5-19 with obesity 91,600
Existence of any policies on marketing of foods to children, 2017
Existence of policies to reduce physical inactivity, 2017
Existence of policies to reduce unhealthy diet related to NCDs, 2017
CHO RISK SCORE 6/11
CHANCE OF MEETING WHO 2025 TARGET
3%

80Atlas of Childhood Obesity | Country Report Cards
Germany Latest survey: % infants overweight 3.5
2016: % boys aged 5-9 with obesity 13.7
2016: % girls aged 5-9 with obesity 9
2016: % boys aged 10-19 with obesity 9.8
2016: % girls aged 10-19 with obesity 5.7
2010: % adolescent boys insufficient physical activity 77.9
2010: % adolescent girls insufficient physical activity 88.1
2016: % women with obesity 21.3
Latest survey: % early initiation of breast-feeding
2020 estimate: % women smoking 27.7
Latest survey: % infants with stunting 1.3
Predicted 2030: % children aged 5-9 with obesity 15.0
Predicted 2030: % children aged 10-19 with obesity 11.1
Predicted 2030: number of children aged 5-9 with obesity 523,306
Predicted 2030: number of children aged 10-19 with obesity 795,109
Predicted 2030: number of children aged 5-19 with obesity 1,318,415
Existence of any policies on marketing of foods to children, 2017
Existence of policies to reduce physical inactivity, 2017
Existence of policies to reduce unhealthy diet related to NCDs, 2017
CHO RISK SCORE 6.5/11
CHANCE OF MEETING WHO 2025 TARGET
18%

81Atlas of Childhood Obesity | Country Report Cards
Ghana Latest survey: % infants overweight 2.6
2016: % boys aged 5-9 with obesity 1.7
2016: % girls aged 5-9 with obesity 4.4
2016: % boys aged 10-19 with obesity 0.8
2016: % girls aged 10-19 with obesity 2.5
2010: % adolescent boys insufficient physical activity 87.5
2010: % adolescent girls insufficient physical activity 88.3
2016: % women with obesity 17.3
Latest survey: % early initiation of breast-feeding 55.7
2020 estimate: % women smoking 0.4
Latest survey: % infants with stunting 18.8
Predicted 2030: % children aged 5-9 with obesity 6.6
Predicted 2030: % children aged 10-19 with obesity 4.1
Predicted 2030: number of children aged 5-9 with obesity 254,058
Predicted 2030: number of children aged 10-19 with obesity 301,480
Predicted 2030: number of children aged 5-19 with obesity 555,538
Existence of any policies on marketing of foods to children, 2017
Existence of policies to reduce physical inactivity, 2017
Existence of policies to reduce unhealthy diet related to NCDs, 2017
CHO RISK SCORE 4.5/11
CHANCE OF MEETING WHO 2025 TARGET
5%

82Atlas of Childhood Obesity | Country Report Cards
Greece Latest survey: % infants overweight
2016: % boys aged 5-9 with obesity 21.2
2016: % girls aged 5-9 with obesity 14.2
2016: % boys aged 10-19 with obesity 14.4
2016: % girls aged 10-19 with obesity 8.8
2010: % adolescent boys insufficient physical activity 81.9
2010: % adolescent girls insufficient physical activity 89.7
2016: % women with obesity 26.4
Latest survey: % early initiation of breast-feeding
2020 estimate: % women smoking 30.2
Latest survey: % infants with stunting
Predicted 2030: % children aged 5-9 with obesity 22.8
Predicted 2030: % children aged 10-19 with obesity 16.2
Predicted 2030: number of children aged 5-9 with obesity 109,534
Predicted 2030: number of children aged 10-19 with obesity 171,929
Predicted 2030: number of children aged 5-19 with obesity 281,463
Existence of any policies on marketing of foods to children, 2017
Existence of policies to reduce physical inactivity, 2017
Existence of policies to reduce unhealthy diet related to NCDs, 2017
CHO RISK SCORE 8/11
CHANCE OF MEETING WHO 2025 TARGET
0%

83Atlas of Childhood Obesity | Country Report Cards
Latest survey: % infants overweight
2016: % boys aged 5-9 with obesity 13.8
2016: % girls aged 5-9 with obesity 13.4
2016: % boys aged 10-19 with obesity 9.1
2016: % girls aged 10-19 with obesity 9.3
2010: % adolescent boys insufficient physical activity 82.6
2010: % adolescent girls insufficient physical activity 86.7
2016: % women with obesity 30.2
Latest survey: % early initiation of breast-feeding
2020 estimate: % women smoking
Latest survey: % infants with stunting
Predicted 2030: % children aged 5-9 with obesity 22.5
Predicted 2030: % children aged 10-19 with obesity 17.5
Predicted 2030: number of children aged 5-9 with obesity 1,818
Predicted 2030: number of children aged 10-19 with obesity 3,194
Predicted 2030: number of children aged 5-19 with obesity 5,012
Grenada
Existence of any policies on marketing of foods to children, 2017
Existence of policies to reduce physical inactivity, 2017
Existence of policies to reduce unhealthy diet related to NCDs, 2017
CHO RISK SCORE 7/11
CHANCE OF MEETING WHO 2025 TARGET
2%

84Atlas of Childhood Obesity | Country Report Cards
Guatemala Latest survey: % infants overweight 4.9
2016: % boys aged 5-9 with obesity 12.9
2016: % girls aged 5-9 with obesity 12.2
2016: % boys aged 10-19 with obesity 8.4
2016: % girls aged 10-19 with obesity 8.5
2010: % adolescent boys insufficient physical activity 80.9
2010: % adolescent girls insufficient physical activity 88
2016: % women with obesity 27.5
Latest survey: % early initiation of breast-feeding 63.2
2020 estimate: % women smoking
Latest survey: % infants with stunting 46.7
Predicted 2030: % children aged 5-9 with obesity 20.6
Predicted 2030: % children aged 10-19 with obesity 15.5
Predicted 2030: number of children aged 5-9 with obesity 528,584
Predicted 2030: number of children aged 10-19 with obesity 733,697
Predicted 2030: number of children aged 5-19 with obesity 1,262,281
Existence of any policies on marketing of foods to children, 2017
Existence of policies to reduce physical inactivity, 2017
Existence of policies to reduce unhealthy diet related to NCDs, 2017
CHO RISK SCORE 7/11
CHANCE OF MEETING WHO 2025 TARGET
2%

85Atlas of Childhood Obesity | Country Report Cards
Latest survey: % infants overweight 4.0
2016: % boys aged 5-9 with obesity 1.4
2016: % girls aged 5-9 with obesity 3.4
2016: % boys aged 10-19 with obesity 0.7
2016: % girls aged 10-19 with obesity 1.8
2010: % adolescent boys insufficient physical activity
2010: % adolescent girls insufficient physical activity
2016: % women with obesity 12.0
Latest survey: % early initiation of breast-feeding
2020 estimate: % women smoking
Latest survey: % infants with stunting 32.4
Predicted 2030: % children aged 5-9 with obesity 6.4
Predicted 2030: % children aged 10-19 with obesity 3.9
Predicted 2030: number of children aged 5-9 with obesity 137,219
Predicted 2030: number of children aged 10-19 with obesity 151,513
Predicted 2030: number of children aged 5-19 with obesity 288,733
Guinea
Existence of any policies on marketing of foods to children, 2017
Existence of policies to reduce physical inactivity, 2017
Existence of policies to reduce unhealthy diet related to NCDs, 2017
CHO RISK SCORE 3.5/11
CHANCE OF MEETING WHO 2025 TARGET
3%

86Atlas of Childhood Obesity | Country Report Cards
Guinea-Bissau Latest survey: % infants overweight 2.3
2016: % boys aged 5-9 with obesity 2.3
2016: % girls aged 5-9 with obesity 4.2
2016: % boys aged 10-19 with obesity 1.2
2016: % girls aged 10-19 with obesity 2.4
2010: % adolescent boys insufficient physical activity
2010: % adolescent girls insufficient physical activity
2016: % women with obesity 14.3
Latest survey: % early initiation of breast-feeding
2020 estimate: % women smoking
Latest survey: % infants with stunting 27.6
Predicted 2030: % children aged 5-9 with obesity 8.3
Predicted 2030: % children aged 10-19 with obesity 5.4
Predicted 2030: number of children aged 5-9 with obesity 25,373
Predicted 2030: number of children aged 10-19 with obesity 29,367
Predicted 2030: number of children aged 5-19 with obesity 54,739
Existence of any policies on marketing of foods to children, 2017
Existence of policies to reduce physical inactivity, 2017
Existence of policies to reduce unhealthy diet related to NCDs, 2017
CHO RISK SCORE 3.5/11
CHANCE OF MEETING WHO 2025 TARGET
2%

87Atlas of Childhood Obesity | Country Report Cards
GuyanaLatest survey: % infants overweight 5.3
2016: % boys aged 5-9 with obesity 12.8
2016: % girls aged 5-9 with obesity 12.7
2016: % boys aged 10-19 with obesity 8.4
2016: % girls aged 10-19 with obesity 9
2010: % adolescent boys insufficient physical activity 81.9
2010: % adolescent girls insufficient physical activity 86.5
2016: % women with obesity 28.2
Latest survey: % early initiation of breast-feeding
2020 estimate: % women smoking
Latest survey: % infants with stunting 11.3
Predicted 2030: % children aged 5-9 with obesity 22.3
Predicted 2030: % children aged 10-19 with obesity 17.4
Predicted 2030: number of children aged 5-9 with obesity 16,294
Predicted 2030: number of children aged 10-19 with obesity 24,634
Predicted 2030: number of children aged 5-19 with obesity 40,928
Existence of any policies on marketing of foods to children, 2017
Existence of policies to reduce physical inactivity, 2017
Existence of policies to reduce unhealthy diet related to NCDs, 2017
CHO RISK SCORE 7/11
CHANCE OF MEETING WHO 2025 TARGET
1%
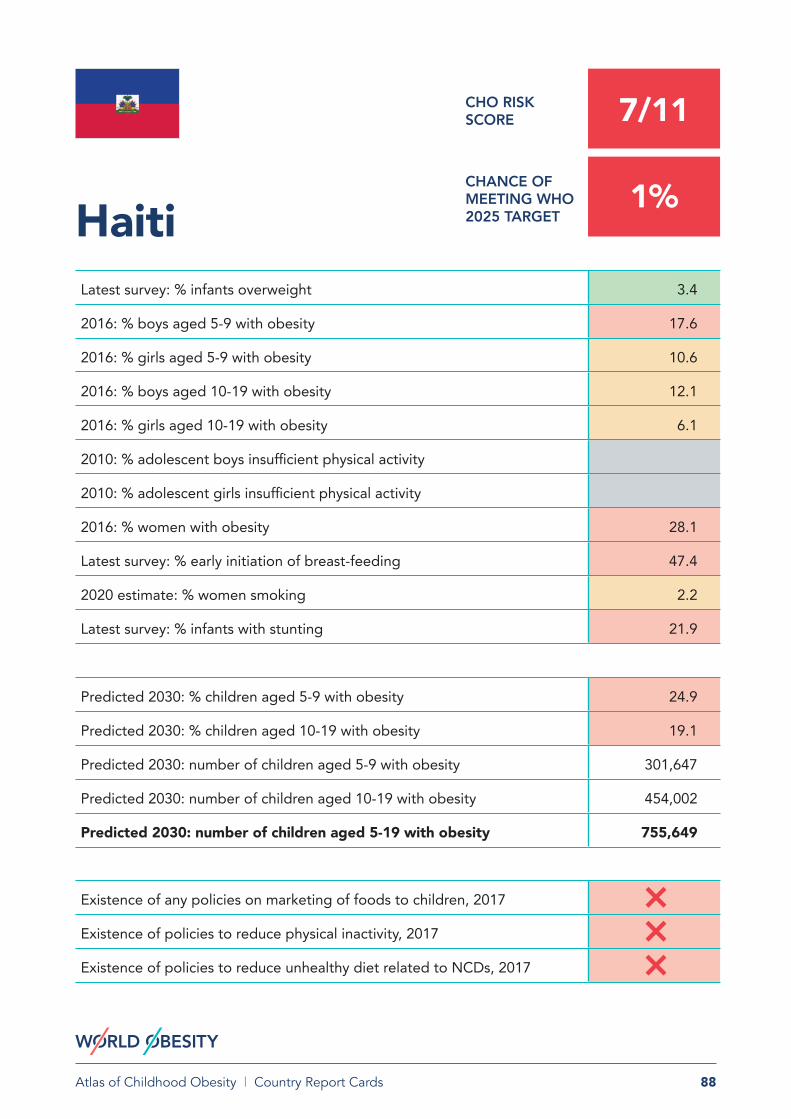
88Atlas of Childhood Obesity | Country Report Cards
Haiti Latest survey: % infants overweight 3.4
2016: % boys aged 5-9 with obesity 17.6
2016: % girls aged 5-9 with obesity 10.6
2016: % boys aged 10-19 with obesity 12.1
2016: % girls aged 10-19 with obesity 6.1
2010: % adolescent boys insufficient physical activity
2010: % adolescent girls insufficient physical activity
2016: % women with obesity 28.1
Latest survey: % early initiation of breast-feeding 47.4
2020 estimate: % women smoking 2.2
Latest survey: % infants with stunting 21.9
Predicted 2030: % children aged 5-9 with obesity 24.9
Predicted 2030: % children aged 10-19 with obesity 19.1
Predicted 2030: number of children aged 5-9 with obesity 301,647
Predicted 2030: number of children aged 10-19 with obesity 454,002
Predicted 2030: number of children aged 5-19 with obesity 755,649
Existence of any policies on marketing of foods to children, 2017
Existence of policies to reduce physical inactivity, 2017
Existence of policies to reduce unhealthy diet related to NCDs, 2017
CHO RISK SCORE 7/11
CHANCE OF MEETING WHO 2025 TARGET
1%

89Atlas of Childhood Obesity | Country Report Cards
Honduras Latest survey: % infants overweight 5.2
2016: % boys aged 5-9 with obesity 12.2
2016: % girls aged 5-9 with obesity 12.3
2016: % boys aged 10-19 with obesity 7.8
2016: % girls aged 10-19 with obesity 8.6
2010: % adolescent boys insufficient physical activity 80.3
2010: % adolescent girls insufficient physical activity 87.3
2016: % women with obesity 27.9
Latest survey: % early initiation of breast-feeding 63.9
2020 estimate: % women smoking 1.7
Latest survey: % infants with stunting 22.6
Predicted 2030: % children aged 5-9 with obesity 20.5
Predicted 2030: % children aged 10-19 with obesity 15.6
Predicted 2030: number of children aged 5-9 with obesity 211,797
Predicted 2030: number of children aged 10-19 with obesity 313,023
Predicted 2030: number of children aged 5-19 with obesity 524,819
Existence of any policies on marketing of foods to children, 2017
Existence of policies to reduce physical inactivity, 2017
Existence of policies to reduce unhealthy diet related to NCDs, 2017
CHO RISK SCORE 7/11
CHANCE OF MEETING WHO 2025 TARGET
2%

90Atlas of Childhood Obesity | Country Report Cards
Latest survey: % infants overweight
2016: % boys aged 5-9 with obesity 17.3
2016: % girls aged 5-9 with obesity 11.2
2016: % boys aged 10-19 with obesity 11.9
2016: % girls aged 10-19 with obesity 7.1
2010: % adolescent boys insufficient physical activity 74.4
2010: % adolescent girls insufficient physical activity 86.5
2016: % women with obesity 25.6
Latest survey: % early initiation of breast-feeding
2020 estimate: % women smoking 22.4
Latest survey: % infants with stunting
Predicted 2030: % children aged 5-9 with obesity 22.8
Predicted 2030: % children aged 10-19 with obesity 17.3
Predicted 2030: number of children aged 5-9 with obesity 106,669
Predicted 2030: number of children aged 10-19 with obesity 170,304
Predicted 2030: number of children aged 5-19 with obesity 276,973
Hungary
Existence of any policies on marketing of foods to children, 2017
Existence of policies to reduce physical inactivity, 2017
Existence of policies to reduce unhealthy diet related to NCDs, 2017
CHO RISK SCORE 8/11
CHANCE OF MEETING WHO 2025 TARGET
2%

91Atlas of Childhood Obesity | Country Report Cards
Latest survey: % infants overweight
2016: % boys aged 5-9 with obesity 15.7
2016: % girls aged 5-9 with obesity 9.4
2016: % boys aged 10-19 with obesity 10.8
2016: % girls aged 10-19 with obesity 6.1
2010: % adolescent boys insufficient physical activity 79.4
2010: % adolescent girls insufficient physical activity 88.3
2016: % women with obesity 20.2
Latest survey: % early initiation of breast-feeding
2020 estimate: % women smoking 12.6
Latest survey: % infants with stunting
Predicted 2030: % children aged 5-9 with obesity 14.8
Predicted 2030: % children aged 10-19 with obesity 10.5
Predicted 2030: number of children aged 5-9 with obesity 3,569
Predicted 2030: number of children aged 10-19 with obesity 5,174
Predicted 2030: number of children aged 5-19 with obesity 8,744
Iceland
Existence of any policies on marketing of foods to children, 2017
Existence of policies to reduce physical inactivity, 2017
Existence of policies to reduce unhealthy diet related to NCDs, 2017
CHO RISK SCORE 8/11
CHANCE OF MEETING WHO 2025 TARGET
32%

92Atlas of Childhood Obesity | Country Report Cards
India Latest survey: % infants overweight 2.4
2016: % boys aged 5-9 with obesity 3.7
2016: % girls aged 5-9 with obesity 2.6
2016: % boys aged 10-19 with obesity 1.8
2016: % girls aged 10-19 with obesity 1.1
2010: % adolescent boys insufficient physical activity 69.6
2010: % adolescent girls insufficient physical activity 71.6
2016: % women with obesity 5.3
Latest survey: % early initiation of breast-feeding 41.5
2020 estimate: % women smoking 1.2
Latest survey: % infants with stunting 37.9
Predicted 2030: % children aged 5-9 with obesity 10.8
Predicted 2030: % children aged 10-19 with obesity 6.2
Predicted 2030: number of children aged 5-9 with obesity 12,692,004
Predicted 2030: number of children aged 10-19 with obesity 14,789,136
Predicted 2030: number of children aged 5-19 with obesity 27,481,141
Existence of any policies on marketing of foods to children, 2017
Existence of policies to reduce physical inactivity, 2017
Existence of policies to reduce unhealthy diet related to NCDs, 2017
CHO RISK SCORE 4/11
CHANCE OF MEETING WHO 2025 TARGET
0%

93Atlas of Childhood Obesity | Country Report Cards
Latest survey: % infants overweight 11.5
2016: % boys aged 5-9 with obesity 9.8
2016: % girls aged 5-9 with obesity 7.1
2016: % boys aged 10-19 with obesity 5.8
2016: % girls aged 10-19 with obesity 3.9
2010: % adolescent boys insufficient physical activity 84.3
2010: % adolescent girls insufficient physical activity 83.1
2016: % women with obesity 9.3
Latest survey: % early initiation of breast-feeding 49.3
2020 estimate: % women smoking 3
Latest survey: % infants with stunting 36.4
Predicted 2030: % children aged 5-9 with obesity 17.7
Predicted 2030: % children aged 10-19 with obesity 11.8
Predicted 2030: number of children aged 5-9 with obesity 3,841,395
Predicted 2030: number of children aged 10-19 with obesity 5,235,021
Predicted 2030: number of children aged 5-19 with obesity 9,076,416
Indonesia
Existence of any policies on marketing of foods to children, 2017
Existence of policies to reduce physical inactivity, 2017
Existence of policies to reduce unhealthy diet related to NCDs, 2017
CHO RISK SCORE 7/11
CHANCE OF MEETING WHO 2025 TARGET
21%

94Atlas of Childhood Obesity | Country Report Cards
Latest survey: % infants overweight 6.9
2016: % boys aged 5-9 with obesity 13.1
2016: % girls aged 5-9 with obesity 9.8
2016: % boys aged 10-19 with obesity 9.3
2016: % girls aged 10-19 with obesity 8.1
2010: % adolescent boys insufficient physical activity
2010: % adolescent girls insufficient physical activity
2016: % women with obesity 33.5
Latest survey: % early initiation of breast-feeding
2020 estimate: % women smoking 0.4
Latest survey: % infants with stunting 6.8
Predicted 2030: % children aged 5-9 with obesity 17.6
Predicted 2030: % children aged 10-19 with obesity 14.1
Predicted 2030: number of children aged 5-9 with obesity 1,079,178
Predicted 2030: number of children aged 10-19 with obesity 1,944,425
Predicted 2030: number of children aged 5-19 with obesity 3,023,603
Iran
Existence of any policies on marketing of foods to children, 2017
Existence of policies to reduce physical inactivity, 2017
Existence of policies to reduce unhealthy diet related to NCDs, 2017
CHO RISK SCORE 5.5/11
CHANCE OF MEETING WHO 2025 TARGET
3%

95Atlas of Childhood Obesity | Country Report Cards
Latest survey: % infants overweight 11.4
2016: % boys aged 5-9 with obesity 18.1
2016: % girls aged 5-9 with obesity 17.1
2016: % boys aged 10-19 with obesity 12.4
2016: % girls aged 10-19 with obesity 12.8
2010: % adolescent boys insufficient physical activity 80.3
2010: % adolescent girls insufficient physical activity 91.4
2016: % women with obesity 38.3
Latest survey: % early initiation of breast-feeding
2020 estimate: % women smoking
Latest survey: % infants with stunting 22.1
Predicted 2030: % children aged 5-9 with obesity 24.7
Predicted 2030: % children aged 10-19 with obesity 19.3
Predicted 2030: number of children aged 5-9 with obesity 1,439,562
Predicted 2030: number of children aged 10-19 with obesity 2,037,743
Predicted 2030: number of children aged 5-19 with obesity 3,477,305
Iraq
Existence of any policies on marketing of foods to children, 2017
Existence of policies to reduce physical inactivity, 2017
Existence of policies to reduce unhealthy diet related to NCDs, 2017
CHO RISK SCORE 8.5/11
CHANCE OF MEETING WHO 2025 TARGET
4%

96Atlas of Childhood Obesity | Country Report Cards
Latest survey: % infants overweight
2016: % boys aged 5-9 with obesity 13.6
2016: % girls aged 5-9 with obesity 11.3
2016: % boys aged 10-19 with obesity 8.6
2016: % girls aged 10-19 with obesity 7.8
2010: % adolescent boys insufficient physical activity 64.6
2010: % adolescent girls insufficient physical activity 79.6
2016: % women with obesity 26.6
Latest survey: % early initiation of breast-feeding
2020 estimate: % women smoking 19.8
Latest survey: % infants with stunting
Predicted 2030: % children aged 5-9 with obesity 17.4
Predicted 2030: % children aged 10-19 with obesity 12.4
Predicted 2030: number of children aged 5-9 with obesity 56,694
Predicted 2030: number of children aged 10-19 with obesity 88,009
Predicted 2030: number of children aged 5-19 with obesity 144,703
Ireland
Existence of any policies on marketing of foods to children, 2017
Existence of policies to reduce physical inactivity, 2017
Existence of policies to reduce unhealthy diet related to NCDs, 2017
CHO RISK SCORE 7/11
CHANCE OF MEETING WHO 2025 TARGET
10%

97Atlas of Childhood Obesity | Country Report Cards
Latest survey: % infants overweight
2016: % boys aged 5-9 with obesity 17.6
2016: % girls aged 5-9 with obesity 11.9
2016: % boys aged 10-19 with obesity 12.2
2016: % girls aged 10-19 with obesity 8
2010: % adolescent boys insufficient physical activity 77.8
2010: % adolescent girls insufficient physical activity 89.5
2016: % women with obesity 27.3
Latest survey: % early initiation of breast-feeding
2020 estimate: % women smoking 18.7
Latest survey: % infants with stunting
Predicted 2030: % children aged 5-9 with obesity 16.9
Predicted 2030: % children aged 10-19 with obesity 12.0
Predicted 2030: number of children aged 5-9 with obesity 129,811
Predicted 2030: number of children aged 10-19 with obesity 186,236
Predicted 2030: number of children aged 5-19 with obesity 316,047
Israel
Existence of any policies on marketing of foods to children, 2017
Existence of policies to reduce physical inactivity, 2017
Existence of policies to reduce unhealthy diet related to NCDs, 2017
CHO RISK SCORE 8/11
CHANCE OF MEETING WHO 2025 TARGET
33%
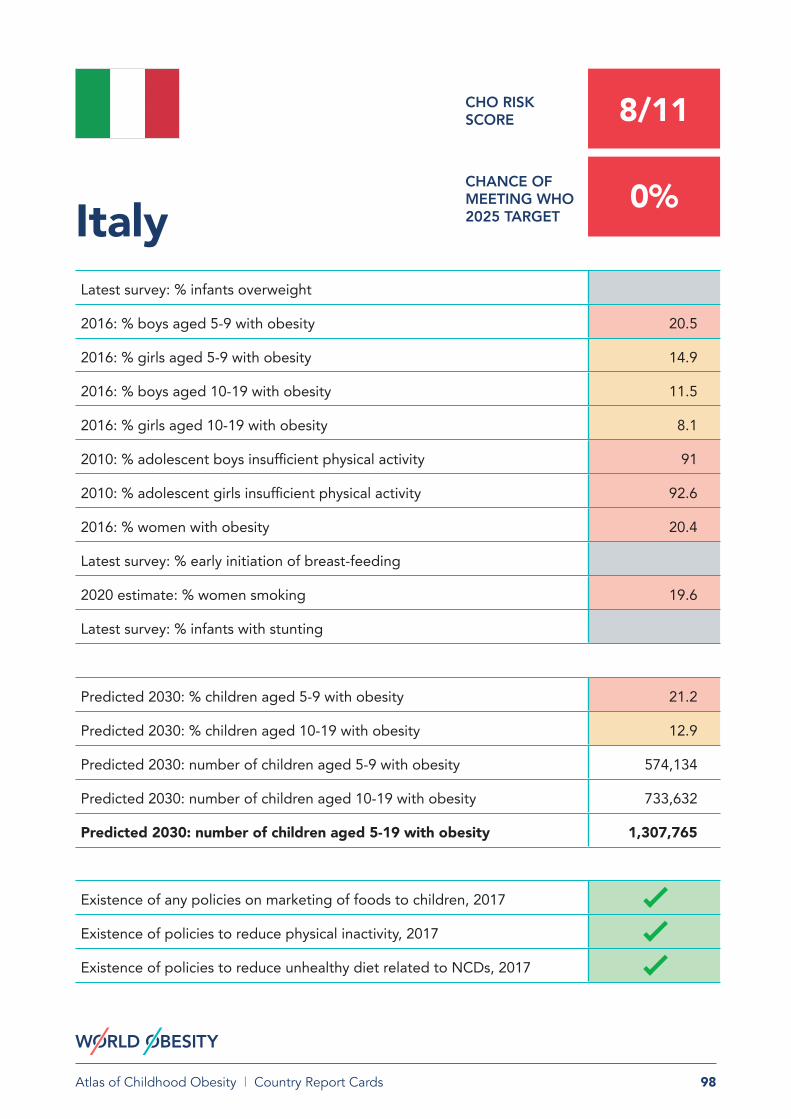
98Atlas of Childhood Obesity | Country Report Cards
Italy Latest survey: % infants overweight
2016: % boys aged 5-9 with obesity 20.5
2016: % girls aged 5-9 with obesity 14.9
2016: % boys aged 10-19 with obesity 11.5
2016: % girls aged 10-19 with obesity 8.1
2010: % adolescent boys insufficient physical activity 91
2010: % adolescent girls insufficient physical activity 92.6
2016: % women with obesity 20.4
Latest survey: % early initiation of breast-feeding
2020 estimate: % women smoking 19.6
Latest survey: % infants with stunting
Predicted 2030: % children aged 5-9 with obesity 21.2
Predicted 2030: % children aged 10-19 with obesity 12.9
Predicted 2030: number of children aged 5-9 with obesity 574,134
Predicted 2030: number of children aged 10-19 with obesity 733,632
Predicted 2030: number of children aged 5-19 with obesity 1,307,765
Existence of any policies on marketing of foods to children, 2017
Existence of policies to reduce physical inactivity, 2017
Existence of policies to reduce unhealthy diet related to NCDs, 2017
CHO RISK SCORE 8/11
CHANCE OF MEETING WHO 2025 TARGET
0%

99Atlas of Childhood Obesity | Country Report Cards
Latest survey: % infants overweight 1.5
2016: % boys aged 5-9 with obesity 3.6
2016: % girls aged 5-9 with obesity 5.4
2016: % boys aged 10-19 with obesity 2
2016: % girls aged 10-19 with obesity 3.6
2010: % adolescent boys insufficient physical activity
2010: % adolescent girls insufficient physical activity
2016: % women with obesity 15.8
Latest survey: % early initiation of breast-feeding
2020 estimate: % women smoking
Latest survey: % infants with stunting 21.6
Predicted 2030: % children aged 5-9 with obesity 9.8
Predicted 2030: % children aged 10-19 with obesity 6.9
Predicted 2030: number of children aged 5-9 with obesity 367,572
Predicted 2030: number of children aged 10-19 with obesity 456,586
Predicted 2030: number of children aged 5-19 with obesity 824,158
Ivory Coast
Existence of any policies on marketing of foods to children, 2017
Existence of policies to reduce physical inactivity, 2017
Existence of policies to reduce unhealthy diet related to NCDs, 2017
CHO RISK SCORE 4.5/11
CHANCE OF MEETING WHO 2025 TARGET
3%

100Atlas of Childhood Obesity | Country Report Cards
Latest survey: % infants overweight 8.3
2016: % boys aged 5-9 with obesity 16.8
2016: % girls aged 5-9 with obesity 16.1
2016: % boys aged 10-19 with obesity 11
2016: % girls aged 10-19 with obesity 11.9
2010: % adolescent boys insufficient physical activity
2010: % adolescent girls insufficient physical activity
2016: % women with obesity 34.7
Latest survey: % early initiation of breast-feeding
2020 estimate: % women smoking 5.2
Latest survey: % infants with stunting 6.0
Predicted 2030: % children aged 5-9 with obesity 25.1
Predicted 2030: % children aged 10-19 with obesity 19.9
Predicted 2030: number of children aged 5-9 with obesity 56,423
Predicted 2030: number of children aged 10-19 with obesity 91,072
Predicted 2030: number of children aged 5-19 with obesity 147,495
Jamaica
Existence of any policies on marketing of foods to children, 2017
Existence of policies to reduce physical inactivity, 2017
Existence of policies to reduce unhealthy diet related to NCDs, 2017
CHO RISK SCORE 7/11
CHANCE OF MEETING WHO 2025 TARGET
2%

101Atlas of Childhood Obesity | Country Report Cards
Latest survey: % infants overweight 1.5
2016: % boys aged 5-9 with obesity 7
2016: % girls aged 5-9 with obesity 2.9
2016: % boys aged 10-19 with obesity 3.9
2016: % girls aged 10-19 with obesity 1.1
2010: % adolescent boys insufficient physical activity
2010: % adolescent girls insufficient physical activity
2016: % women with obesity 3.9
Latest survey: % early initiation of breast-feeding
2020 estimate: % women smoking 9.6
Latest survey: % infants with stunting 7.1
Predicted 2030: % children aged 5-9 with obesity 5.5
Predicted 2030: % children aged 10-19 with obesity 2.9
Predicted 2030: number of children aged 5-9 with obesity 269,017
Predicted 2030: number of children aged 10-19 with obesity 298,989
Predicted 2030: number of children aged 5-19 with obesity 568,006
Japan
Existence of any policies on marketing of foods to children, 2017
Existence of policies to reduce physical inactivity, 2017
Existence of policies to reduce unhealthy diet related to NCDs, 2017
CHO RISK SCORE 3/11
CHANCE OF MEETING WHO 2025 TARGET
44%

102Atlas of Childhood Obesity | Country Report Cards
Latest survey: % infants overweight 4.7
2016: % boys aged 5-9 with obesity 15.4
2016: % girls aged 5-9 with obesity 14.4
2016: % boys aged 10-19 with obesity 11.7
2016: % girls aged 10-19 with obesity 11.6
2010: % adolescent boys insufficient physical activity 82.3
2010: % adolescent girls insufficient physical activity 88.9
2016: % women with obesity 44.6
Latest survey: % early initiation of breast-feeding 18.5
2020 estimate: % women smoking 12.1
Latest survey: % infants with stunting 7.8
Predicted 2030: % children aged 5-9 with obesity 20.7
Predicted 2030: % children aged 10-19 with obesity 17.1
Predicted 2030: number of children aged 5-9 with obesity 176,757
Predicted 2030: number of children aged 10-19 with obesity 316,666
Predicted 2030: number of children aged 5-19 with obesity 493,423
Jordan
Existence of any policies on marketing of foods to children, 2017
Existence of policies to reduce physical inactivity, 2017
Existence of policies to reduce unhealthy diet related to NCDs, 2017
CHO RISK SCORE 8/11
CHANCE OF MEETING WHO 2025 TARGET
9%

103Atlas of Childhood Obesity | Country Report Cards
Latest survey: % infants overweight 9.3
2016: % boys aged 5-9 with obesity 10.2
2016: % girls aged 5-9 with obesity 6.2
2016: % boys aged 10-19 with obesity 6.6
2016: % girls aged 10-19 with obesity 4.1
2010: % adolescent boys insufficient physical activity
2010: % adolescent girls insufficient physical activity
2016: % women with obesity 23.6
Latest survey: % early initiation of breast-feeding
2020 estimate: % women smoking 8.7
Latest survey: % infants with stunting 8.0
Predicted 2030: % children aged 5-9 with obesity 14.3
Predicted 2030: % children aged 10-19 with obesity 10.5
Predicted 2030: number of children aged 5-9 with obesity 206,505
Predicted 2030: number of children aged 10-19 with obesity 330,401
Predicted 2030: number of children aged 5-19 with obesity 536,906
Kazakhstan
Existence of any policies on marketing of foods to children, 2017
Existence of policies to reduce physical inactivity, 2017
Existence of policies to reduce unhealthy diet related to NCDs, 2017
CHO RISK SCORE 5.5/11
CHANCE OF MEETING WHO 2025 TARGET
5%

104Atlas of Childhood Obesity | Country Report Cards
Latest survey: % infants overweight 4.1
2016: % boys aged 5-9 with obesity 1.8
2016: % girls aged 5-9 with obesity 4.4
2016: % boys aged 10-19 with obesity 0.9
2016: % girls aged 10-19 with obesity 2.6
2010: % adolescent boys insufficient physical activity 85.7
2010: % adolescent girls insufficient physical activity 88.9
2016: % women with obesity 11.6
Latest survey: % early initiation of breast-feeding 62.2
2020 estimate: % women smoking 1.9
Latest survey: % infants with stunting 26.2
Predicted 2030: % children aged 5-9 with obesity 8.4
Predicted 2030: % children aged 10-19 with obesity 5.5
Predicted 2030: number of children aged 5-9 with obesity 670,834
Predicted 2030: number of children aged 10-19 with obesity 793,121
Predicted 2030: number of children aged 5-19 with obesity 1,463,954
Kenya
Existence of any policies on marketing of foods to children, 2017
Existence of policies to reduce physical inactivity, 2017
Existence of policies to reduce unhealthy diet related to NCDs, 2017
CHO RISK SCORE 4/11
CHANCE OF MEETING WHO 2025 TARGET
1%

105Atlas of Childhood Obesity | Country Report Cards
Latest survey: % infants overweight 15.9
2016: % boys aged 5-9 with obesity 26.8
2016: % girls aged 5-9 with obesity 28.3
2016: % boys aged 10-19 with obesity 20.2
2016: % girls aged 10-19 with obesity 21.6
2010: % adolescent boys insufficient physical activity 78
2010: % adolescent girls insufficient physical activity 85.5
2016: % women with obesity 52.0
Latest survey: % early initiation of breast-feeding
2020 estimate: % women smoking 38.8
Latest survey: % infants with stunting 34.4
Predicted 2030: % children aged 5-9 with obesity 38.7
Predicted 2030: % children aged 10-19 with obesity 33.1
Predicted 2030: number of children aged 5-9 with obesity 4,170
Predicted 2030: number of children aged 10-19 with obesity 6,848
Predicted 2030: number of children aged 5-19 with obesity 11,017
Kiribati
Existence of any policies on marketing of foods to children, 2017
Existence of policies to reduce physical inactivity, 2017
Existence of policies to reduce unhealthy diet related to NCDs, 2017
CHO RISK SCORE 10.5/11
CHANCE OF MEETING WHO 2025 TARGET
1%

106Atlas of Childhood Obesity | Country Report Cards
Korea, SouthLatest survey: % infants overweight
2016: % boys aged 5-9 with obesity 17.4
2016: % girls aged 5-9 with obesity 7.1
2016: % boys aged 10-19 with obesity 6.8
2016: % girls aged 10-19 with obesity 10.1
2010: % adolescent boys insufficient physical activity
2010: % adolescent girls insufficient physical activity
2016: % women with obesity
Latest survey: % early initiation of breast-feeding
2020 estimate: % women smoking
Latest survey: % infants with stunting
Predicted 2030: % children aged 5-9 with obesity 17.0
Predicted 2030: % children aged 10-19 with obesity 10.6
Predicted 2030: number of children aged 5-9 with obesity 405,392
Predicted 2030: number of children aged 10-19 with obesity 505,227
Predicted 2030: number of children aged 5-19 with obesity 910,619
Existence of any policies on marketing of foods to children, 2017
Existence of policies to reduce physical inactivity, 2017
Existence of policies to reduce unhealthy diet related to NCDs, 2017
CHO RISK SCORE 6/11
CHANCE OF MEETING WHO 2025 TARGET
4%

107Atlas of Childhood Obesity | Country Report Cards
Kuwait Latest survey: % infants overweight 6.0
2016: % boys aged 5-9 with obesity 24.8
2016: % girls aged 5-9 with obesity 21.2
2016: % boys aged 10-19 with obesity 25.7
2016: % girls aged 10-19 with obesity 19.7
2010: % adolescent boys insufficient physical activity 77
2010: % adolescent girls insufficient physical activity 92.9
2016: % women with obesity 47.1
Latest survey: % early initiation of breast-feeding
2020 estimate: % women smoking
Latest survey: % infants with stunting 4.9
Predicted 2030: % children aged 5-9 with obesity 26.9
Predicted 2030: % children aged 10-19 with obesity 26.6
Predicted 2030: number of children aged 5-9 with obesity 96,603
Predicted 2030: number of children aged 10-19 with obesity 185,572
Predicted 2030: number of children aged 5-19 with obesity 282,175
Existence of any policies on marketing of foods to children, 2017
Existence of policies to reduce physical inactivity, 2017
Existence of policies to reduce unhealthy diet related to NCDs, 2017
CHO RISK SCORE 8.5/11
CHANCE OF MEETING WHO 2025 TARGET
17%

108Atlas of Childhood Obesity | Country Report Cards
Kyrgyzstan Latest survey: % infants overweight 7.0
2016: % boys aged 5-9 with obesity 6.6
2016: % girls aged 5-9 with obesity 3.8
2016: % boys aged 10-19 with obesity 3.9
2016: % girls aged 10-19 with obesity 2.1
2010: % adolescent boys insufficient physical activity
2010: % adolescent girls insufficient physical activity
2016: % women with obesity 19.5
Latest survey: % early initiation of breast-feeding
2020 estimate: % women smoking 3.3
Latest survey: % infants with stunting 12.9
Predicted 2030: % children aged 5-9 with obesity 11.2
Predicted 2030: % children aged 10-19 with obesity 7.6
Predicted 2030: number of children aged 5-9 with obesity 74,095
Predicted 2030: number of children aged 10-19 with obesity 105,573
Predicted 2030: number of children aged 5-19 with obesity 179,668
Existence of any policies on marketing of foods to children, 2017
Existence of policies to reduce physical inactivity, 2017
Existence of policies to reduce unhealthy diet related to NCDs, 2017
CHO RISK SCORE 4.5/11
CHANCE OF MEETING WHO 2025 TARGET
3%

109Atlas of Childhood Obesity | Country Report Cards
Latest survey: % infants overweight 2.0
2016: % boys aged 5-9 with obesity 8.6
2016: % girls aged 5-9 with obesity 4.4
2016: % boys aged 10-19 with obesity 4.9
2016: % girls aged 10-19 with obesity 2.3
2010: % adolescent boys insufficient physical activity
2010: % adolescent girls insufficient physical activity
2016: % women with obesity 7.0
Latest survey: % early initiation of breast-feeding
2020 estimate: % women smoking 7
Latest survey: % infants with stunting 44.2
Predicted 2030: % children aged 5-9 with obesity 16.9
Predicted 2030: % children aged 10-19 with obesity 11.7
Predicted 2030: number of children aged 5-9 with obesity 142,811
Predicted 2030: number of children aged 10-19 with obesity 198,973
Predicted 2030: number of children aged 5-19 with obesity 341,785
Laos
Existence of any policies on marketing of foods to children, 2017
Existence of policies to reduce physical inactivity, 2017
Existence of policies to reduce unhealthy diet related to NCDs, 2017
CHO RISK SCORE 4/11
CHANCE OF MEETING WHO 2025 TARGET
0%

110Atlas of Childhood Obesity | Country Report Cards
Latest survey: % infants overweight
2016: % boys aged 5-9 with obesity 11.5
2016: % girls aged 5-9 with obesity 6.5
2016: % boys aged 10-19 with obesity 7.5
2016: % girls aged 10-19 with obesity 4.1
2010: % adolescent boys insufficient physical activity 77
2010: % adolescent girls insufficient physical activity 82.3
2016: % women with obesity 26.2
Latest survey: % early initiation of breast-feeding
2020 estimate: % women smoking 24.2
Latest survey: % infants with stunting
Predicted 2030: % children aged 5-9 with obesity 14.1
Predicted 2030: % children aged 10-19 with obesity 10.1
Predicted 2030: number of children aged 5-9 with obesity 14,636
Predicted 2030: number of children aged 10-19 with obesity 22,201
Predicted 2030: number of children aged 5-19 with obesity 36,837
Latvia
Existence of any policies on marketing of foods to children, 2017
Existence of policies to reduce physical inactivity, 2017
Existence of policies to reduce unhealthy diet related to NCDs, 2017
CHO RISK SCORE 7/11
CHANCE OF MEETING WHO 2025 TARGET
9%
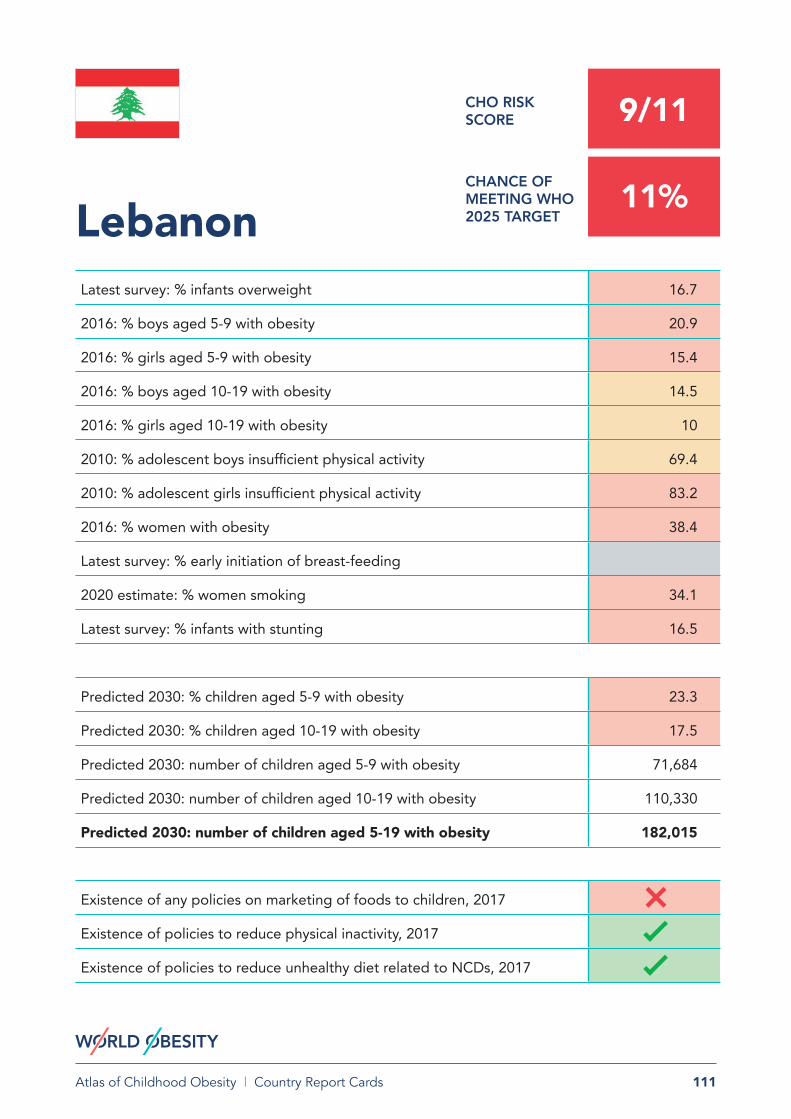
111Atlas of Childhood Obesity | Country Report Cards
Latest survey: % infants overweight 16.7
2016: % boys aged 5-9 with obesity 20.9
2016: % girls aged 5-9 with obesity 15.4
2016: % boys aged 10-19 with obesity 14.5
2016: % girls aged 10-19 with obesity 10
2010: % adolescent boys insufficient physical activity 69.4
2010: % adolescent girls insufficient physical activity 83.2
2016: % women with obesity 38.4
Latest survey: % early initiation of breast-feeding
2020 estimate: % women smoking 34.1
Latest survey: % infants with stunting 16.5
Predicted 2030: % children aged 5-9 with obesity 23.3
Predicted 2030: % children aged 10-19 with obesity 17.5
Predicted 2030: number of children aged 5-9 with obesity 71,684
Predicted 2030: number of children aged 10-19 with obesity 110,330
Predicted 2030: number of children aged 5-19 with obesity 182,015
Lebanon
Existence of any policies on marketing of foods to children, 2017
Existence of policies to reduce physical inactivity, 2017
Existence of policies to reduce unhealthy diet related to NCDs, 2017
CHO RISK SCORE 9/11
CHANCE OF MEETING WHO 2025 TARGET
11%

112Atlas of Childhood Obesity | Country Report Cards
Latest survey: % infants overweight 7.5
2016: % boys aged 5-9 with obesity 2.1
2016: % girls aged 5-9 with obesity 10.9
2016: % boys aged 10-19 with obesity 1
2016: % girls aged 10-19 with obesity 7.6
2010: % adolescent boys insufficient physical activity
2010: % adolescent girls insufficient physical activity
2016: % women with obesity 27.7
Latest survey: % early initiation of breast-feeding 65.3
2020 estimate: % women smoking 0.4
Latest survey: % infants with stunting 33.4
Predicted 2030: % children aged 5-9 with obesity 16.7
Predicted 2030: % children aged 10-19 with obesity 12.7
Predicted 2030: number of children aged 5-9 with obesity 43,628
Predicted 2030: number of children aged 10-19 with obesity 65,438
Predicted 2030: number of children aged 5-19 with obesity 109,067
Lesotho
Existence of any policies on marketing of foods to children, 2017
Existence of policies to reduce physical inactivity, 2017
Existence of policies to reduce unhealthy diet related to NCDs, 2017
CHO RISK SCORE 5/11
CHANCE OF MEETING WHO 2025 TARGET
0%

113Atlas of Childhood Obesity | Country Report Cards
Latest survey: % infants overweight 3.2
2016: % boys aged 5-9 with obesity 1.9
2016: % girls aged 5-9 with obesity 3.6
2016: % boys aged 10-19 with obesity 0.9
2016: % girls aged 10-19 with obesity 2
2010: % adolescent boys insufficient physical activity
2010: % adolescent girls insufficient physical activity
2016: % women with obesity 14.8
Latest survey: % early initiation of breast-feeding 61.4
2020 estimate: % women smoking 2
Latest survey: % infants with stunting 32.1
Predicted 2030: % children aged 5-9 with obesity 6.2
Predicted 2030: % children aged 10-19 with obesity 3.7
Predicted 2030: number of children aged 5-9 with obesity 48,813
Predicted 2030: number of children aged 10-19 with obesity 52,350
Predicted 2030: number of children aged 5-19 with obesity 101,163
Liberia
Existence of any policies on marketing of foods to children, 2017
Existence of policies to reduce physical inactivity, 2017
Existence of policies to reduce unhealthy diet related to NCDs, 2017
CHO RISK SCORE 3/11
CHANCE OF MEETING WHO 2025 TARGET
5%

114Atlas of Childhood Obesity | Country Report Cards
Libya Latest survey: % infants overweight 22.4
2016: % boys aged 5-9 with obesity 19.3
2016: % girls aged 5-9 with obesity 16.4
2016: % boys aged 10-19 with obesity 13.6
2016: % girls aged 10-19 with obesity 11.8
2010: % adolescent boys insufficient physical activity 78.2
2010: % adolescent girls insufficient physical activity 88.2
2016: % women with obesity 41.1
Latest survey: % early initiation of breast-feeding
2020 estimate: % women smoking
Latest survey: % infants with stunting 21.0
Predicted 2030: % children aged 5-9 with obesity 24.0
Predicted 2030: % children aged 10-19 with obesity 18.5
Predicted 2030: number of children aged 5-9 with obesity 128,721
Predicted 2030: number of children aged 10-19 with obesity 223,870
Predicted 2030: number of children aged 5-19 with obesity 352,591
Existence of any policies on marketing of foods to children, 2017
Existence of policies to reduce physical inactivity, 2017
Existence of policies to reduce unhealthy diet related to NCDs, 2017
CHO RISK SCORE 9/11
CHANCE OF MEETING WHO 2025 TARGET
7%

115Atlas of Childhood Obesity | Country Report Cards
Lithuania Latest survey: % infants overweight
2016: % boys aged 5-9 with obesity 11.7
2016: % girls aged 5-9 with obesity 6.5
2016: % boys aged 10-19 with obesity 7.1
2016: % girls aged 10-19 with obesity 3.8
2010: % adolescent boys insufficient physical activity 80.6
2010: % adolescent girls insufficient physical activity 86.4
2016: % women with obesity 28.9
Latest survey: % early initiation of breast-feeding
2020 estimate: % women smoking 22.9
Latest survey: % infants with stunting
Predicted 2030: % children aged 5-9 with obesity 14.4
Predicted 2030: % children aged 10-19 with obesity 10.0
Predicted 2030: number of children aged 5-9 with obesity 22,885
Predicted 2030: number of children aged 10-19 with obesity 33,203
Predicted 2030: number of children aged 5-19 with obesity 56,088
Existence of any policies on marketing of foods to children, 2017
Existence of policies to reduce physical inactivity, 2017
Existence of policies to reduce unhealthy diet related to NCDs, 2017
CHO RISK SCORE 7/11
CHANCE OF MEETING WHO 2025 TARGET
9%

116Atlas of Childhood Obesity | Country Report Cards
Luxembourg Latest survey: % infants overweight
2016: % boys aged 5-9 with obesity 13.8
2016: % girls aged 5-9 with obesity 8.4
2016: % boys aged 10-19 with obesity 8.8
2016: % girls aged 10-19 with obesity 5.1
2010: % adolescent boys insufficient physical activity 73.4
2010: % adolescent girls insufficient physical activity 81.8
2016: % women with obesity 21.6
Latest survey: % early initiation of breast-feeding
2020 estimate: % women smoking 20.4
Latest survey: % infants with stunting
Predicted 2030: % children aged 5-9 with obesity 14.2
Predicted 2030: % children aged 10-19 with obesity 9.7
Predicted 2030: number of children aged 5-9 with obesity 5,221
Predicted 2030: number of children aged 10-19 with obesity 7,095
Predicted 2030: number of children aged 5-19 with obesity 12,316
Existence of any policies on marketing of foods to children, 2017
Existence of policies to reduce physical inactivity, 2017
Existence of policies to reduce unhealthy diet related to NCDs, 2017
CHO RISK SCORE 7.5/11
CHANCE OF MEETING WHO 2025 TARGET
23%

117Atlas of Childhood Obesity | Country Report Cards
Madagascar Latest survey: % infants overweight 1.1
2016: % boys aged 5-9 with obesity 2.8
2016: % girls aged 5-9 with obesity 2.6
2016: % boys aged 10-19 with obesity 1.4
2016: % girls aged 10-19 with obesity 1.2
2010: % adolescent boys insufficient physical activity
2010: % adolescent girls insufficient physical activity
2016: % women with obesity 7.9
Latest survey: % early initiation of breast-feeding 70.7
2020 estimate: % women smoking
Latest survey: % infants with stunting 48.9
Predicted 2030: % children aged 5-9 with obesity 8.0
Predicted 2030: % children aged 10-19 with obesity 4.8
Predicted 2030: number of children aged 5-9 with obesity 367,685
Predicted 2030: number of children aged 10-19 with obesity 378,871
Predicted 2030: number of children aged 5-19 with obesity 746,556
Existence of any policies on marketing of foods to children, 2017
Existence of policies to reduce physical inactivity, 2017
Existence of policies to reduce unhealthy diet related to NCDs, 2017
CHO RISK SCORE 3/11
CHANCE OF MEETING WHO 2025 TARGET
1%

118Atlas of Childhood Obesity | Country Report Cards
Malawi Latest survey: % infants overweight 4.6
2016: % boys aged 5-9 with obesity 1.6
2016: % girls aged 5-9 with obesity 3.8
2016: % boys aged 10-19 with obesity 0.8
2016: % girls aged 10-19 with obesity 2.3
2010: % adolescent boys insufficient physical activity
2010: % adolescent girls insufficient physical activity
2016: % women with obesity 9.6
Latest survey: % early initiation of breast-feeding 76.3
2020 estimate: % women smoking 5.2
Latest survey: % infants with stunting 37.4
Predicted 2030: % children aged 5-9 with obesity 7.6
Predicted 2030: % children aged 10-19 with obesity 5.1
Predicted 2030: number of children aged 5-9 with obesity 268,965
Predicted 2030: number of children aged 10-19 with obesity 308,899
Predicted 2030: number of children aged 5-19 with obesity 577,864
Existence of any policies on marketing of foods to children, 2017
Existence of policies to reduce physical inactivity, 2017
Existence of policies to reduce unhealthy diet related to NCDs, 2017
CHO RISK SCORE 3/11
CHANCE OF MEETING WHO 2025 TARGET
1%

119Atlas of Childhood Obesity | Country Report Cards
Malaysia Latest survey: % infants overweight 6.0
2016: % boys aged 5-9 with obesity 19
2016: % girls aged 5-9 with obesity 12.4
2016: % boys aged 10-19 with obesity 13.5
2016: % girls aged 10-19 with obesity 9.3
2010: % adolescent boys insufficient physical activity 80.1
2010: % adolescent girls insufficient physical activity 91.5
2016: % women with obesity 18.6
Latest survey: % early initiation of breast-feeding
2020 estimate: % women smoking 1.1
Latest survey: % infants with stunting 20.7
Predicted 2030: % children aged 5-9 with obesity 24.9
Predicted 2030: % children aged 10-19 with obesity 20.0
Predicted 2030: number of children aged 5-9 with obesity 684,755
Predicted 2030: number of children aged 10-19 with obesity 1,085,876
Predicted 2030: number of children aged 5-19 with obesity 1,770,631
Existence of any policies on marketing of foods to children, 2017
Existence of policies to reduce physical inactivity, 2017
Existence of policies to reduce unhealthy diet related to NCDs, 2017
CHO RISK SCORE 7.5/11
CHANCE OF MEETING WHO 2025 TARGET
1%

120Atlas of Childhood Obesity | Country Report Cards
Maldives Latest survey: % infants overweight 6.1
2016: % boys aged 5-9 with obesity 12.4
2016: % girls aged 5-9 with obesity 6.9
2016: % boys aged 10-19 with obesity 7.6
2016: % girls aged 10-19 with obesity 4.5
2010: % adolescent boys insufficient physical activity 76.7
2010: % adolescent girls insufficient physical activity 82.6
2016: % women with obesity 11.9
Latest survey: % early initiation of breast-feeding 60.5
2020 estimate: % women smoking
Latest survey: % infants with stunting 18.6
Predicted 2030: % children aged 5-9 with obesity 21.8
Predicted 2030: % children aged 10-19 with obesity 16.7
Predicted 2030: number of children aged 5-9 with obesity 7,096
Predicted 2030: number of children aged 10-19 with obesity 12,089
Predicted 2030: number of children aged 5-19 with obesity 19,186
Existence of any policies on marketing of foods to children, 2017
Existence of policies to reduce physical inactivity, 2017
Existence of policies to reduce unhealthy diet related to NCDs, 2017
CHO RISK SCORE 6.5/11
CHANCE OF MEETING WHO 2025 TARGET
0%

121Atlas of Childhood Obesity | Country Report Cards
Mali Latest survey: % infants overweight 1.9
2016: % boys aged 5-9 with obesity 1.9
2016: % girls aged 5-9 with obesity 5
2016: % boys aged 10-19 with obesity 1
2016: % girls aged 10-19 with obesity 3.2
2010: % adolescent boys insufficient physical activity
2010: % adolescent girls insufficient physical activity
2016: % women with obesity 12.9
Latest survey: % early initiation of breast-feeding
2020 estimate: % women smoking 3
Latest survey: % infants with stunting 30.4
Predicted 2030: % children aged 5-9 with obesity 8.6
Predicted 2030: % children aged 10-19 with obesity 5.9
Predicted 2030: number of children aged 5-9 with obesity 338,861
Predicted 2030: number of children aged 10-19 with obesity 376,275
Predicted 2030: number of children aged 5-19 with obesity 715,136
Existence of any policies on marketing of foods to children, 2017
Existence of policies to reduce physical inactivity, 2017
Existence of policies to reduce unhealthy diet related to NCDs, 2017
CHO RISK SCORE 4/11
CHANCE OF MEETING WHO 2025 TARGET
2%

122Atlas of Childhood Obesity | Country Report Cards
Malta Latest survey: % infants overweight
2016: % boys aged 5-9 with obesity 19.7
2016: % girls aged 5-9 with obesity 14.2
2016: % boys aged 10-19 with obesity 13.9
2016: % girls aged 10-19 with obesity 9.6
2010: % adolescent boys insufficient physical activity 78.2
2010: % adolescent girls insufficient physical activity 84.5
2016: % women with obesity 29.6
Latest survey: % early initiation of breast-feeding
2020 estimate: % women smoking 18.6
Latest survey: % infants with stunting
Predicted 2030: % children aged 5-9 with obesity 19.4
Predicted 2030: % children aged 10-19 with obesity 14.3
Predicted 2030: number of children aged 5-9 with obesity 3,772
Predicted 2030: number of children aged 10-19 with obesity 5,751
Predicted 2030: number of children aged 5-19 with obesity 9,523
Existence of any policies on marketing of foods to children, 2017
Existence of policies to reduce physical inactivity, 2017
Existence of policies to reduce unhealthy diet related to NCDs, 2017
CHO RISK SCORE 8/11
CHANCE OF MEETING WHO 2025 TARGET
32%

123Atlas of Childhood Obesity | Country Report Cards
Marshall Islands Latest survey: % infants overweight 4.1
2016: % boys aged 5-9 with obesity 30.3
2016: % girls aged 5-9 with obesity 32.2
2016: % boys aged 10-19 with obesity 23.4
2016: % girls aged 10-19 with obesity 25.4
2010: % adolescent boys insufficient physical activity
2010: % adolescent girls insufficient physical activity
2016: % women with obesity 59.0
Latest survey: % early initiation of breast-feeding
2020 estimate: % women smoking
Latest survey: % infants with stunting 34.8
Predicted 2030: % children aged 5-9 with obesity 41.1
Predicted 2030: % children aged 10-19 with obesity 35.4
Predicted 2030: number of children aged 5-9 with obesity 1,966
Predicted 2030: number of children aged 10-19 with obesity 3,258
Predicted 2030: number of children aged 5-19 with obesity 5,224
Existence of any policies on marketing of foods to children, 2017
Existence of policies to reduce physical inactivity, 2017
Existence of policies to reduce unhealthy diet related to NCDs, 2017
CHO RISK SCORE 8/11
CHANCE OF MEETING WHO 2025 TARGET
1%

124Atlas of Childhood Obesity | Country Report Cards
Mauritania Latest survey: % infants overweight 1.3
2016: % boys aged 5-9 with obesity 3.5
2016: % girls aged 5-9 with obesity 6.8
2016: % boys aged 10-19 with obesity 2
2016: % girls aged 10-19 with obesity 4.6
2010: % adolescent boys insufficient physical activity 83.1
2010: % adolescent girls insufficient physical activity 92.3
2016: % women with obesity 19.3
Latest survey: % early initiation of breast-feeding
2020 estimate: % women smoking 3.2
Latest survey: % infants with stunting 27.9
Predicted 2030: % children aged 5-9 with obesity 10.2
Predicted 2030: % children aged 10-19 with obesity 7.3
Predicted 2030: number of children aged 5-9 with obesity 67,940
Predicted 2030: number of children aged 10-19 with obesity 87,988
Predicted 2030: number of children aged 5-19 with obesity 155,928
Existence of any policies on marketing of foods to children, 2017
Existence of policies to reduce physical inactivity, 2017
Existence of policies to reduce unhealthy diet related to NCDs, 2017
CHO RISK SCORE 5.5/11
CHANCE OF MEETING WHO 2025 TARGET
5%

125Atlas of Childhood Obesity | Country Report Cards
Mauritius Latest survey: % infants overweight 6.5
2016: % boys aged 5-9 with obesity 5.3
2016: % girls aged 5-9 with obesity 7.1
2016: % boys aged 10-19 with obesity 2.9
2016: % girls aged 10-19 with obesity 4.5
2010: % adolescent boys insufficient physical activity 74.2
2010: % adolescent girls insufficient physical activity 86.8
2016: % women with obesity 16.4
Latest survey: % early initiation of breast-feeding
2020 estimate: % women smoking 2.9
Latest survey: % infants with stunting 13.6
Predicted 2030: % children aged 5-9 with obesity 12.3
Predicted 2030: % children aged 10-19 with obesity 8.6
Predicted 2030: number of children aged 5-9 with obesity 8,655
Predicted 2030: number of children aged 10-19 with obesity 12,081
Predicted 2030: number of children aged 5-19 with obesity 20,737
Existence of any policies on marketing of foods to children, 2017
Existence of policies to reduce physical inactivity, 2017
Existence of policies to reduce unhealthy diet related to NCDs, 2017
CHO RISK SCORE 6/11
CHANCE OF MEETING WHO 2025 TARGET
2%

126Atlas of Childhood Obesity | Country Report Cards
Mexico Latest survey: % infants overweight 5.3
2016: % boys aged 5-9 with obesity 19.9
2016: % girls aged 5-9 with obesity 15
2016: % boys aged 10-19 with obesity 15.2
2016: % girls aged 10-19 with obesity 11.7
2010: % adolescent boys insufficient physical activity
2010: % adolescent girls insufficient physical activity
2016: % women with obesity 34.0
Latest survey: % early initiation of breast-feeding
2020 estimate: % women smoking 5.3
Latest survey: % infants with stunting 10.0
Predicted 2030: % children aged 5-9 with obesity 23.6
Predicted 2030: % children aged 10-19 with obesity 19.3
Predicted 2030: number of children aged 5-9 with obesity 2,434,604
Predicted 2030: number of children aged 10-19 with obesity 4,115,673
Predicted 2030: number of children aged 5-19 with obesity 6,550,276
Existence of any policies on marketing of foods to children, 2017
Existence of policies to reduce physical inactivity, 2017
Existence of policies to reduce unhealthy diet related to NCDs, 2017
CHO RISK SCORE 7/11
CHANCE OF MEETING WHO 2025 TARGET
4%

127Atlas of Childhood Obesity | Country Report Cards
Micronesia Latest survey: % infants overweight
2016: % boys aged 5-9 with obesity 23.8
2016: % girls aged 5-9 with obesity 26.7
2016: % boys aged 10-19 with obesity 17.5
2016: % girls aged 10-19 with obesity 20
2010: % adolescent boys insufficient physical activity
2010: % adolescent girls insufficient physical activity
2016: % women with obesity 53.2
Latest survey: % early initiation of breast-feeding
2020 estimate: % women smoking
Latest survey: % infants with stunting
Predicted 2030: % children aged 5-9 with obesity 37.6
Predicted 2030: % children aged 10-19 with obesity 32.1
Predicted 2030: number of children aged 5-9 with obesity 4,768
Predicted 2030: number of children aged 10-19 with obesity 7,326
Predicted 2030: number of children aged 5-19 with obesity 12,094
Existence of any policies on marketing of foods to children, 2017
Existence of policies to reduce physical inactivity, 2017
Existence of policies to reduce unhealthy diet related to NCDs, 2017
CHO RISK SCORE 8/11
CHANCE OF MEETING WHO 2025 TARGET
0%

128Atlas of Childhood Obesity | Country Report Cards
Moldova Latest survey: % infants overweight 4.9
2016: % boys aged 5-9 with obesity 7
2016: % girls aged 5-9 with obesity 4.5
2016: % boys aged 10-19 with obesity 4
2016: % girls aged 10-19 with obesity 2.5
2010: % adolescent boys insufficient physical activity
2010: % adolescent girls insufficient physical activity
2016: % women with obesity
Latest survey: % early initiation of breast-feeding
2020 estimate: % women smoking
Latest survey: % infants with stunting 6.4
Predicted 2030: % children aged 5-9 with obesity
Predicted 2030: % children aged 10-19 with obesity
Predicted 2030: number of children aged 5-9 with obesity
Predicted 2030: number of children aged 10-19 with obesity
Predicted 2030: number of children aged 5-19 with obesity -
Existence of any policies on marketing of foods to children, 2017
Existence of policies to reduce physical inactivity, 2017
Existence of policies to reduce unhealthy diet related to NCDs, 2017
CHO RISK SCORE 3.5/11
CHANCE OF MEETING WHO 2025 TARGET
NA

129Atlas of Childhood Obesity | Country Report Cards
Mongolia Latest survey: % infants overweight 11.7
2016: % boys aged 5-9 with obesity 7.1
2016: % girls aged 5-9 with obesity 4.7
2016: % boys aged 10-19 with obesity 3.8
2016: % girls aged 10-19 with obesity 2.6
2010: % adolescent boys insufficient physical activity 69.4
2010: % adolescent girls insufficient physical activity 79.4
2016: % women with obesity 24.2
Latest survey: % early initiation of breast-feeding
2020 estimate: % women smoking 4.5
Latest survey: % infants with stunting 7.3
Predicted 2030: % children aged 5-9 with obesity 12.0
Predicted 2030: % children aged 10-19 with obesity 7.8
Predicted 2030: number of children aged 5-9 with obesity 32,716
Predicted 2030: number of children aged 10-19 with obesity 46,932
Predicted 2030: number of children aged 5-19 with obesity 79,648
Existence of any policies on marketing of foods to children, 2017
Existence of policies to reduce physical inactivity, 2017
Existence of policies to reduce unhealthy diet related to NCDs, 2017
CHO RISK SCORE 5/11
CHANCE OF MEETING WHO 2025 TARGET
4%

130Atlas of Childhood Obesity | Country Report Cards
Montenegro Latest survey: % infants overweight 22.3
2016: % boys aged 5-9 with obesity 13
2016: % girls aged 5-9 with obesity 7.3
2016: % boys aged 10-19 with obesity 8.1
2016: % girls aged 10-19 with obesity 4.3
2010: % adolescent boys insufficient physical activity
2010: % adolescent girls insufficient physical activity
2016: % women with obesity 24.1
Latest survey: % early initiation of breast-feeding
2020 estimate: % women smoking
Latest survey: % infants with stunting 9.4
Predicted 2030: % children aged 5-9 with obesity 17.1
Predicted 2030: % children aged 10-19 with obesity 12.1
Predicted 2030: number of children aged 5-9 with obesity 5,615
Predicted 2030: number of children aged 10-19 with obesity 8,357
Predicted 2030: number of children aged 5-19 with obesity 13,972
Existence of any policies on marketing of foods to children, 2017
Existence of policies to reduce physical inactivity, 2017
Existence of policies to reduce unhealthy diet related to NCDs, 2017
CHO RISK SCORE 6/11
CHANCE OF MEETING WHO 2025 TARGET
3%

131Atlas of Childhood Obesity | Country Report Cards
Morocco Latest survey: % infants overweight 10.8
2016: % boys aged 5-9 with obesity 13.5
2016: % girls aged 5-9 with obesity 12.7
2016: % boys aged 10-19 with obesity 8.7
2016: % girls aged 10-19 with obesity 8.5
2010: % adolescent boys insufficient physical activity 84.2
2010: % adolescent girls insufficient physical activity 89.4
2016: % women with obesity 33.4
Latest survey: % early initiation of breast-feeding 48.1
2020 estimate: % women smoking 1
Latest survey: % infants with stunting 14.9
Predicted 2030: % children aged 5-9 with obesity 21.1
Predicted 2030: % children aged 10-19 with obesity 15.7
Predicted 2030: number of children aged 5-9 with obesity 669,142
Predicted 2030: number of children aged 10-19 with obesity 1,088,010
Predicted 2030: number of children aged 5-19 with obesity 1,757,152
Existence of any policies on marketing of foods to children, 2017
Existence of policies to reduce physical inactivity, 2017
Existence of policies to reduce unhealthy diet related to NCDs, 2017
CHO RISK SCORE 7/11
CHANCE OF MEETING WHO 2025 TARGET
2%

132Atlas of Childhood Obesity | Country Report Cards
Latest survey: % infants overweight 7.8
2016: % boys aged 5-9 with obesity 2
2016: % girls aged 5-9 with obesity 4.3
2016: % boys aged 10-19 with obesity 1
2016: % girls aged 10-19 with obesity 2.4
2010: % adolescent boys insufficient physical activity
2010: % adolescent girls insufficient physical activity
2016: % women with obesity 11.0
Latest survey: % early initiation of breast-feeding
2020 estimate: % women smoking 5.5
Latest survey: % infants with stunting 42.9
Predicted 2030: % children aged 5-9 with obesity 7.3
Predicted 2030: % children aged 10-19 with obesity 4.5
Predicted 2030: number of children aged 5-9 with obesity 388,184
Predicted 2030: number of children aged 10-19 with obesity 407,084
Predicted 2030: number of children aged 5-19 with obesity 795,268
Mozambique
Existence of any policies on marketing of foods to children, 2017
Existence of policies to reduce physical inactivity, 2017
Existence of policies to reduce unhealthy diet related to NCDs, 2017
CHO RISK SCORE 4/11
CHANCE OF MEETING WHO 2025 TARGET
3%

133Atlas of Childhood Obesity | Country Report Cards
Myanmar Latest survey: % infants overweight 1.5
2016: % boys aged 5-9 with obesity 7.3
2016: % girls aged 5-9 with obesity 3.4
2016: % boys aged 10-19 with obesity 4.1
2016: % girls aged 10-19 with obesity 1.7
2010: % adolescent boys insufficient physical activity 81.1
2010: % adolescent girls insufficient physical activity 86.4
2016: % women with obesity 7.6
Latest survey: % early initiation of breast-feeding 67.0
2020 estimate: % women smoking 4.9
Latest survey: % infants with stunting 29.4
Predicted 2030: % children aged 5-9 with obesity 13.4
Predicted 2030: % children aged 10-19 with obesity 9.1
Predicted 2030: number of children aged 5-9 with obesity 529,023
Predicted 2030: number of children aged 10-19 with obesity 759,905
Predicted 2030: number of children aged 5-19 with obesity 1,288,929
Existence of any policies on marketing of foods to children, 2017
Existence of policies to reduce physical inactivity, 2017
Existence of policies to reduce unhealthy diet related to NCDs, 2017
CHO RISK SCORE 5/11
CHANCE OF MEETING WHO 2025 TARGET
0%

134Atlas of Childhood Obesity | Country Report Cards
Namibia Latest survey: % infants overweight 4.0
2016: % boys aged 5-9 with obesity 4.4
2016: % girls aged 5-9 with obesity 9
2016: % boys aged 10-19 with obesity 2.2
2016: % girls aged 10-19 with obesity 5.7
2010: % adolescent boys insufficient physical activity 85
2010: % adolescent girls insufficient physical activity 86.8
2016: % women with obesity 26.5
Latest survey: % early initiation of breast-feeding 71.3
2020 estimate: % women smoking 10.5
Latest survey: % infants with stunting 22.7
Predicted 2030: % children aged 5-9 with obesity 18.1
Predicted 2030: % children aged 10-19 with obesity 13.3
Predicted 2030: number of children aged 5-9 with obesity 55,604
Predicted 2030: number of children aged 10-19 with obesity 77,265
Predicted 2030: number of children aged 5-19 with obesity 132,869
Existence of any policies on marketing of foods to children, 2017
Existence of policies to reduce physical inactivity, 2017
Existence of policies to reduce unhealthy diet related to NCDs, 2017
CHO RISK SCORE 6/11
CHANCE OF MEETING WHO 2025 TARGET
0%

135Atlas of Childhood Obesity | Country Report Cards
Latest survey: % infants overweight 2.8
2016: % boys aged 5-9 with obesity 36.1
2016: % girls aged 5-9 with obesity 36.5
2016: % boys aged 10-19 with obesity 31.6
2016: % girls aged 10-19 with obesity 31.8
2010: % adolescent boys insufficient physical activity 83
2010: % adolescent girls insufficient physical activity 90.8
2016: % women with obesity 64.8
Latest survey: % early initiation of breast-feeding
2020 estimate: % women smoking 49.2
Latest survey: % infants with stunting 24.0
Predicted 2030: % children aged 5-9 with obesity 43.3
Predicted 2030: % children aged 10-19 with obesity 39.4
Predicted 2030: number of children aged 5-9 with obesity 389
Predicted 2030: number of children aged 10-19 with obesity 680
Predicted 2030: number of children aged 5-19 with obesity 1,070
Nauru
Existence of any policies on marketing of foods to children, 2017
Existence of policies to reduce physical inactivity, 2017
Existence of policies to reduce unhealthy diet related to NCDs, 2017
CHO RISK SCORE 9.5/11
CHANCE OF MEETING WHO 2025 TARGET
6%

136Atlas of Childhood Obesity | Country Report Cards
Latest survey: % infants overweight 1.2
2016: % boys aged 5-9 with obesity 2.4
2016: % girls aged 5-9 with obesity 2.8
2016: % boys aged 10-19 with obesity 1.1
2016: % girls aged 10-19 with obesity 1.4
2010: % adolescent boys insufficient physical activity
2010: % adolescent girls insufficient physical activity
2016: % women with obesity 5.6
Latest survey: % early initiation of breast-feeding 55.1
2020 estimate: % women smoking 7.7
Latest survey: % infants with stunting 36.0
Predicted 2030: % children aged 5-9 with obesity 8.5
Predicted 2030: % children aged 10-19 with obesity 5.1
Predicted 2030: number of children aged 5-9 with obesity 232,449
Predicted 2030: number of children aged 10-19 with obesity 274,426
Predicted 2030: number of children aged 5-19 with obesity 506,875
Nepal
Existence of any policies on marketing of foods to children, 2017
Existence of policies to reduce physical inactivity, 2017
Existence of policies to reduce unhealthy diet related to NCDs, 2017
CHO RISK SCORE 3.5/11
CHANCE OF MEETING WHO 2025 TARGET
0%
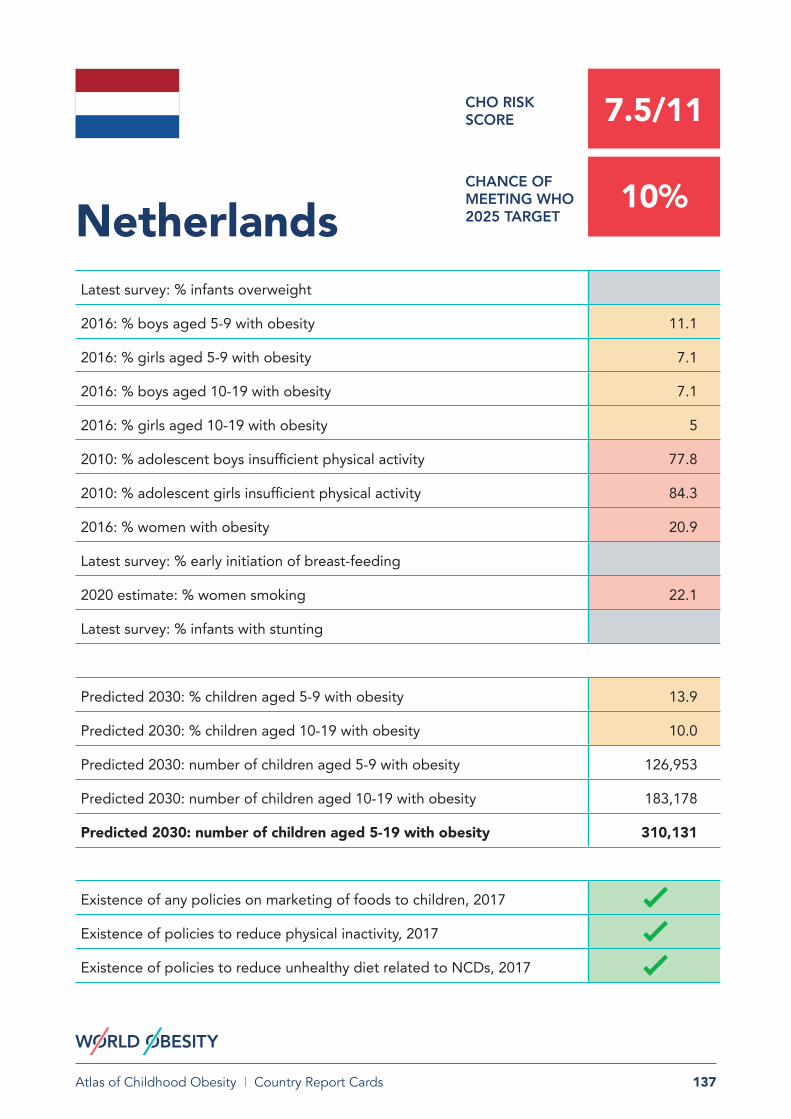
137Atlas of Childhood Obesity | Country Report Cards
Latest survey: % infants overweight
2016: % boys aged 5-9 with obesity 11.1
2016: % girls aged 5-9 with obesity 7.1
2016: % boys aged 10-19 with obesity 7.1
2016: % girls aged 10-19 with obesity 5
2010: % adolescent boys insufficient physical activity 77.8
2010: % adolescent girls insufficient physical activity 84.3
2016: % women with obesity 20.9
Latest survey: % early initiation of breast-feeding
2020 estimate: % women smoking 22.1
Latest survey: % infants with stunting
Predicted 2030: % children aged 5-9 with obesity 13.9
Predicted 2030: % children aged 10-19 with obesity 10.0
Predicted 2030: number of children aged 5-9 with obesity 126,953
Predicted 2030: number of children aged 10-19 with obesity 183,178
Predicted 2030: number of children aged 5-19 with obesity 310,131
Netherlands
Existence of any policies on marketing of foods to children, 2017
Existence of policies to reduce physical inactivity, 2017
Existence of policies to reduce unhealthy diet related to NCDs, 2017
CHO RISK SCORE 7.5/11
CHANCE OF MEETING WHO 2025 TARGET
10%

138Atlas of Childhood Obesity | Country Report Cards
Latest survey: % infants overweight
2016: % boys aged 5-9 with obesity 20.6
2016: % girls aged 5-9 with obesity 16.7
2016: % boys aged 10-19 with obesity 15.8
2016: % girls aged 10-19 with obesity 14.1
2010: % adolescent boys insufficient physical activity
2010: % adolescent girls insufficient physical activity
2016: % women with obesity 32.6
Latest survey: % early initiation of breast-feeding
2020 estimate: % women smoking
Latest survey: % infants with stunting
Predicted 2030: % children aged 5-9 with obesity 23.6
Predicted 2030: % children aged 10-19 with obesity 19.6
Predicted 2030: number of children aged 5-9 with obesity 76,326
Predicted 2030: number of children aged 10-19 with obesity 128,625
Predicted 2030: number of children aged 5-19 with obesity 204,951
New Zealand
Existence of any policies on marketing of foods to children, 2017
Existence of policies to reduce physical inactivity, 2017
Existence of policies to reduce unhealthy diet related to NCDs, 2017
CHO RISK SCORE 7.5/11
CHANCE OF MEETING WHO 2025 TARGET
8%

139Atlas of Childhood Obesity | Country Report Cards
Nicaragua Latest survey: % infants overweight 8.3
2016: % boys aged 5-9 with obesity 13.2
2016: % girls aged 5-9 with obesity 14.2
2016: % boys aged 10-19 with obesity 8.7
2016: % girls aged 10-19 with obesity 10
2010: % adolescent boys insufficient physical activity
2010: % adolescent girls insufficient physical activity
2016: % women with obesity 30.1
Latest survey: % early initiation of breast-feeding 63.8
2020 estimate: % women smoking
Latest survey: % infants with stunting 17.3
Predicted 2030: % children aged 5-9 with obesity 20.8
Predicted 2030: % children aged 10-19 with obesity 15.8
Predicted 2030: number of children aged 5-9 with obesity 131,078
Predicted 2030: number of children aged 10-19 with obesity 203,340
Predicted 2030: number of children aged 5-19 with obesity 334,419
Existence of any policies on marketing of foods to children, 2017
Existence of policies to reduce physical inactivity, 2017
Existence of policies to reduce unhealthy diet related to NCDs, 2017
CHO RISK SCORE 6.5/11
CHANCE OF MEETING WHO 2025 TARGET
4%

140Atlas of Childhood Obesity | Country Report Cards
Niger Latest survey: % infants overweight 1.1
2016: % boys aged 5-9 with obesity 1
2016: % girls aged 5-9 with obesity 2.8
2016: % boys aged 10-19 with obesity 0.5
2016: % girls aged 10-19 with obesity 1.6
2010: % adolescent boys insufficient physical activity
2010: % adolescent girls insufficient physical activity
2016: % women with obesity 9.1
Latest survey: % early initiation of breast-feeding 53.0
2020 estimate: % women smoking 0.2
Latest survey: % infants with stunting 40.6
Predicted 2030: % children aged 5-9 with obesity 6.0
Predicted 2030: % children aged 10-19 with obesity 3.8
Predicted 2030: number of children aged 5-9 with obesity 337,050
Predicted 2030: number of children aged 10-19 with obesity 327,588
Predicted 2030: number of children aged 5-19 with obesity 664,638
Existence of any policies on marketing of foods to children, 2017
Existence of policies to reduce physical inactivity, 2017
Existence of policies to reduce unhealthy diet related to NCDs, 2017
CHO RISK SCORE 3/11
CHANCE OF MEETING WHO 2025 TARGET
1%

141Atlas of Childhood Obesity | Country Report Cards
Nigeria Latest survey: % infants overweight 1.5
2016: % boys aged 5-9 with obesity 2.5
2016: % girls aged 5-9 with obesity 2.7
2016: % boys aged 10-19 with obesity 1.3
2016: % girls aged 10-19 with obesity 1.8
2010: % adolescent boys insufficient physical activity
2010: % adolescent girls insufficient physical activity
2016: % women with obesity 13.6
Latest survey: % early initiation of breast-feeding
2020 estimate: % women smoking 0.9
Latest survey: % infants with stunting 43.6
Predicted 2030: % children aged 5-9 with obesity 7.5
Predicted 2030: % children aged 10-19 with obesity 4.9
Predicted 2030: number of children aged 5-9 with obesity 2,852,813
Predicted 2030: number of children aged 10-19 with obesity 3,167,370
Predicted 2030: number of children aged 5-19 with obesity 6,020,182
Existence of any policies on marketing of foods to children, 2017
Existence of policies to reduce physical inactivity, 2017
Existence of policies to reduce unhealthy diet related to NCDs, 2017
CHO RISK SCORE 3/11
CHANCE OF MEETING WHO 2025 TARGET
1%

142Atlas of Childhood Obesity | Country Report Cards
North Macedonia Latest survey: % infants overweight 12.4
2016: % boys aged 5-9 with obesity 15.7
2016: % girls aged 5-9 with obesity 8.8
2016: % boys aged 10-19 with obesity 10.2
2016: % girls aged 10-19 with obesity 5.3
2010: % adolescent boys insufficient physical activity 70.9
2010: % adolescent girls insufficient physical activity 83.3
2016: % women with obesity 23.0
Latest survey: % early initiation of breast-feeding
2020 estimate: % women smoking
Latest survey: % infants with stunting 4.9
Predicted 2030: % children aged 5-9 with obesity 20.2
Predicted 2030: % children aged 10-19 with obesity 14.8
Predicted 2030: number of children aged 5-9 with obesity 20,505
Predicted 2030: number of children aged 10-19 with obesity 32,015
Predicted 2030: number of children aged 5-19 with obesity 52,520
Existence of any policies on marketing of foods to children, 2017
Existence of policies to reduce physical inactivity, 2017
Existence of policies to reduce unhealthy diet related to NCDs, 2017
CHO RISK SCORE 7/11
CHANCE OF MEETING WHO 2025 TARGET
2%

143Atlas of Childhood Obesity | Country Report Cards
Norway Latest survey: % infants overweight
2016: % boys aged 5-9 with obesity 12.7
2016: % girls aged 5-9 with obesity 9.3
2016: % boys aged 10-19 with obesity 9.2
2016: % girls aged 10-19 with obesity 6.9
2010: % adolescent boys insufficient physical activity 78.9
2010: % adolescent girls insufficient physical activity 91.2
2016: % women with obesity 23.5
Latest survey: % early initiation of breast-feeding
2020 estimate: % women smoking 18.1
Latest survey: % infants with stunting
Predicted 2030: % children aged 5-9 with obesity 14.5
Predicted 2030: % children aged 10-19 with obesity 11.3
Predicted 2030: number of children aged 5-9 with obesity 52,426
Predicted 2030: number of children aged 10-19 with obesity 80,664
Predicted 2030: number of children aged 5-19 with obesity 133,089
Existence of any policies on marketing of foods to children, 2017
Existence of policies to reduce physical inactivity, 2017
Existence of policies to reduce unhealthy diet related to NCDs, 2017
CHO RISK SCORE 7.5/11
CHANCE OF MEETING WHO 2025 TARGET
19%
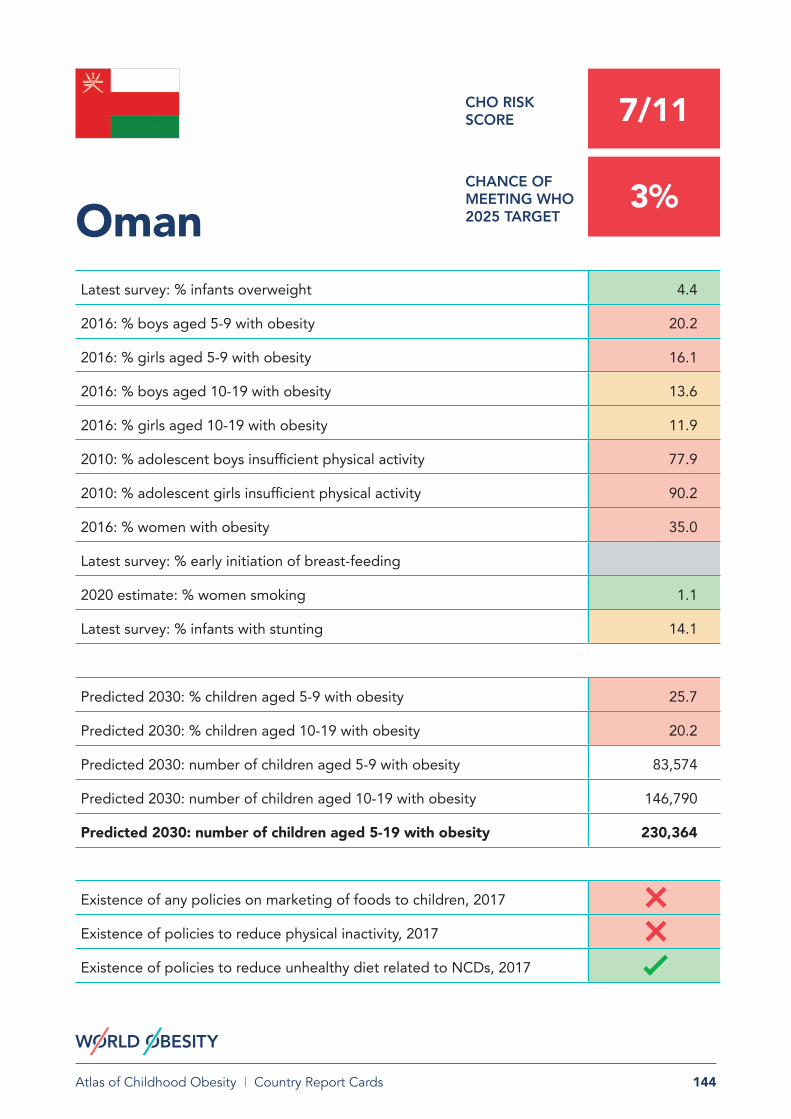
144Atlas of Childhood Obesity | Country Report Cards
Oman Latest survey: % infants overweight 4.4
2016: % boys aged 5-9 with obesity 20.2
2016: % girls aged 5-9 with obesity 16.1
2016: % boys aged 10-19 with obesity 13.6
2016: % girls aged 10-19 with obesity 11.9
2010: % adolescent boys insufficient physical activity 77.9
2010: % adolescent girls insufficient physical activity 90.2
2016: % women with obesity 35.0
Latest survey: % early initiation of breast-feeding
2020 estimate: % women smoking 1.1
Latest survey: % infants with stunting 14.1
Predicted 2030: % children aged 5-9 with obesity 25.7
Predicted 2030: % children aged 10-19 with obesity 20.2
Predicted 2030: number of children aged 5-9 with obesity 83,574
Predicted 2030: number of children aged 10-19 with obesity 146,790
Predicted 2030: number of children aged 5-19 with obesity 230,364
Existence of any policies on marketing of foods to children, 2017
Existence of policies to reduce physical inactivity, 2017
Existence of policies to reduce unhealthy diet related to NCDs, 2017
CHO RISK SCORE 7/11
CHANCE OF MEETING WHO 2025 TARGET
3%

145Atlas of Childhood Obesity | Country Report Cards
Pakistan Latest survey: % infants overweight 2.5
2016: % boys aged 5-9 with obesity 4.9
2016: % girls aged 5-9 with obesity 3.4
2016: % boys aged 10-19 with obesity 2.9
2016: % girls aged 10-19 with obesity 2
2010: % adolescent boys insufficient physical activity 87.3
2010: % adolescent girls insufficient physical activity 91.1
2016: % women with obesity 11.8
Latest survey: % early initiation of breast-feeding 18.1
2020 estimate: % women smoking 2.1
Latest survey: % infants with stunting 37.6
Predicted 2030: % children aged 5-9 with obesity 10.8
Predicted 2030: % children aged 10-19 with obesity 7.4
Predicted 2030: number of children aged 5-9 with obesity 2,298,332
Predicted 2030: number of children aged 10-19 with obesity 3,114,125
Predicted 2030: number of children aged 5-19 with obesity 5,412,457
Existence of any policies on marketing of foods to children, 2017
Existence of policies to reduce physical inactivity, 2017
Existence of policies to reduce unhealthy diet related to NCDs, 2017
CHO RISK SCORE 5/11
CHANCE OF MEETING WHO 2025 TARGET
0%

146Atlas of Childhood Obesity | Country Report Cards
Palau Latest survey: % infants overweight
2016: % boys aged 5-9 with obesity 35.8
2016: % girls aged 5-9 with obesity 35.2
2016: % boys aged 10-19 with obesity 29.9
2016: % girls aged 10-19 with obesity 28.9
2010: % adolescent boys insufficient physical activity 74.1
2010: % adolescent girls insufficient physical activity 78.2
2016: % women with obesity 60.5
Latest survey: % early initiation of breast-feeding
2020 estimate: % women smoking
Latest survey: % infants with stunting
Predicted 2030: % children aged 5-9 with obesity 44.7
Predicted 2030: % children aged 10-19 with obesity 40.1
Predicted 2030: number of children aged 5-9 with obesity 915
Predicted 2030: number of children aged 10-19 with obesity 1,576
Predicted 2030: number of children aged 5-19 with obesity 2,491
Existence of any policies on marketing of foods to children, 2017
Existence of policies to reduce physical inactivity, 2017
Existence of policies to reduce unhealthy diet related to NCDs, 2017
CHO RISK SCORE 9.5/11
CHANCE OF MEETING WHO 2025 TARGET
0%

147Atlas of Childhood Obesity | Country Report Cards
Palestine Latest survey: % infants overweight 8.2
2016: % boys aged 5-9 with obesity
2016: % girls aged 5-9 with obesity
2016: % boys aged 10-19 with obesity
2016: % girls aged 10-19 with obesity
2010: % adolescent boys insufficient physical activity
2010: % adolescent girls insufficient physical activity
2016: % women with obesity 40.2
Latest survey: % early initiation of breast-feeding
2020 estimate: % women smoking
Latest survey: % infants with stunting 7.4
Predicted 2030: % children aged 5-9 with obesity 23.7
Predicted 2030: % children aged 10-19 with obesity 17.7
Predicted 2030: number of children aged 5-9 with obesity 172,917
Predicted 2030: number of children aged 10-19 with obesity 233,143
Predicted 2030: number of children aged 5-19 with obesity 406,060
Existence of any policies on marketing of foods to children, 2017
Existence of policies to reduce physical inactivity, 2017
Existence of policies to reduce unhealthy diet related to NCDs, 2017
CHO RISK SCORE 6/11
CHANCE OF MEETING WHO 2025 TARGET
5%

148Atlas of Childhood Obesity | Country Report Cards
Panama Latest survey: % infants overweight 9.7
2016: % boys aged 5-9 with obesity 12.7
2016: % girls aged 5-9 with obesity 14.2
2016: % boys aged 10-19 with obesity 8
2016: % girls aged 10-19 with obesity 10
2010: % adolescent boys insufficient physical activity
2010: % adolescent girls insufficient physical activity
2016: % women with obesity 28.7
Latest survey: % early initiation of breast-feeding
2020 estimate: % women smoking 2.1
Latest survey: % infants with stunting 19.0
Predicted 2030: % children aged 5-9 with obesity 19.9
Predicted 2030: % children aged 10-19 with obesity 14.8
Predicted 2030: number of children aged 5-9 with obesity 75,128
Predicted 2030: number of children aged 10-19 with obesity 110,199
Predicted 2030: number of children aged 5-19 with obesity 185,327
Existence of any policies on marketing of foods to children, 2017
Existence of policies to reduce physical inactivity, 2017
Existence of policies to reduce unhealthy diet related to NCDs, 2017
CHO RISK SCORE 6.5/11
CHANCE OF MEETING WHO 2025 TARGET
1%

149Atlas of Childhood Obesity | Country Report Cards
Papua New Guinea Latest survey: % infants overweight 13.7
2016: % boys aged 5-9 with obesity 12
2016: % girls aged 5-9 with obesity 12.4
2016: % boys aged 10-19 with obesity 8.1
2016: % girls aged 10-19 with obesity 8.9
2010: % adolescent boys insufficient physical activity
2010: % adolescent girls insufficient physical activity
2016: % women with obesity 26.8
Latest survey: % early initiation of breast-feeding
2020 estimate: % women smoking
Latest survey: % infants with stunting 49.5
Predicted 2030: % children aged 5-9 with obesity 21.3
Predicted 2030: % children aged 10-19 with obesity 16.9
Predicted 2030: number of children aged 5-9 with obesity 230,094
Predicted 2030: number of children aged 10-19 with obesity 339,349
Predicted 2030: number of children aged 5-19 with obesity 569,443
Existence of any policies on marketing of foods to children, 2017
Existence of policies to reduce physical inactivity, 2017
Existence of policies to reduce unhealthy diet related to NCDs, 2017
CHO RISK SCORE 6.5/11
CHANCE OF MEETING WHO 2025 TARGET
2%

150Atlas of Childhood Obesity | Country Report Cards
Paraguay Latest survey: % infants overweight 12.4
2016: % boys aged 5-9 with obesity 14.9
2016: % girls aged 5-9 with obesity 11.7
2016: % boys aged 10-19 with obesity 10
2016: % girls aged 10-19 with obesity 8
2010: % adolescent boys insufficient physical activity
2010: % adolescent girls insufficient physical activity
2016: % women with obesity 24.4
Latest survey: % early initiation of breast-feeding
2020 estimate: % women smoking 6.5
Latest survey: % infants with stunting 5.6
Predicted 2030: % children aged 5-9 with obesity 21.2
Predicted 2030: % children aged 10-19 with obesity 16.3
Predicted 2030: number of children aged 5-9 with obesity 170,615
Predicted 2030: number of children aged 10-19 with obesity 254,022
Predicted 2030: number of children aged 5-19 with obesity 424,637
Existence of any policies on marketing of foods to children, 2017
Existence of policies to reduce physical inactivity, 2017
Existence of policies to reduce unhealthy diet related to NCDs, 2017
CHO RISK SCORE 6/11
CHANCE OF MEETING WHO 2025 TARGET
2%
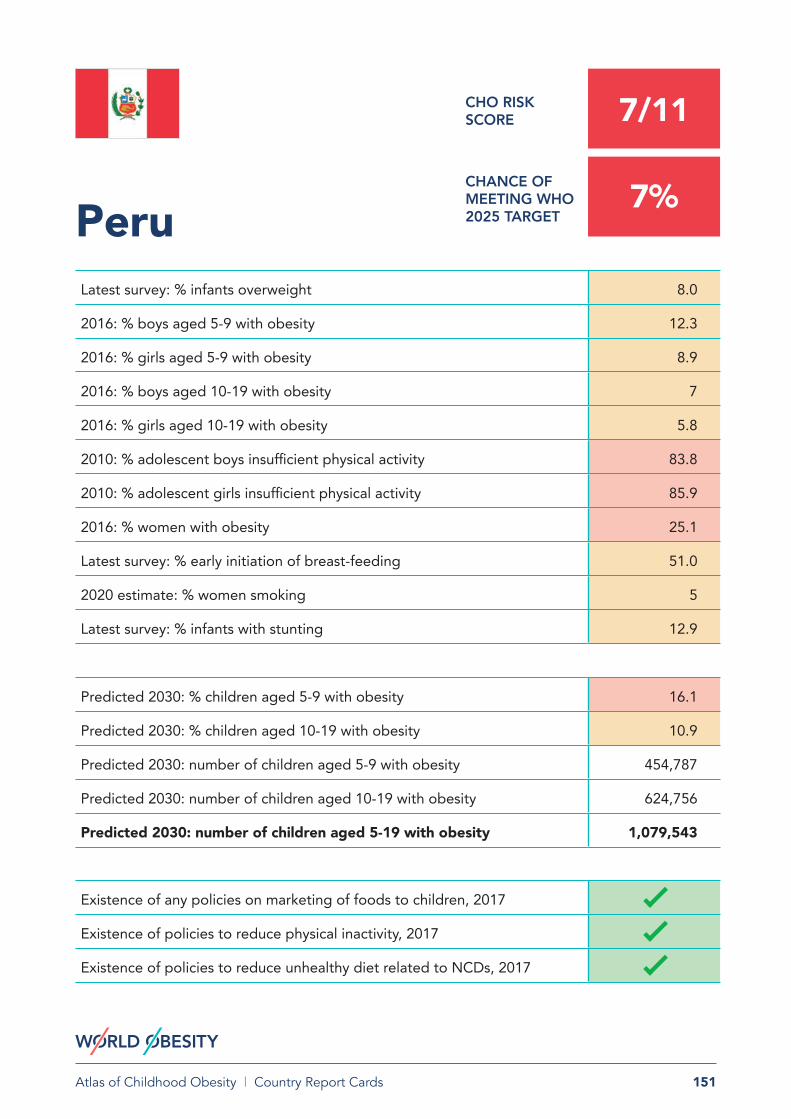
151Atlas of Childhood Obesity | Country Report Cards
Peru Latest survey: % infants overweight 8.0
2016: % boys aged 5-9 with obesity 12.3
2016: % girls aged 5-9 with obesity 8.9
2016: % boys aged 10-19 with obesity 7
2016: % girls aged 10-19 with obesity 5.8
2010: % adolescent boys insufficient physical activity 83.8
2010: % adolescent girls insufficient physical activity 85.9
2016: % women with obesity 25.1
Latest survey: % early initiation of breast-feeding 51.0
2020 estimate: % women smoking 5
Latest survey: % infants with stunting 12.9
Predicted 2030: % children aged 5-9 with obesity 16.1
Predicted 2030: % children aged 10-19 with obesity 10.9
Predicted 2030: number of children aged 5-9 with obesity 454,787
Predicted 2030: number of children aged 10-19 with obesity 624,756
Predicted 2030: number of children aged 5-19 with obesity 1,079,543
Existence of any policies on marketing of foods to children, 2017
Existence of policies to reduce physical inactivity, 2017
Existence of policies to reduce unhealthy diet related to NCDs, 2017
CHO RISK SCORE 7/11
CHANCE OF MEETING WHO 2025 TARGET
7%

152Atlas of Childhood Obesity | Country Report Cards
Philippines Latest survey: % infants overweight 3.9
2016: % boys aged 5-9 with obesity 8.2
2016: % girls aged 5-9 with obesity 3.9
2016: % boys aged 10-19 with obesity 4.9
2016: % girls aged 10-19 with obesity 1.9
2010: % adolescent boys insufficient physical activity 89.6
2010: % adolescent girls insufficient physical activity 91.7
2016: % women with obesity 7.9
Latest survey: % early initiation of breast-feeding 57.0
2020 estimate: % women smoking 7.4
Latest survey: % infants with stunting 33.4
Predicted 2030: % children aged 5-9 with obesity 12.3
Predicted 2030: % children aged 10-19 with obesity 7.8
Predicted 2030: number of children aged 5-9 with obesity 1,533,908
Predicted 2030: number of children aged 10-19 with obesity 1,842,512
Predicted 2030: number of children aged 5-19 with obesity 3,376,420
Existence of any policies on marketing of foods to children, 2017
Existence of policies to reduce physical inactivity, 2017
Existence of policies to reduce unhealthy diet related to NCDs, 2017
CHO RISK SCORE 5/11
CHANCE OF MEETING WHO 2025 TARGET
2%

153Atlas of Childhood Obesity | Country Report Cards
Poland Latest survey: % infants overweight
2016: % boys aged 5-9 with obesity 16.8
2016: % girls aged 5-9 with obesity 8
2016: % boys aged 10-19 with obesity 10.4
2016: % girls aged 10-19 with obesity 3.8
2010: % adolescent boys insufficient physical activity 74.7
2010: % adolescent girls insufficient physical activity 84.2
2016: % women with obesity 23.2
Latest survey: % early initiation of breast-feeding
2020 estimate: % women smoking 20.6
Latest survey: % infants with stunting 2.6
Predicted 2030: % children aged 5-9 with obesity 20.3
Predicted 2030: % children aged 10-19 with obesity 13.9
Predicted 2030: number of children aged 5-9 with obesity 383,674
Predicted 2030: number of children aged 10-19 with obesity 561,465
Predicted 2030: number of children aged 5-19 with obesity 945,139
Existence of any policies on marketing of foods to children, 2017
Existence of policies to reduce physical inactivity, 2017
Existence of policies to reduce unhealthy diet related to NCDs, 2017
CHO RISK SCORE 7/11
CHANCE OF MEETING WHO 2025 TARGET
2%
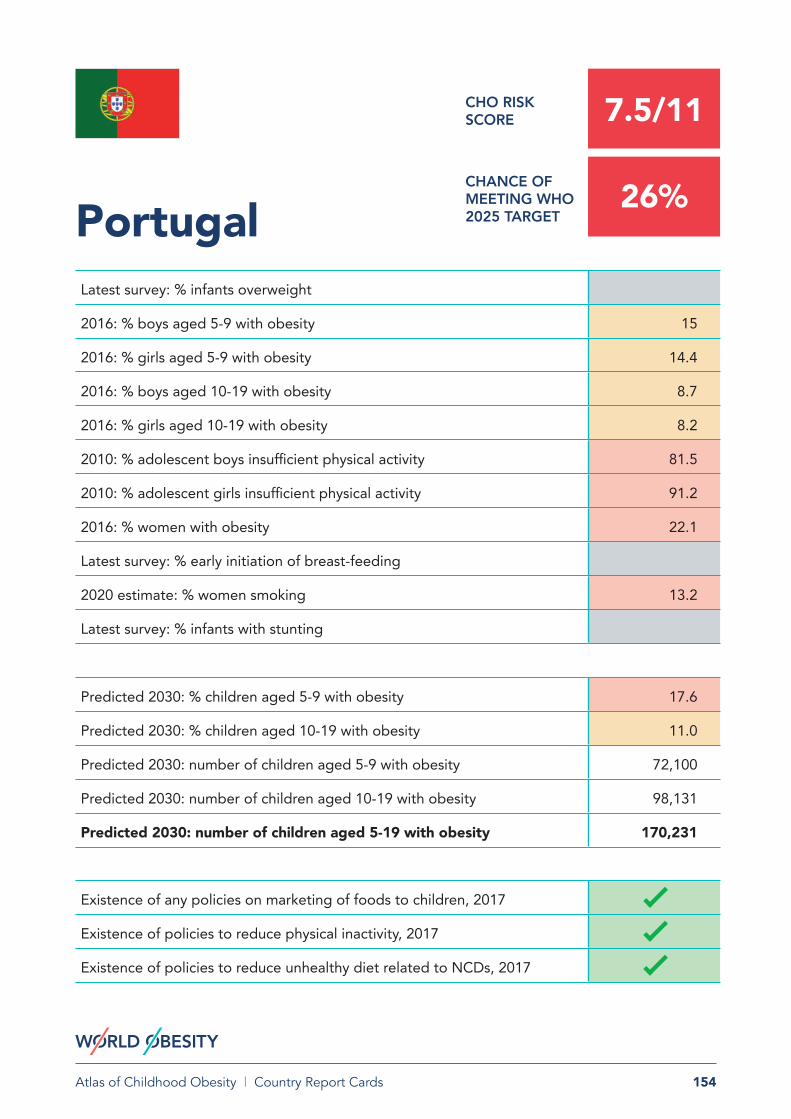
154Atlas of Childhood Obesity | Country Report Cards
Portugal Latest survey: % infants overweight
2016: % boys aged 5-9 with obesity 15
2016: % girls aged 5-9 with obesity 14.4
2016: % boys aged 10-19 with obesity 8.7
2016: % girls aged 10-19 with obesity 8.2
2010: % adolescent boys insufficient physical activity 81.5
2010: % adolescent girls insufficient physical activity 91.2
2016: % women with obesity 22.1
Latest survey: % early initiation of breast-feeding
2020 estimate: % women smoking 13.2
Latest survey: % infants with stunting
Predicted 2030: % children aged 5-9 with obesity 17.6
Predicted 2030: % children aged 10-19 with obesity 11.0
Predicted 2030: number of children aged 5-9 with obesity 72,100
Predicted 2030: number of children aged 10-19 with obesity 98,131
Predicted 2030: number of children aged 5-19 with obesity 170,231
Existence of any policies on marketing of foods to children, 2017
Existence of policies to reduce physical inactivity, 2017
Existence of policies to reduce unhealthy diet related to NCDs, 2017
CHO RISK SCORE 7.5/11
CHANCE OF MEETING WHO 2025 TARGET
26%

155Atlas of Childhood Obesity | Country Report Cards
Qatar Latest survey: % infants overweight 10.4
2016: % boys aged 5-9 with obesity 26.2
2016: % girls aged 5-9 with obesity 19.2
2016: % boys aged 10-19 with obesity 19.9
2016: % girls aged 10-19 with obesity 14.5
2010: % adolescent boys insufficient physical activity 88.3
2010: % adolescent girls insufficient physical activity 91.6
2016: % women with obesity 44.6
Latest survey: % early initiation of breast-feeding
2020 estimate: % women smoking
Latest survey: % infants with stunting 11.6
Predicted 2030: % children aged 5-9 with obesity 27.5
Predicted 2030: % children aged 10-19 with obesity 22.2
Predicted 2030: number of children aged 5-9 with obesity 28,930
Predicted 2030: number of children aged 10-19 with obesity 53,231
Predicted 2030: number of children aged 5-19 with obesity 82,161
Existence of any policies on marketing of foods to children, 2017
Existence of policies to reduce physical inactivity, 2017
Existence of policies to reduce unhealthy diet related to NCDs, 2017
CHO RISK SCORE 8.5/11
CHANCE OF MEETING WHO 2025 TARGET
14%

156Atlas of Childhood Obesity | Country Report Cards
Republic of the Congo Latest survey: % infants overweight 5.9
2016: % boys aged 5-9 with obesity 3
2016: % girls aged 5-9 with obesity 2
2016: % boys aged 10-19 with obesity 1.7
2016: % girls aged 10-19 with obesity 1.6
2010: % adolescent boys insufficient physical activity
2010: % adolescent girls insufficient physical activity
2016: % women with obesity 14.1
Latest survey: % early initiation of breast-feeding
2020 estimate: % women smoking 1.8
Latest survey: % infants with stunting 21.2
Predicted 2030: % children aged 5-9 with obesity 6.6
Predicted 2030: % children aged 10-19 with obesity 4.8
Predicted 2030: number of children aged 5-9 with obesity 57,318
Predicted 2030: number of children aged 10-19 with obesity 73,015
Predicted 2030: number of children aged 5-19 with obesity 130,333
Existence of any policies on marketing of foods to children, 2017
Existence of policies to reduce physical inactivity, 2017
Existence of policies to reduce unhealthy diet related to NCDs, 2017
CHO RISK SCORE 3.5/11
CHANCE OF MEETING WHO 2025 TARGET
4%

157Atlas of Childhood Obesity | Country Report Cards
Romania Latest survey: % infants overweight 8.3
2016: % boys aged 5-9 with obesity 13.5
2016: % girls aged 5-9 with obesity 8.2
2016: % boys aged 10-19 with obesity 9.2
2016: % girls aged 10-19 with obesity 4
2010: % adolescent boys insufficient physical activity 73.2
2010: % adolescent girls insufficient physical activity 88.1
2016: % women with obesity 22.5
Latest survey: % early initiation of breast-feeding
2020 estimate: % women smoking 21.3
Latest survey: % infants with stunting 12.8
Predicted 2030: % children aged 5-9 with obesity 20.1
Predicted 2030: % children aged 10-19 with obesity 14.3
Predicted 2030: number of children aged 5-9 with obesity 189,905
Predicted 2030: number of children aged 10-19 with obesity 303,782
Predicted 2030: number of children aged 5-19 with obesity 493,687
Existence of any policies on marketing of foods to children, 2017
Existence of policies to reduce physical inactivity, 2017
Existence of policies to reduce unhealthy diet related to NCDs, 2017
CHO RISK SCORE 7/11
CHANCE OF MEETING WHO 2025 TARGET
1%

158Atlas of Childhood Obesity | Country Report Cards
Russia Latest survey: % infants overweight
2016: % boys aged 5-9 with obesity 14.9
2016: % girls aged 5-9 with obesity 6.8
2016: % boys aged 10-19 with obesity 6.4
2016: % girls aged 10-19 with obesity 3
2010: % adolescent boys insufficient physical activity 84.1
2010: % adolescent girls insufficient physical activity 90.7
2016: % women with obesity 28.1
Latest survey: % early initiation of breast-feeding
2020 estimate: % women smoking 23.4
Latest survey: % infants with stunting
Predicted 2030: % children aged 5-9 with obesity 16.2
Predicted 2030: % children aged 10-19 with obesity 8.6
Predicted 2030: number of children aged 5-9 with obesity 1,148,278
Predicted 2030: number of children aged 10-19 with obesity 1,402,330
Predicted 2030: number of children aged 5-19 with obesity 2,550,607
Existence of any policies on marketing of foods to children, 2017
Existence of policies to reduce physical inactivity, 2017
Existence of policies to reduce unhealthy diet related to NCDs, 2017
CHO RISK SCORE 7/11
CHANCE OF MEETING WHO 2025 TARGET
8%

159Atlas of Childhood Obesity | Country Report Cards
Rwanda Latest survey: % infants overweight 7.9
2016: % boys aged 5-9 with obesity 0.9
2016: % girls aged 5-9 with obesity 3.8
2016: % boys aged 10-19 with obesity 0.4
2016: % girls aged 10-19 with obesity 2.2
2010: % adolescent boys insufficient physical activity
2010: % adolescent girls insufficient physical activity
2016: % women with obesity 9.7
Latest survey: % early initiation of breast-feeding 80.5
2020 estimate: % women smoking 5.2
Latest survey: % infants with stunting 36.9
Predicted 2030: % children aged 5-9 with obesity 7.2
Predicted 2030: % children aged 10-19 with obesity 4.6
Predicted 2030: number of children aged 5-9 with obesity 153,704
Predicted 2030: number of children aged 10-19 with obesity 178,713
Predicted 2030: number of children aged 5-19 with obesity 332,417
Existence of any policies on marketing of foods to children, 2017
Existence of policies to reduce physical inactivity, 2017
Existence of policies to reduce unhealthy diet related to NCDs, 2017
CHO RISK SCORE 3.5/11
CHANCE OF MEETING WHO 2025 TARGET
1%

160Atlas of Childhood Obesity | Country Report Cards
Saint Kitts and NevisLatest survey: % infants overweight
2016: % boys aged 5-9 with obesity 16.2
2016: % girls aged 5-9 with obesity 14.7
2016: % boys aged 10-19 with obesity 11
2016: % girls aged 10-19 with obesity 10.6
2010: % adolescent boys insufficient physical activity 78
2010: % adolescent girls insufficient physical activity 85.5
2016: % women with obesity 31.3
Latest survey: % early initiation of breast-feeding
2020 estimate: % women smoking
Latest survey: % infants with stunting
Predicted 2030: % children aged 5-9 with obesity 25.1
Predicted 2030: % children aged 10-19 with obesity 20.1
Predicted 2030: number of children aged 5-9 with obesity 1,135
Predicted 2030: number of children aged 10-19 with obesity 1,836
Predicted 2030: number of children aged 5-19 with obesity 2,971
Existence of any policies on marketing of foods to children, 2017
Existence of policies to reduce physical inactivity, 2017
Existence of policies to reduce unhealthy diet related to NCDs, 2017
CHO RISK SCORE 7.5/11
CHANCE OF MEETING WHO 2025 TARGET
1%

161Atlas of Childhood Obesity | Country Report Cards
Saint Lucia Latest survey: % infants overweight 6.3
2016: % boys aged 5-9 with obesity 11.3
2016: % girls aged 5-9 with obesity 11.7
2016: % boys aged 10-19 with obesity 7.1
2016: % girls aged 10-19 with obesity 8
2010: % adolescent boys insufficient physical activity 83.8
2010: % adolescent girls insufficient physical activity 85.5
2016: % women with obesity 28.1
Latest survey: % early initiation of breast-feeding
2020 estimate: % women smoking
Latest survey: % infants with stunting 2.5
Predicted 2030: % children aged 5-9 with obesity 19.7
Predicted 2030: % children aged 10-19 with obesity 15.0
Predicted 2030: number of children aged 5-9 with obesity 2,506
Predicted 2030: number of children aged 10-19 with obesity 4,101
Predicted 2030: number of children aged 5-19 with obesity 6,607
Existence of any policies on marketing of foods to children, 2017
Existence of policies to reduce physical inactivity, 2017
Existence of policies to reduce unhealthy diet related to NCDs, 2017
CHO RISK SCORE 6.5/11
CHANCE OF MEETING WHO 2025 TARGET
2%

162Atlas of Childhood Obesity | Country Report Cards
Saint Vincent and the Grenadines Latest survey: % infants overweight
2016: % boys aged 5-9 with obesity 16.3
2016: % girls aged 5-9 with obesity 15.1
2016: % boys aged 10-19 with obesity 11.1
2016: % girls aged 10-19 with obesity 10.7
2010: % adolescent boys insufficient physical activity 84.4
2010: % adolescent girls insufficient physical activity 88.6
2016: % women with obesity 32.3
Latest survey: % early initiation of breast-feeding
2020 estimate: % women smoking
Latest survey: % infants with stunting
Predicted 2030: % children aged 5-9 with obesity 24.7
Predicted 2030: % children aged 10-19 with obesity 19.5
Predicted 2030: number of children aged 5-9 with obesity 1,781
Predicted 2030: number of children aged 10-19 with obesity 3,062
Predicted 2030: number of children aged 5-19 with obesity 4,843
Existence of any policies on marketing of foods to children, 2017
Existence of policies to reduce physical inactivity, 2017
Existence of policies to reduce unhealthy diet related to NCDs, 2017
CHO RISK SCORE 8/11
CHANCE OF MEETING WHO 2025 TARGET
2%

163Atlas of Childhood Obesity | Country Report Cards
Samoa Latest survey: % infants overweight 5.3
2016: % boys aged 5-9 with obesity 23.8
2016: % girls aged 5-9 with obesity 26
2016: % boys aged 10-19 with obesity 18
2016: % girls aged 10-19 with obesity 22
2010: % adolescent boys insufficient physical activity 89.3
2010: % adolescent girls insufficient physical activity 86.7
2016: % women with obesity 56.6
Latest survey: % early initiation of breast-feeding
2020 estimate: % women smoking 17.3
Latest survey: % infants with stunting 4.9
Predicted 2030: % children aged 5-9 with obesity 37.1
Predicted 2030: % children aged 10-19 with obesity 32.8
Predicted 2030: number of children aged 5-9 with obesity 8,148
Predicted 2030: number of children aged 10-19 with obesity 14,407
Predicted 2030: number of children aged 5-19 with obesity 22,555
Existence of any policies on marketing of foods to children, 2017
Existence of policies to reduce physical inactivity, 2017
Existence of policies to reduce unhealthy diet related to NCDs, 2017
CHO RISK SCORE 9/11
CHANCE OF MEETING WHO 2025 TARGET
0%

164Atlas of Childhood Obesity | Country Report Cards
São Tomé and Príncipe Latest survey: % infants overweight 2.4
2016: % boys aged 5-9 with obesity 4
2016: % girls aged 5-9 with obesity 5.2
2016: % boys aged 10-19 with obesity 2.4
2016: % girls aged 10-19 with obesity 3.2
2010: % adolescent boys insufficient physical activity
2010: % adolescent girls insufficient physical activity
2016: % women with obesity 17.7
Latest survey: % early initiation of breast-feeding
2020 estimate: % women smoking
Latest survey: % infants with stunting 17.2
Predicted 2030: % children aged 5-9 with obesity 9.7
Predicted 2030: % children aged 10-19 with obesity 6.6
Predicted 2030: number of children aged 5-9 with obesity 3,038
Predicted 2030: number of children aged 10-19 with obesity 3,962
Predicted 2030: number of children aged 5-19 with obesity 7,000
Existence of any policies on marketing of foods to children, 2017
Existence of policies to reduce physical inactivity, 2017
Existence of policies to reduce unhealthy diet related to NCDs, 2017
CHO RISK SCORE 4.5/11
CHANCE OF MEETING WHO 2025 TARGET
4%

165Atlas of Childhood Obesity | Country Report Cards
Saudi Arabia Latest survey: % infants overweight 6.1
2016: % boys aged 5-9 with obesity 21.3
2016: % girls aged 5-9 with obesity 15.4
2016: % boys aged 10-19 with obesity 19
2016: % girls aged 10-19 with obesity 13.6
2010: % adolescent boys insufficient physical activity
2010: % adolescent girls insufficient physical activity
2016: % women with obesity 43.7
Latest survey: % early initiation of breast-feeding
2020 estimate: % women smoking 2.7
Latest survey: % infants with stunting 9.3
Predicted 2030: % children aged 5-9 with obesity 25.4
Predicted 2030: % children aged 10-19 with obesity 23.3
Predicted 2030: number of children aged 5-9 with obesity 568,174
Predicted 2030: number of children aged 10-19 with obesity 1,296,075
Predicted 2030: number of children aged 5-19 with obesity 1,864,250
Existence of any policies on marketing of foods to children, 2017
Existence of policies to reduce physical inactivity, 2017
Existence of policies to reduce unhealthy diet related to NCDs, 2017
CHO RISK SCORE 7.5/11
CHANCE OF MEETING WHO 2025 TARGET
4%

166Atlas of Childhood Obesity | Country Report Cards
Latest survey: % infants overweight 0.9
2016: % boys aged 5-9 with obesity 1.5
2016: % girls aged 5-9 with obesity 3.6
2016: % boys aged 10-19 with obesity 0.7
2016: % girls aged 10-19 with obesity 2
2010: % adolescent boys insufficient physical activity 85.6
2010: % adolescent girls insufficient physical activity 93.6
2016: % women with obesity 13.5
Latest survey: % early initiation of breast-feeding 33.6
2020 estimate: % women smoking 0.6
Latest survey: % infants with stunting 16.5
Predicted 2030: % children aged 5-9 with obesity 6.0
Predicted 2030: % children aged 10-19 with obesity 3.7
Predicted 2030: number of children aged 5-9 with obesity 167,720
Predicted 2030: number of children aged 10-19 with obesity 186,076
Predicted 2030: number of children aged 5-19 with obesity 353,796
Senegal
Existence of any policies on marketing of foods to children, 2017
Existence of policies to reduce physical inactivity, 2017
Existence of policies to reduce unhealthy diet related to NCDs, 2017
CHO RISK SCORE 4.5/11
CHANCE OF MEETING WHO 2025 TARGET
5%

167Atlas of Childhood Obesity | Country Report Cards
Latest survey: % infants overweight 13.9
2016: % boys aged 5-9 with obesity 16.9
2016: % girls aged 5-9 with obesity 10.4
2016: % boys aged 10-19 with obesity 10.4
2016: % girls aged 10-19 with obesity 5.4
2010: % adolescent boys insufficient physical activity
2010: % adolescent girls insufficient physical activity
2016: % women with obesity 22.8
Latest survey: % early initiation of breast-feeding
2020 estimate: % women smoking 39.3
Latest survey: % infants with stunting 6.0
Predicted 2030: % children aged 5-9 with obesity 22.3
Predicted 2030: % children aged 10-19 with obesity 15.4
Predicted 2030: number of children aged 5-9 with obesity 88,231
Predicted 2030: number of children aged 10-19 with obesity 130,727
Predicted 2030: number of children aged 5-19 with obesity 218,958
Serbia
Existence of any policies on marketing of foods to children, 2017
Existence of policies to reduce physical inactivity, 2017
Existence of policies to reduce unhealthy diet related to NCDs, 2017
CHO RISK SCORE 7/11
CHANCE OF MEETING WHO 2025 TARGET
1%

168Atlas of Childhood Obesity | Country Report Cards
Latest survey: % infants overweight 10.2
2016: % boys aged 5-9 with obesity 13.9
2016: % girls aged 5-9 with obesity 12.7
2016: % boys aged 10-19 with obesity 9.2
2016: % girls aged 10-19 with obesity 9.9
2010: % adolescent boys insufficient physical activity 76.6
2010: % adolescent girls insufficient physical activity 86.8
2016: % women with obesity 21.4
Latest survey: % early initiation of breast-feeding
2020 estimate: % women smoking 8.2
Latest survey: % infants with stunting 7.9
Predicted 2030: % children aged 5-9 with obesity 21.8
Predicted 2030: % children aged 10-19 with obesity 17.0
Predicted 2030: number of children aged 5-9 with obesity 1,118
Predicted 2030: number of children aged 10-19 with obesity 1,777
Predicted 2030: number of children aged 5-19 with obesity 2,895
Seychelles
Existence of any policies on marketing of foods to children, 2017
Existence of policies to reduce physical inactivity, 2017
Existence of policies to reduce unhealthy diet related to NCDs, 2017
CHO RISK SCORE 7/11
CHANCE OF MEETING WHO 2025 TARGET
0%

169Atlas of Childhood Obesity | Country Report Cards
Latest survey: % infants overweight 8.8
2016: % boys aged 5-9 with obesity 1.7
2016: % girls aged 5-9 with obesity 5.1
2016: % boys aged 10-19 with obesity 0.8
2016: % girls aged 10-19 with obesity 3.3
2010: % adolescent boys insufficient physical activity
2010: % adolescent girls insufficient physical activity
2016: % women with obesity 13.9
Latest survey: % early initiation of breast-feeding 53.9
2020 estimate: % women smoking 10.2
Latest survey: % infants with stunting 37.8
Predicted 2030: % children aged 5-9 with obesity 7.7
Predicted 2030: % children aged 10-19 with obesity 5.2
Predicted 2030: number of children aged 5-9 with obesity 73,190
Predicted 2030: number of children aged 10-19 with obesity 90,635
Predicted 2030: number of children aged 5-19 with obesity 163,825
Sierra Leone
Existence of any policies on marketing of foods to children, 2017
Existence of policies to reduce physical inactivity, 2017
Existence of policies to reduce unhealthy diet related to NCDs, 2017
CHO RISK SCORE 5/11
CHANCE OF MEETING WHO 2025 TARGET
3%

170Atlas of Childhood Obesity | Country Report Cards
Latest survey: % infants overweight 2.6
2016: % boys aged 5-9 with obesity 12.8
2016: % girls aged 5-9 with obesity 6.1
2016: % boys aged 10-19 with obesity 7.6
2016: % girls aged 10-19 with obesity 3.6
2010: % adolescent boys insufficient physical activity 87.9
2010: % adolescent girls insufficient physical activity 91.9
2016: % women with obesity 6.6
Latest survey: % early initiation of breast-feeding
2020 estimate: % women smoking 4.9
Latest survey: % infants with stunting 4.4
Predicted 2030: % children aged 5-9 with obesity 11.0
Predicted 2030: % children aged 10-19 with obesity 7.2
Predicted 2030: number of children aged 5-9 with obesity 34,773
Predicted 2030: number of children aged 10-19 with obesity 45,114
Predicted 2030: number of children aged 5-19 with obesity 79,886
Singapore
Existence of any policies on marketing of foods to children, 2017
Existence of policies to reduce physical inactivity, 2017
Existence of policies to reduce unhealthy diet related to NCDs, 2017
CHO RISK SCORE 5/11
CHANCE OF MEETING WHO 2025 TARGET
37%

171Atlas of Childhood Obesity | Country Report Cards
Latest survey: % infants overweight
2016: % boys aged 5-9 with obesity 13.6
2016: % girls aged 5-9 with obesity 7.7
2016: % boys aged 10-19 with obesity 8.7
2016: % girls aged 10-19 with obesity 4.6
2010: % adolescent boys insufficient physical activity 72.9
2010: % adolescent girls insufficient physical activity 81.6
2016: % women with obesity 20.8
Latest survey: % early initiation of breast-feeding
2020 estimate: % women smoking 16.8
Latest survey: % infants with stunting
Predicted 2030: % children aged 5-9 with obesity 19.2
Predicted 2030: % children aged 10-19 with obesity 14.3
Predicted 2030: number of children aged 5-9 with obesity 51,330
Predicted 2030: number of children aged 10-19 with obesity 81,768
Predicted 2030: number of children aged 5-19 with obesity 133,098
Slovakia
Existence of any policies on marketing of foods to children, 2017
Existence of policies to reduce physical inactivity, 2017
Existence of policies to reduce unhealthy diet related to NCDs, 2017
CHO RISK SCORE 7/11
CHANCE OF MEETING WHO 2025 TARGET
1%

172Atlas of Childhood Obesity | Country Report Cards
Latest survey: % infants overweight
2016: % boys aged 5-9 with obesity 14.6
2016: % girls aged 5-9 with obesity 10.3
2016: % boys aged 10-19 with obesity 8.5
2016: % girls aged 10-19 with obesity 6
2010: % adolescent boys insufficient physical activity 74.7
2010: % adolescent girls insufficient physical activity 85
2016: % women with obesity 21.9
Latest survey: % early initiation of breast-feeding
2020 estimate: % women smoking 17
Latest survey: % infants with stunting
Predicted 2030: % children aged 5-9 with obesity 20.9
Predicted 2030: % children aged 10-19 with obesity 14.3
Predicted 2030: number of children aged 5-9 with obesity 19,595
Predicted 2030: number of children aged 10-19 with obesity 29,676
Predicted 2030: number of children aged 5-19 with obesity 49,271
Slovenia
Existence of any policies on marketing of foods to children, 2017
Existence of policies to reduce physical inactivity, 2017
Existence of policies to reduce unhealthy diet related to NCDs, 2017
CHO RISK SCORE 7.5/11
CHANCE OF MEETING WHO 2025 TARGET
1%
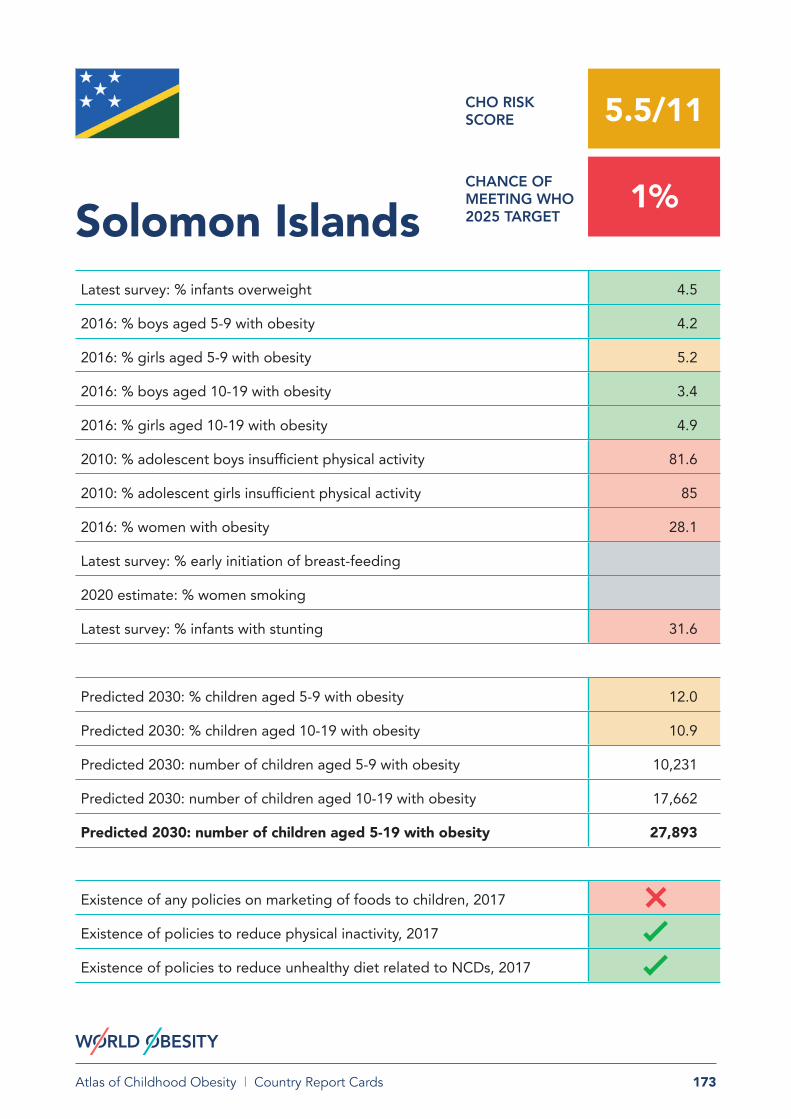
173Atlas of Childhood Obesity | Country Report Cards
Latest survey: % infants overweight 4.5
2016: % boys aged 5-9 with obesity 4.2
2016: % girls aged 5-9 with obesity 5.2
2016: % boys aged 10-19 with obesity 3.4
2016: % girls aged 10-19 with obesity 4.9
2010: % adolescent boys insufficient physical activity 81.6
2010: % adolescent girls insufficient physical activity 85
2016: % women with obesity 28.1
Latest survey: % early initiation of breast-feeding
2020 estimate: % women smoking
Latest survey: % infants with stunting 31.6
Predicted 2030: % children aged 5-9 with obesity 12.0
Predicted 2030: % children aged 10-19 with obesity 10.9
Predicted 2030: number of children aged 5-9 with obesity 10,231
Predicted 2030: number of children aged 10-19 with obesity 17,662
Predicted 2030: number of children aged 5-19 with obesity 27,893
Solomon Islands
Existence of any policies on marketing of foods to children, 2017
Existence of policies to reduce physical inactivity, 2017
Existence of policies to reduce unhealthy diet related to NCDs, 2017
CHO RISK SCORE 5.5/11
CHANCE OF MEETING WHO 2025 TARGET
1%

174Atlas of Childhood Obesity | Country Report Cards
Latest survey: % infants overweight 3.0
2016: % boys aged 5-9 with obesity 3
2016: % girls aged 5-9 with obesity 5.1
2016: % boys aged 10-19 with obesity 1.6
2016: % girls aged 10-19 with obesity 3.2
2010: % adolescent boys insufficient physical activity
2010: % adolescent girls insufficient physical activity
2016: % women with obesity 12.8
Latest survey: % early initiation of breast-feeding
2020 estimate: % women smoking
Latest survey: % infants with stunting 25.3
Predicted 2030: % children aged 5-9 with obesity 9.7
Predicted 2030: % children aged 10-19 with obesity 6.5
Predicted 2030: number of children aged 5-9 with obesity 237,367
Predicted 2030: number of children aged 10-19 with obesity 261,898
Predicted 2030: number of children aged 5-19 with obesity 499,265
Somalia
Existence of any policies on marketing of foods to children, 2017
Existence of policies to reduce physical inactivity, 2017
Existence of policies to reduce unhealthy diet related to NCDs, 2017
CHO RISK SCORE 4/11
CHANCE OF MEETING WHO 2025 TARGET
2%

175Atlas of Childhood Obesity | Country Report Cards
Latest survey: % infants overweight 13.3
2016: % boys aged 5-9 with obesity 10.7
2016: % girls aged 5-9 with obesity 12
2016: % boys aged 10-19 with obesity 9.4
2016: % girls aged 10-19 with obesity 13.2
2010: % adolescent boys insufficient physical activity
2010: % adolescent girls insufficient physical activity
2016: % women with obesity 41.0
Latest survey: % early initiation of breast-feeding 39.1
2020 estimate: % women smoking 5.2
Latest survey: % infants with stunting 27.4
Predicted 2030: % children aged 5-9 with obesity 28.2
Predicted 2030: % children aged 10-19 with obesity 27.1
Predicted 2030: number of children aged 5-9 with obesity 1,375,345
Predicted 2030: number of children aged 10-19 with obesity 2,770,984
Predicted 2030: number of children aged 5-19 with obesity 4,146,329
South Africa
Existence of any policies on marketing of foods to children, 2017
Existence of policies to reduce physical inactivity, 2017
Existence of policies to reduce unhealthy diet related to NCDs, 2017
CHO RISK SCORE 7/11
CHANCE OF MEETING WHO 2025 TARGET
0%

176Atlas of Childhood Obesity | Country Report Cards
Latest survey: % infants overweight
2016: % boys aged 5-9 with obesity 17.5
2016: % girls aged 5-9 with obesity 12.1
2016: % boys aged 10-19 with obesity 10.6
2016: % girls aged 10-19 with obesity 6.3
2010: % adolescent boys insufficient physical activity 69.7
2010: % adolescent girls insufficient physical activity 84.3
2016: % women with obesity 23.8
Latest survey: % early initiation of breast-feeding
2020 estimate: % women smoking 25.7
Latest survey: % infants with stunting
Predicted 2030: % children aged 5-9 with obesity 18.6
Predicted 2030: % children aged 10-19 with obesity 11.6
Predicted 2030: number of children aged 5-9 with obesity 383,815
Predicted 2030: number of children aged 10-19 with obesity 547,228
Predicted 2030: number of children aged 5-19 with obesity 931,043
Spain
Existence of any policies on marketing of foods to children, 2017
Existence of policies to reduce physical inactivity, 2017
Existence of policies to reduce unhealthy diet related to NCDs, 2017
CHO RISK SCORE 7.5/11
CHANCE OF MEETING WHO 2025 TARGET
18%
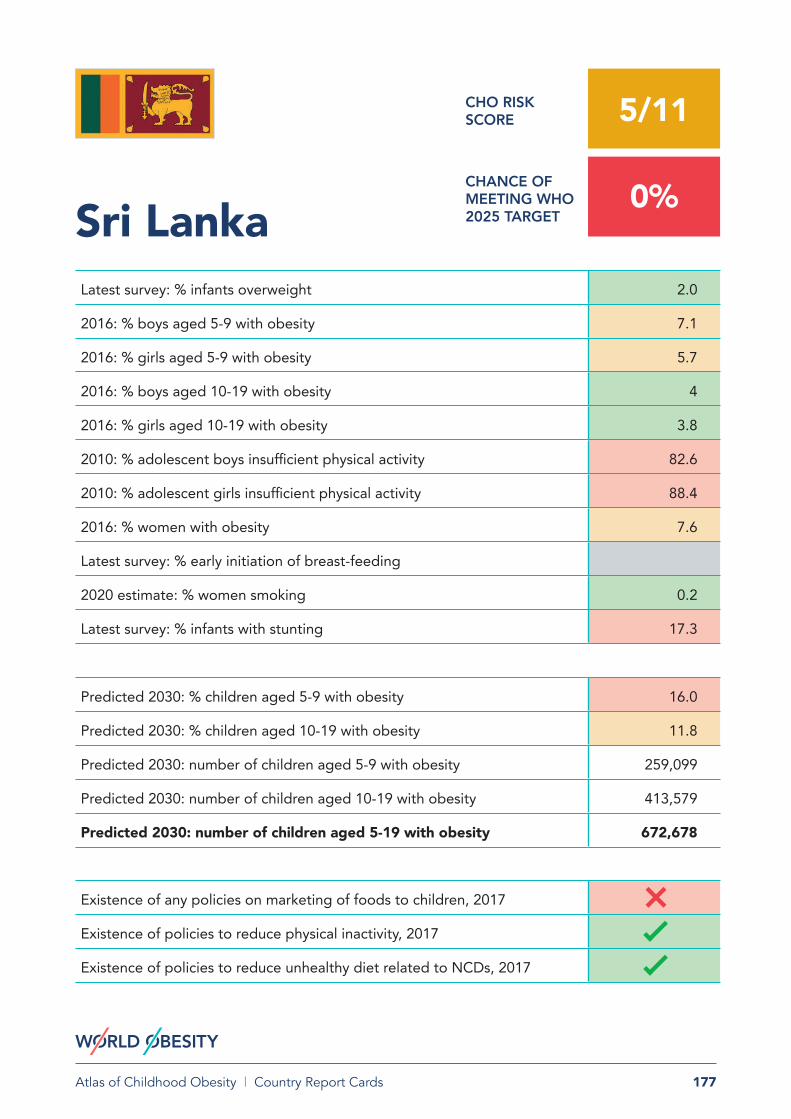
177Atlas of Childhood Obesity | Country Report Cards
Latest survey: % infants overweight 2.0
2016: % boys aged 5-9 with obesity 7.1
2016: % girls aged 5-9 with obesity 5.7
2016: % boys aged 10-19 with obesity 4
2016: % girls aged 10-19 with obesity 3.8
2010: % adolescent boys insufficient physical activity 82.6
2010: % adolescent girls insufficient physical activity 88.4
2016: % women with obesity 7.6
Latest survey: % early initiation of breast-feeding
2020 estimate: % women smoking 0.2
Latest survey: % infants with stunting 17.3
Predicted 2030: % children aged 5-9 with obesity 16.0
Predicted 2030: % children aged 10-19 with obesity 11.8
Predicted 2030: number of children aged 5-9 with obesity 259,099
Predicted 2030: number of children aged 10-19 with obesity 413,579
Predicted 2030: number of children aged 5-19 with obesity 672,678
Sri Lanka
Existence of any policies on marketing of foods to children, 2017
Existence of policies to reduce physical inactivity, 2017
Existence of policies to reduce unhealthy diet related to NCDs, 2017
CHO RISK SCORE 5/11
CHANCE OF MEETING WHO 2025 TARGET
0%

178Atlas of Childhood Obesity | Country Report Cards
Latest survey: % infants overweight 3.0
2016: % boys aged 5-9 with obesity 3
2016: % girls aged 5-9 with obesity 4.9
2016: % boys aged 10-19 with obesity 1.6
2016: % girls aged 10-19 with obesity 3
2010: % adolescent boys insufficient physical activity 91.2
2010: % adolescent girls insufficient physical activity 92.3
2016: % women with obesity 12.9
Latest survey: % early initiation of breast-feeding
2020 estimate: % women smoking
Latest survey: % infants with stunting 38.2
Predicted 2030: % children aged 5-9 with obesity 9.3
Predicted 2030: % children aged 10-19 with obesity 6.1
Predicted 2030: number of children aged 5-9 with obesity 803,734
Predicted 2030: number of children aged 10-19 with obesity 953,737
Predicted 2030: number of children aged 5-19 with obesity 1,757,471
Sudan
Existence of any policies on marketing of foods to children, 2017
Existence of policies to reduce physical inactivity, 2017
Existence of policies to reduce unhealthy diet related to NCDs, 2017
CHO RISK SCORE 4.5/11
CHANCE OF MEETING WHO 2025 TARGET
2%

179Atlas of Childhood Obesity | Country Report Cards
Latest survey: % infants overweight 4.0
2016: % boys aged 5-9 with obesity 19.5
2016: % girls aged 5-9 with obesity 15.6
2016: % boys aged 10-19 with obesity 13.8
2016: % girls aged 10-19 with obesity 10.7
2010: % adolescent boys insufficient physical activity 77.9
2010: % adolescent girls insufficient physical activity 83.9
2016: % women with obesity 35.0
Latest survey: % early initiation of breast-feeding
2020 estimate: % women smoking
Latest survey: % infants with stunting 8.8
Predicted 2030: % children aged 5-9 with obesity 24.3
Predicted 2030: % children aged 10-19 with obesity 18.8
Predicted 2030: number of children aged 5-9 with obesity 10,796
Predicted 2030: number of children aged 10-19 with obesity 16,718
Predicted 2030: number of children aged 5-19 with obesity 27,514
Suriname
Existence of any policies on marketing of foods to children, 2017
Existence of policies to reduce physical inactivity, 2017
Existence of policies to reduce unhealthy diet related to NCDs, 2017
CHO RISK SCORE 7.5/11
CHANCE OF MEETING WHO 2025 TARGET
6%
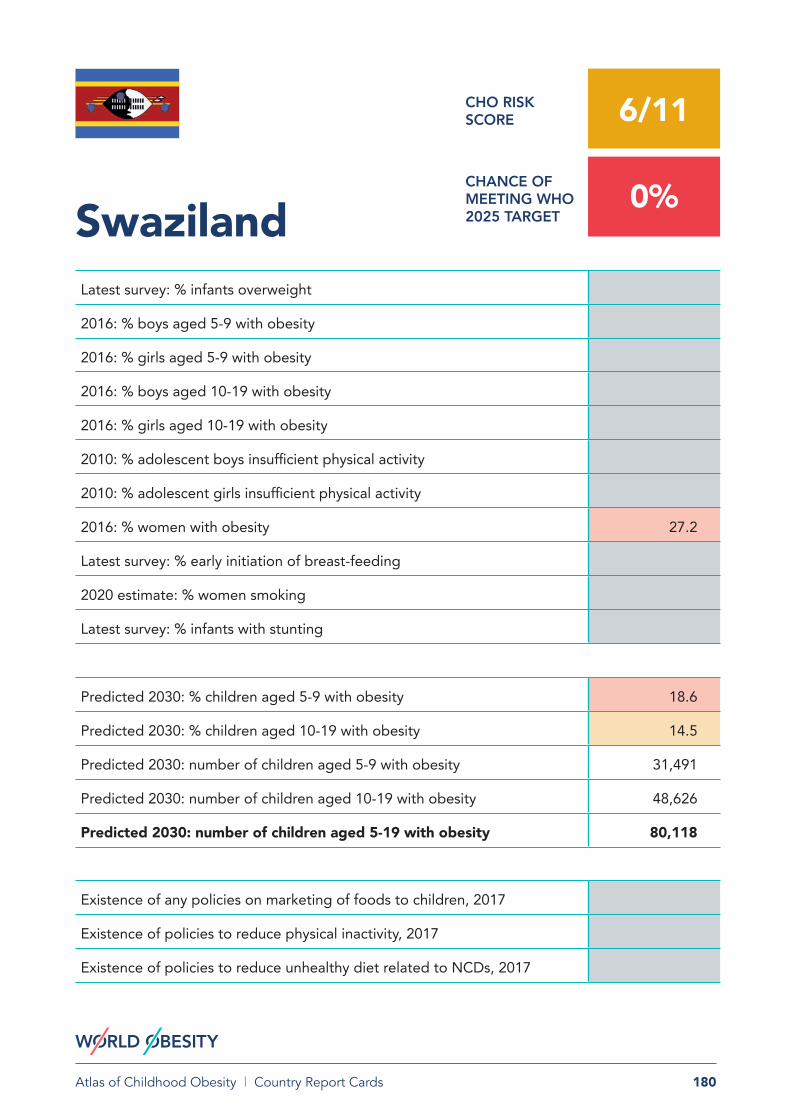
180Atlas of Childhood Obesity | Country Report Cards
Latest survey: % infants overweight
2016: % boys aged 5-9 with obesity
2016: % girls aged 5-9 with obesity
2016: % boys aged 10-19 with obesity
2016: % girls aged 10-19 with obesity
2010: % adolescent boys insufficient physical activity
2010: % adolescent girls insufficient physical activity
2016: % women with obesity 27.2
Latest survey: % early initiation of breast-feeding
2020 estimate: % women smoking
Latest survey: % infants with stunting
Predicted 2030: % children aged 5-9 with obesity 18.6
Predicted 2030: % children aged 10-19 with obesity 14.5
Predicted 2030: number of children aged 5-9 with obesity 31,491
Predicted 2030: number of children aged 10-19 with obesity 48,626
Predicted 2030: number of children aged 5-19 with obesity 80,118
Swaziland
Existence of any policies on marketing of foods to children, 2017
Existence of policies to reduce physical inactivity, 2017
Existence of policies to reduce unhealthy diet related to NCDs, 2017
CHO RISK SCORE 6/11
CHANCE OF MEETING WHO 2025 TARGET
0%

181Atlas of Childhood Obesity | Country Report Cards
Latest survey: % infants overweight
2016: % boys aged 5-9 with obesity 10.3
2016: % girls aged 5-9 with obesity 6.1
2016: % boys aged 10-19 with obesity 7.7
2016: % girls aged 10-19 with obesity 3.9
2010: % adolescent boys insufficient physical activity 83.3
2010: % adolescent girls insufficient physical activity 88.9
2016: % women with obesity 18.8
Latest survey: % early initiation of breast-feeding
2020 estimate: % women smoking 17.6
Latest survey: % infants with stunting
Predicted 2030: % children aged 5-9 with obesity 11.0
Predicted 2030: % children aged 10-19 with obesity 8.2
Predicted 2030: number of children aged 5-9 with obesity 71,500
Predicted 2030: number of children aged 10-19 with obesity 105,648
Predicted 2030: number of children aged 5-19 with obesity 177,147
Sweden
Existence of any policies on marketing of foods to children, 2017
Existence of policies to reduce physical inactivity, 2017
Existence of policies to reduce unhealthy diet related to NCDs, 2017
CHO RISK SCORE 6/11
CHANCE OF MEETING WHO 2025 TARGET
23%

182Atlas of Childhood Obesity | Country Report Cards
Latest survey: % infants overweight
2016: % boys aged 5-9 with obesity 8.2
2016: % girls aged 5-9 with obesity 6
2016: % boys aged 10-19 with obesity 6.3
2016: % girls aged 10-19 with obesity 3.9
2010: % adolescent boys insufficient physical activity 84.8
2010: % adolescent girls insufficient physical activity 91.2
2016: % women with obesity 17.6
Latest survey: % early initiation of breast-feeding
2020 estimate: % women smoking 18.1
Latest survey: % infants with stunting
Predicted 2030: % children aged 5-9 with obesity 10.1
Predicted 2030: % children aged 10-19 with obesity 7.8
Predicted 2030: number of children aged 5-9 with obesity 50,814
Predicted 2030: number of children aged 10-19 with obesity 74,088
Predicted 2030: number of children aged 5-19 with obesity 124,902
Switzerland
Existence of any policies on marketing of foods to children, 2017
Existence of policies to reduce physical inactivity, 2017
Existence of policies to reduce unhealthy diet related to NCDs, 2017
CHO RISK SCORE 7/11
CHANCE OF MEETING WHO 2025 TARGET
16%

183Atlas of Childhood Obesity | Country Report Cards
Latest survey: % infants overweight 17.9
2016: % boys aged 5-9 with obesity 15.5
2016: % girls aged 5-9 with obesity 13.5
2016: % boys aged 10-19 with obesity 10.3
2016: % girls aged 10-19 with obesity 9.4
2010: % adolescent boys insufficient physical activity 85.5
2010: % adolescent girls insufficient physical activity 92.3
2016: % women with obesity 36.1
Latest survey: % early initiation of breast-feeding
2020 estimate: % women smoking
Latest survey: % infants with stunting 27.6
Predicted 2030: % children aged 5-9 with obesity 22.9
Predicted 2030: % children aged 10-19 with obesity 17.4
Predicted 2030: number of children aged 5-9 with obesity 636,258
Predicted 2030: number of children aged 10-19 with obesity 915,997
Predicted 2030: number of children aged 5-19 with obesity 1,552,255
Syria
Existence of any policies on marketing of foods to children, 2017
Existence of policies to reduce physical inactivity, 2017
Existence of policies to reduce unhealthy diet related to NCDs, 2017
CHO RISK SCORE 8.5/11
CHANCE OF MEETING WHO 2025 TARGET
2%
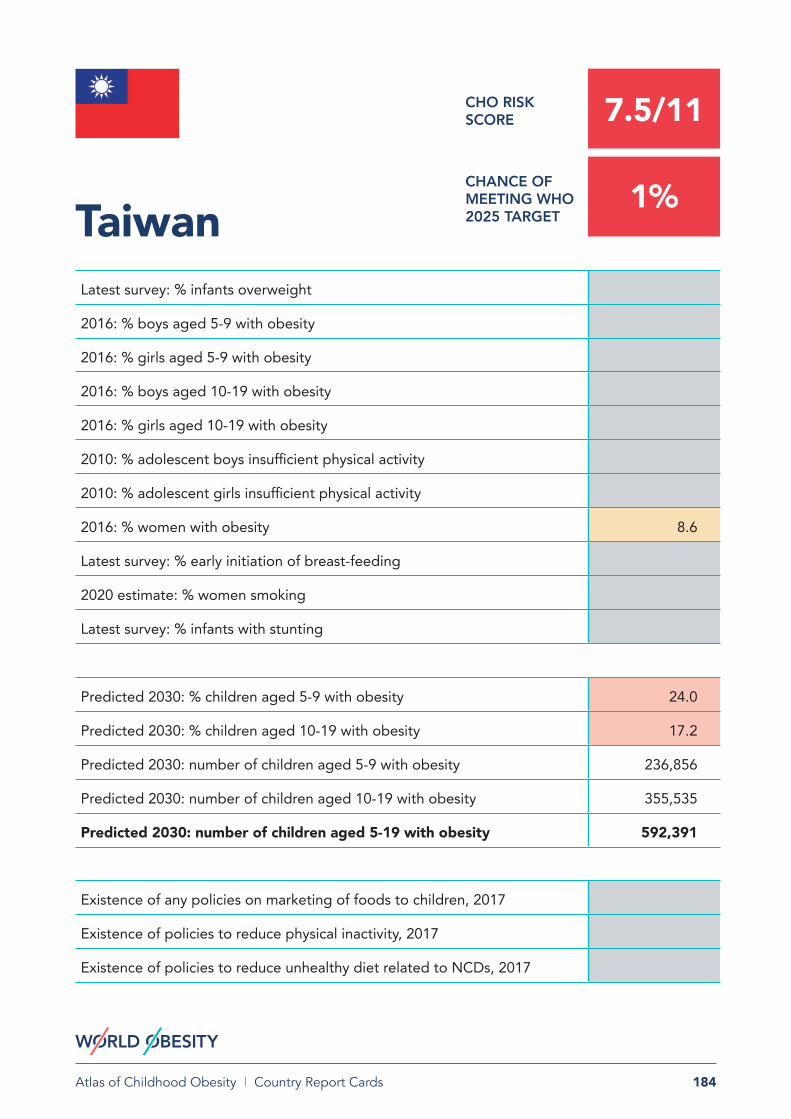
184Atlas of Childhood Obesity | Country Report Cards
Latest survey: % infants overweight
2016: % boys aged 5-9 with obesity
2016: % girls aged 5-9 with obesity
2016: % boys aged 10-19 with obesity
2016: % girls aged 10-19 with obesity
2010: % adolescent boys insufficient physical activity
2010: % adolescent girls insufficient physical activity
2016: % women with obesity 8.6
Latest survey: % early initiation of breast-feeding
2020 estimate: % women smoking
Latest survey: % infants with stunting
Predicted 2030: % children aged 5-9 with obesity 24.0
Predicted 2030: % children aged 10-19 with obesity 17.2
Predicted 2030: number of children aged 5-9 with obesity 236,856
Predicted 2030: number of children aged 10-19 with obesity 355,535
Predicted 2030: number of children aged 5-19 with obesity 592,391
Taiwan
Existence of any policies on marketing of foods to children, 2017
Existence of policies to reduce physical inactivity, 2017
Existence of policies to reduce unhealthy diet related to NCDs, 2017
CHO RISK SCORE 7.5/11
CHANCE OF MEETING WHO 2025 TARGET
1%

185Atlas of Childhood Obesity | Country Report Cards
Latest survey: % infants overweight 3.3
2016: % boys aged 5-9 with obesity 4.8
2016: % girls aged 5-9 with obesity 3.5
2016: % boys aged 10-19 with obesity 2.6
2016: % girls aged 10-19 with obesity 1.9
2010: % adolescent boys insufficient physical activity
2010: % adolescent girls insufficient physical activity
2016: % women with obesity 17.4
Latest survey: % early initiation of breast-feeding 49.6
2020 estimate: % women smoking
Latest survey: % infants with stunting 17.5
Predicted 2030: % children aged 5-9 with obesity 10.0
Predicted 2030: % children aged 10-19 with obesity 6.5
Predicted 2030: number of children aged 5-9 with obesity 125,053
Predicted 2030: number of children aged 10-19 with obesity 163,729
Predicted 2030: number of children aged 5-19 with obesity 288,782
Tajikistan
Existence of any policies on marketing of foods to children, 2017
Existence of policies to reduce physical inactivity, 2017
Existence of policies to reduce unhealthy diet related to NCDs, 2017
CHO RISK SCORE 4.5/11
CHANCE OF MEETING WHO 2025 TARGET
2%

186Atlas of Childhood Obesity | Country Report Cards
Latest survey: % infants overweight 3.7
2016: % boys aged 5-9 with obesity 2.4
2016: % girls aged 5-9 with obesity 4.4
2016: % boys aged 10-19 with obesity 1.3
2016: % girls aged 10-19 with obesity 2.6
2010: % adolescent boys insufficient physical activity 75.5
2010: % adolescent girls insufficient physical activity 84.9
2016: % women with obesity 13.2
Latest survey: % early initiation of breast-feeding 51.3
2020 estimate: % women smoking 3.5
Latest survey: % infants with stunting 34.5
Predicted 2030: % children aged 5-9 with obesity 9.5
Predicted 2030: % children aged 10-19 with obesity 6.3
Predicted 2030: number of children aged 5-9 with obesity 1,018,403
Predicted 2030: number of children aged 10-19 with obesity 1,167,477
Predicted 2030: number of children aged 5-19 with obesity 2,185,879
Tanzania
Existence of any policies on marketing of foods to children, 2017
Existence of policies to reduce physical inactivity, 2017
Existence of policies to reduce unhealthy diet related to NCDs, 2017
CHO RISK SCORE 4.5/11
CHANCE OF MEETING WHO 2025 TARGET
0%

187Atlas of Childhood Obesity | Country Report Cards
Latest survey: % infants overweight 8.2
2016: % boys aged 5-9 with obesity 18.6
2016: % girls aged 5-9 with obesity 11.3
2016: % boys aged 10-19 with obesity 11.8
2016: % girls aged 10-19 with obesity 7.3
2010: % adolescent boys insufficient physical activity 78.3
2010: % adolescent girls insufficient physical activity 90.2
2016: % women with obesity 13.3
Latest survey: % early initiation of breast-feeding
2020 estimate: % women smoking 2.1
Latest survey: % infants with stunting 10.5
Predicted 2030: % children aged 5-9 with obesity 26.6
Predicted 2030: % children aged 10-19 with obesity 20.3
Predicted 2030: number of children aged 5-9 with obesity 826,799
Predicted 2030: number of children aged 10-19 with obesity 1,325,799
Predicted 2030: number of children aged 5-19 with obesity 2,152,598
Thailand
Existence of any policies on marketing of foods to children, 2017
Existence of policies to reduce physical inactivity, 2017
Existence of policies to reduce unhealthy diet related to NCDs, 2017
CHO RISK SCORE 7/11
CHANCE OF MEETING WHO 2025 TARGET
0%

188Atlas of Childhood Obesity | Country Report Cards
Latest survey: % infants overweight 2.0
2016: % boys aged 5-9 with obesity 2
2016: % girls aged 5-9 with obesity 3.6
2016: % boys aged 10-19 with obesity 1
2016: % girls aged 10-19 with obesity 2
2010: % adolescent boys insufficient physical activity
2010: % adolescent girls insufficient physical activity
2016: % women with obesity 13.1
Latest survey: % early initiation of breast-feeding 60.7
2020 estimate: % women smoking
Latest survey: % infants with stunting 27.6
Predicted 2030: % children aged 5-9 with obesity 7.3
Predicted 2030: % children aged 10-19 with obesity 4.5
Predicted 2030: number of children aged 5-9 with obesity 89,315
Predicted 2030: number of children aged 10-19 with obesity 101,400
Predicted 2030: number of children aged 5-19 with obesity 190,715
Togo
Existence of any policies on marketing of foods to children, 2017
Existence of policies to reduce physical inactivity, 2017
Existence of policies to reduce unhealthy diet related to NCDs, 2017
CHO RISK SCORE 3.5/11
CHANCE OF MEETING WHO 2025 TARGET
2%

189Atlas of Childhood Obesity | Country Report Cards
Latest survey: % infants overweight 17.3
2016: % boys aged 5-9 with obesity 27.5
2016: % girls aged 5-9 with obesity 32.9
2016: % boys aged 10-19 with obesity 22
2016: % girls aged 10-19 with obesity 28
2010: % adolescent boys insufficient physical activity 88.6
2010: % adolescent girls insufficient physical activity 84.2
2016: % women with obesity 56.1
Latest survey: % early initiation of breast-feeding
2020 estimate: % women smoking 12.4
Latest survey: % infants with stunting 8.1
Predicted 2030: % children aged 5-9 with obesity 41.0
Predicted 2030: % children aged 10-19 with obesity 36.9
Predicted 2030: number of children aged 5-9 with obesity 5,012
Predicted 2030: number of children aged 10-19 with obesity 8,893
Predicted 2030: number of children aged 5-19 with obesity 13,905
Tonga
Existence of any policies on marketing of foods to children, 2017
Existence of policies to reduce physical inactivity, 2017
Existence of policies to reduce unhealthy diet related to NCDs, 2017
CHO RISK SCORE 10/11
CHANCE OF MEETING WHO 2025 TARGET
0%

190Atlas of Childhood Obesity | Country Report Cards
Latest survey: % infants overweight 11.4
2016: % boys aged 5-9 with obesity 14.6
2016: % girls aged 5-9 with obesity 13.5
2016: % boys aged 10-19 with obesity 9.4
2016: % girls aged 10-19 with obesity 9.4
2010: % adolescent boys insufficient physical activity 78.2
2010: % adolescent girls insufficient physical activity 85.1
2016: % women with obesity 27.1
Latest survey: % early initiation of breast-feeding
2020 estimate: % women smoking
Latest survey: % infants with stunting 9.2
Predicted 2030: % children aged 5-9 with obesity 24.6
Predicted 2030: % children aged 10-19 with obesity 19.1
Predicted 2030: number of children aged 5-9 with obesity 17,948
Predicted 2030: number of children aged 10-19 with obesity 32,886
Predicted 2030: number of children aged 5-19 with obesity 50,834
Trinidad and Tobago
Existence of any policies on marketing of foods to children, 2017
Existence of policies to reduce physical inactivity, 2017
Existence of policies to reduce unhealthy diet related to NCDs, 2017
CHO RISK SCORE 7/11
CHANCE OF MEETING WHO 2025 TARGET
1%

191Atlas of Childhood Obesity | Country Report Cards
Latest survey: % infants overweight 14.2
2016: % boys aged 5-9 with obesity 10.7
2016: % girls aged 5-9 with obesity 10.1
2016: % boys aged 10-19 with obesity 6.9
2016: % girls aged 10-19 with obesity 8.1
2010: % adolescent boys insufficient physical activity 74.1
2010: % adolescent girls insufficient physical activity 88.2
2016: % women with obesity 35.6
Latest survey: % early initiation of breast-feeding
2020 estimate: % women smoking
Latest survey: % infants with stunting 10.1
Predicted 2030: % children aged 5-9 with obesity 17.8
Predicted 2030: % children aged 10-19 with obesity 14.0
Predicted 2030: number of children aged 5-9 with obesity 146,891
Predicted 2030: number of children aged 10-19 with obesity 252,325
Predicted 2030: number of children aged 5-19 with obesity 399,216
Tunisia
Existence of any policies on marketing of foods to children, 2017
Existence of policies to reduce physical inactivity, 2017
Existence of policies to reduce unhealthy diet related to NCDs, 2017
CHO RISK SCORE 7/11
CHANCE OF MEETING WHO 2025 TARGET
2%

192Atlas of Childhood Obesity | Country Report Cards
Latest survey: % infants overweight 11.1
2016: % boys aged 5-9 with obesity 16
2016: % girls aged 5-9 with obesity 13.8
2016: % boys aged 10-19 with obesity 10.2
2016: % girls aged 10-19 with obesity 9.4
2010: % adolescent boys insufficient physical activity 77.1
2010: % adolescent girls insufficient physical activity 86.9
2016: % women with obesity 40.7
Latest survey: % early initiation of breast-feeding 52.4
2020 estimate: % women smoking 10.6
Latest survey: % infants with stunting 9.9
Predicted 2030: % children aged 5-9 with obesity 22.9
Predicted 2030: % children aged 10-19 with obesity 17.0
Predicted 2030: number of children aged 5-9 with obesity 1,327,017
Predicted 2030: number of children aged 10-19 with obesity 2,062,925
Predicted 2030: number of children aged 5-19 with obesity 3,389,941
Turkey
Existence of any policies on marketing of foods to children, 2017
Existence of policies to reduce physical inactivity, 2017
Existence of policies to reduce unhealthy diet related to NCDs, 2017
CHO RISK SCORE 8/11
CHANCE OF MEETING WHO 2025 TARGET
2%
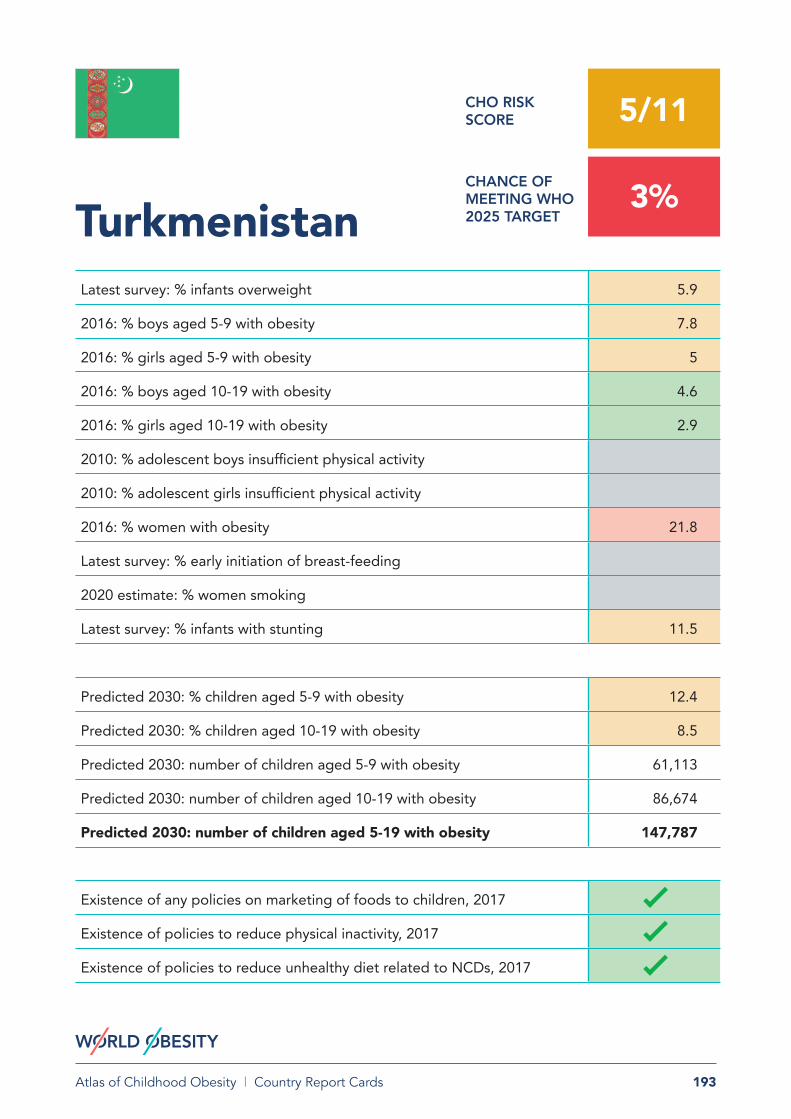
193Atlas of Childhood Obesity | Country Report Cards
Latest survey: % infants overweight 5.9
2016: % boys aged 5-9 with obesity 7.8
2016: % girls aged 5-9 with obesity 5
2016: % boys aged 10-19 with obesity 4.6
2016: % girls aged 10-19 with obesity 2.9
2010: % adolescent boys insufficient physical activity
2010: % adolescent girls insufficient physical activity
2016: % women with obesity 21.8
Latest survey: % early initiation of breast-feeding
2020 estimate: % women smoking
Latest survey: % infants with stunting 11.5
Predicted 2030: % children aged 5-9 with obesity 12.4
Predicted 2030: % children aged 10-19 with obesity 8.5
Predicted 2030: number of children aged 5-9 with obesity 61,113
Predicted 2030: number of children aged 10-19 with obesity 86,674
Predicted 2030: number of children aged 5-19 with obesity 147,787
Turkmenistan
Existence of any policies on marketing of foods to children, 2017
Existence of policies to reduce physical inactivity, 2017
Existence of policies to reduce unhealthy diet related to NCDs, 2017
CHO RISK SCORE 5/11
CHANCE OF MEETING WHO 2025 TARGET
3%

194Atlas of Childhood Obesity | Country Report Cards
Latest survey: % infants overweight 6.3
2016: % boys aged 5-9 with obesity 29.8
2016: % girls aged 5-9 with obesity 32.5
2016: % boys aged 10-19 with obesity 23.5
2016: % girls aged 10-19 with obesity 27.2
2010: % adolescent boys insufficient physical activity 86.6
2010: % adolescent girls insufficient physical activity 89.9
2016: % women with obesity 57.9
Latest survey: % early initiation of breast-feeding
2020 estimate: % women smoking
Latest survey: % infants with stunting 10.0
Predicted 2030: % children aged 5-9 with obesity 42.8
Predicted 2030: % children aged 10-19 with obesity 38.2
Predicted 2030: number of children aged 5-9 with obesity 395
Predicted 2030: number of children aged 10-19 with obesity 702
Predicted 2030: number of children aged 5-19 with obesity 1,097
Tuvalu
Existence of any policies on marketing of foods to children, 2017
Existence of policies to reduce physical inactivity, 2017
Existence of policies to reduce unhealthy diet related to NCDs, 2017
CHO RISK SCORE 9/11
CHANCE OF MEETING WHO 2025 TARGET
0%

195Atlas of Childhood Obesity | Country Report Cards
Latest survey: % infants overweight 3.7
2016: % boys aged 5-9 with obesity 0.8
2016: % girls aged 5-9 with obesity 3.9
2016: % boys aged 10-19 with obesity 0.4
2016: % girls aged 10-19 with obesity 2.2
2010: % adolescent boys insufficient physical activity 84.7
2010: % adolescent girls insufficient physical activity 86.6
2016: % women with obesity 9.0
Latest survey: % early initiation of breast-feeding 66.1
2020 estimate: % women smoking 2.4
Latest survey: % infants with stunting 28.9
Predicted 2030: % children aged 5-9 with obesity 7.1
Predicted 2030: % children aged 10-19 with obesity 4.5
Predicted 2030: number of children aged 5-9 with obesity 646,887
Predicted 2030: number of children aged 10-19 with obesity 698,309
Predicted 2030: number of children aged 5-19 with obesity 1,345,197
Uganda
Existence of any policies on marketing of foods to children, 2017
Existence of policies to reduce physical inactivity, 2017
Existence of policies to reduce unhealthy diet related to NCDs, 2017
CHO RISK SCORE 4.5/11
CHANCE OF MEETING WHO 2025 TARGET
1%

196Atlas of Childhood Obesity | Country Report Cards
Latest survey: % infants overweight 26.5
2016: % boys aged 5-9 with obesity 11.6
2016: % girls aged 5-9 with obesity 6.3
2016: % boys aged 10-19 with obesity 7.5
2016: % girls aged 10-19 with obesity 4
2010: % adolescent boys insufficient physical activity 70.4
2010: % adolescent girls insufficient physical activity 83.4
2016: % women with obesity 26.7
Latest survey: % early initiation of breast-feeding
2020 estimate: % women smoking 13.5
Latest survey: % infants with stunting 22.9
Predicted 2030: % children aged 5-9 with obesity 14.3
Predicted 2030: % children aged 10-19 with obesity 10.3
Predicted 2030: number of children aged 5-9 with obesity 286,233
Predicted 2030: number of children aged 10-19 with obesity 477,553
Predicted 2030: number of children aged 5-19 with obesity 763,786
Ukraine
Existence of any policies on marketing of foods to children, 2017
Existence of policies to reduce physical inactivity, 2017
Existence of policies to reduce unhealthy diet related to NCDs, 2017
CHO RISK SCORE 8/11
CHANCE OF MEETING WHO 2025 TARGET
7%

197Atlas of Childhood Obesity | Country Report Cards
Latest survey: % infants overweight
2016: % boys aged 5-9 with obesity 22.7
2016: % girls aged 5-9 with obesity 18.1
2016: % boys aged 10-19 with obesity 16.3
2016: % girls aged 10-19 with obesity 13.1
2010: % adolescent boys insufficient physical activity 77.5
2010: % adolescent girls insufficient physical activity 86
2016: % women with obesity 42.5
Latest survey: % early initiation of breast-feeding
2020 estimate: % women smoking
Latest survey: % infants with stunting
Predicted 2030: % children aged 5-9 with obesity 26.7
Predicted 2030: % children aged 10-19 with obesity 21.0
Predicted 2030: number of children aged 5-9 with obesity 122,929
Predicted 2030: number of children aged 10-19 with obesity 255,644
Predicted 2030: number of children aged 5-19 with obesity 378,573
United Arab Emirates
Existence of any policies on marketing of foods to children, 2017
Existence of policies to reduce physical inactivity, 2017
Existence of policies to reduce unhealthy diet related to NCDs, 2017
CHO RISK SCORE 8.5/11
CHANCE OF MEETING WHO 2025 TARGET
7%

198Atlas of Childhood Obesity | Country Report Cards
Latest survey: % infants overweight
2016: % boys aged 5-9 with obesity 12.7
2016: % girls aged 5-9 with obesity 10.2
2016: % boys aged 10-19 with obesity 9.9
2016: % girls aged 10-19 with obesity 9
2010: % adolescent boys insufficient physical activity 72.7
2010: % adolescent girls insufficient physical activity 84.9
2016: % women with obesity 29.7
Latest survey: % early initiation of breast-feeding
2020 estimate: % women smoking 15.9
Latest survey: % infants with stunting
Predicted 2030: % children aged 5-9 with obesity 12.4
Predicted 2030: % children aged 10-19 with obesity 10.3
Predicted 2030: number of children aged 5-9 with obesity 490,205
Predicted 2030: number of children aged 10-19 with obesity 819,496
Predicted 2030: number of children aged 5-19 with obesity 1,309,702
United Kingdom
Existence of any policies on marketing of foods to children, 2017
Existence of policies to reduce physical inactivity, 2017
Existence of policies to reduce unhealthy diet related to NCDs, 2017
CHO RISK SCORE 7.5/11
CHANCE OF MEETING WHO 2025 TARGET
39%

199Atlas of Childhood Obesity | Country Report Cards
Latest survey: % infants overweight 9.4
2016: % boys aged 5-9 with obesity 25.1
2016: % girls aged 5-9 with obesity 20.3
2016: % boys aged 10-19 with obesity 22.3
2016: % girls aged 10-19 with obesity 19
2010: % adolescent boys insufficient physical activity 63.1
2010: % adolescent girls insufficient physical activity 82.2
2016: % women with obesity 38.2
Latest survey: % early initiation of breast-feeding
2020 estimate: % women smoking 13
Latest survey: % infants with stunting 3.5
Predicted 2030: % children aged 5-9 with obesity 26.3
Predicted 2030: % children aged 10-19 with obesity 24.2
Predicted 2030: number of children aged 5-9 with obesity 5,984,972
Predicted 2030: number of children aged 10-19 with obesity 11,001,631
Predicted 2030: number of children aged 5-19 with obesity 16,986,603
United Statesof America
Existence of any policies on marketing of foods to children, 2017
Existence of policies to reduce physical inactivity, 2017
Existence of policies to reduce unhealthy diet related to NCDs, 2017
CHO RISK SCORE 8.5/11
CHANCE OF MEETING WHO 2025 TARGET
17%

200Atlas of Childhood Obesity | Country Report Cards
Latest survey: % infants overweight 7.2
2016: % boys aged 5-9 with obesity 20
2016: % girls aged 5-9 with obesity 14.4
2016: % boys aged 10-19 with obesity 14.2
2016: % girls aged 10-19 with obesity 10
2010: % adolescent boys insufficient physical activity 76.6
2010: % adolescent girls insufficient physical activity 90.8
2016: % women with obesity 31.8
Latest survey: % early initiation of breast-feeding
2020 estimate: % women smoking 15.7
Latest survey: % infants with stunting 10.7
Predicted 2030: % children aged 5-9 with obesity 22.4
Predicted 2030: % children aged 10-19 with obesity 17.2
Predicted 2030: number of children aged 5-9 with obesity 52,090
Predicted 2030: number of children aged 10-19 with obesity 81,227
Predicted 2030: number of children aged 5-19 with obesity 133,317
Uruguay
Existence of any policies on marketing of foods to children, 2017
Existence of policies to reduce physical inactivity, 2017
Existence of policies to reduce unhealthy diet related to NCDs, 2017
CHO RISK SCORE 8/11
CHANCE OF MEETING WHO 2025 TARGET
12%

201Atlas of Childhood Obesity | Country Report Cards
Latest survey: % infants overweight 12.2
2016: % boys aged 5-9 with obesity 6.7
2016: % girls aged 5-9 with obesity 4.4
2016: % boys aged 10-19 with obesity 3.9
2016: % girls aged 10-19 with obesity 2.4
2010: % adolescent boys insufficient physical activity
2010: % adolescent girls insufficient physical activity
2016: % women with obesity 19.9
Latest survey: % early initiation of breast-feeding
2020 estimate: % women smoking 1.2
Latest survey: % infants with stunting 19.6
Predicted 2030: % children aged 5-9 with obesity 11.9
Predicted 2030: % children aged 10-19 with obesity 8.1
Predicted 2030: number of children aged 5-9 with obesity 317,678
Predicted 2030: number of children aged 10-19 with obesity 462,617
Predicted 2030: number of children aged 5-19 with obesity 780,295
Uzbekistan
Existence of any policies on marketing of foods to children, 2017
Existence of policies to reduce physical inactivity, 2017
Existence of policies to reduce unhealthy diet related to NCDs, 2017
CHO RISK SCORE 4.5/11
CHANCE OF MEETING WHO 2025 TARGET
2%

202Atlas of Childhood Obesity | Country Report Cards
Latest survey: % infants overweight 4.6
2016: % boys aged 5-9 with obesity 10.5
2016: % girls aged 5-9 with obesity 10.6
2016: % boys aged 10-19 with obesity 6.7
2016: % girls aged 10-19 with obesity 7.2
2010: % adolescent boys insufficient physical activity 88.3
2010: % adolescent girls insufficient physical activity 89.9
2016: % women with obesity 31.2
Latest survey: % early initiation of breast-feeding
2020 estimate: % women smoking
Latest survey: % infants with stunting 28.5
Predicted 2030: % children aged 5-9 with obesity 19.1
Predicted 2030: % children aged 10-19 with obesity 14.5
Predicted 2030: number of children aged 5-9 with obesity 6,805
Predicted 2030: number of children aged 10-19 with obesity 9,678
Predicted 2030: number of children aged 5-19 with obesity 16,483
Vanuatu
Existence of any policies on marketing of foods to children, 2017
Existence of policies to reduce physical inactivity, 2017
Existence of policies to reduce unhealthy diet related to NCDs, 2017
CHO RISK SCORE 7/11
CHANCE OF MEETING WHO 2025 TARGET
3%

203Atlas of Childhood Obesity | Country Report Cards
Latest survey: % infants overweight 6.4
2016: % boys aged 5-9 with obesity 18.5
2016: % girls aged 5-9 with obesity 16.2
2016: % boys aged 10-19 with obesity 13
2016: % girls aged 10-19 with obesity 11.6
2010: % adolescent boys insufficient physical activity 87.1
2010: % adolescent girls insufficient physical activity 95.5
2016: % women with obesity 29.8
Latest survey: % early initiation of breast-feeding
2020 estimate: % women smoking
Latest survey: % infants with stunting 13.4
Predicted 2030: % children aged 5-9 with obesity 21.9
Predicted 2030: % children aged 10-19 with obesity 16.7
Predicted 2030: number of children aged 5-9 with obesity 630,880
Predicted 2030: number of children aged 10-19 with obesity 980,564
Predicted 2030: number of children aged 5-19 with obesity 1,611,444
Venezuela
Existence of any policies on marketing of foods to children, 2017
Existence of policies to reduce physical inactivity, 2017
Existence of policies to reduce unhealthy diet related to NCDs, 2017
CHO RISK SCORE 8/11
CHANCE OF MEETING WHO 2025 TARGET
15%

204Atlas of Childhood Obesity | Country Report Cards
Latest survey: % infants overweight 5.3
2016: % boys aged 5-9 with obesity 6.4
2016: % girls aged 5-9 with obesity 2.3
2016: % boys aged 10-19 with obesity 2.3
2016: % girls aged 10-19 with obesity 0.7
2010: % adolescent boys insufficient physical activity 82.1
2010: % adolescent girls insufficient physical activity 90.8
2016: % women with obesity 2.7
Latest survey: % early initiation of breast-feeding
2020 estimate: % women smoking 1.1
Latest survey: % infants with stunting 24.6
Predicted 2030: % children aged 5-9 with obesity 15.2
Predicted 2030: % children aged 10-19 with obesity 7.9
Predicted 2030: number of children aged 5-9 with obesity 893,515
Predicted 2030: number of children aged 10-19 with obesity 1,045,658
Predicted 2030: number of children aged 5-19 with obesity 1,939,173
Vietnam
Existence of any policies on marketing of foods to children, 2017
Existence of policies to reduce physical inactivity, 2017
Existence of policies to reduce unhealthy diet related to NCDs, 2017
CHO RISK SCORE 4.5/11
CHANCE OF MEETING WHO 2025 TARGET
0%

205Atlas of Childhood Obesity | Country Report Cards
Latest survey: % infants overweight 2.5
2016: % boys aged 5-9 with obesity 9.5
2016: % girls aged 5-9 with obesity 10.9
2016: % boys aged 10-19 with obesity 5
2016: % girls aged 10-19 with obesity 5.7
2010: % adolescent boys insufficient physical activity 82.5
2010: % adolescent girls insufficient physical activity 87.7
2016: % women with obesity 23.0
Latest survey: % early initiation of breast-feeding 52.7
2020 estimate: % women smoking
Latest survey: % infants with stunting 46.4
Predicted 2030: % children aged 5-9 with obesity 19.9
Predicted 2030: % children aged 10-19 with obesity 12.9
Predicted 2030: number of children aged 5-9 with obesity 735,732
Predicted 2030: number of children aged 10-19 with obesity 910,752
Predicted 2030: number of children aged 5-19 with obesity 1,646,485
Yemen
Existence of any policies on marketing of foods to children, 2017
Existence of policies to reduce physical inactivity, 2017
Existence of policies to reduce unhealthy diet related to NCDs, 2017
CHO RISK SCORE 7/11
CHANCE OF MEETING WHO 2025 TARGET
1%

206Atlas of Childhood Obesity | Country Report Cards
Latest survey: % infants overweight 6.2
2016: % boys aged 5-9 with obesity 3
2016: % girls aged 5-9 with obesity 4.8
2016: % boys aged 10-19 with obesity 1.7
2016: % girls aged 10-19 with obesity 2.8
2010: % adolescent boys insufficient physical activity 91.5
2010: % adolescent girls insufficient physical activity 88.8
2016: % women with obesity 13.0
Latest survey: % early initiation of breast-feeding 65.8
2020 estimate: % women smoking 4.2
Latest survey: % infants with stunting 40.0
Predicted 2030: % children aged 5-9 with obesity 9.5
Predicted 2030: % children aged 10-19 with obesity 6.2
Predicted 2030: number of children aged 5-9 with obesity 343,543
Predicted 2030: number of children aged 10-19 with obesity 370,439
Predicted 2030: number of children aged 5-19 with obesity 713,982
Zambia
Existence of any policies on marketing of foods to children, 2017
Existence of policies to reduce physical inactivity, 2017
Existence of policies to reduce unhealthy diet related to NCDs, 2017
CHO RISK SCORE 5/11
CHANCE OF MEETING WHO 2025 TARGET
1%

207Atlas of Childhood Obesity | Country Report Cards
Latest survey: % infants overweight 5.6
2016: % boys aged 5-9 with obesity 2.2
2016: % girls aged 5-9 with obesity 8.5
2016: % boys aged 10-19 with obesity 1
2016: % girls aged 10-19 with obesity 5.5
2010: % adolescent boys insufficient physical activity 85.5
2010: % adolescent girls insufficient physical activity 88.6
2016: % women with obesity 26.3
Latest survey: % early initiation of breast-feeding 57.7
2020 estimate: % women smoking 1.9
Latest survey: % infants with stunting 27.1
Predicted 2030: % children aged 5-9 with obesity 12.8
Predicted 2030: % children aged 10-19 with obesity 9.1
Predicted 2030: number of children aged 5-9 with obesity 290,595
Predicted 2030: number of children aged 10-19 with obesity 396,701
Predicted 2030: number of children aged 5-19 with obesity 687,296
Zimbabwe
Existence of any policies on marketing of foods to children, 2017
Existence of policies to reduce physical inactivity, 2017
Existence of policies to reduce unhealthy diet related to NCDs, 2017
CHO RISK SCORE 6/11
CHANCE OF MEETING WHO 2025 TARGET
1%

208Atlas of Childhood Obesity | Appendix
Appendix

CHO risk score Maximum score 11 (highest risk). Based on the first 11 indicators listed for each country, and scored 1.0 for ‘red’, 0.5 for ‘amber’ and 0.0 for ‘green’. Unmeasured indicators are assumed ‘amber’
Scored > 6.5 = ‘red’, 3-6.5 = ‘amber’, <3 = ‘green’
Probability of meeting WHO 2025 target (no increase on 2010-2012 levels)
Scored <40% = ‘red’, 40%-70% = ‘amber’, >70% = ‘green’
Latest survey: % infants overweight 2016: % boys and girls aged 5-9, 10-19, and 5-19 with obesity2016: % women with obesity 2016
Scored >15% = ‘red’, 5%-15% = ‘amber’, <5% = ‘green’
2010: % adolescent boys and girls, insufficient physical activity
Scored >70% = ‘red’, 30%-70% = ‘amber’, <30% = ‘green’
Latest survey: % early initiation of breast-feeding
Scored <50% = ‘red’, 50%-70% = ‘amber’, >70% = ‘green’
2020 estimate: % women tobacco smoking Scored >10% = ‘red’, 2%-10% = ‘amber’, <2% = ‘green’
Latest survey: % infants with stunting Scored >15% = ‘red’, 5%-15% = ‘amber’, <5% = ‘green’
Predicted 2030: % children aged 5-9 and aged 10-19 with obesity
Scored >15% = ‘red’, 5%-15% = ‘amber’, <5% = ‘green’
Predicted 2030: numbers of children with obesity, 5-9, 10-19, 5-19
Actual numbers, based on predicted prevalence and predicted population (World Bank). Not colour-coded
Existence of any policies on marketing of foods to children, 2017 Existence of policies to reduce physical inactivity, 2017 Existence of policies to reduce unhealthy diet related to NCDs, 2017
No = ‘red’, Yes = ‘green’
APPENDIX
Colour-coding Definitions
209Atlas of Childhood Obesity | Appendix
The figures for obesity prevalence are interpolated estimates calculated by the NCD Risk Factor Collaboration www.ncdrisc.org. For data based on measured surveys the World Obesity Federation provides interactive maps and downloadable graphics at our Global Obesity Observatory https://www.worldobesitydata.org/

CHO (Childhood Obesity) Risk Score Calculated by World Obesity Federation
Chance of meeting WHO 2025 target James Bentham, personal communication, projected from the NCD Risk Factor Collaboration Worldwide trends in body-mass index, underweight, overweight, and obesity from 1975 to 2016: a pooled analysis of 2416 population-based measurement studies in 128.9 million children, adolescents, and adults. Lancet 2017, 390:2627–2642
Latest survey: % infants overweight UNICEF 2019: https://data.unicef.org/wp-content/uploads/2018/05/Joint-Malnutrition-Estimates-Regional-and-Global-Estimates-March-2019.xlsx
2016: % boys aged 5-9 with obesity2016: % girls aged 5-9 with obesity2016: % boys aged 10-19 with obesity2016: % girls aged 10-19 with obesity2016: % women with obesity
NCD Risk Factor Collaboration. Worldwide trends in body-mass index, underweight, overweight, and obesity from 1975 to 2016: a pooled analysis of 2416 population-based measurement studies in 128.9 million children, adolescents, and adults. Lancet 2017, 390:2627–2642. Available at World Health Organization: Global Health Observatory
2010: % adolescent boys insufficient physical activity 2010: % adolescent girls insufficient physical activity
World Health Organization 2019: Global Health Observatory http://apps.who.int/gho/data/node.imr.NCD_PAC_ADO
Latest survey: % early initiation of breast-feeding World Health Organization 2019: Global Health Observatory http://apps.who.int/gho/data/node.imr.NUTRITION_570
2020 estimate: % women tobacco smoking World Health Organization 2019: Global Health Observatory http://apps.who.int/gho/data/view.main.1805
Latest survey: % infants with stunting UNICEF 2019: https://data.unicef.org/wp-content/uploads/2018/05/Joint-Malnutrition-Estimates-Regional-and-Global-Estimates-March-2019.xlsx
Predicted 2030: % children aged 5-9 with obesity Predicted 2030: % children aged 10-19 with obesity Predicted 2030: number of children aged 5-9 with obesity Predicted 2030: number of children aged 10-19 with obesityPredicted 2030: number of children aged 5-19 with obesity
James Bentham, personal communication, projected from the NCD Risk Factor Collaboration Worldwide trends in body-mass index, underweight, overweight, and obesity from 1975 to 2016: a pooled analysis of 2416 population-based measurement studies in 128.9 million children, adolescents, and adults. Lancet 2017, 390:2627–2642
Existence of any policies on marketing of foods to children, 2017
World Health Organization 2019: Global Health Observatory http://apps.who.int/gho/data/node.imr.NCD_CCS_Mkting
Existence of policies to reduce physical inactivity, 2017
World Health Organization 2019: Global Health Observatory http://apps.who.int/gho/data/node.imr.NCD_CCS_PAPlan
Existence of policies to reduce unhealthy diet related to NCDs, 2017
World Health Organization 2019: Global Health Observatory http://apps.who.int/gho/data/node.imr.NCD_CCS_DietPlan
APPENDIX
Data Sources
210Atlas of Childhood Obesity | Appendix

211Atlas of Childhood Obesity

World Obesity Federation Charles Darwin 2, 107 Gray’s Inn Road, London, WC1 X8TZ.
www.worldobesity.org
Designed by w
ww
.optimadesign.co.uk
Recommended