Dr. Symeon Christodoulou UNIVERSITY OF NICOSIA | NIREAS-IWRC
Assessment of telematics, their application and their potential at the Water Board of Nicosia
(AMR, PRV, WQS, PRESSURE LOGGERS)
Project co-funded by the European Union and NationalFunds of the participating countries

® Dr. Symeon Christodoulou University of Cyprus
Nireas International Water Research Center August 2020
Dr. Symeon Christodoulou 1 | P a g e University of Cyprus, NIREAS-IWRC
Terms of Reference
The Water Board of Nicosia (WBN), in its effort to improve the services it offers to its consumers and
the general public, wishes to be informed and consulted by the scientific community and water
management experts on the technological applications and innovations that could contribute to this
effort.
WBN, in the framework of its activities, assigned to the University of Cyprus’s Nireas International
Water Research Center (Nireas-IWRC) the provision of the following external expertise services for
the needs of the WATenERgy research program, in which WBN participates as a partner and
concerns the implementation of innovations in the water supply network. The program is co-
financed by the European Union and WBN.
• Evaluation / utilization of the following pilot telematics applications of WBN, for a period of
4 months:
o An AMR system of approximately 720 household and water-main hydrometers in
the community and in the industrial area of Ergates (Nicosia), and of 5 pressure
loggers.
o A small-scale hydroelectric power generation system in 5 network locations.
o A water-quality monitoring device in the network.
o A "Smart" pressure regulator in a water supply area near the University of Cyprus.
• Monitoring, in collaboration with WBN personnel, of the operation of the applications,
analysis of data received from these applications and evaluation of whether such
applications could help in the management of water supply systems, and informing WBN
accordingly of any required actions for proper management of the operation of the water
distribution system. It is noted that the systems have the ability to send an alarm/warning
for possible failures in term or deviations from set required parameters.
• Submitting suggestions for improvements that would help upgrade the applications.
• Recording of possible weaknesses / disadvantages of the applications.
• Reporting to WBN at the end of the reporting period.
• Preparation of scientific material on the findings from the evaluation of the said
applications, for the purpose of dissemination of the program, and presentation of such
material at a workshop / conference event that will be organized within the program.
It should be noted that all applications have already been completed and the collected data can be
monitored online. It is also noted that the related software applications can be parameterized by
WBN based on the needs they serve and can communicate messages to WBN for deviations from
the set operating parameters.

Dr. Symeon Christodoulou 2 | P a g e University of Cyprus, NIREAS-IWRC
Dr. Symeon Christodoulou 3 | P a g e University of Cyprus, NIREAS-IWRC
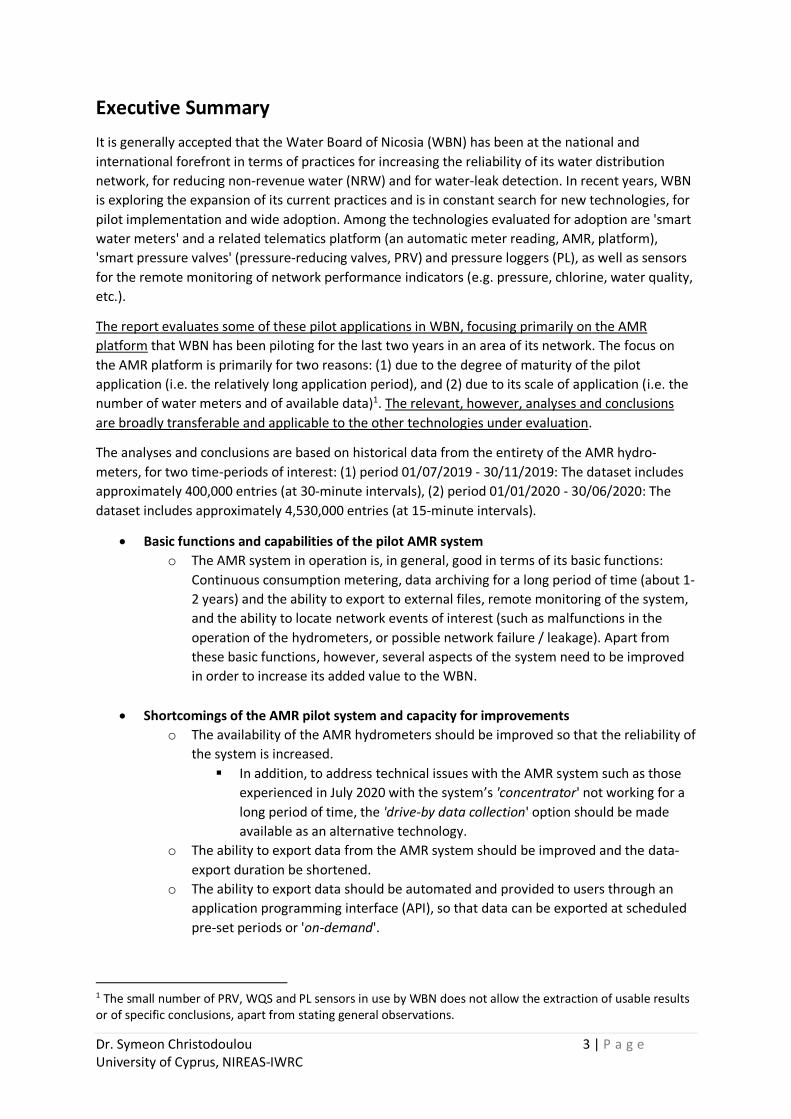
Executive Summary
It is generally accepted that the Water Board of Nicosia (WBN) has been at the national and
international forefront in terms of practices for increasing the reliability of its water distribution
network, for reducing non-revenue water (NRW) and for water-leak detection. In recent years, WBN
is exploring the expansion of its current practices and is in constant search for new technologies, for
pilot implementation and wide adoption. Among the technologies evaluated for adoption are 'smart
water meters' and a related telematics platform (an automatic meter reading, AMR, platform),
'smart pressure valves' (pressure-reducing valves, PRV) and pressure loggers (PL), as well as sensors
for the remote monitoring of network performance indicators (e.g. pressure, chlorine, water quality,
etc.).
The report evaluates some of these pilot applications in WBN, focusing primarily on the AMR
platform that WBN has been piloting for the last two years in an area of its network. The focus on
the AMR platform is primarily for two reasons: (1) due to the degree of maturity of the pilot
application (i.e. the relatively long application period), and (2) due to its scale of application (i.e. the
number of water meters and of available data)1. The relevant, however, analyses and conclusions
are broadly transferable and applicable to the other technologies under evaluation.
The analyses and conclusions are based on historical data from the entirety of the AMR hydro-
meters, for two time-periods of interest: (1) period 01/07/2019 - 30/11/2019: The dataset includes
approximately 400,000 entries (at 30-minute intervals), (2) period 01/01/2020 - 30/06/2020: The
dataset includes approximately 4,530,000 entries (at 15-minute intervals).
• Basic functions and capabilities of the pilot AMR system
o The AMR system in operation is, in general, good in terms of its basic functions:
Continuous consumption metering, data archiving for a long period of time (about 1-
2 years) and the ability to export to external files, remote monitoring of the system,
and the ability to locate network events of interest (such as malfunctions in the
operation of the hydrometers, or possible network failure / leakage). Apart from
these basic functions, however, several aspects of the system need to be improved
in order to increase its added value to the WBN.
• Shortcomings of the AMR pilot system and capacity for improvements
o The availability of the AMR hydrometers should be improved so that the reliability of
the system is increased.
▪ In addition, to address technical issues with the AMR system such as those
experienced in July 2020 with the system’s 'concentrator' not working for a
long period of time, the 'drive-by data collection' option should be made
available as an alternative technology.
o The ability to export data from the AMR system should be improved and the data-
export duration be shortened.
o The ability to export data should be automated and provided to users through an
application programming interface (API), so that data can be exported at scheduled
pre-set periods or 'on-demand'.
1 The small number of PRV, WQS and PL sensors in use by WBN does not allow the extraction of usable results or of specific conclusions, apart from stating general observations.
Dr. Symeon Christodoulou 4 | P a g e University of Cyprus, NIREAS-IWRC
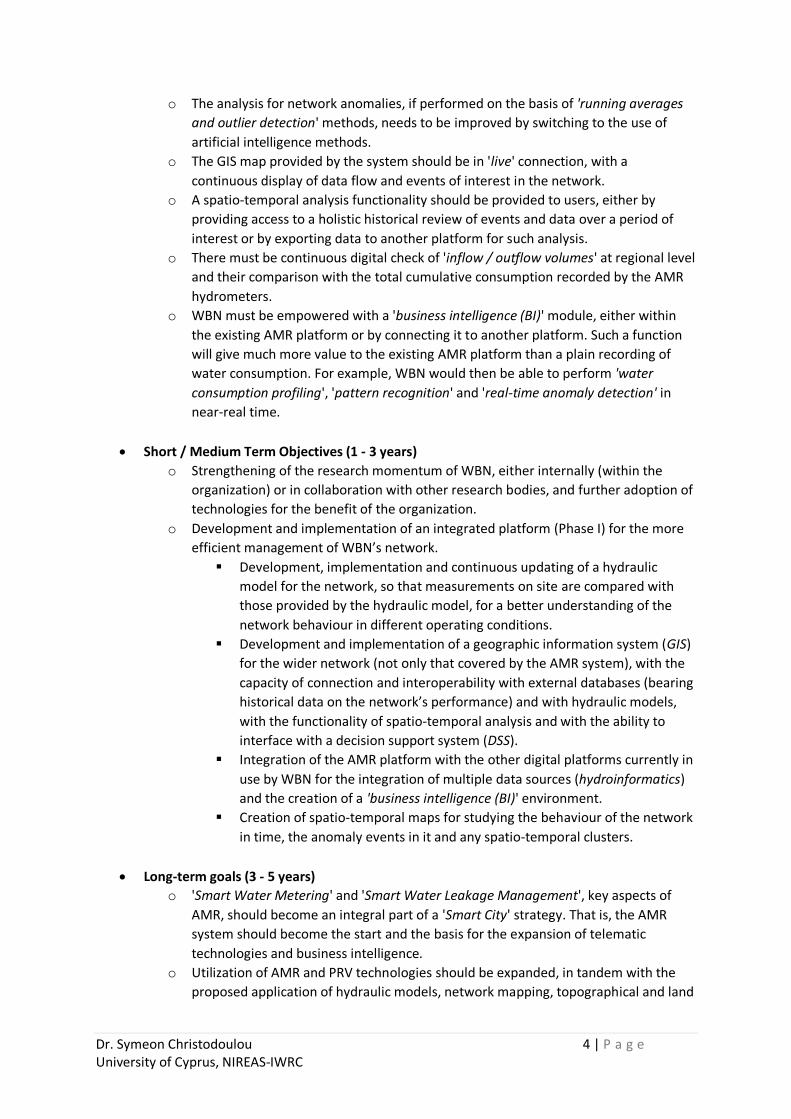
o The analysis for network anomalies, if performed on the basis of 'running averages
and outlier detection' methods, needs to be improved by switching to the use of
artificial intelligence methods.
o The GIS map provided by the system should be in 'live' connection, with a
continuous display of data flow and events of interest in the network.
o A spatio-temporal analysis functionality should be provided to users, either by
providing access to a holistic historical review of events and data over a period of
interest or by exporting data to another platform for such analysis.
o There must be continuous digital check of 'inflow / outflow volumes' at regional level
and their comparison with the total cumulative consumption recorded by the AMR
hydrometers.
o WBN must be empowered with a 'business intelligence (BI)' module, either within
the existing AMR platform or by connecting it to another platform. Such a function
will give much more value to the existing AMR platform than a plain recording of
water consumption. For example, WBN would then be able to perform 'water
consumption profiling', 'pattern recognition' and 'real-time anomaly detection' in
near-real time.
• Short / Medium Term Objectives (1 - 3 years)
o Strengthening of the research momentum of WBN, either internally (within the
organization) or in collaboration with other research bodies, and further adoption of
technologies for the benefit of the organization.
o Development and implementation of an integrated platform (Phase I) for the more
efficient management of WBN’s network.
▪ Development, implementation and continuous updating of a hydraulic
model for the network, so that measurements on site are compared with
those provided by the hydraulic model, for a better understanding of the
network behaviour in different operating conditions.
▪ Development and implementation of a geographic information system (GIS)
for the wider network (not only that covered by the AMR system), with the
capacity of connection and interoperability with external databases (bearing
historical data on the network’s performance) and with hydraulic models,
with the functionality of spatio-temporal analysis and with the ability to
interface with a decision support system (DSS).
▪ Integration of the AMR platform with the other digital platforms currently in
use by WBN for the integration of multiple data sources (hydroinformatics)
and the creation of a 'business intelligence (BI)' environment.
▪ Creation of spatio-temporal maps for studying the behaviour of the network
in time, the anomaly events in it and any spatio-temporal clusters.
• Long-term goals (3 - 5 years)
o 'Smart Water Metering' and 'Smart Water Leakage Management', key aspects of
AMR, should become an integral part of a 'Smart City' strategy. That is, the AMR
system should become the start and the basis for the expansion of telematic
technologies and business intelligence.
o Utilization of AMR and PRV technologies should be expanded, in tandem with the
proposed application of hydraulic models, network mapping, topographical and land
Dr. Symeon Christodoulou 5 | P a g e University of Cyprus, NIREAS-IWRC
use studies, and of an integrated DSS for the WBN to gain additional value through
'water-energy nexus'.
o Further development and implementation of an integrated platform (Phase II) for
the management of WBN’s distribution network.
▪ Interface / coupling of the AMR system and of other technologies under
development, with WBN’s existing SCADA system.
▪ DSS development with Data Analytics, Business Intelligence (BI) and Artificial
Intelligence (AI) capabilities.
▪ Integration of artificial intelligence in the platform (e.g. deep learning,
bagged trees, etc.)
▪ Development, through the knowledge acquired by the system, of
comprehensive network management practices and policies, and of the
various technologies in it. For example,
• How to increase the efficiency of the network (reduction of
operating costs, reduction of unpaid water and leaks, increase of
network efficiency, improvement of water quality, etc.)?
• What is the optimal water pressure / flow by for each section of the
network?
• What are the best sensor installation locations for optimized
network monitoring?
• How best to save / generate energy in the water distribution
network?
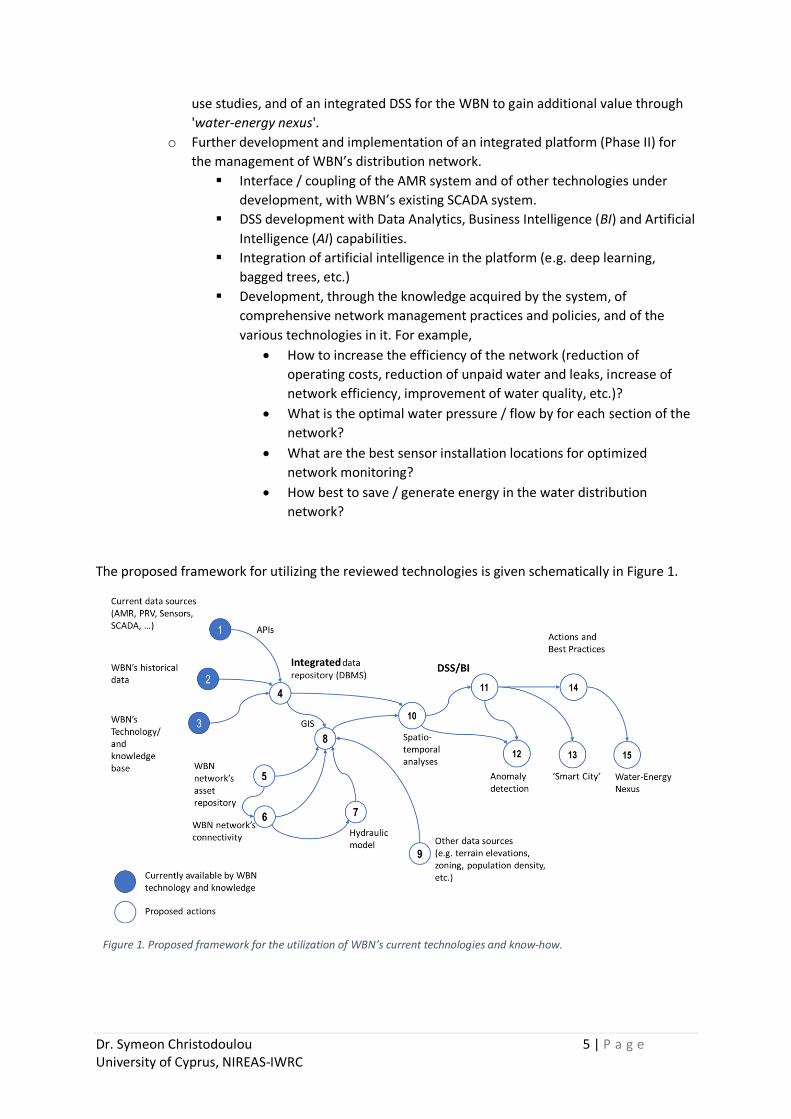
The proposed framework for utilizing the reviewed technologies is given schematically in Figure 1.
Figure 1. Proposed framework for the utilization of WBN’s current technologies and know-how.

Dr. Symeon Christodoulou 6 | P a g e University of Cyprus, NIREAS-IWRC

Dr. Symeon Christodoulou 7 | P a g e University of Cyprus, NIREAS-IWRC

Dr. Symeon Christodoulou 8 | P a g e University of Cyprus, NIREAS-IWRC
Dr. Symeon Christodoulou 9 | P a g e University of Cyprus, NIREAS-IWRC
Table of Contents
1 Introduction ............................................................................................................................ 17
2 The AMR pilot system operated by the Nicosia Water Supply Council (WBN) ........................... 18
2.1 General features and capabilities of the system ............................................................... 18
2.2 Preliminary analysis.......................................................................................................... 21
2.2.1 Period of July - November 2019 ................................................................................ 21
2.2.2 Period of January - June 2020 ................................................................................... 22
2.3 System features in need of improvement ......................................................................... 23
2.4 Indicative actions and proposed improvements in the functionality currently provided
provided by the pilot AMR system ............................................................................................... 25
3 Pressure-Reducing Valves (PRV) ............................................................................................... 33
3.1 General features and capabilities of the system ............................................................... 33
4 Water Quality Sensor (WQS) .................................................................................................... 35
4.1 General features and capabilities of the system ............................................................... 35
5 Pressure Loggers (PL) ............................................................................................................... 38
5.1 General features and capabilities of the system ............................................................... 38
6 Water-Energy Nexus and Related Potential .............................................................................. 41
6.1 Basic concepts .................................................................................................................. 41
6.2 Potential for utilization by WBN ....................................................................................... 43
6.3 The value of data, modeling, analysis and decision support systems................................. 44
Dr. Symeon Christodoulou 10 | P a g e University of Cyprus, NIREAS-IWRC
List of Figures
Figure 1. Proposed framework for the utilization of WBN’s current technologies and know-how. ...... 5
Figure 2. Home screen of the AMR software operated by WBN. ...................................................... 18
Figure 3. Per-hydrometer general picture of the AMR status. .......................................................... 19
Figure 4. Per-hydrometer charts and comparison of periods of interest. .......................................... 19
Figure 5. List of anomaly events in the network. .............................................................................. 20
Figure 6. Data export in CSV format. ................................................................................................ 20
Figure 7. Total water consumption per hydrometer (period 01.07.2019 - 30.11.2019). .................... 21
Figure 8. Number of hydrometers per number of 30-minute measurements (period 01.07.2019 -
30.11.2019). .................................................................................................................................... 22
Figure 9. Number of hydrometers per availability period (period 01.07.2019 - 30.11.2019). ............ 22
Figure 10. Number of hydrometers per number of 15-minute measurements (period 01.01.2020 -
30.06.2020). .................................................................................................................................... 23
Figure 11. Number of hydrometers per availability period (period 01.01.2020 - 30.06.2020). .......... 23
Figure 12. Hydrometer selection for data extraction to CSV file format............................................ 24
Figure 13. Data export and data mapping in GIS. ............................................................................. 25
Figure 14. Water-consumption time series (hydrometer 1030-007-7212) for the period 1/7/2019 -
30/11/2019 and 'moving-average-based anomaly detection'. .......................................................... 26
Figure 15. Water-consumption time series (hydrometer 1030-007-7212) for the period 1/7/2019 -
30/11/2019 and 'change-point anomaly detection'. ........................................................................ 27
Figure 16. Water-consumption time series (hydrometer 1030-007-7212) for the 1st period of interest
[13/7/2019 12:00, 17/7/2019 16:00]. .............................................................................................. 28
Figure 17. Water-consumption time series (hydrometer 1030-007-7212) for the 2nd period of
interest [28/9/2019 14:00, 19/10/2019 10:00]. ............................................................................... 29
Figure 18. Water-consumption time series (hydrometer 1030-007-7212) for the 3rd period of
interest [23/10/2019 14:00, 23/11/2019 20:00]. ............................................................................. 30
Figure 19. Spatio-temporal analysis of network failures (period 01.07.2019 - 30.11.2019). .............. 31
Figure 20. Typical PRV timeseries chart. ........................................................................................... 33
Figure 21. PRV system functionality for recording system alerts / errors. ......................................... 33
Figure 22. Ability to export PRV historical data. ............................................................................... 34
Figure 23. Water quality sensor (WQS) location and electronic monitoring system interface. .......... 35
Figure 24. Measurable WQS sensor parameters and their pre-set limits. ......................................... 35
Figure 25. Measurable WQS sensor parameters. ............................................................................. 36
Figure 26. Typical graph (time series) of WQS sensor. ...................................................................... 36
Figure 27. Available WQS graphing options...................................................................................... 37
Figure 28. Pressure loggers’ (PL) locations. ...................................................................................... 38
Figure 29. Digital interface of the pressure logger (PL) monitoring system. ...................................... 38
Figure 30. List of pressure loggers (PL) and most-recent data record. .............................................. 39
Figure 31. List of pressure logger alerts / errors (PL). ....................................................................... 39
Figure 32. System interface and data extraction of pressure loggers (PL). ........................................ 40
Figure 33. The water-energy nexus in traditional urban water distribution networks (Note: Purple
arrows indicate energy flow and blue arrows indicate water flow). ................................................. 41
Figure 34. Framework describing the changing nature of the water-energy nexus for typical urban
water supply networks, from the ‘energy for water’ perspective. .................................................... 42

Dr. Symeon Christodoulou 11 | P a g e University of Cyprus, NIREAS-IWRC

Dr. Symeon Christodoulou 12 | P a g e University of Cyprus, NIREAS-IWRC
List of Tables
Table 1. Objectives and possible actions of WBN in the context of the water-energy nexus. ............ 43
Table 2. Indicative actions to utilize the data of WBN. ..................................................................... 44
Dr. Symeon Christodoulou 13 | P a g e University of Cyprus, NIREAS-IWRC
Acronyms
AI Artificial Intelligence AMR Automatic Meter Reading API Application Programming Interface BI Business Intelligence CSV Comma Separated Values DSS Decision Support System GIS Geographic Information System NRW Non-Revenue Water PL Pressure Logger PRV Pressure Reducing Valve SCADA Supervisory Control And Data Acquisition UWSS Urban Water Supply System UWDN Urban Water Distribution Network WBN Water Board of Nicosia WQS Water Quality Sensor

Dr. Symeon Christodoulou 14 | P a g e University of Cyprus, NIREAS-IWRC

Dr. Symeon Christodoulou 15 | P a g e University of Cyprus, NIREAS-IWRC

Dr. Symeon Christodoulou 16 | P a g e University of Cyprus, NIREAS-IWRC
Dr. Symeon Christodoulou 17 | P a g e University of Cyprus, NIREAS-IWRC
1 Introduction
The Water Board of Nicosia (WBN) was founded in 1951 based on the ‘Law on Water Supply of
Municipalities and Other Areas, Chapter 350’, and its operation began in 1953.
Today, WBN supplies water to the Municipalities of Nicosia, Strovolos, Aglantzia, Engomi, Agios
Dometios, Latsia, Geri and Tseri, to the Community Councils of Ergates and the Settlement of
Anthoupolis and the Ergates’ industrial zone. Additionally, after a Government decision, the WBN
provides a volume of water to the occupied area of Nicosia. The main goal of WBN is to supply water
in a way that consistently satisfies its consumers both qualitatively and quantitatively.
In addition to the 1,400km of pipelines, WBN’s water supply system’s infrastructure includes water
reservoirs with a total capacity of approximately 77,250 m3 of water. This water capacity, coupled
with the water-related projects constructed by Cyprus's Water Development Department, has
significantly reduced the dependence of WBN on weather conditions. Further, the continuous
maintenance and improvements of the water distribution network and the intensive efforts by WBN
to monitor the supplies and hydrometers have reduced the amounts of water loss in the network to
22.20% (2019), with the aim of reducing them even more.
For better management, the network is divided into one hundred smaller districts which are
continuously being monitored by use of electronic stations and loggers. Further, the entire water
distribution network is constantly monitored by sixty-nine electronic stations and a supervisory
control and data acquisition (SCADA) system. These stations transmit information about the flow
and pressure at selected points of the network so that, with proper evaluation by WBN’s technical
staff, the proper decisions are made regarding the management of the network.
In addition, WBN has taken a number of steps to adopt new technologies such as 'smart water
meters' (AMR) and 'smart pressure valves' (PRV), and has participated in a number of nationally and
European-funded research projects through which it has upgraded its infrastructure and its know-
how in matters of priority to WBN.
Dr. Symeon Christodoulou 18 | P a g e University of Cyprus, NIREAS-IWRC
2 The AMR pilot system operated by the Nicosia Water Supply
Council (WBN)
The Nicosia Water Supply Council (WBN) has, for the last two years, been operating a pilot telematic
system of automatic and remote recording of water consumption (automatic meter reading, AMR),
with main characteristics as listed below.
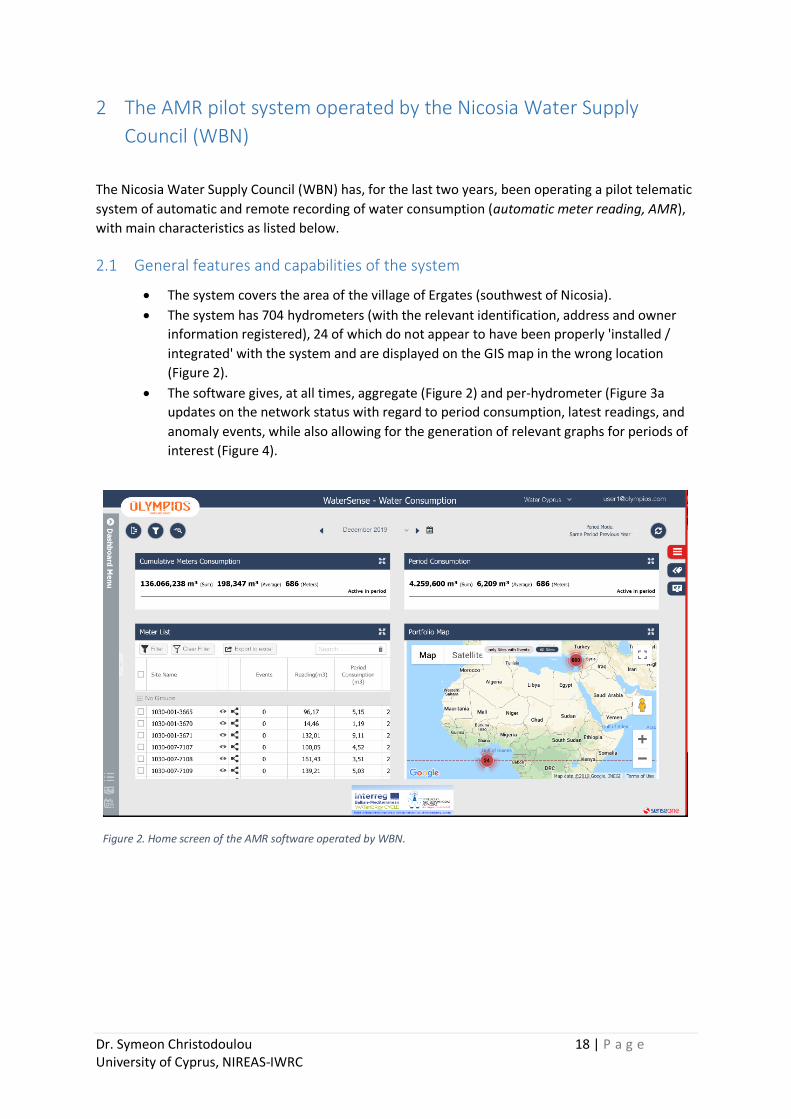
2.1 General features and capabilities of the system
• The system covers the area of the village of Ergates (southwest of Nicosia).
• The system has 704 hydrometers (with the relevant identification, address and owner
information registered), 24 of which do not appear to have been properly 'installed /
integrated' with the system and are displayed on the GIS map in the wrong location
(Figure 2).
• The software gives, at all times, aggregate (Figure 2) and per-hydrometer (Figure 3a
updates on the network status with regard to period consumption, latest readings, and
anomaly events, while also allowing for the generation of relevant graphs for periods of
interest (Figure 4).
Figure 2. Home screen of the AMR software operated by WBN.
Dr. Symeon Christodoulou 19 | P a g e University of Cyprus, NIREAS-IWRC
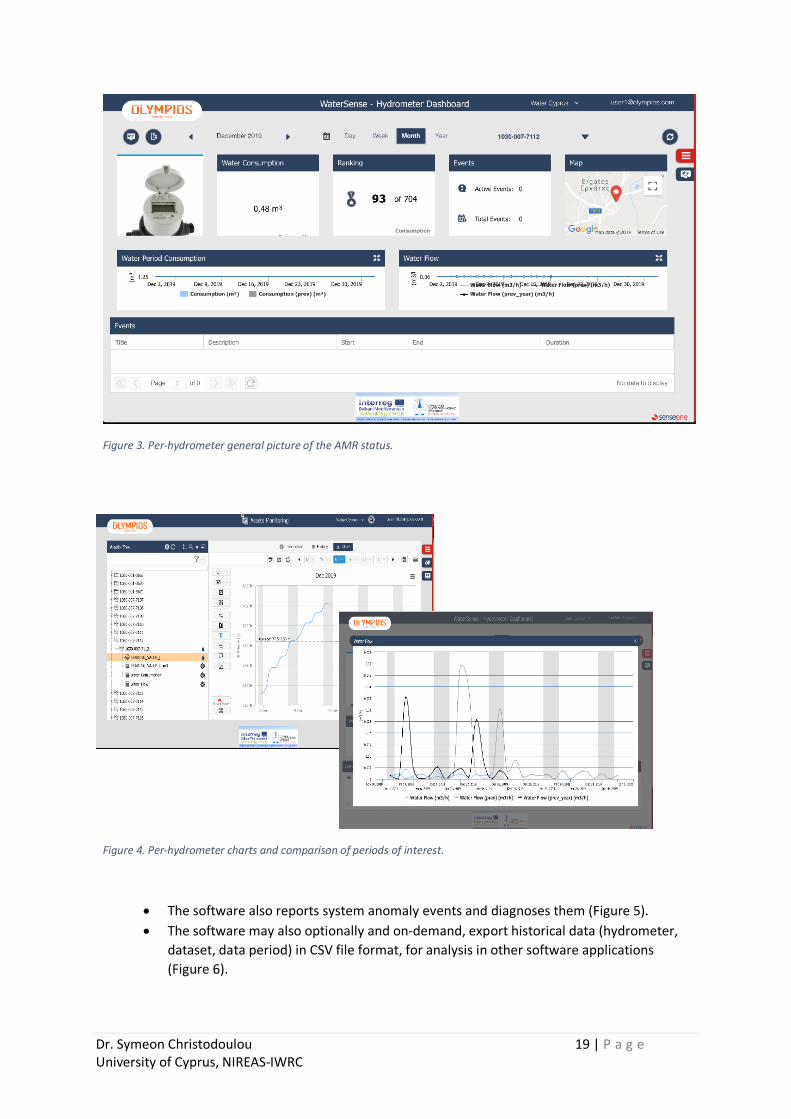
Figure 3. Per-hydrometer general picture of the AMR status.
Figure 4. Per-hydrometer charts and comparison of periods of interest.
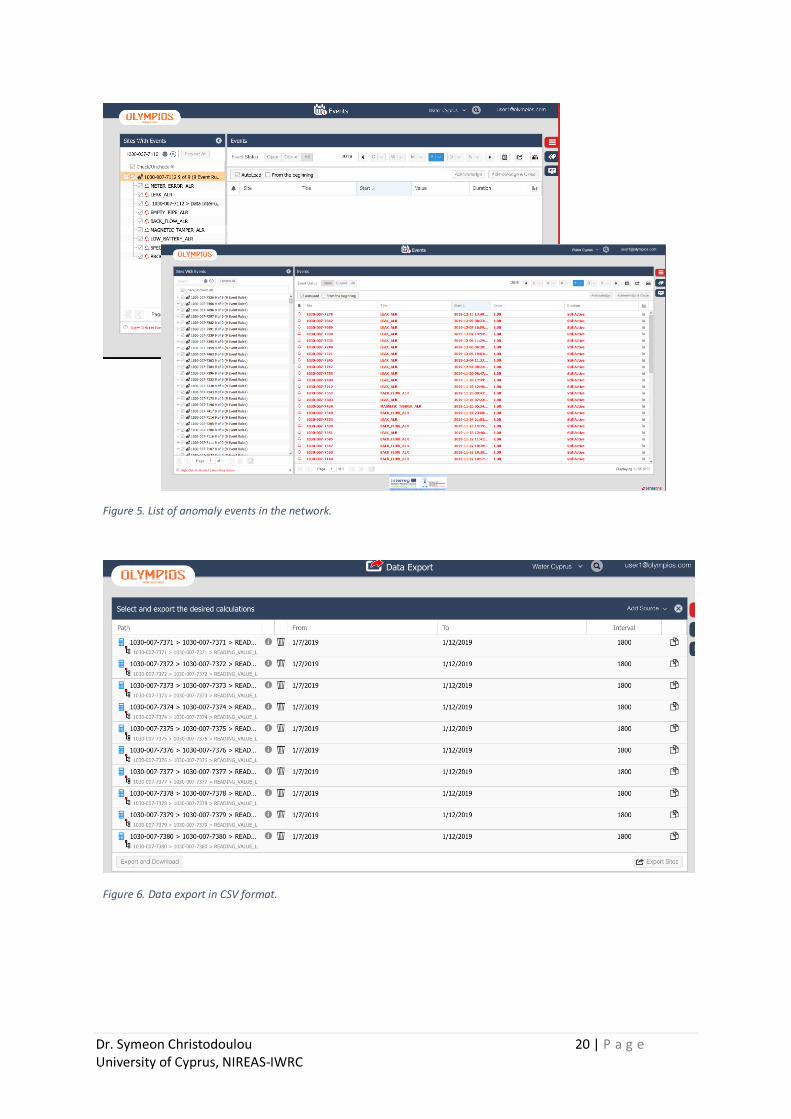
• The software also reports system anomaly events and diagnoses them (Figure 5).
• The software may also optionally and on-demand, export historical data (hydrometer,
dataset, data period) in CSV file format, for analysis in other software applications
(Figure 6).
Dr. Symeon Christodoulou 20 | P a g e University of Cyprus, NIREAS-IWRC
Figure 5. List of anomaly events in the network.
Figure 6. Data export in CSV format.
Dr. Symeon Christodoulou 21 | P a g e University of Cyprus, NIREAS-IWRC
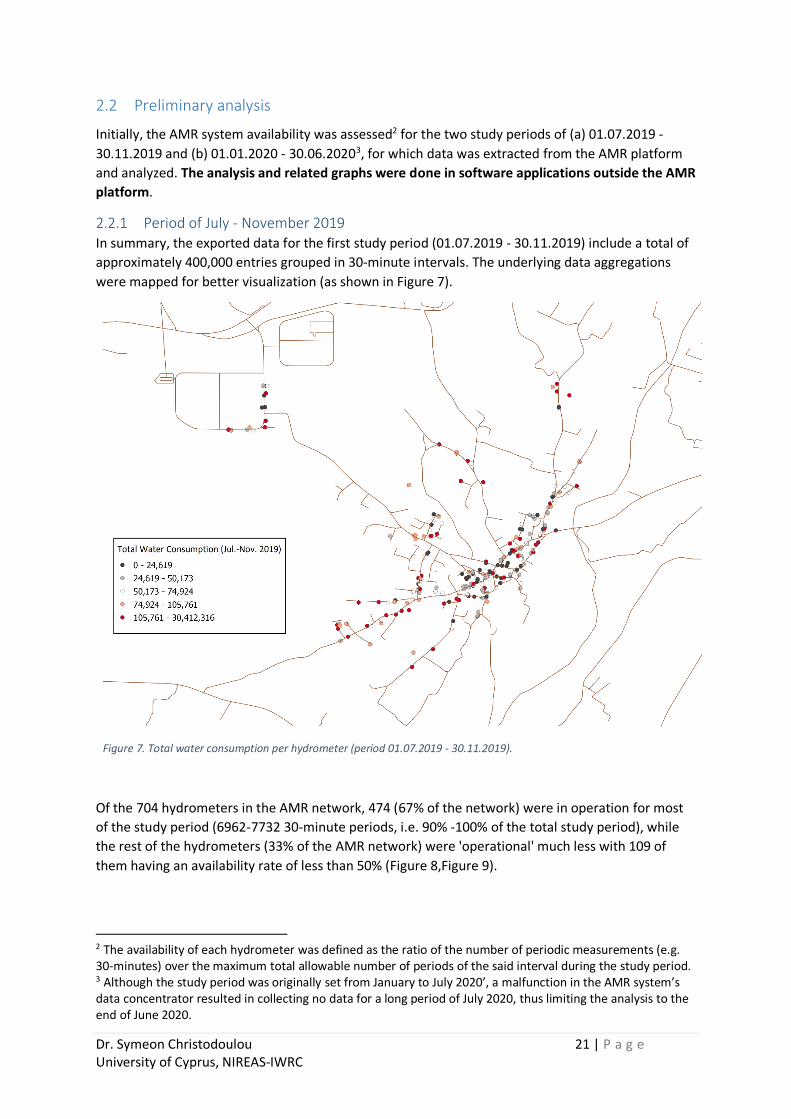
2.2 Preliminary analysis
Initially, the AMR system availability was assessed2 for the two study periods of (a) 01.07.2019 -
30.11.2019 and (b) 01.01.2020 - 30.06.20203, for which data was extracted from the AMR platform
and analyzed. The analysis and related graphs were done in software applications outside the AMR
platform.
2.2.1 Period of July - November 2019 In summary, the exported data for the first study period (01.07.2019 - 30.11.2019) include a total of
approximately 400,000 entries grouped in 30-minute intervals. The underlying data aggregations
were mapped for better visualization (as shown in Figure 7).
Figure 7. Total water consumption per hydrometer (period 01.07.2019 - 30.11.2019).
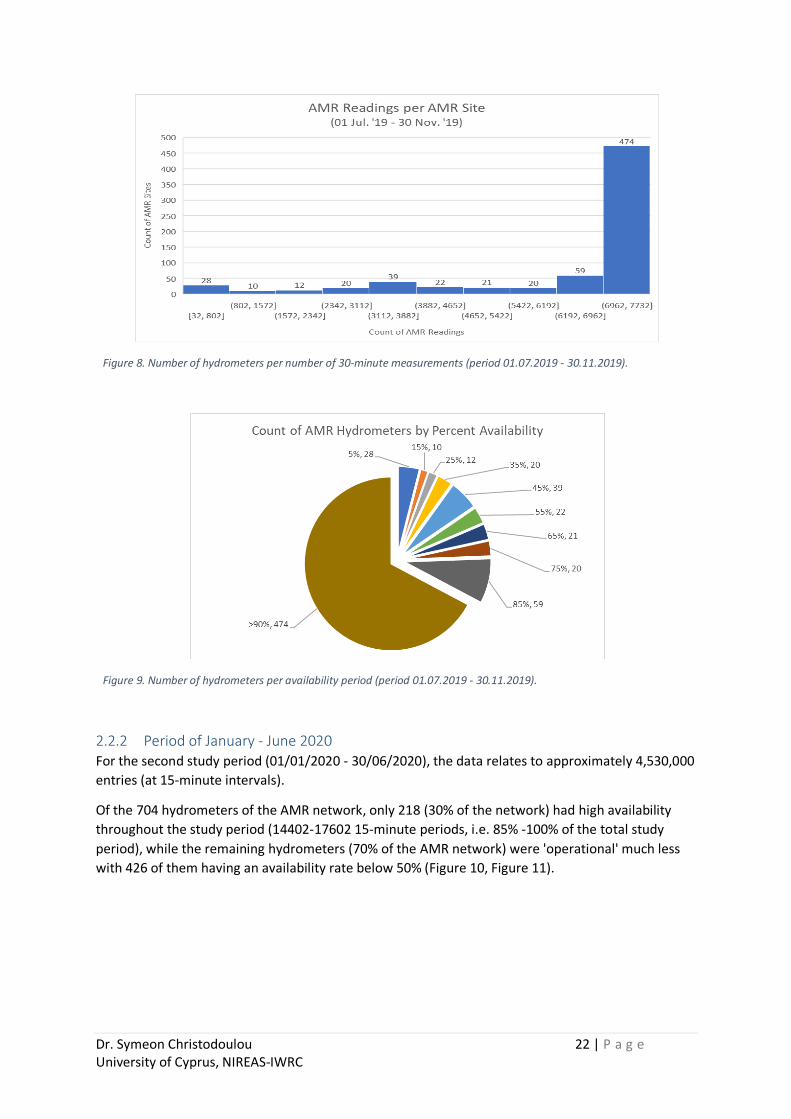
Of the 704 hydrometers in the AMR network, 474 (67% of the network) were in operation for most
of the study period (6962-7732 30-minute periods, i.e. 90% -100% of the total study period), while
the rest of the hydrometers (33% of the AMR network) were 'operational' much less with 109 of
them having an availability rate of less than 50% (Figure 8,Figure 9).
2 The availability of each hydrometer was defined as the ratio of the number of periodic measurements (e.g. 30-minutes) over the maximum total allowable number of periods of the said interval during the study period. 3 Although the study period was originally set from January to July 2020’, a malfunction in the AMR system’s data concentrator resulted in collecting no data for a long period of July 2020, thus limiting the analysis to the end of June 2020.
Dr. Symeon Christodoulou 22 | P a g e University of Cyprus, NIREAS-IWRC
Figure 8. Number of hydrometers per number of 30-minute measurements (period 01.07.2019 - 30.11.2019).
Figure 9. Number of hydrometers per availability period (period 01.07.2019 - 30.11.2019).
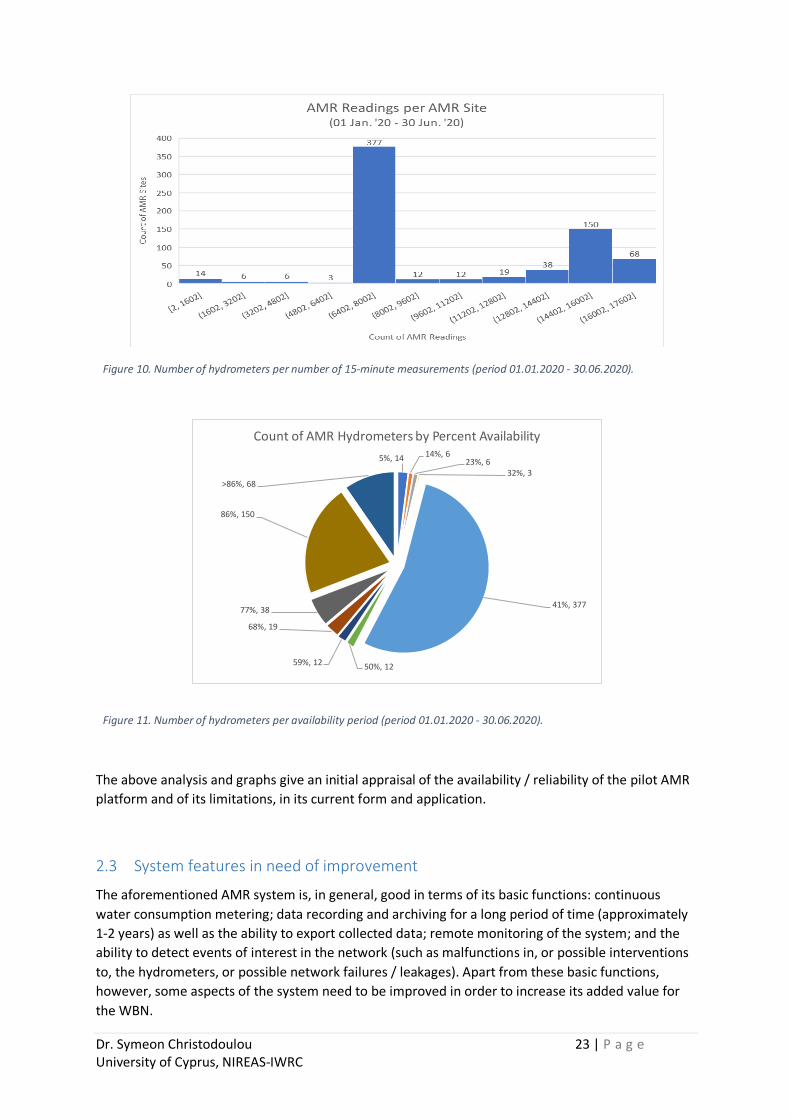
2.2.2 Period of January - June 2020 For the second study period (01/01/2020 - 30/06/2020), the data relates to approximately 4,530,000
entries (at 15-minute intervals).
Of the 704 hydrometers of the AMR network, only 218 (30% of the network) had high availability
throughout the study period (14402-17602 15-minute periods, i.e. 85% -100% of the total study
period), while the remaining hydrometers (70% of the AMR network) were 'operational' much less
with 426 of them having an availability rate below 50% (Figure 10, Figure 11).
Dr. Symeon Christodoulou 23 | P a g e University of Cyprus, NIREAS-IWRC
Figure 10. Number of hydrometers per number of 15-minute measurements (period 01.01.2020 - 30.06.2020).
Figure 11. Number of hydrometers per availability period (period 01.01.2020 - 30.06.2020).
The above analysis and graphs give an initial appraisal of the availability / reliability of the pilot AMR
platform and of its limitations, in its current form and application.
2.3 System features in need of improvement
The aforementioned AMR system is, in general, good in terms of its basic functions: continuous
water consumption metering; data recording and archiving for a long period of time (approximately
1-2 years) as well as the ability to export collected data; remote monitoring of the system; and the
ability to detect events of interest in the network (such as malfunctions in, or possible interventions
to, the hydrometers, or possible network failures / leakages). Apart from these basic functions,
however, some aspects of the system need to be improved in order to increase its added value for
the WBN.
5%, 14 14%, 623%, 6
32%, 3
41%, 377
50%, 1259%, 12
68%, 19
77%, 38
86%, 150
>86%, 68
Count of AMR Hydrometers by Percent Availability
Dr. Symeon Christodoulou 24 | P a g e University of Cyprus, NIREAS-IWRC
Indicatively, and based on the experiences to date of using the platform for the two study periods:
• The availability of AMR hydrometers should be increased in order to increase the
reliability of the system (Figure 9).
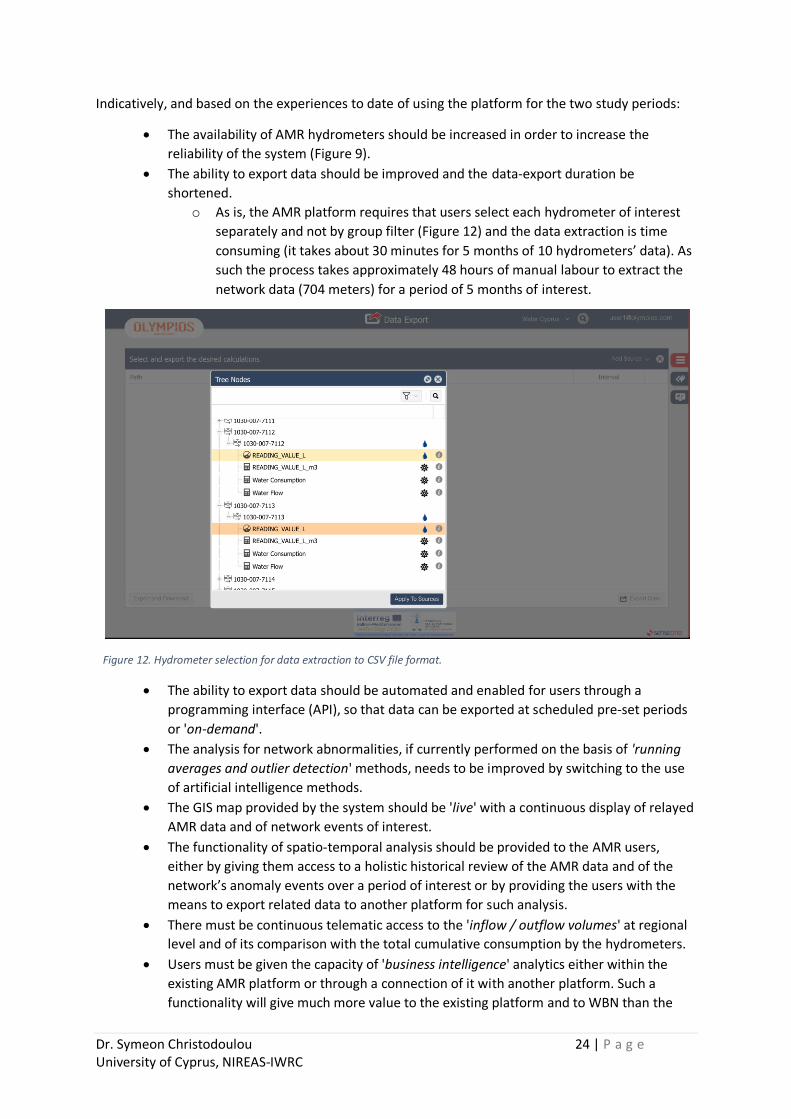
• The ability to export data should be improved and the data-export duration be
shortened.
o As is, the AMR platform requires that users select each hydrometer of interest
separately and not by group filter (Figure 12) and the data extraction is time
consuming (it takes about 30 minutes for 5 months of 10 hydrometers’ data). As
such the process takes approximately 48 hours of manual labour to extract the
network data (704 meters) for a period of 5 months of interest.
Figure 12. Hydrometer selection for data extraction to CSV file format.
• The ability to export data should be automated and enabled for users through a
programming interface (API), so that data can be exported at scheduled pre-set periods
or 'on-demand'.
• The analysis for network abnormalities, if currently performed on the basis of 'running
averages and outlier detection' methods, needs to be improved by switching to the use
of artificial intelligence methods.
• The GIS map provided by the system should be 'live' with a continuous display of relayed
AMR data and of network events of interest.
• The functionality of spatio-temporal analysis should be provided to the AMR users,
either by giving them access to a holistic historical review of the AMR data and of the
network’s anomaly events over a period of interest or by providing the users with the
means to export related data to another platform for such analysis.
• There must be continuous telematic access to the 'inflow / outflow volumes' at regional
level and of its comparison with the total cumulative consumption by the hydrometers.
• Users must be given the capacity of 'business intelligence' analytics either within the
existing AMR platform or through a connection of it with another platform. Such a
functionality will give much more value to the existing platform and to WBN than the
Dr. Symeon Christodoulou 25 | P a g e University of Cyprus, NIREAS-IWRC
current plain recording of water consumption. For example, 'water-consumption
profiling', 'pattern recognition' and 'real-time anomaly detection' could be performed.
2.4 Indicative actions and proposed improvements in the functionality currently
provided by the pilot AMR system
Below are indicative actions taken during the course of this evaluation project to highlight additional
features that can complement those of the existing AMR system:
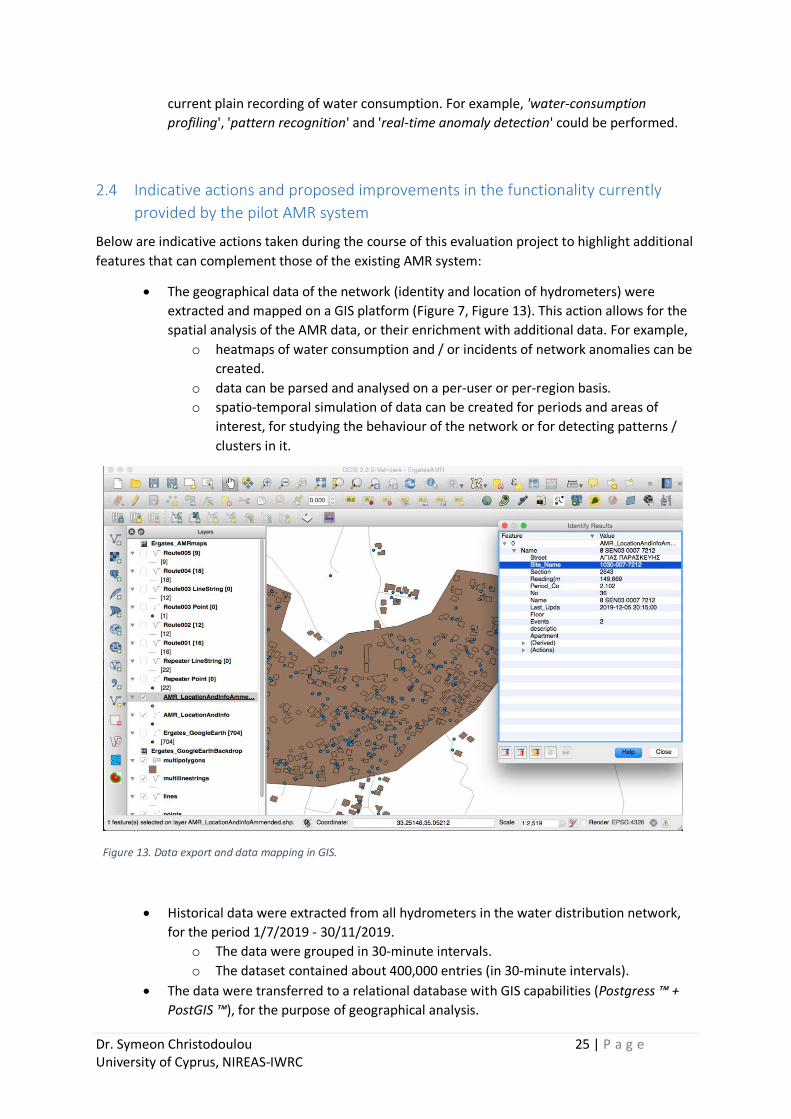
• The geographical data of the network (identity and location of hydrometers) were
extracted and mapped on a GIS platform (Figure 7, Figure 13). This action allows for the
spatial analysis of the AMR data, or their enrichment with additional data. For example,
o heatmaps of water consumption and / or incidents of network anomalies can be
created.
o data can be parsed and analysed on a per-user or per-region basis.
o spatio-temporal simulation of data can be created for periods and areas of
interest, for studying the behaviour of the network or for detecting patterns /
clusters in it.
Figure 13. Data export and data mapping in GIS.
• Historical data were extracted from all hydrometers in the water distribution network,
for the period 1/7/2019 - 30/11/2019.
o The data were grouped in 30-minute intervals.
o The dataset contained about 400,000 entries (in 30-minute intervals).
• The data were transferred to a relational database with GIS capabilities (Postgress ™ +
PostGIS ™), for the purpose of geographical analysis.
Dr. Symeon Christodoulou 26 | P a g e University of Cyprus, NIREAS-IWRC
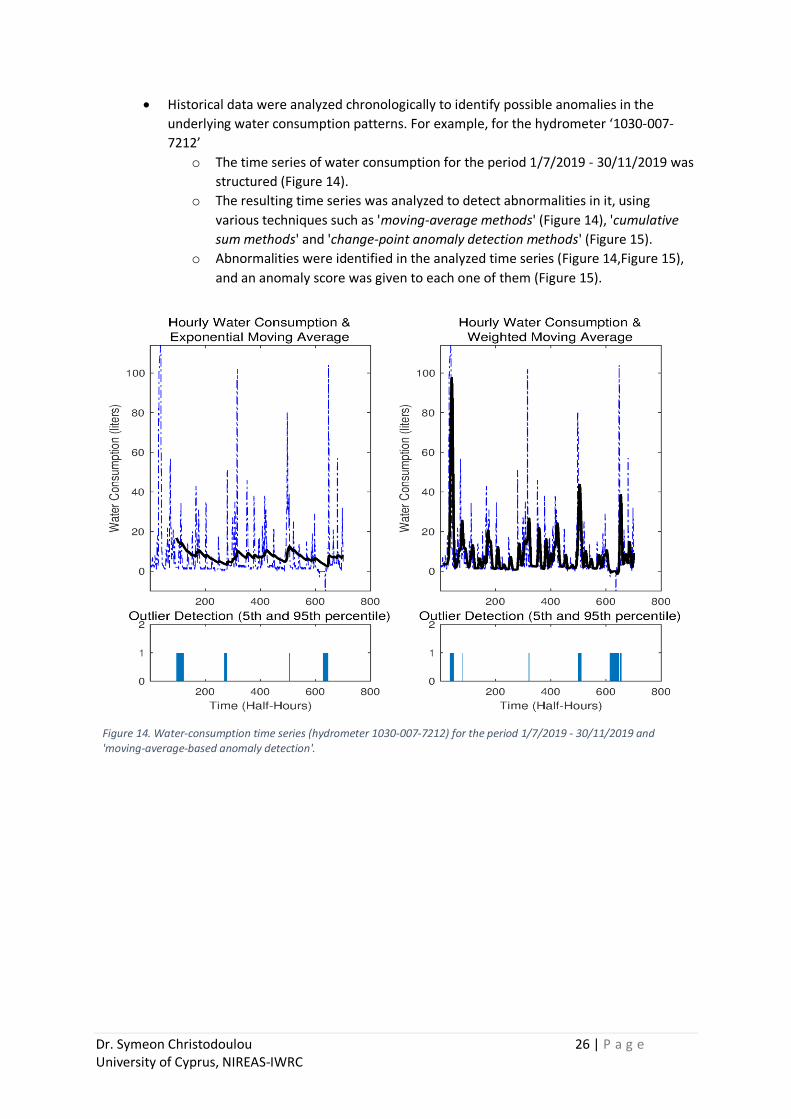
• Historical data were analyzed chronologically to identify possible anomalies in the
underlying water consumption patterns. For example, for the hydrometer ‘1030-007-
7212’
o The time series of water consumption for the period 1/7/2019 - 30/11/2019 was
structured (Figure 14).
o The resulting time series was analyzed to detect abnormalities in it, using
various techniques such as 'moving-average methods' (Figure 14), 'cumulative
sum methods' and 'change-point anomaly detection methods' (Figure 15).
o Abnormalities were identified in the analyzed time series (Figure 14,Figure 15),
and an anomaly score was given to each one of them (Figure 15).
Figure 14. Water-consumption time series (hydrometer 1030-007-7212) for the period 1/7/2019 - 30/11/2019 and 'moving-average-based anomaly detection'.
Dr. Symeon Christodoulou 27 | P a g e University of Cyprus, NIREAS-IWRC
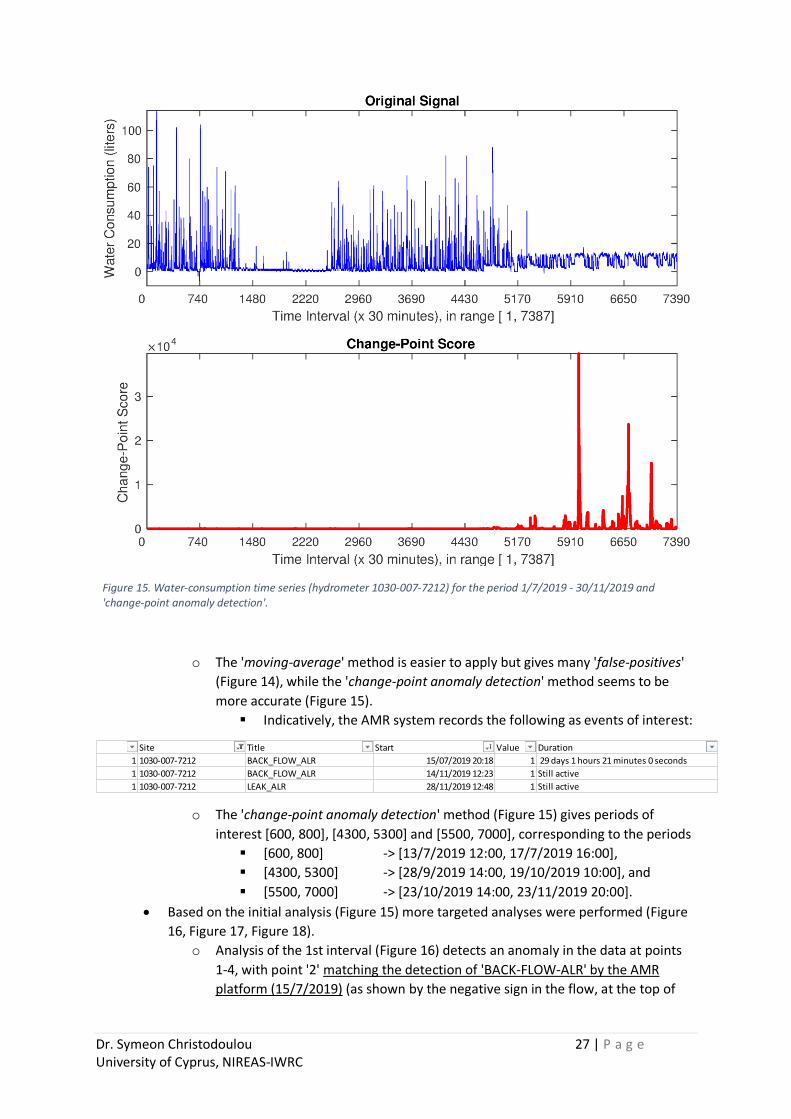
Figure 15. Water-consumption time series (hydrometer 1030-007-7212) for the period 1/7/2019 - 30/11/2019 and 'change-point anomaly detection'.
o The 'moving-average' method is easier to apply but gives many 'false-positives'
(Figure 14), while the 'change-point anomaly detection' method seems to be
more accurate (Figure 15).
▪ Indicatively, the AMR system records the following as events of interest:
o The 'change-point anomaly detection' method (Figure 15) gives periods of
interest [600, 800], [4300, 5300] and [5500, 7000], corresponding to the periods
▪ [600, 800] -> [13/7/2019 12:00, 17/7/2019 16:00],
▪ [4300, 5300] -> [28/9/2019 14:00, 19/10/2019 10:00], and
▪ [5500, 7000] -> [23/10/2019 14:00, 23/11/2019 20:00].
• Based on the initial analysis (Figure 15) more targeted analyses were performed (Figure
16, Figure 17, Figure 18).
o Analysis of the 1st interval (Figure 16) detects an anomaly in the data at points
1-4, with point '2' matching the detection of 'BACK-FLOW-ALR' by the AMR
platform (15/7/2019) (as shown by the negative sign in the flow, at the top of
Site Title Start Value Duration
1 1030-007-7212 BACK_FLOW_ALR 15/07/2019 20:18 1 29 days 1 hours 21 minutes 0 seconds
1 1030-007-7212 BACK_FLOW_ALR 14/11/2019 12:23 1 Still active
1 1030-007-7212 LEAK_ALR 28/11/2019 12:48 1 Still active
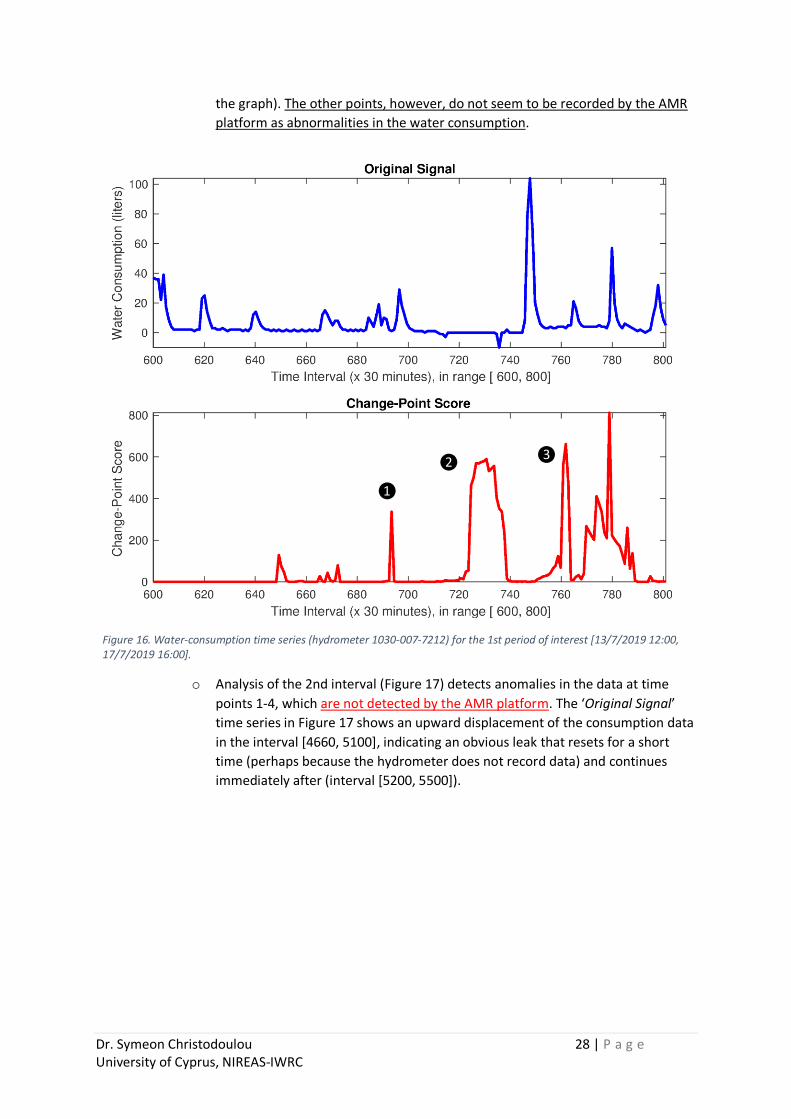
Dr. Symeon Christodoulou 28 | P a g e University of Cyprus, NIREAS-IWRC
the graph). The other points, however, do not seem to be recorded by the AMR
platform as abnormalities in the water consumption.
Figure 16. Water-consumption time series (hydrometer 1030-007-7212) for the 1st period of interest [13/7/2019 12:00, 17/7/2019 16:00].
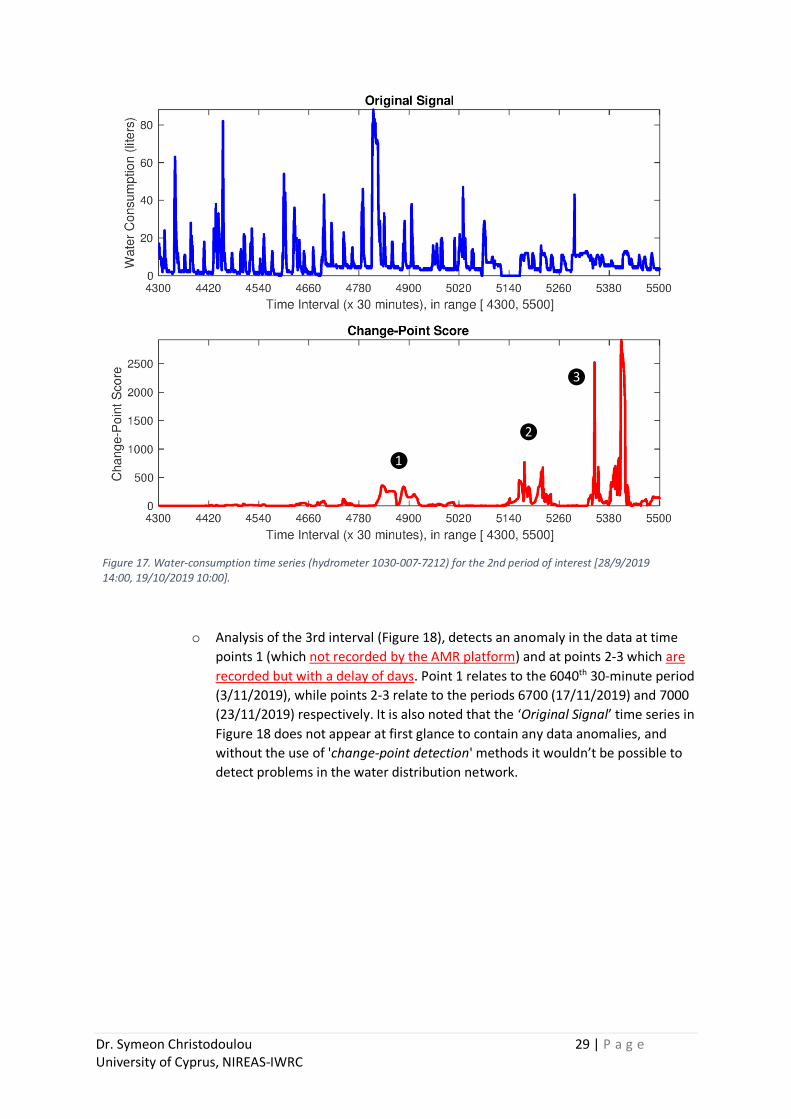
o Analysis of the 2nd interval (Figure 17) detects anomalies in the data at time
points 1-4, which are not detected by the AMR platform. The ‘Original Signal’
time series in Figure 17 shows an upward displacement of the consumption data
in the interval [4660, 5100], indicating an obvious leak that resets for a short
time (perhaps because the hydrometer does not record data) and continues
immediately after (interval [5200, 5500]).
❶
❷ ❸
Dr. Symeon Christodoulou 29 | P a g e University of Cyprus, NIREAS-IWRC
Figure 17. Water-consumption time series (hydrometer 1030-007-7212) for the 2nd period of interest [28/9/2019 14:00, 19/10/2019 10:00].
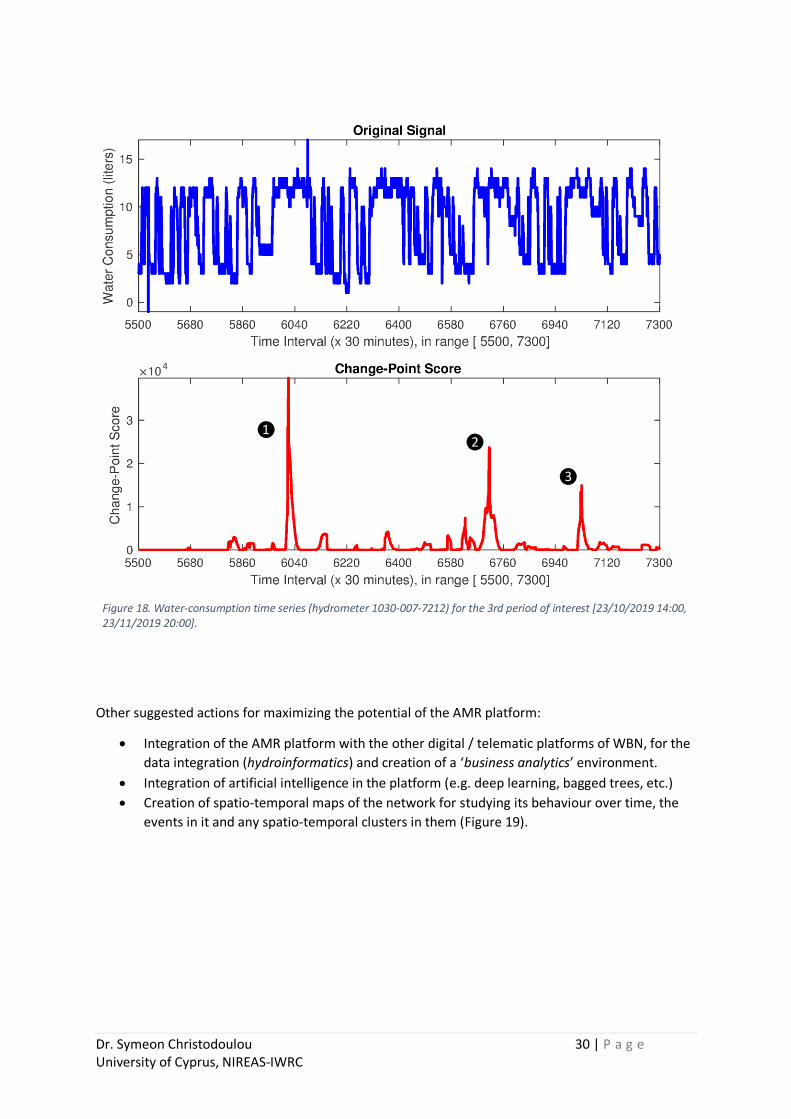
o Analysis of the 3rd interval (Figure 18), detects an anomaly in the data at time
points 1 (which not recorded by the AMR platform) and at points 2-3 which are
recorded but with a delay of days. Point 1 relates to the 6040th 30-minute period
(3/11/2019), while points 2-3 relate to the periods 6700 (17/11/2019) and 7000
(23/11/2019) respectively. It is also noted that the ‘Original Signal’ time series in
Figure 18 does not appear at first glance to contain any data anomalies, and
without the use of 'change-point detection' methods it wouldn’t be possible to
detect problems in the water distribution network.
❶
❷
❸
Dr. Symeon Christodoulou 30 | P a g e University of Cyprus, NIREAS-IWRC
Figure 18. Water-consumption time series (hydrometer 1030-007-7212) for the 3rd period of interest [23/10/2019 14:00, 23/11/2019 20:00].
Other suggested actions for maximizing the potential of the AMR platform:
• Integration of the AMR platform with the other digital / telematic platforms of WBN, for the
data integration (hydroinformatics) and creation of a ‘business analytics’ environment.
• Integration of artificial intelligence in the platform (e.g. deep learning, bagged trees, etc.)
• Creation of spatio-temporal maps of the network for studying its behaviour over time, the
events in it and any spatio-temporal clusters in them (Figure 19).
❶ ❷
❸
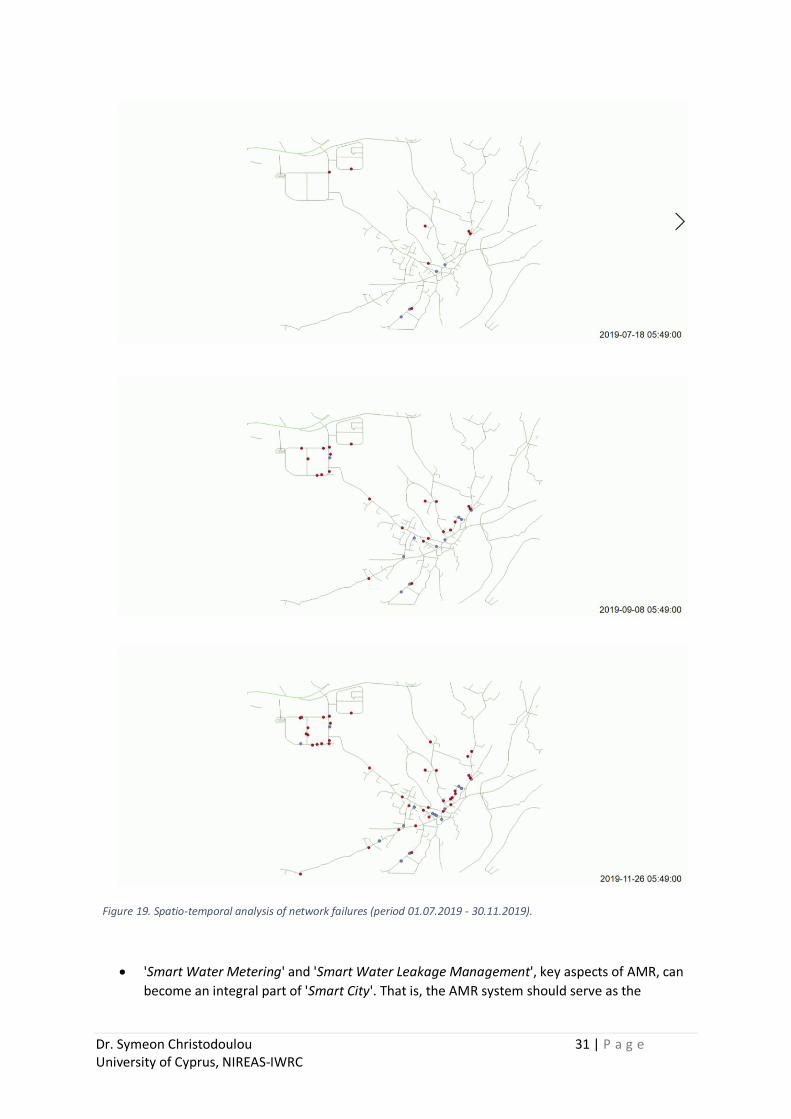
Dr. Symeon Christodoulou 31 | P a g e University of Cyprus, NIREAS-IWRC
Figure 19. Spatio-temporal analysis of network failures (period 01.07.2019 - 30.11.2019).
• 'Smart Water Metering' and 'Smart Water Leakage Management', key aspects of AMR, can
become an integral part of 'Smart City'. That is, the AMR system should serve as the
Dr. Symeon Christodoulou 32 | P a g e University of Cyprus, NIREAS-IWRC
beginning and the basis for the expansion of telematic and remote management
technologies and of business intelligence for the entire city.
• Utilization of AMR and PRV technologies should be expanded, in tandem with the proposed
application of hydraulic models, network mapping, topographical and land use studies, and
of an integrated DSS for the WBN to gain additional value through a 'water-energy nexus'. A
more detailed report on the specific potential and possibilities is given in Chapter 6 (p. 41).
Dr. Symeon Christodoulou 33 | P a g e University of Cyprus, NIREAS-IWRC
3 Pressure-Reducing Valves (PRV)
3.1 General features and capabilities of the system
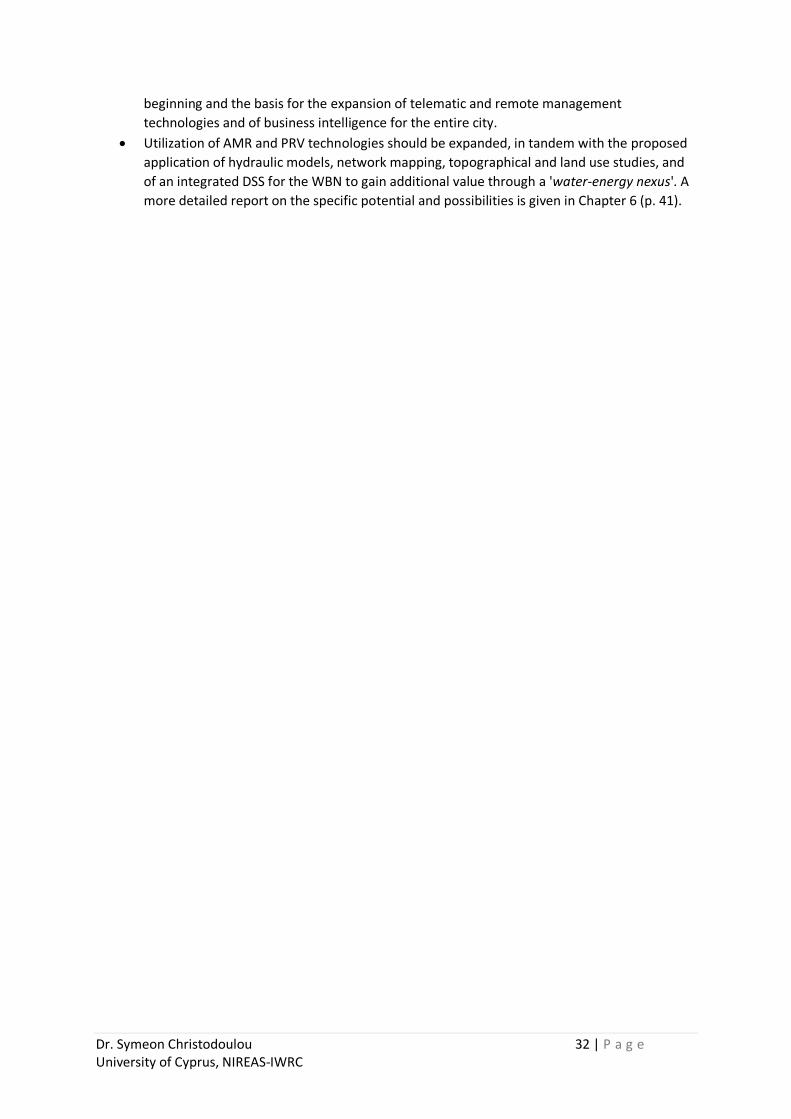
Currently, WBN operates only one ‘smart’ PRV, in the vicinity of the University of Cyprus’s campus
(in Aglantzia). The telematic platform for remotely monitoring the valve enables the WBN to capture
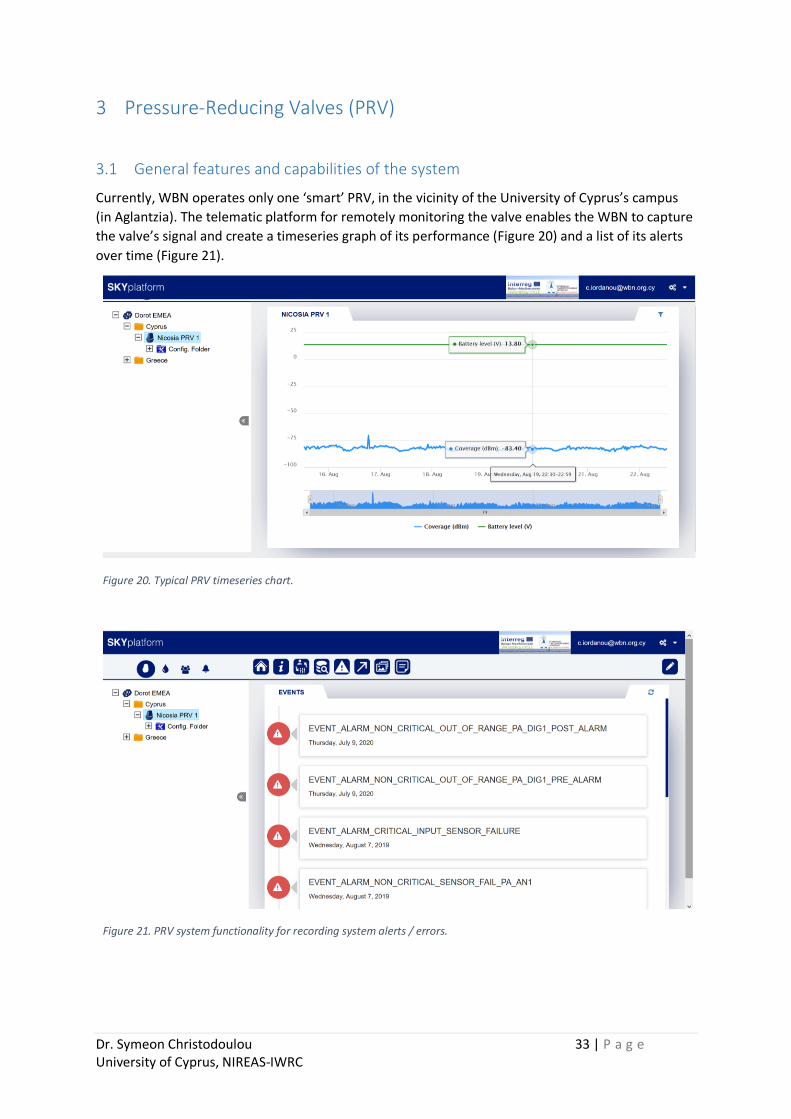
the valve’s signal and create a timeseries graph of its performance (Figure 20) and a list of its alerts
over time (Figure 21).
Figure 20. Typical PRV timeseries chart.
Figure 21. PRV system functionality for recording system alerts / errors.
Dr. Symeon Christodoulou 34 | P a g e University of Cyprus, NIREAS-IWRC
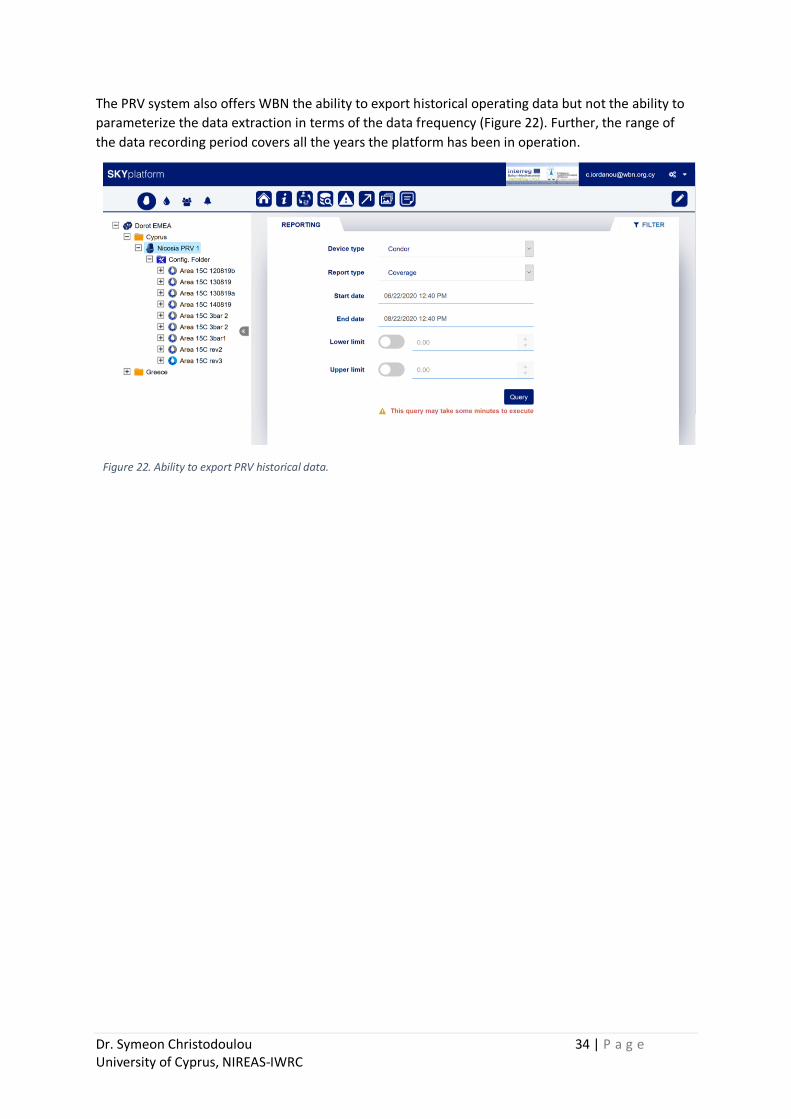
The PRV system also offers WBN the ability to export historical operating data but not the ability to
parameterize the data extraction in terms of the data frequency (Figure 22). Further, the range of
the data recording period covers all the years the platform has been in operation.
Figure 22. Ability to export PRV historical data.
Dr. Symeon Christodoulou 35 | P a g e University of Cyprus, NIREAS-IWRC
4 Water Quality Sensor (WQS)
4.1 General features and capabilities of the system
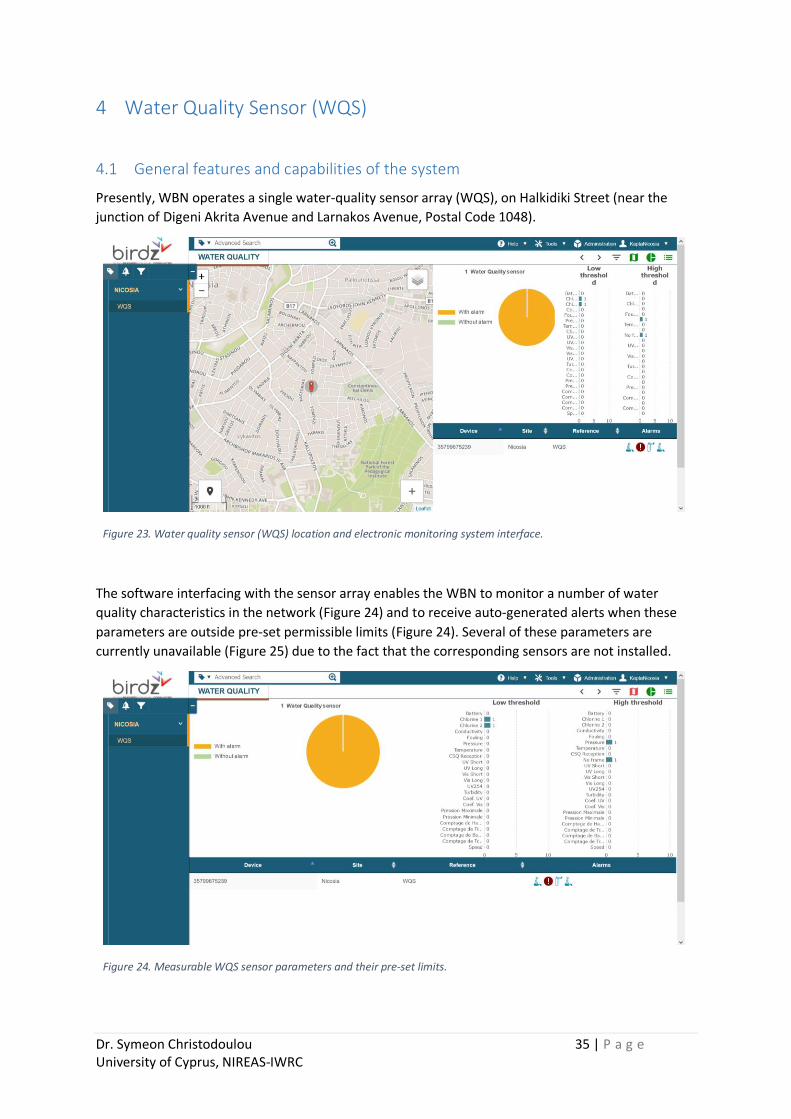
Presently, WBN operates a single water-quality sensor array (WQS), on Halkidiki Street (near the
junction of Digeni Akrita Avenue and Larnakos Avenue, Postal Code 1048).
Figure 23. Water quality sensor (WQS) location and electronic monitoring system interface.
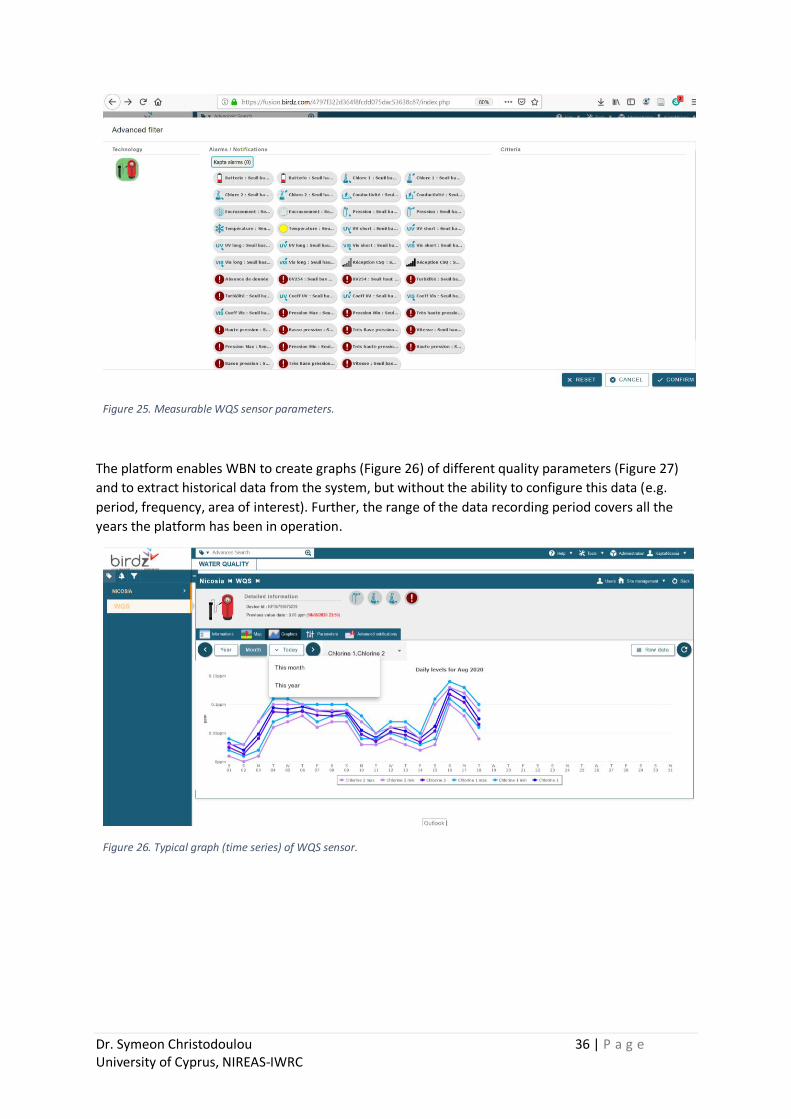
The software interfacing with the sensor array enables the WBN to monitor a number of water
quality characteristics in the network (Figure 24) and to receive auto-generated alerts when these
parameters are outside pre-set permissible limits (Figure 24). Several of these parameters are
currently unavailable (Figure 25) due to the fact that the corresponding sensors are not installed.
Figure 24. Measurable WQS sensor parameters and their pre-set limits.
Dr. Symeon Christodoulou 36 | P a g e University of Cyprus, NIREAS-IWRC
Figure 25. Measurable WQS sensor parameters.
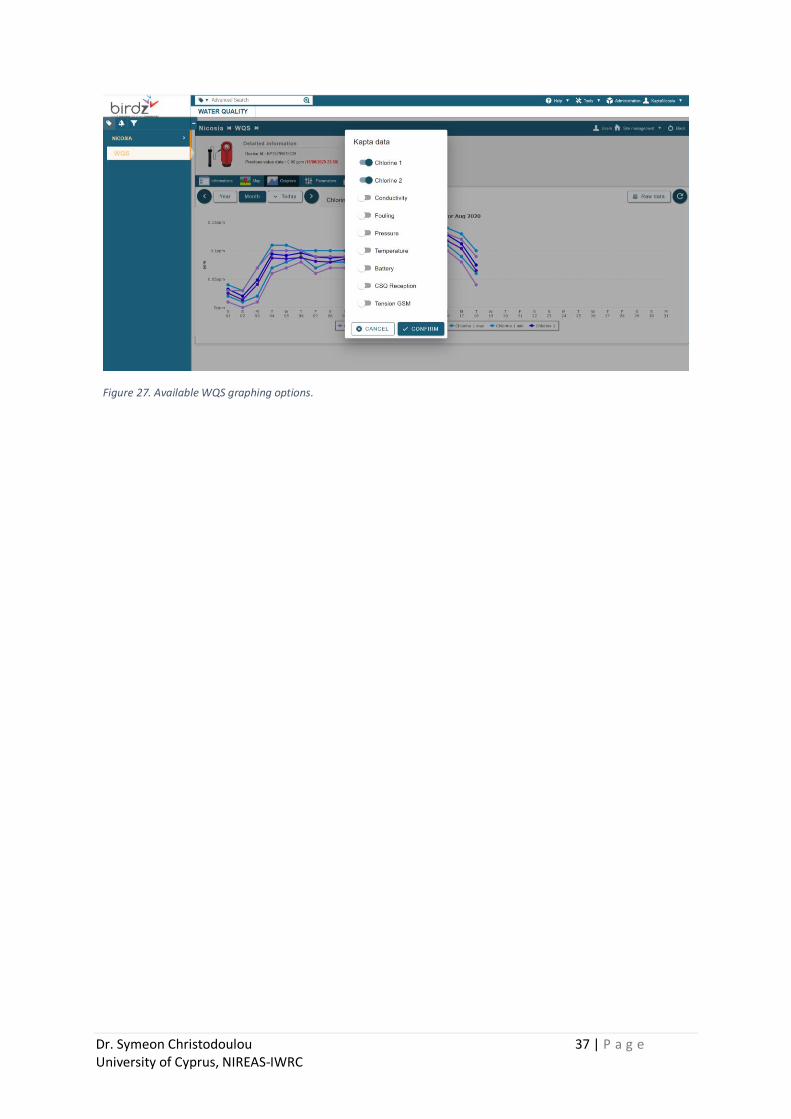
The platform enables WBN to create graphs (Figure 26) of different quality parameters (Figure 27)
and to extract historical data from the system, but without the ability to configure this data (e.g.
period, frequency, area of interest). Further, the range of the data recording period covers all the
years the platform has been in operation.
Figure 26. Typical graph (time series) of WQS sensor.
Dr. Symeon Christodoulou 37 | P a g e University of Cyprus, NIREAS-IWRC
Figure 27. Available WQS graphing options.
Dr. Symeon Christodoulou 38 | P a g e University of Cyprus, NIREAS-IWRC
5 Pressure Loggers (PL)
5.1 General features and capabilities of the system
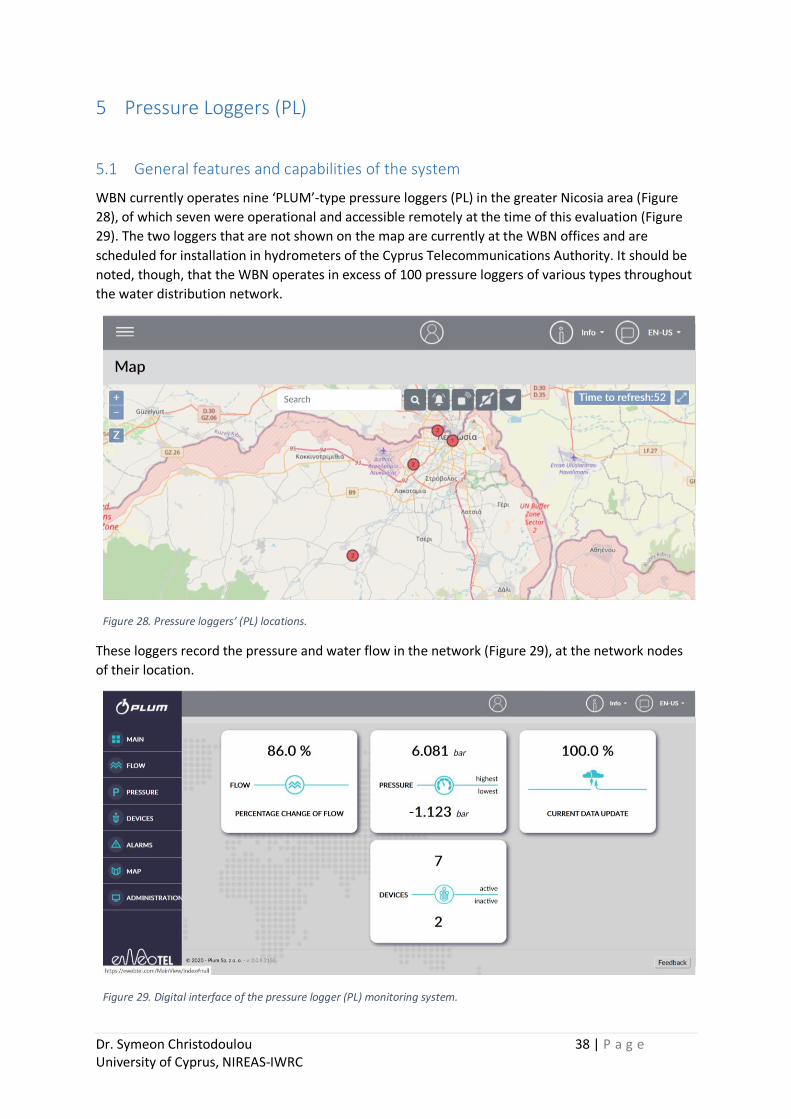
WBN currently operates nine ‘PLUM’-type pressure loggers (PL) in the greater Nicosia area (Figure
28), of which seven were operational and accessible remotely at the time of this evaluation (Figure
29). The two loggers that are not shown on the map are currently at the WBN offices and are
scheduled for installation in hydrometers of the Cyprus Telecommunications Authority. It should be
noted, though, that the WBN operates in excess of 100 pressure loggers of various types throughout
the water distribution network.
Figure 28. Pressure loggers’ (PL) locations.
These loggers record the pressure and water flow in the network (Figure 29), at the network nodes
of their location.
Figure 29. Digital interface of the pressure logger (PL) monitoring system.
Dr. Symeon Christodoulou 39 | P a g e University of Cyprus, NIREAS-IWRC
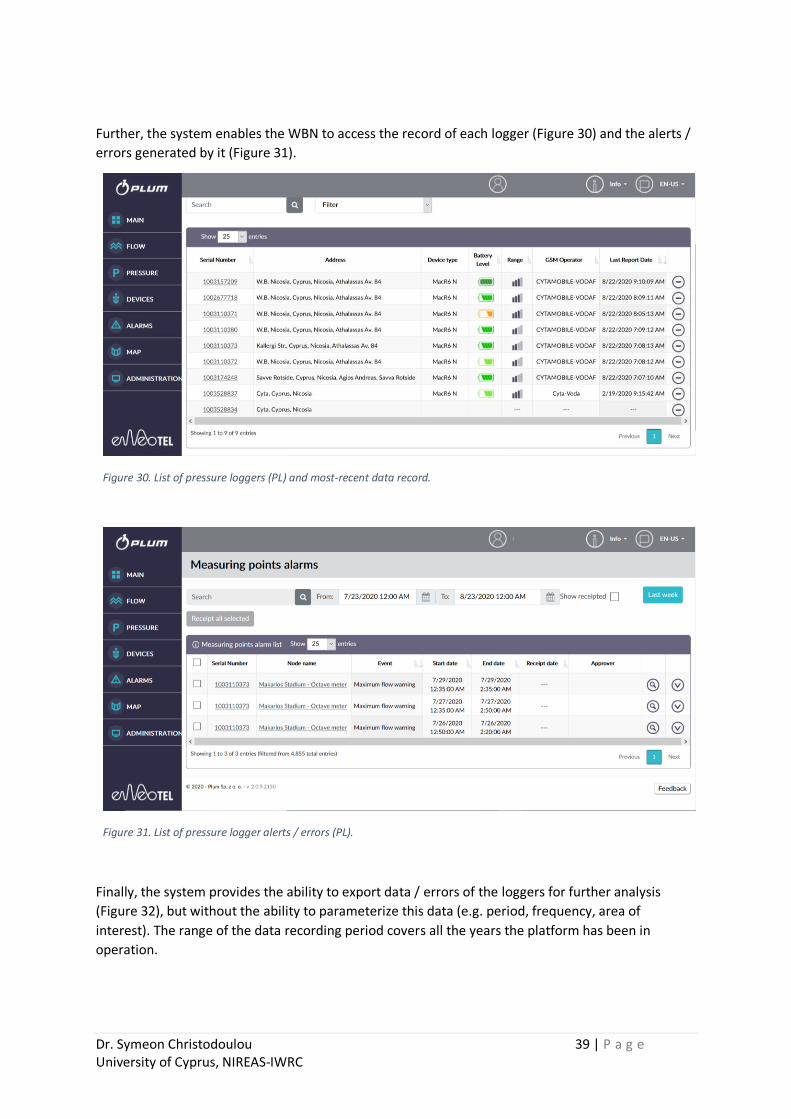
Further, the system enables the WBN to access the record of each logger (Figure 30) and the alerts /
errors generated by it (Figure 31).
Figure 30. List of pressure loggers (PL) and most-recent data record.
Figure 31. List of pressure logger alerts / errors (PL).
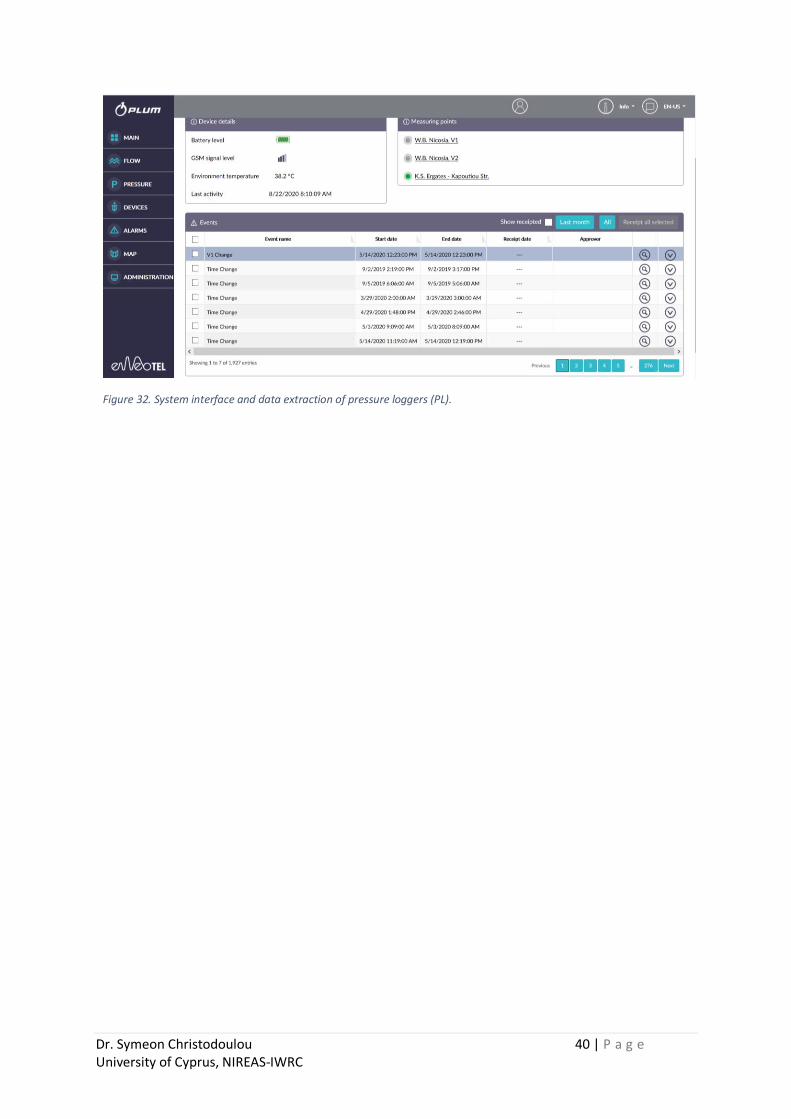
Finally, the system provides the ability to export data / errors of the loggers for further analysis
(Figure 32), but without the ability to parameterize this data (e.g. period, frequency, area of
interest). The range of the data recording period covers all the years the platform has been in
operation.
Dr. Symeon Christodoulou 40 | P a g e University of Cyprus, NIREAS-IWRC
Figure 32. System interface and data extraction of pressure loggers (PL).
Dr. Symeon Christodoulou 41 | P a g e University of Cyprus, NIREAS-IWRC
6 Water-Energy Nexus and Related Potential
6.1 Basic concepts
One of the most important emerging issues of recent years is the relationship between water and
energy, and the adoption of techniques and technologies to balance this relationship in the interest
of society.
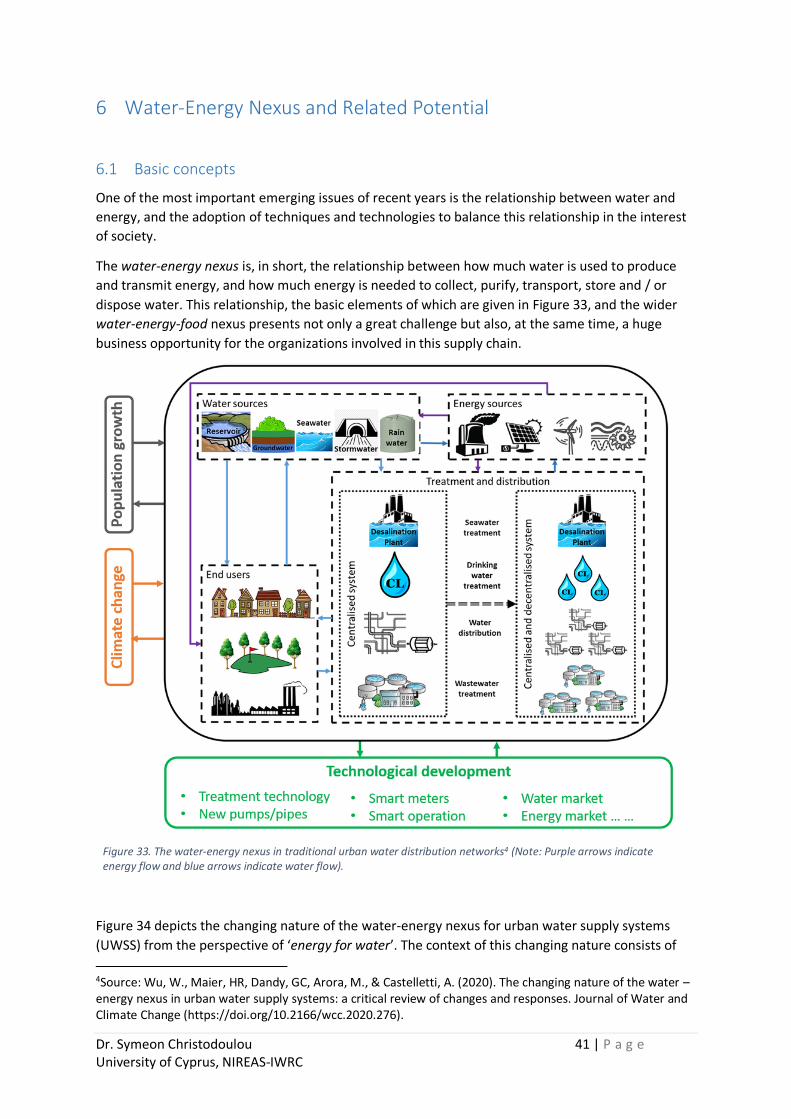
The water-energy nexus is, in short, the relationship between how much water is used to produce
and transmit energy, and how much energy is needed to collect, purify, transport, store and / or
dispose water. This relationship, the basic elements of which are given in Figure 33, and the wider
water-energy-food nexus presents not only a great challenge but also, at the same time, a huge
business opportunity for the organizations involved in this supply chain.
Figure 33. The water-energy nexus in traditional urban water distribution networks4 (Note: Purple arrows indicate energy flow and blue arrows indicate water flow).
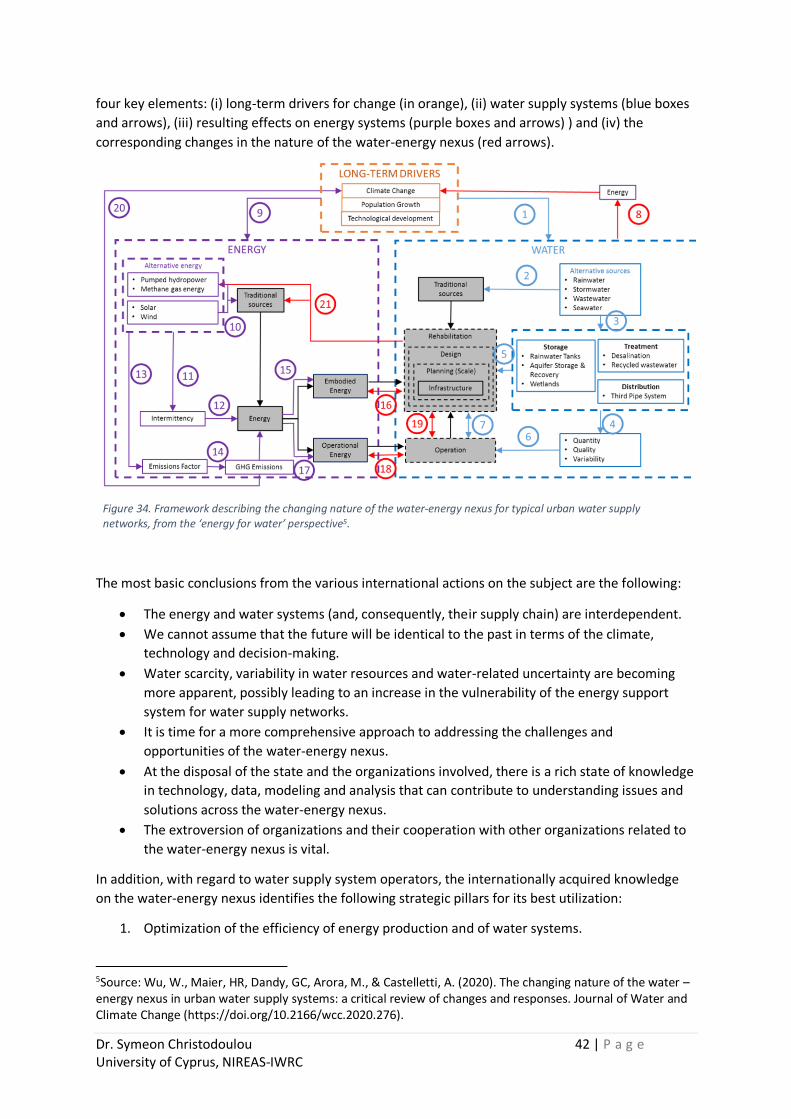
Figure 34 depicts the changing nature of the water-energy nexus for urban water supply systems
(UWSS) from the perspective of ‘energy for water’. The context of this changing nature consists of
4Source: Wu, W., Maier, HR, Dandy, GC, Arora, M., & Castelletti, A. (2020). The changing nature of the water – energy nexus in urban water supply systems: a critical review of changes and responses. Journal of Water and Climate Change (https://doi.org/10.2166/wcc.2020.276).
Dr. Symeon Christodoulou 42 | P a g e University of Cyprus, NIREAS-IWRC
four key elements: (i) long-term drivers for change (in orange), (ii) water supply systems (blue boxes
and arrows), (iii) resulting effects on energy systems (purple boxes and arrows) ) and (iv) the
corresponding changes in the nature of the water-energy nexus (red arrows).
Figure 34. Framework describing the changing nature of the water-energy nexus for typical urban water supply networks, from the ‘energy for water’ perspective5.
The most basic conclusions from the various international actions on the subject are the following:
• The energy and water systems (and, consequently, their supply chain) are interdependent.
• We cannot assume that the future will be identical to the past in terms of the climate,
technology and decision-making.
• Water scarcity, variability in water resources and water-related uncertainty are becoming
more apparent, possibly leading to an increase in the vulnerability of the energy support
system for water supply networks.
• It is time for a more comprehensive approach to addressing the challenges and
opportunities of the water-energy nexus.
• At the disposal of the state and the organizations involved, there is a rich state of knowledge
in technology, data, modeling and analysis that can contribute to understanding issues and
solutions across the water-energy nexus.
• The extroversion of organizations and their cooperation with other organizations related to
the water-energy nexus is vital.
In addition, with regard to water supply system operators, the internationally acquired knowledge
on the water-energy nexus identifies the following strategic pillars for its best utilization:
1. Optimization of the efficiency of energy production and of water systems.
5Source: Wu, W., Maier, HR, Dandy, GC, Arora, M., & Castelletti, A. (2020). The changing nature of the water – energy nexus in urban water supply systems: a critical review of changes and responses. Journal of Water and Climate Change (https://doi.org/10.2166/wcc.2020.276).
Dr. Symeon Christodoulou 43 | P a g e University of Cyprus, NIREAS-IWRC
2. Optimization of the energy efficiency of water management, treatment, distribution and
end-use systems.
3. Optimization of the reliability and durability of the energy and water systems.
4. Increase of the safety and productive use of non-traditional water sources.
5. Promotion of responsible energy actions in relation to water quality, the environment and
the effects on them of various externalities (e.g. seismic effects).
6. Utilization of productive synergies between the water and energy systems (and their
operators) and / or research organizations.
6.2 Potential for utilization by WBN
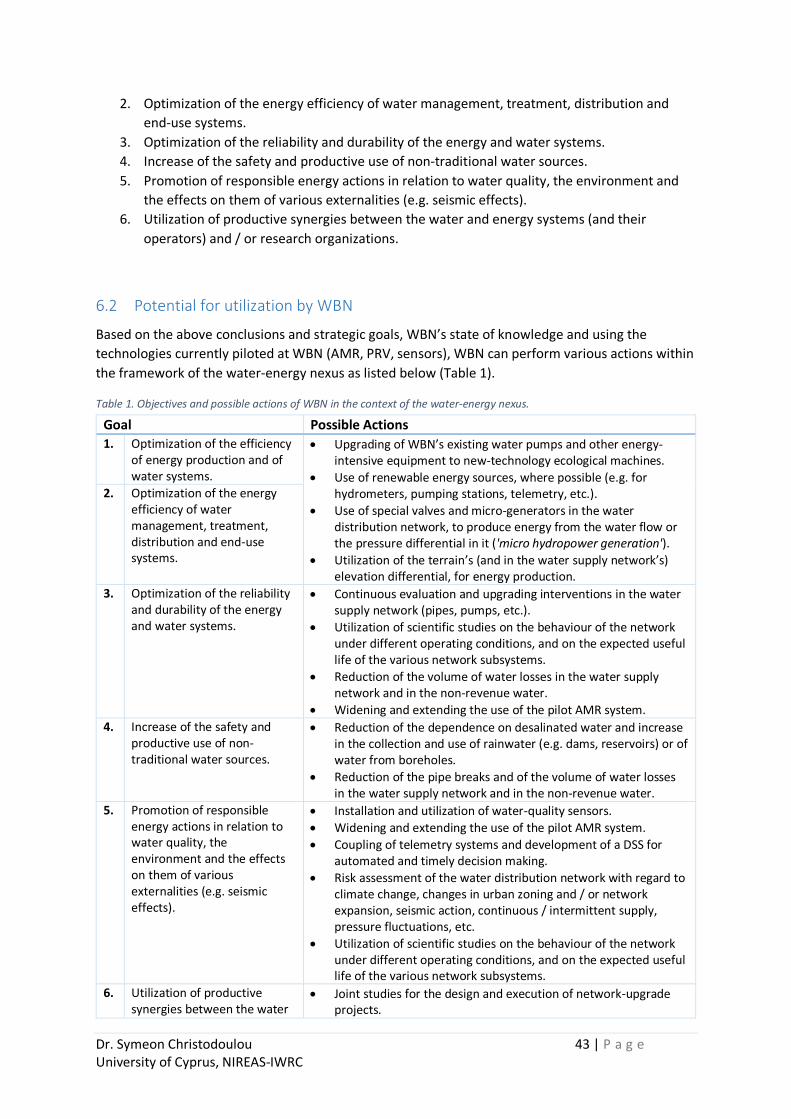
Based on the above conclusions and strategic goals, WBN’s state of knowledge and using the
technologies currently piloted at WBN (AMR, PRV, sensors), WBN can perform various actions within
the framework of the water-energy nexus as listed below (Table 1).
Table 1. Objectives and possible actions of WBN in the context of the water-energy nexus.
Goal Possible Actions
1. Optimization of the efficiency of energy production and of water systems.
• Upgrading of WBN’s existing water pumps and other energy-intensive equipment to new-technology ecological machines.
• Use of renewable energy sources, where possible (e.g. for hydrometers, pumping stations, telemetry, etc.).
• Use of special valves and micro-generators in the water distribution network, to produce energy from the water flow or the pressure differential in it ('micro hydropower generation').
• Utilization of the terrain’s (and in the water supply network’s) elevation differential, for energy production.
2. Optimization of the energy efficiency of water management, treatment, distribution and end-use systems.
3. Optimization of the reliability and durability of the energy and water systems.
• Continuous evaluation and upgrading interventions in the water supply network (pipes, pumps, etc.).
• Utilization of scientific studies on the behaviour of the network under different operating conditions, and on the expected useful life of the various network subsystems.
• Reduction of the volume of water losses in the water supply network and in the non-revenue water.
• Widening and extending the use of the pilot AMR system.
4. Increase of the safety and productive use of non-traditional water sources.
• Reduction of the dependence on desalinated water and increase in the collection and use of rainwater (e.g. dams, reservoirs) or of water from boreholes.
• Reduction of the pipe breaks and of the volume of water losses in the water supply network and in the non-revenue water.
5. Promotion of responsible energy actions in relation to water quality, the environment and the effects on them of various externalities (e.g. seismic effects).
• Installation and utilization of water-quality sensors.
• Widening and extending the use of the pilot AMR system.
• Coupling of telemetry systems and development of a DSS for automated and timely decision making.
• Risk assessment of the water distribution network with regard to climate change, changes in urban zoning and / or network expansion, seismic action, continuous / intermittent supply, pressure fluctuations, etc.
• Utilization of scientific studies on the behaviour of the network under different operating conditions, and on the expected useful life of the various network subsystems.
6. Utilization of productive synergies between the water
• Joint studies for the design and execution of network-upgrade projects.
Dr. Symeon Christodoulou 44 | P a g e University of Cyprus, NIREAS-IWRC
Goal Possible Actions and energy systems (and their operators) and / or research organizations.
• Joint research projects with the participation of research organizations, with the ultimate goal of developing and applying new technologies.
• Development and sharing of models, data and maps.
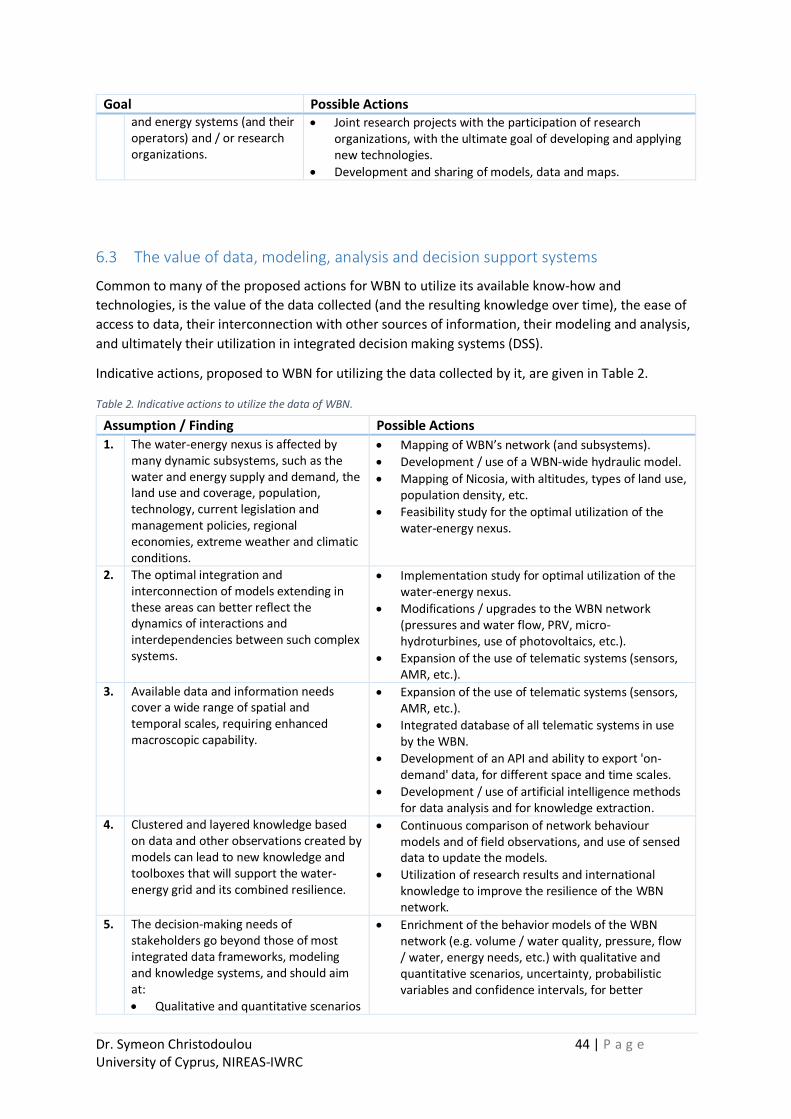
6.3 The value of data, modeling, analysis and decision support systems
Common to many of the proposed actions for WBN to utilize its available know-how and
technologies, is the value of the data collected (and the resulting knowledge over time), the ease of
access to data, their interconnection with other sources of information, their modeling and analysis,
and ultimately their utilization in integrated decision making systems (DSS).
Indicative actions, proposed to WBN for utilizing the data collected by it, are given in Table 2.
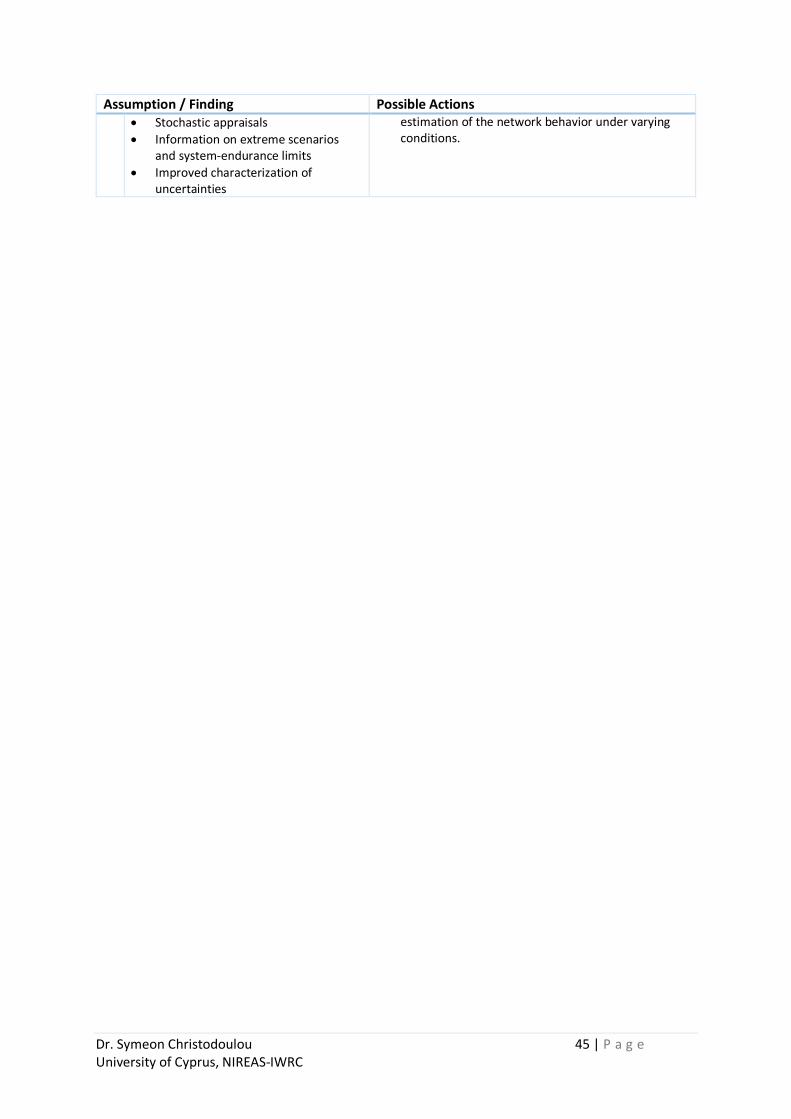
Table 2. Indicative actions to utilize the data of WBN.
Assumption / Finding Possible Actions
1. The water-energy nexus is affected by many dynamic subsystems, such as the water and energy supply and demand, the land use and coverage, population, technology, current legislation and management policies, regional economies, extreme weather and climatic conditions.
• Mapping of WBN’s network (and subsystems).
• Development / use of a WBN-wide hydraulic model.
• Mapping of Nicosia, with altitudes, types of land use, population density, etc.
• Feasibility study for the optimal utilization of the water-energy nexus.
2. The optimal integration and interconnection of models extending in these areas can better reflect the dynamics of interactions and interdependencies between such complex systems.
• Implementation study for optimal utilization of the water-energy nexus.
• Modifications / upgrades to the WBN network (pressures and water flow, PRV, micro-hydroturbines, use of photovoltaics, etc.).
• Expansion of the use of telematic systems (sensors, AMR, etc.).
3. Available data and information needs cover a wide range of spatial and temporal scales, requiring enhanced macroscopic capability.
• Expansion of the use of telematic systems (sensors, AMR, etc.).
• Integrated database of all telematic systems in use by the WBN.
• Development of an API and ability to export 'on-demand' data, for different space and time scales.
• Development / use of artificial intelligence methods for data analysis and for knowledge extraction.
4. Clustered and layered knowledge based on data and other observations created by models can lead to new knowledge and toolboxes that will support the water-energy grid and its combined resilience.
• Continuous comparison of network behaviour models and of field observations, and use of sensed data to update the models.
• Utilization of research results and international knowledge to improve the resilience of the WBN network.
5. The decision-making needs of stakeholders go beyond those of most integrated data frameworks, modeling and knowledge systems, and should aim at:
• Qualitative and quantitative scenarios
• Enrichment of the behavior models of the WBN network (e.g. volume / water quality, pressure, flow / water, energy needs, etc.) with qualitative and quantitative scenarios, uncertainty, probabilistic variables and confidence intervals, for better
Dr. Symeon Christodoulou 45 | P a g e University of Cyprus, NIREAS-IWRC
Assumption / Finding Possible Actions • Stochastic appraisals
• Information on extreme scenarios and system-endurance limits
• Improved characterization of uncertainties
estimation of the network behavior under varying conditions.

Dr. Symeon Christodoulou 46 | P a g e University of Cyprus, NIREAS-IWRC

Dr. Symeon Christodoulou 47 | P a g e University of Cyprus, NIREAS-IWRC

Dr. Symeon Christodoulou 48 | P a g e University of Cyprus, NIREAS-IWRC
Recommended