Assessing the Impact of Southeast Asia's Increasing Meat Demand on Global Feed Demand and Prices
Jim Hansen United States Department of Agriculture, Economic Research Service,
MTED, 355 E Street. S.W., Washington, D.C., U.S. 20024-3221 [email protected], (202) 694-5321
Selected Paper prepared for presentation at the
American Agricultural Economic Association Conference, Seattle Washington, August 11-14, 2012
The views expressed are those of the author and do not necessarily reflect the views of the Economic Research Service, United States Department of Agriculture.
Assessing the Impact of Southeast Asia's Increasing Meat Demand on Global Feed Demand and Prices
Abstract Over the past 20 years increasing global growth and increased per capita income have led to significant changes in food production, consumption and trade for many countries. As incomes and urbanization increase, food consumption patterns exhibit increased demand for a more diversified diet increasing meat and dairy consumption, which leads to improved meat production systems and modern animal science-based feed rations. Greater demand for feed grains and oilseeds is provided by domestic production and through imports. This study analyzes the effects of Southeast Asia's changing food consumption patterns on agriculture production, consumption, and trade out to the year 2021. The impact of increasing consumption of poultry and pork and increased meat production and feed demand on domestic agricultural markets of Southeast Asia and international markets is assessed. Countries analyzed include Philippines, Indonesia, Vietnam, Thailand, and Malaysia. Results provide insights to potential higher global feed prices in the near future and constraints to expanding production. Global markets respond to higher feed prices through increased production and decreased demand.
Key words: Southeast Asia, food consumption, feed demand, poultry and pork livestock industry, trade, emerging markets, dynamic partial equilibrium simulation model
Assessing the Impact of Southeast Asia's
Increasing Meat Demand on Global Feed Demand and Prices
Introduction
Over the past 20 years increasing global growth and increased per capita income have led to
significant changes in food production, consumption and trade for many countries. As incomes
increased, food consumption patterns exhibited increased demand for a more diversified diet,
including meats and dairy. This led to improved meat production systems and modern animal
science-based feed rations. Greater demand for feed grains and oilseeds led to increased
domestic production and imports from the global market. A major source of uncertainty in the
near future is the increasing import demand for livestock feed stuffs in emerging markets as meat
demand increases. Southeast Asia includes some of the fastest-growing economies in the world
and a relatively large population base. In addition to the uncertainty of increased feed demand,
most of these countries are constrained by limited arable land, moderate yield growth, increasing
water shortages, encroaching urbanization, and limited funding for agricultural research. There is
also the increasing uncertainty of climate change with increasing extreme weather events. Many
countries have responded through policies to expand cultivated area, improve irrigation structure,
and provide subsidies for modern seed varieties, fertilizer, and other inputs.
This study analyzes the effects of Southeast Asia emerging markets as food consumption
patterns evolve toward more western diets with increasing meat consumption. The specific focus
is on increased consumption of poultry and pork and the impact increased meat production will
have on feed demand in domestic markets of Southeast Asia and international grain markets.
This research also addresses the potential of constraints in expanding future arable land for corn
production in these countries. Countries analyzed include Indonesia, Philippines, Thailand,
Vietnam and Malaysia. Results provide insights to the potential increase in meat consumption
and feed import demand resulting in higher global feed prices in the near future. Other insights
are of the global market's ability to respond to increasing feed demand as emerging economies
move toward a more diversified diet with greater meat consumption and a decrease in demand
for staple commodities.
As emerging economies develop, their diets exhibit considerable change. The changing
consumption behavior is surprisingly consistent across numerous countries and well
documented. The major factors driving changes in food consumption behavior are well known,
increasing incomes, urbanization, improved infrastructure and transportation, increased access to
markets, and demographic shifts. Increasing education along with income also plays a large role
in consumer awareness of food safety and quality. The westernization of diets, the transition
toward increased meat consumption and away from staple-based diets such as rice, corn, wheat,
and cassava is well-established in the literature (Muhammad et al. 2011, Fabiosa 2005; Pingali
2004; Seale, Regmi, Bernstein 2003; Gehlhar and Coyle 2001; Haley 2001; Regmi and Dyck
2001; and Cranfield et al. 1998). But even with increased understanding of the evolving diets in
emerging markets as incomes increase, projections of future food consumption patterns are
difficult to develop and have often been inaccurate.
Background
There are a number of variables and factors which affect food consumption and changing food
consumption patterns. This variation is dependent upon numerous factors such as income levels,
urbanization rates, infrastructure development, population age, immigration, and other
demographic variables. The size of the population and its growth rate directly affect current and
future food demand. The five countries under study exhibited a population growth rate of 1.67
percent, from 1980 to 2011, which is an increase in population of 211 million people, with an
average increase of 6.8 million people per year. The most recent annual increase in population
was 5.83 million people. This population growth rate has not been constant, but decreasing over
time. The population growth rate for these five countries for the decades of 1960s, 1980s and
2010s averaged 2.71 percent, 2.17 percent and 1.29 percent, respectively. Projections indicate
future population growth rates will continue to decrease, therefore this region’s population will
continue to increase at a decreasing rate. Over the next 10 years the population is forecasted to
increase by 54.3 million people, a growth rate of almost 1 percent per year. Figure 1 shows the
total population for these five countries from 1980 through 2012 and projections to 2050. These
countries approach a maximum of about 680 million by 2050 and then begin to decrease.
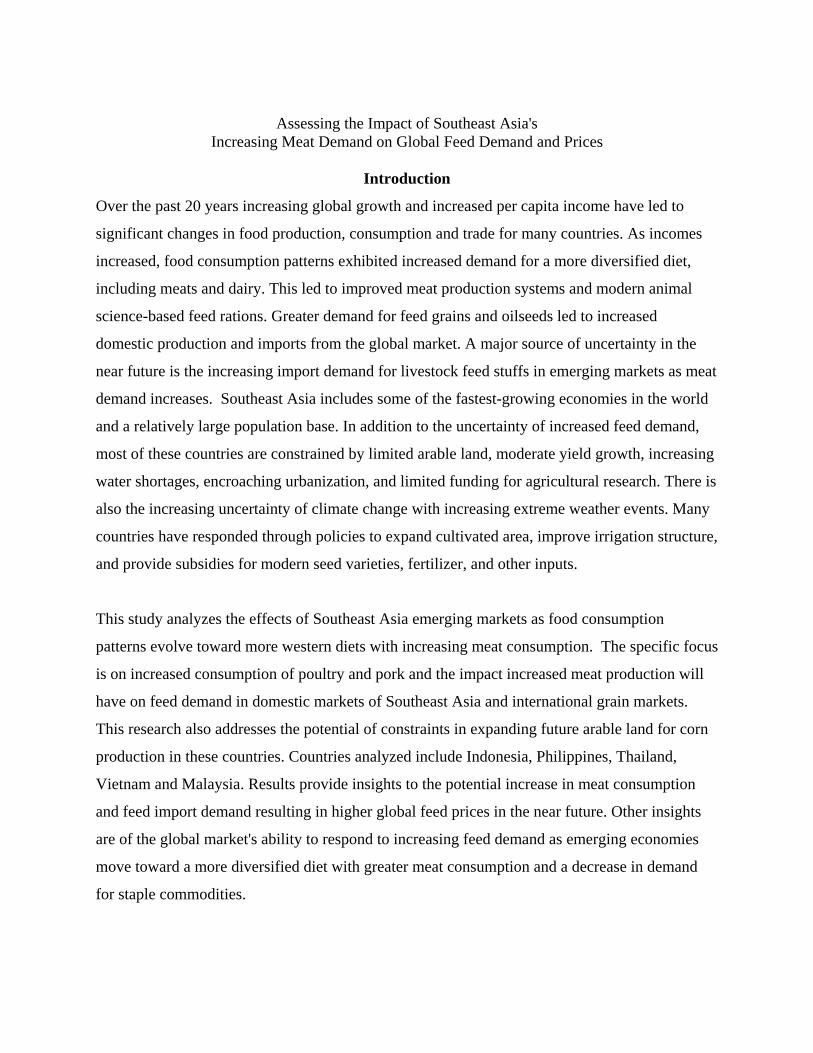
Figure 1. Total population, rural and urban aggregate for five Southeast Asian countries studied,
(million).
Source: UN-FAO, FAOSTAT, http://faostat.fao.org
Population Growth and Urbanization:
An increasing number of individuals and households have moved away from the farm and rural
areas to seek employment within the cities and urban areas. Figure 1 shows total, urban and
rural population for the five Southeast Asian countries studied combined. Even though the
population growth rate is slowing, the growth rate of urbanization is relatively constant. The
percentage share of urban population has increased from 18.5 percent in 1961 to 43 percent by
2010 for these 5 countries. Projections from United Nations Food and Agricultural Organization
(UN-FAO) indicate rural and urban populations may be equal in the year 2024 with 296 million
people in each sector. Malaysia has the highest percent of urban population in 2011 at 73 percent
followed by the Philippines, Indonesia, Thailand, and Vietnam at 49, 45, 34, and 31 percent
respectively. Urbanization results in large changes of food consumption patterns. Normally with
urbanization per capita income increases, access to food is easier and a greater variety is
available. Urban diets often change dramatically moving from staple commodities toward a
more commercialized diet with increased meat, vegetable and fruit consumption.
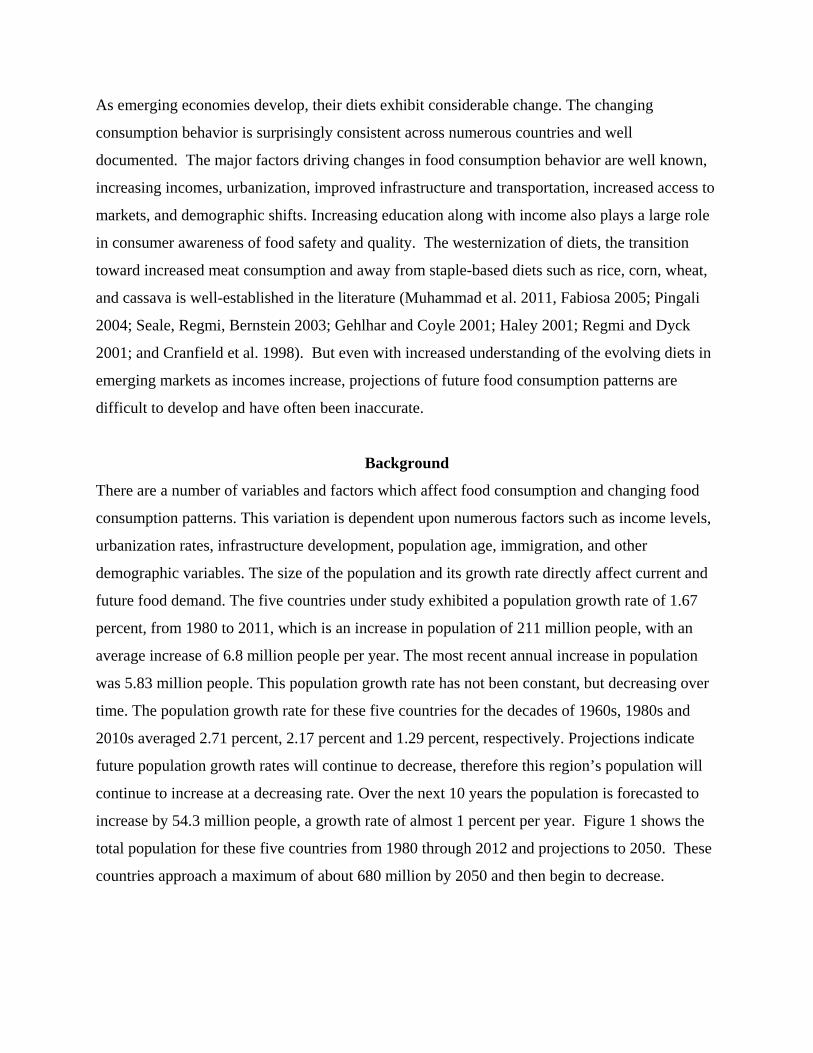
Figure 2. Current and projected per capita income for Southeast Asian countries (US$ 2005).
Source: USDA, Long-Term Commodity Projections, 2012.
Household Incomes:
Increasing incomes is one of the most important variables affecting food consumption patterns.
Engle's law is apparent in emerging markets as household income rises and the proportion of
income spent on food declines and household income elasticity for food decreases. Households
with increasing incomes change their diet toward higher value products, which include meat,
vegetables, fruit, and increasing consumption of food away from home. As household incomes
increase, consumption of major staple commodities decrease, such as rice, corn, cassava and
wheat. Income elasticities for staple foods approach zero and become negative indicating an
inferior good.
Figure 2, per capita income, clearly indicates that income has increased significantly for all of
these countries except the Philippines. Malaysia has the highest per capita income followed by
Thailand, Indonesia, Philippines, and Vietnam. Since the early 1980s per capita income has more
than doubled and almost tripled for all of these countries except the Philippines. The annual
growth rates in real per capita Gross Domestic Product (GDP) from 1981 to 2011 for Indonesia,
Philippines, Thailand, Vietnam, and Malaysia are 3.58, 0.88, 4.31, 4.49, and 3.22 percent
respectively. Vietnam has experienced the fastest growth rate over the past decade averaging
5.82 percent, followed by Indonesia at 4 percent and Thailand at 3.58 percent annual growth rate.
Future 10 year projections of increasing per capita income for Indonesia, Philippines, Thailand,
Vietnam, and Malaysia are 4.4, 2.92, 4.1, 5.65, and 3.23 percent, respectively. Projections
indicate that Vietnam and Indonesia will maintain the fastest growth rates over the next decade.
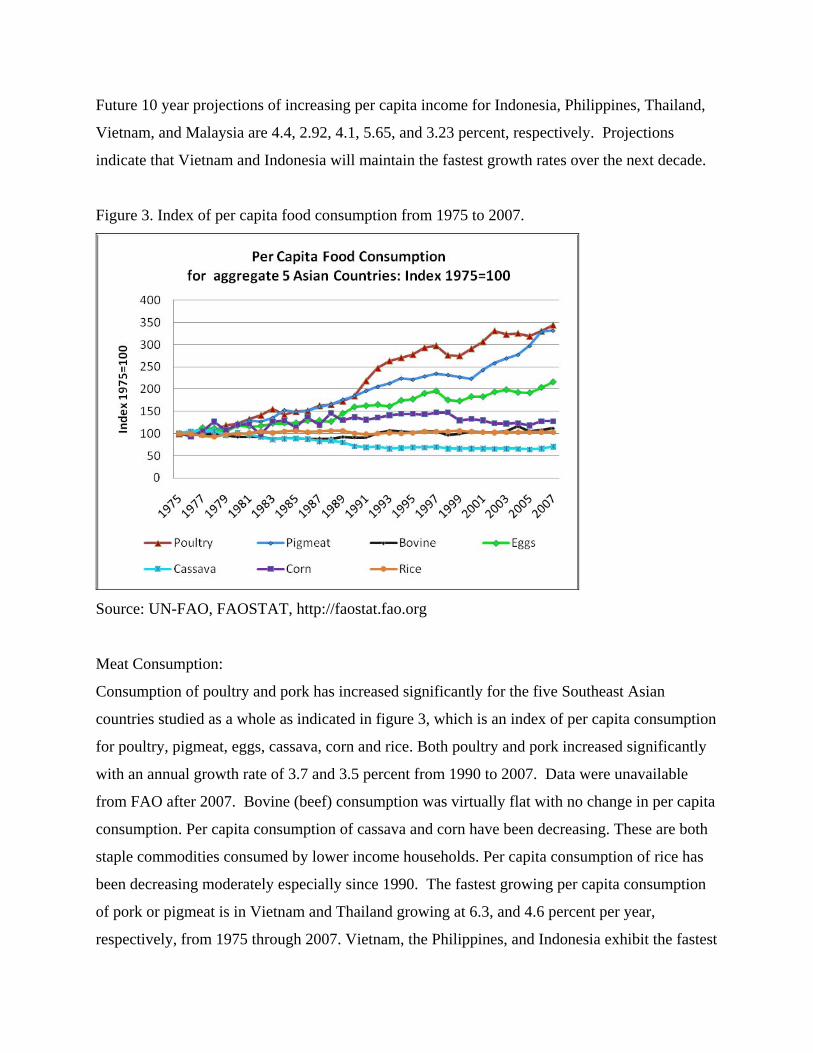
Figure 3. Index of per capita food consumption from 1975 to 2007.
Source: UN-FAO, FAOSTAT, http://faostat.fao.org
Meat Consumption:
Consumption of poultry and pork has increased significantly for the five Southeast Asian
countries studied as a whole as indicated in figure 3, which is an index of per capita consumption
for poultry, pigmeat, eggs, cassava, corn and rice. Both poultry and pork increased significantly
with an annual growth rate of 3.7 and 3.5 percent from 1990 to 2007. Data were unavailable
from FAO after 2007. Bovine (beef) consumption was virtually flat with no change in per capita
consumption. Per capita consumption of cassava and corn have been decreasing. These are both
staple commodities consumed by lower income households. Per capita consumption of rice has
been decreasing moderately especially since 1990. The fastest growing per capita consumption
of pork or pigmeat is in Vietnam and Thailand growing at 6.3, and 4.6 percent per year,
respectively, from 1975 through 2007. Vietnam, the Philippines, and Indonesia exhibit the fastest
annual growth rate of poultry per capita consumption at 6.2, 4.5, and 4.4 percent respectively,
from 1975 through 2007.
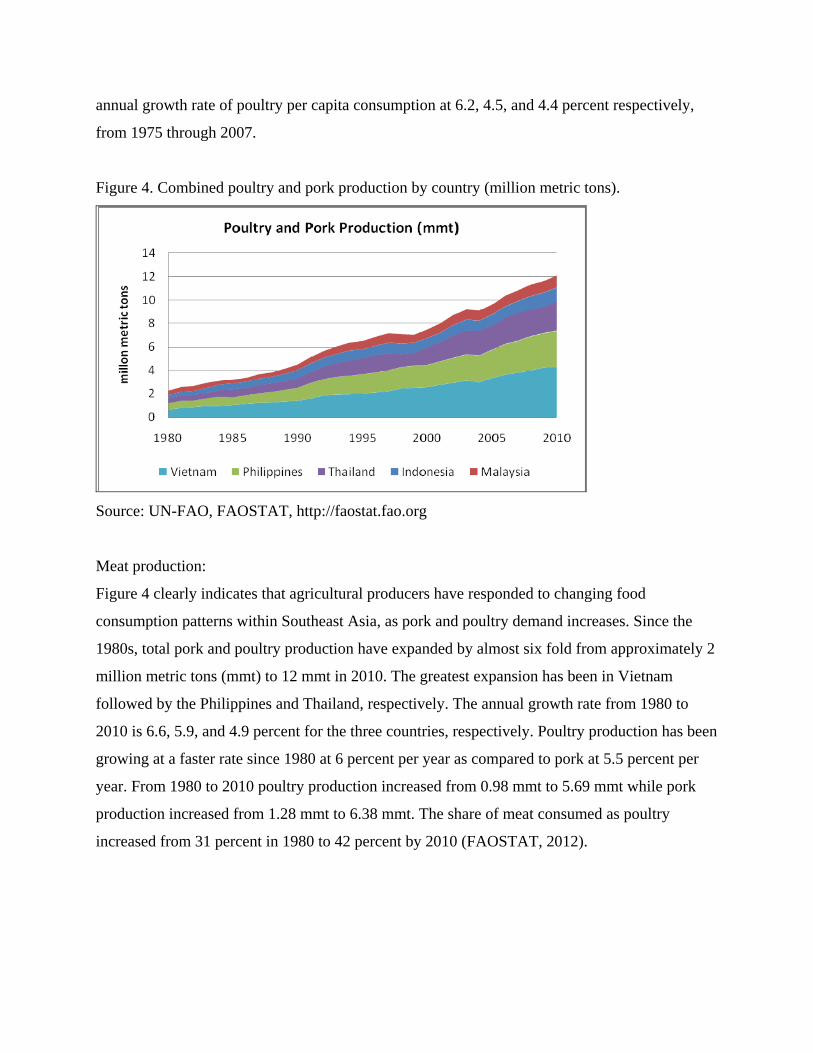
Figure 4. Combined poultry and pork production by country (million metric tons).
Source: UN-FAO, FAOSTAT, http://faostat.fao.org
Meat production:
Figure 4 clearly indicates that agricultural producers have responded to changing food
consumption patterns within Southeast Asia, as pork and poultry demand increases. Since the
1980s, total pork and poultry production have expanded by almost six fold from approximately 2
million metric tons (mmt) to 12 mmt in 2010. The greatest expansion has been in Vietnam
followed by the Philippines and Thailand, respectively. The annual growth rate from 1980 to
2010 is 6.6, 5.9, and 4.9 percent for the three countries, respectively. Poultry production has been
growing at a faster rate since 1980 at 6 percent per year as compared to pork at 5.5 percent per
year. From 1980 to 2010 poultry production increased from 0.98 mmt to 5.69 mmt while pork
production increased from 1.28 mmt to 6.38 mmt. The share of meat consumed as poultry
increased from 31 percent in 1980 to 42 percent by 2010 (FAOSTAT, 2012).
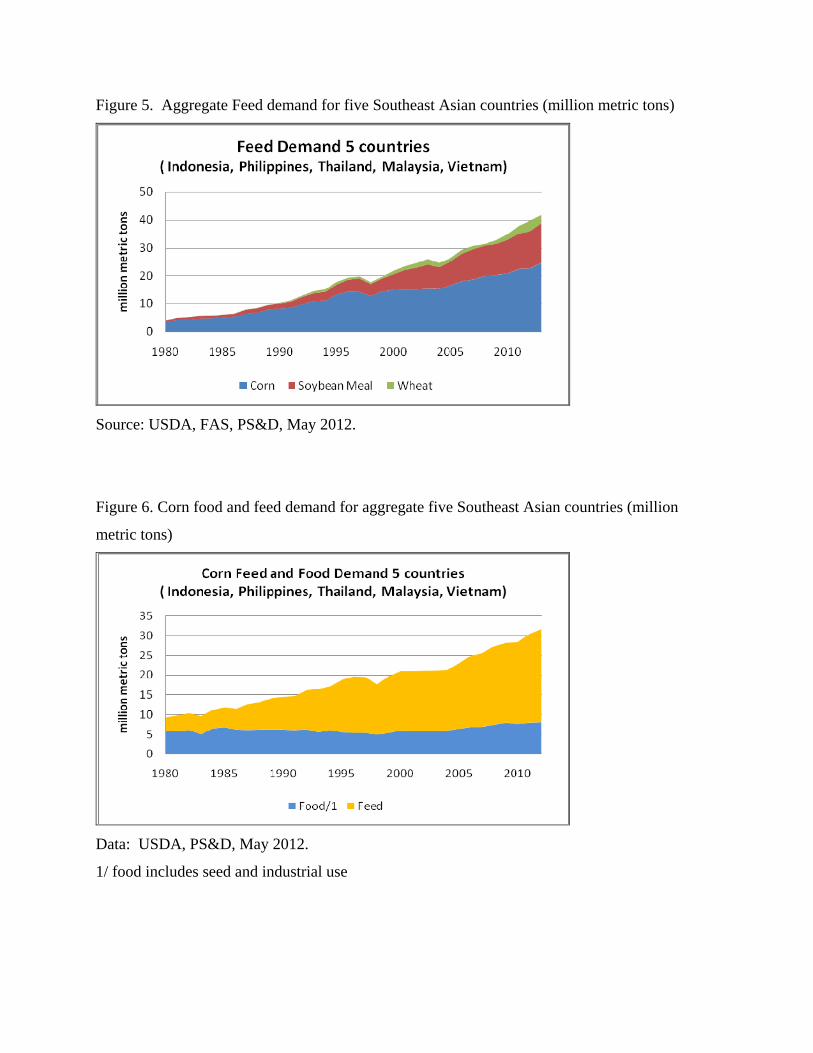
Figure 5. Aggregate Feed demand for five Southeast Asian countries (million metric tons)
Source: USDA, FAS, PS&D, May 2012.
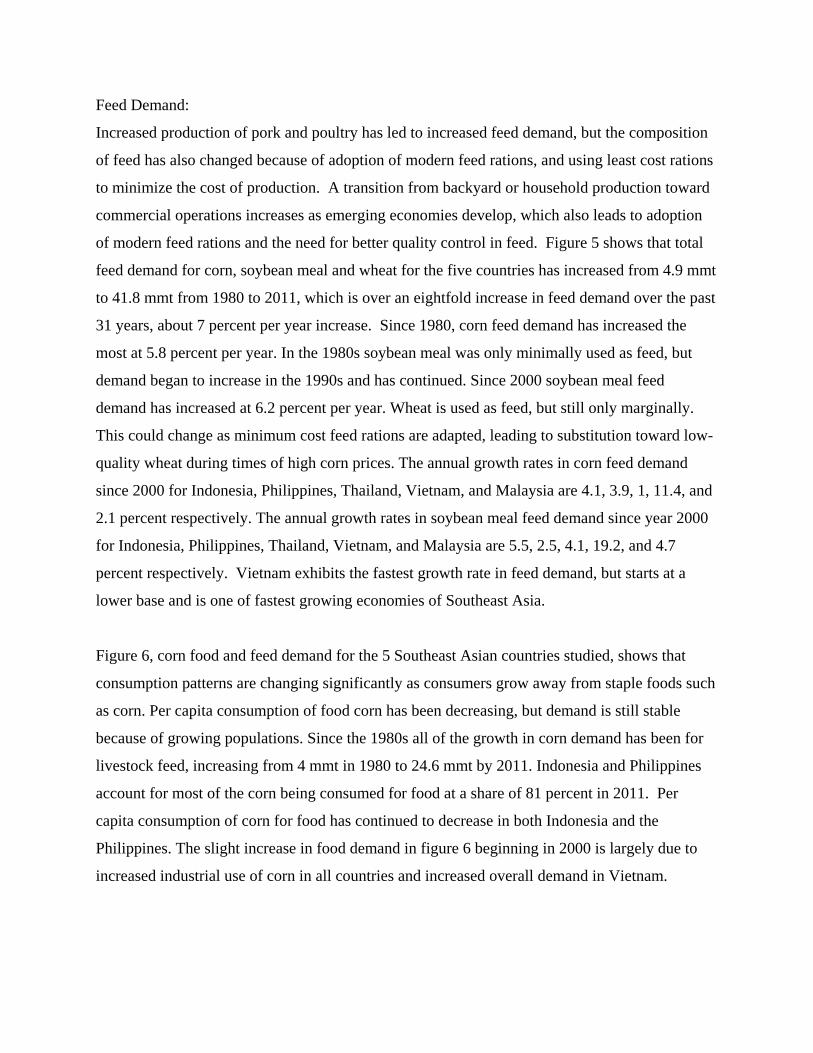
Figure 6. Corn food and feed demand for aggregate five Southeast Asian countries (million
metric tons)
Data: USDA, PS&D, May 2012.
1/ food includes seed and industrial use
Feed Demand:
Increased production of pork and poultry has led to increased feed demand, but the composition
of feed has also changed because of adoption of modern feed rations, and using least cost rations
to minimize the cost of production. A transition from backyard or household production toward
commercial operations increases as emerging economies develop, which also leads to adoption
of modern feed rations and the need for better quality control in feed. Figure 5 shows that total
feed demand for corn, soybean meal and wheat for the five countries has increased from 4.9 mmt
to 41.8 mmt from 1980 to 2011, which is over an eightfold increase in feed demand over the past
31 years, about 7 percent per year increase. Since 1980, corn feed demand has increased the
most at 5.8 percent per year. In the 1980s soybean meal was only minimally used as feed, but
demand began to increase in the 1990s and has continued. Since 2000 soybean meal feed
demand has increased at 6.2 percent per year. Wheat is used as feed, but still only marginally.
This could change as minimum cost feed rations are adapted, leading to substitution toward low-
quality wheat during times of high corn prices. The annual growth rates in corn feed demand
since 2000 for Indonesia, Philippines, Thailand, Vietnam, and Malaysia are 4.1, 3.9, 1, 11.4, and
2.1 percent respectively. The annual growth rates in soybean meal feed demand since year 2000
for Indonesia, Philippines, Thailand, Vietnam, and Malaysia are 5.5, 2.5, 4.1, 19.2, and 4.7
percent respectively. Vietnam exhibits the fastest growth rate in feed demand, but starts at a
lower base and is one of fastest growing economies of Southeast Asia.
Figure 6, corn food and feed demand for the 5 Southeast Asian countries studied, shows that
consumption patterns are changing significantly as consumers grow away from staple foods such
as corn. Per capita consumption of food corn has been decreasing, but demand is still stable
because of growing populations. Since the 1980s all of the growth in corn demand has been for
livestock feed, increasing from 4 mmt in 1980 to 24.6 mmt by 2011. Indonesia and Philippines
account for most of the corn being consumed for food at a share of 81 percent in 2011. Per
capita consumption of corn for food has continued to decrease in both Indonesia and the
Philippines. The slight increase in food demand in figure 6 beginning in 2000 is largely due to
increased industrial use of corn in all countries and increased overall demand in Vietnam.
Corn Area, Yield, and Production:
The total corn area for the five Southeast Asian countries studied has decreased from its highest
level reached in 1988 at 8,729,000 hectors to its lowest level in 1997 at 7,035,000 hectors. Since
1997, corn area harvested has increased to approximately 8 million hectors. Total area would be
relatively flat, except for Vietnam which continues to expand corn area at a rate of about 5
percent per year. Indonesia and Philippines corn area has been relatively constant over the past
decade, but Thailand’s has been decreasing at a rate of 1.7 percent per year over the past decade.
Malaysia's corn area is quite small, 26,000 hectares, and stable. Corn production has increased
about 3.4 percent per year over the past decade with almost all of this coming from increasing
yields. The corn yield growth rates ranges from a high of 4.2 percent per year for Vietnam to the
lowest growth rate at 1 percent for Thailand over the past decade. Future increasing supplies of
corn in these five countries is dependent on increasing yields, but even increasing yields may not
be sufficient to provide feed corn for the region’s increasing meat production, which would lead
to increased corn imports.
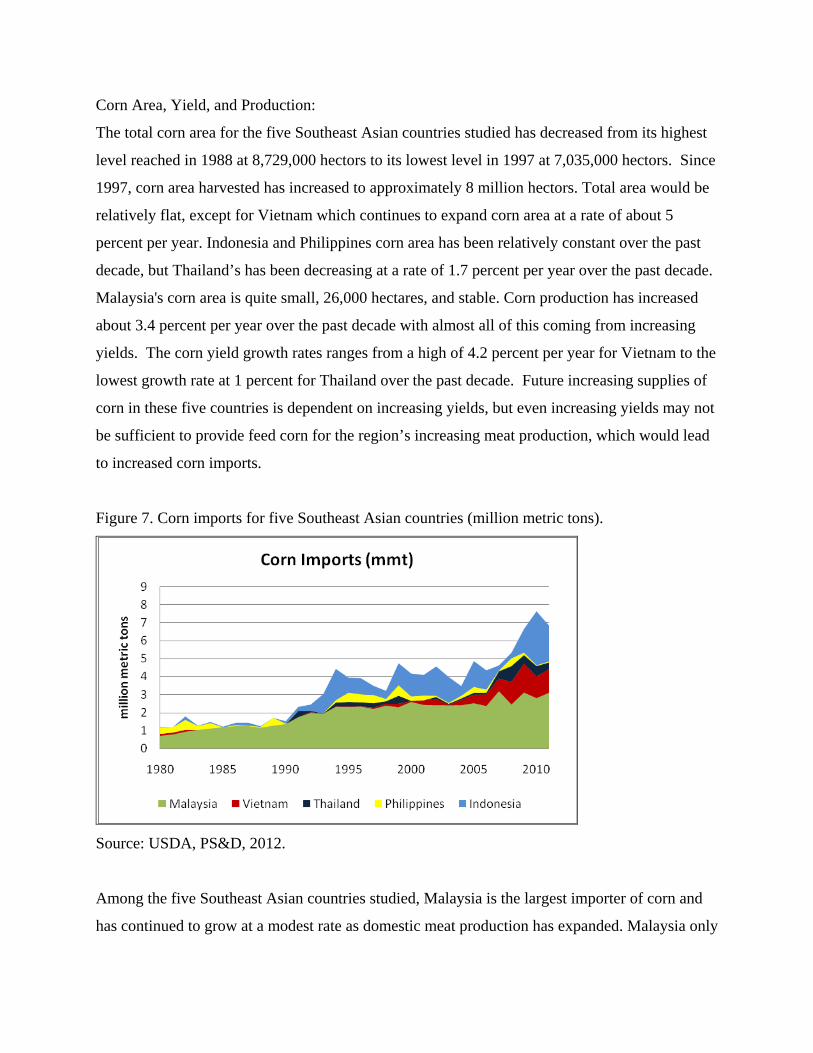
Figure 7. Corn imports for five Southeast Asian countries (million metric tons).
Source: USDA, PS&D, 2012.
Among the five Southeast Asian countries studied, Malaysia is the largest importer of corn and
has continued to grow at a modest rate as domestic meat production has expanded. Malaysia only
produces a small amount of corn and is unable to expand area, and therefore dependent upon
imports for its feed industry. Vietnam has exhibited the greatest expansion of corn imports, from
almost none in the mid 1990s to 1.3 mmt in 2011 and projected to increase to 2.7 mmt by 2021.
Even though Vietnam is expanding corn production through increasing area and yields, the
increase in supply is not sufficient for the increasing demand from poultry and pork producers.
Indonesian corn imports are quite volatile, which are affected by weather conditions since most
of Indonesia's corn is rain fed.
Data:
The two major sources of international data are USDA's production, supply and disappearance
data (USDA-PS&D, 2011), and the United Nations Food and Agriculture Organization data
(UN-FAO, 2011). The USDA data does not have complete coverage for meat production and
consumption. USDA’s beef data covers Malaysia, Philippines, and Vietnam, but does not cover
Thailand and Indonesia. USDA's pork data covers Philippines and Vietnam. USDA's poultry
data covers all the countries. The data for feed crops, (corn, soybeans, soybean meal, and wheat)
by USDA’s PS&D is complete, covering production, consumption and trade as commodity
balance sheets. The United Nations data are not complete for all commodities and countries. The
production data are complete out to 2010, trade data exists to 2009, and food supply data only
exist to 2007. The commodity balance sheet data for the commodities only exists to 2007.
Commodity balance sheet data are most important because they provide detail for total demand
to equal total supply.
Scenario Analysis
The following scenarios were developed to analyze the impact of increasing per capita
consumption of poultry and pork in five Southeast Asian countries and the effect on domestic
and international markets. Specifically, the focus is on increased corn and soybean meal feed
demand. This research also focuses on the potential impact of limiting expansion of corn area in
the five Southeast Asian countries. The scenarios are formulated to capture the impacts of
increased meat consumption on domestic and global grain production, feed markets, and
livestock markets.
Scenario1: Change in food consumption patterns in developing countries is well established and
caused by numerous factors. As discussed earlier these factors include increasing income,
urbanization, improved access to food markets and processed foods, a continued movement in
food consumption toward a more western diet, and changing demographics toward younger
generations. In this scenario, per capita consumption of poultry and pork is gradually increased
over the projection period from 2012 through 2021 from the baseline projection. The initial
years exhibit a small increase in per capita consumption, 1.83 percent per year, and by 2021 the
increased per capita consumption of poultry and pork is greater by about 20 percent from the
baseline projection. In the model, a trend variable in the demand equation captures numerous
factors and variables affecting consumption, aside from income, own price and substitute prices,
which is increased to represent additional changing factors, discussed above. Per capita income
is gradually increased throughout the project period, which captures the transition to greater
household incomes.
Scenario 2: In this scenario, we capture the impact of constraints in expanding corn area
harvested for four of the five Southeast Asian countries. Indonesia, Philippines, Thailand, and
Vietnam are constrained to current levels of corn area harvested and not expanded. Malaysia’s
corn area harvested is the only country which did not exhibit an increase in corn area throughout
the baseline projection period and therefore does not need to be constrained. The projected 2021
area is lower by approximately 558,000 hectares, which is a 6.53 percent decrease compared to
the baseline.
Scenario 3: In this scenario we combined Scenario 1 and 2 together to capture the total effect of
increased per capita consumption of pork and poultry, while imposing constraints to expanding
corn area harvested in the four countries. This scenario assumes continued rapid growth of
Asian economies and maintains environmental constraints which prevent expansion of arable
land for crop production.
Model and Data
This study uses the USDA-ERS Country-Commodity Linked System (CCLS), which includes
the individual USDA-ERS country models for Indonesia, Philippines, Thailand, Vietnam, and
Malaysia, and the USDA-ERS Food and Agricultural Policy Simulator (FAPSIM) model of U.S.
agriculture. This is a large-scale dynamic partial equilibrium simulation system consisting of 42
country and regional models. The country models incorporate domestic and trade policies and
institutional behavior, such as tariffs, subsidies, and TRQs. Production, consumption, imports,
and exports are endogenous and depend on domestic and world prices, which are solved within
the modeling system. Macroeconomic assumptions and projections are exogenous based on
USDA’s 10 year agricultural projections (USDA, 2012). The system reaches simultaneous
equilibrium in prices and quantities for 24 world commodity markets for each of the 10 projected
years in the analysis to 2021. The 24 commodity markets include detailed coarse grains, food
grains, oilseeds, meals, oils, cotton, sugar, and animal products. Primary data sources are
USDA’s Production, Supply, and Disappearance, (USDA, November 2011), USDA’s National
Agricultural Statistical Service, the United Nations Food and Agricultural Organization’s
FAOSTAT, and data from individual country governments such as the Chinese Ministry of
Agriculture (MOA).
Country Models:
The USDA-ERS individual Southeast Asian country models are used for developing 10 year
commodity projections and in analyzing alternative scenarios including potential policy changes
and the impacts on international and U.S. agricultural markets and trade. The grain sectors of the
models have four major components: 1) price and expected revenue equations; 2) production and
consumption; 3) feed demand linked to livestock sectors; and 4) trade equations. Production of
corn, wheat, and rice is calculated from area harvested and yield equations. Area harvested and
yields are determined by expected returns for a given crop and substitute crops. Food demand is
modeled by rural and urban per capita consumption equations for the individual commodities,
which are functions of own consumer price, substitute food prices, and income. Feed demand is
a function of derived feed demand, based on quantity of pork and poultry produced in the
commercial and specialized livestock sectors. Corn import demand is an identity for the five
Southeast Asian countries studied, total demand minus total supply. Imports close the modeling
system for equilibrium in supply and demand. Export supply is a function of the export price
and consumer price. Producer or farm prices are solved through price transmission from the
global markets. Production, consumption, and domestic prices are affected by the international
price through global equilibrium in all countries’ import demand and export supply functions.
The supply response elasticities of corn for Indonesia, Philippines, Thailand, Vietnam, and
Malaysia with respect to expected revenues are 0.28, 0.25, 0.41, 0.51, and 0.31 respectively.
Area harvested and consumption adjust as new equilibrium commodity prices are solved for in
the model. Indonesia has two corn area supply responses, the elasticities are the same, one is for
corn produced on Java island and the second is for corn produced on the other islands, mostly
Sumatra. Corn food demand is expressed as per capita consumption. Elasticities for corn
consumer price for Indonesia, Philippines, Vietnam, and Malaysia are -0.02, -0.10, -0.22, and
-0.15, respectively. The income elasticity for corn food demand are 0.15, -0.22, -0.13, and -0.20,
respectively. The own price elasticity for poultry consumer price for Indonesia, Philippines,
Thailand, Vietnam, and Malaysia are -0.65, -0.65, -0.35, -0.90, and -0.50, and income
elasticities are 1, 0.90, 0.48, 1.47, and 0.20, respectively. The own price elasticity for pork
consumer price in the demand equation for Indonesia, Philippines, Thailand, Vietnam, and
Malaysia are -0.51, -0.40, -0.90, -0.90, and -0.60, respectively, and income elasticities for pork
demand are 0.15, 0.85, 0.42, 1.47, and 0.30, respectively.
Results
The results from an increase in per capita consumption of poultry and pork, scenario 1 (increased
per capita consumption), scenario 2 (constrained corn area harvested) and scenario 3 (scenario 1
and 2 applied together) are provided in tables 1 through 9. Tables 1 through 5 provide the results
for individual countries from all three scenarios and table 6 provides an aggregate of the 5
countries. Tables 7, 8, and 9 provide the trade impacts, under scenario 3, for the five Asian
countries and major importing and exporting countries of corn, soybeans, and soybean meal. As
mentioned earlier, scenario 1 involves a change in consumption patterns affecting domestic
markets and is quantitatively designed to capture the impact of numerous factors affecting food
consumption patterns as economies develop. Scenario 2 captures the impact of constraints in
expanding corn area to be used for livestock. Results from scenario 3 are discussed in greater
detail, because of the increasing likelihood of limiting land area and changes in Asian diets
toward a more Western diet, including an increase in consumption of meat.
Consumption:
Under both scenario 1 and 3, poultry and pork consumption increase by similar levels, with
scenario 3 slightly less because of the increased cost of corn due to less corn area harvested in
the five Southeast Asian countries. However, only under scenario 2 consumption of pork and
poultry decrease, which is less than one 10th of a percent for all five Southeast Asian countries
by 2021. Consumption decreases under scenario 2 due to higher prices because of the increased
cost of production of pork and poultry as expansion of corn area in the five countries is limited
and domestic and international price of corn increases. Under scenario 3 poultry consumption
increases for Indonesia, Philippines, Thailand, Vietnam, and Malaysia by 88, 49, 35, 27, and 37
thousand metric tons (tmt) in 2012 and by 399, 243, 213, 197 and 233 tmt by 2021, respectively.
Consumption increases range from 3.53 percent in 2012 to 20.55 percent by 2021 for poultry.
Under scenario 3 pork consumption increases for Indonesia, Philippines, Thailand, Vietnam, and
Malaysia by 7, 66, 20, 9, and 13 tmt in 2012 and by 43, 328, 120, 56 and 80 tmt by 2021,
respectively. Consumption increases range from 2.42 percent in 2012 to 20.56 percent by 2021
for poultry. Increased consumption is derived from the assumptions of increasing meat
consumption and movement away from staples, as the economy continues to develop, income
increases, urbanization increases and there is greater access to a variety of foods as the
infrastructure continues to develop.
Production:
Under scenario 3, an increase in per capita consumption of pork and poultry leads to increased
demand and increased production of pork and poultry in the domestic market. Due to the
limitations in expanding corn area in the five countries, the cost of production of pork and
poultry is slightly higher due to increased corn prices. This results in slightly less production than
under scenario 1. Poultry production in Indonesia, Philippines, Thailand, Vietnam, and Malaysia
increases by 88, 40, 21, 313, and 38, tmt in 2012 and by 398, 192, 132, 56, and 234, tmt by 2021
respectively. (See Tables 1-6) The increased production ranges from 1.42 percent in 2012 to
20.54 percent by 2021. Pork production in Indonesia, Philippines, Vietnam, Thailand, and
Malaysia increases by 7, 60, 93, 20, and 13 tmt in 2012 and by 43, 308, 960, 120, and 80 tmt by
2021, respectively. Increased production ranges from 3.64 percent in 2012 to 20.45 percent by
2021. The results indicate that increased revenue and profit for livestock producers from
increased per capita consumption are sufficient to increase poultry and pork production. This
results in increased feed demand for corn and soybean meal, and allocation of resources away
from other crops at a global level as feed import demand increases.
Feed Demand:
The five Southeast Asian countries aggregate pork and poultry production under scenario 3
increased by 387 tmt and 2,522 tmt in 2012 and 2021, respectively. The combined increase for
both pork and poultry production led to an increase in corn feed demand of 908 tmt and 4,562
tmt in 2012 and 2021, respectively. Under scenario 3, by the year 2021, corn feed demand for
Vietnam, Philippines, Indonesia, Malaysia, and Thailand increased by 1,362 tmt (15.12 percent),
1,209 tmt (17.58 percent), 738 tmt (11.03 percent), 670 tmt (17.48 percent), 592 tmt (10.35
percent), respectively. The five Southeast Asian country aggregate increase in corn feed demand
is 4,562 tmt which is a 14.23 percent increase above the baseline projection by the year 2021.
Prices:
International feed prices increase the most under scenario 3 as feed demand increases, and corn
area expansion is limited in the five Southeast Asian countries. International corn prices increase
0.48 percent in 2012 and 3.02 percent by 2021. Under scenario 1, corn prices increase slightly
less ranging from the initial increase of 0.31 percent to 2.44 percent by 2021. Scenario 2
exhibited the smallest increase in prices, from 0.17 percent 2012 to 0.57 percent by 2021.
Scenario 2 indicates area expansion of corn is not as critical a factor in maintaining increased
production and lower feed cost prices for Southeast Asia as yields. Continued increases in yield
is a critical factor for increased supplies given the area constraints. Corn yield and area increases
averaged 2.7 and 0.32 percent per year over the past decade for these five Southeast Asian
countries, respectively. International soybean and soybean meal prices increased by 0.31 percent
and 0.90 percent in 2012 and by 2.74 percent and 7.5 percent in 2021, respectively. The major
corn producing countries, the United States, Argentina, and Brazil responded to increased feed
demand and higher international prices by increasing their production by 0.73, 0.72, and 0.61
percent by 2021, respectively.
Trade:
Increased per capita consumption of pork and poultry and limited area expansion of corn under
scenario 3 gives the largest trade effects for corn, soybeans, and soybean meal. In scenario 2
corn area expansion was restricted beginning in 2012, which had a large impact on corn supplies
and increased corn import demand significantly. By the year 2021 the percentage increase in
corn import demand ranged from 21.73 percent for Indonesia to 61.59 percent for the Philippines
(tables 1-5), however Malaysia’s area was flat throughout the projection period and not affected.
Under scenarios 1 and 3, increased per capita meat consumption leads to increased profitability
for pork and poultry producers in the five Southeast Asian countries. This leads to increased
production and increased feed demand, which cannot be met by the domestic market. By the
year 2021 corn import demand increased most for Philippines, Thailand, Vietnam, Indonesia,
and Malaysia at 336.4, 100.4, 84.6, 55.9, and 17.0 percent respectively. But in terms of the
impact on international corn markets, by million metric tons (mmt), the greatest increase in corn
import demand is by Vietnam, Philippines, Indonesia, Thailand, and Malaysia at an increase of
2.35, 1.65, 1.17, 1.03, and 0.67 mmt by 2021, respectively. The five Southeast Asian country
aggregate increase in import demand is 6.88 mmt by 2021 and accounts for 5 percent of total
corn import demand from the baseline projection. A number of countries reduced corn imports
in response to higher international prices. Japan, South Korea, China, Egypt, and Taiwan all
reduced imports by less than 1 percent, (table 7).
The increase in import demand for corn is easily met by the major corn producing and exporting
countries of the world. Corn exports increase for the United States, Argentina, Brazil, Ukraine,
Russia, the European Union and South Africa by 7.63 percent (4.63 mmt), 1.15 (0.26 mmt), 4.90
(0.67 mmt), 3.02 (0.48 mmt), 6.08 (0.09 mmt), 1.12 (0.30 mmt), and 2.23 percent (0.47 mmt),
respectively, (table 7). These combined seven countries account for about 98.6 percent of the
increased corn exports. As international corn price increased, exporting countries responded by
increasing production through increased area, reducing domestic use, and drawing down stock
levels. Increased pork and poultry production also led to increased demand for soybeans and
soybean meal, presented in tables 8 and 9.
Summary and Conclusions
The contribution of this research is to investigate potential implications of recent changes in food
consumption toward increased meat consumption in Southeast Asia and increased livestock feed
demand and quantitatively analyzed their impacts on domestic and international commodity
markets. This study begins with a brief review of factors and variables affecting consumption
patterns in emerging markets. The paper discusses the growth in livestock demand and
production for Indonesia, Philippines, Thailand, Vietnam, and Malaysia with a focus on pork and
poultry. The potential for increasing global feed demand, (corn and soybean meal), are
discussed. Understanding the impact of increasing meat consumption in emerging Southeast
Asian countries on feed import demand, particularly corn and soybean meal, is important for
both Asian and U.S. officials, grain traders, and farmers. Our scenarios are formulated to capture
the impacts of changing consumption patterns within Southeast Asia and their impact on the
national and global market.
In our simulation model, we increased meat consumption of pork and poultry for Indonesia,
Philippines, Thailand, Vietnam, and Malaysia over the projection period to the year 2021. Per
capita consumption was increased by approximately 21 percent. The model results indicate that
the impact on international markets is not small, with price changes of 3 to 7 percent for corn and
soybean meal. Global Markets responded to increasing feed demand from the Southeast Asian
countries and increased corn production on a global basis. It is clear that as emerging market
economies grow and food consumption patterns change there will be increasing pressure on
global feed for livestock production. Higher price levels domestically benefit crop producers but
hurt lower income and rural households, whose diets are largely based on rice and wheat as
staple foods. Increased feed demand benefits global producers and major exporters of corn,
soybean, and soybean meal.
References Cranfield, J.A.L., T.W. Hertel, J.E. Eales and P.V. Preckel. “Changes in the Structure of Global Food Demand.” American Journal of Agricultural Economics 80(1988): 1042-50. Fabiosa, J.F., “Growing Demand for Animal-Protein-Source Products in Indonesia: Trade Implications.” Working Paper, 05-WP400, Center for Agricultural Rural Development, Iowa State University, Ames Iowa, July, 2005. Gehlhar, M., and W. Coyle., “Global Food Consumption Impacts on Trade Patterns.” In Changing Structures of Global Food Consumption and Trade, pp. 4-13. WRS 01-1, Edited by A. Regmi, Washington, DC: US Department of Agriculture, Economic Research Service, 2001. Haley, M.M. “Changing Consumer Demand for Meat: The U.S. Example, 1970-2000.” In Changing Structures of Global Food Consumption and Trade, pp. 4-13. WRS 01-1. Edited by A. Regmi, Washington, DC: US Department of Agriculture, Economic Research Service, 2001. Huang, J., and C. David. “Demand for Cereal Grains in Asia: The Effects of Urbanization.” Agricultural Economics 8(1993): 107-24, 1993. Muhammad, A., J.L. Seale, Jr., B Meade, and A. Regmi. “International Evidence on Food Consumption Patterns: An Update Using 2005 International Comparison Program Data” US Department of Agriculture, Economic Research Service, Technical Bulletin No. TB-1929, 1-59, March 2011. Pingali, P. “Westernization of Asian Diets and the Transformation of Food Systems: Implications for Research and Policy.” ESA Working Paper No. 04-17. Economic and Social Department. Food and Agricultural Organization of the United Nations, Rome, 2004. Regmi, A., and J. Dyck. “Effects of Urbanization on Global Food Demand.” In Changing Structures of Global Food Consumption and Trade, pp. 23-30. WRS 01-1. Edited by A. Regmi. Washington, DC: U.S. Department Of Agriculture, Economic Research Service, 2001.
Seale, J.,A. Regmi, and J.A. Bernstein. “International Evidence on Food Consumption Patterns.” Technical Bulletin No. TB1904, US Department Agriculture, Economic Research Service, 2003.
USDA, Agricultural Projections to 2021. Office of Chief Economist, USDA, Interagency Agricultural Projection Committee, Long-Term Projections WAOB-2012 -1, Washington D.C., United States, February, 2012.
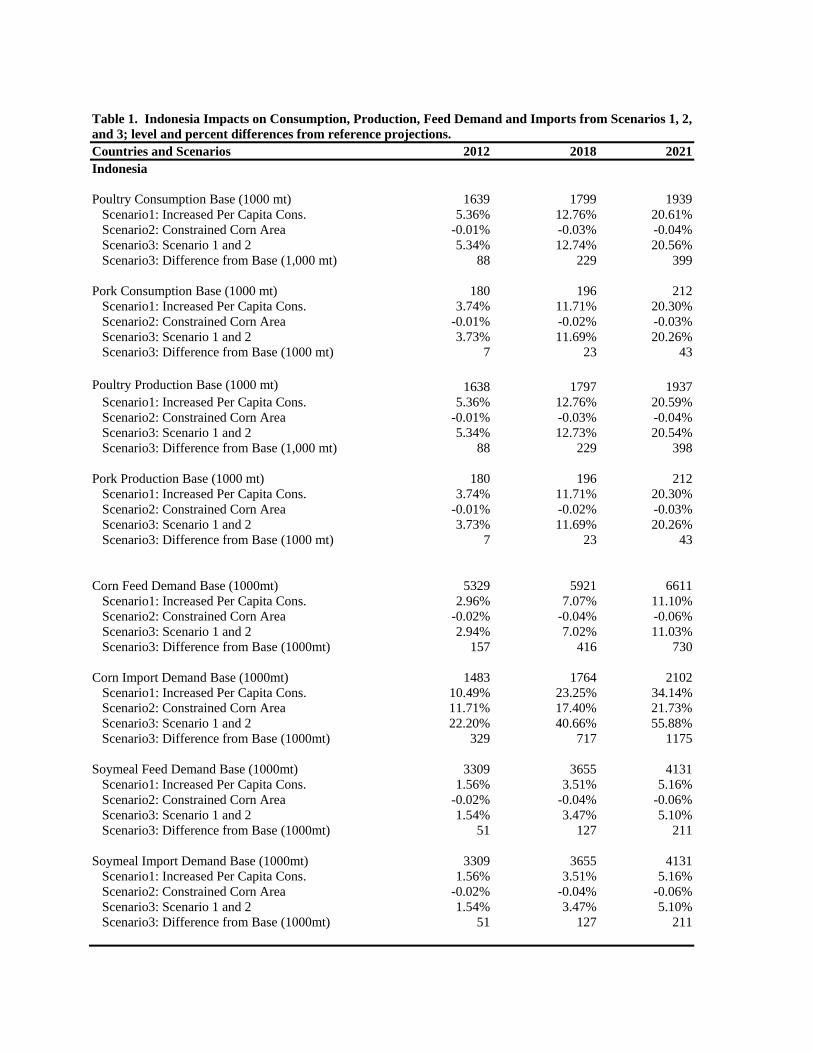
Table 1. Indonesia Impacts on Consumption, Production, Feed Demand and Imports from Scenarios 1, 2, and 3; level and percent differences from reference projections. Countries and Scenarios 2012 2018 2021Indonesia Poultry Consumption Base (1000 mt) 1639 1799 1939 Scenario1: Increased Per Capita Cons. 5.36% 12.76% 20.61% Scenario2: Constrained Corn Area -0.01% -0.03% -0.04% Scenario3: Scenario 1 and 2 5.34% 12.74% 20.56% Scenario3: Difference from Base (1,000 mt) 88 229 399 Pork Consumption Base (1000 mt) 180 196 212 Scenario1: Increased Per Capita Cons. 3.74% 11.71% 20.30% Scenario2: Constrained Corn Area -0.01% -0.02% -0.03% Scenario3: Scenario 1 and 2 3.73% 11.69% 20.26% Scenario3: Difference from Base (1000 mt) 7 23 43 Poultry Production Base (1000 mt) 1638 1797 1937 Scenario1: Increased Per Capita Cons. 5.36% 12.76% 20.59% Scenario2: Constrained Corn Area -0.01% -0.03% -0.04% Scenario3: Scenario 1 and 2 5.34% 12.73% 20.54% Scenario3: Difference from Base (1,000 mt) 88 229 398 Pork Production Base (1000 mt) 180 196 212 Scenario1: Increased Per Capita Cons. 3.74% 11.71% 20.30% Scenario2: Constrained Corn Area -0.01% -0.02% -0.03% Scenario3: Scenario 1 and 2 3.73% 11.69% 20.26% Scenario3: Difference from Base (1000 mt) 7 23 43 Corn Feed Demand Base (1000mt) 5329 5921 6611 Scenario1: Increased Per Capita Cons. 2.96% 7.07% 11.10% Scenario2: Constrained Corn Area -0.02% -0.04% -0.06% Scenario3: Scenario 1 and 2 2.94% 7.02% 11.03% Scenario3: Difference from Base (1000mt) 157 416 730 Corn Import Demand Base (1000mt) 1483 1764 2102 Scenario1: Increased Per Capita Cons. 10.49% 23.25% 34.14% Scenario2: Constrained Corn Area 11.71% 17.40% 21.73% Scenario3: Scenario 1 and 2 22.20% 40.66% 55.88% Scenario3: Difference from Base (1000mt) 329 717 1175 Soymeal Feed Demand Base (1000mt) 3309 3655 4131 Scenario1: Increased Per Capita Cons. 1.56% 3.51% 5.16% Scenario2: Constrained Corn Area -0.02% -0.04% -0.06% Scenario3: Scenario 1 and 2 1.54% 3.47% 5.10% Scenario3: Difference from Base (1000mt) 51 127 211 Soymeal Import Demand Base (1000mt) 3309 3655 4131 Scenario1: Increased Per Capita Cons. 1.56% 3.51% 5.16% Scenario2: Constrained Corn Area -0.02% -0.04% -0.06% Scenario3: Scenario 1 and 2 1.54% 3.47% 5.10% Scenario3: Difference from Base (1000mt) 51 127 211

Table 2. Philippines Impacts on Consumption, Production, Feed Demand and Imports from Scenarios 1, 2, and 3; level and percent differences from reference projections.Countries and Scenarios 2012 2018 2021Philippines Poultry Consumption Base (1000 mt) 977 1103 1234 Scenario1: Increased Per Capita Cons. 4.98% 12.09% 19.69% Scenario2: Constrained Corn Area -0.01% -0.01% -0.02% Scenario3: Scenario 1 and 2 4.98% 12.08% 19.68% Scenario3: Difference from Base (1,000 mt) 49 133 243 Pork Consumption Base (1000 mt) 1393 1485 1596 Scenario1: Increased Per Capita Cons. 4.72% 12.30% 20.56% Scenario2: Constrained Corn Area 0.00% 0.00% 0.00% Scenario3: Scenario 1 and 2 4.72% 12.30% 20.56% Scenario3: Difference from Base (1000 mt) 66 183 328 Poultry Production Base (1000 mt) 819 906 1002 Scenario1: Increased Per Capita Cons. 4.92% 11.91% 19.17% Scenario2: Constrained Corn Area -0.01% -0.01% -0.01% Scenario3: Scenario 1 and 2 4.92% 11.90% 19.16% Scenario3: Difference from Base (1,000 mt) 40 108 192 Pork Production Base (1000 mt) 1300 1393 1504 Scenario1: Increased Per Capita Cons. 4.63% 12.19% 20.44% Scenario2: Constrained Corn Area 0.00% 0.00% 0.00% Scenario3: Scenario 1 and 2 4.64% 12.19% 20.45% Scenario3: Difference from Base (1000 mt) 60 170 308 Corn Feed Demand Base (1000mt) 5485 6050 6875 Scenario1: Increased Per Capita Cons. 4.26% 10.73% 17.61% Scenario2: Constrained Corn Area -0.01% -0.02% -0.03% Scenario3: Scenario 1 and 2 4.25% 10.71% 17.58% Scenario3: Difference from Base (1000mt) 233 648 1209 Corn Import Demand Base (1000mt) 210 250 492 Scenario1: Increased Per Capita Cons. 131.20% 295.70% 274.50% Scenario2: Constrained Corn Area 60.42% 82.22% 61.59% Scenario3: Scenario 1 and 2 191.70% 378.10% 336.40% Scenario3: Difference from Base (1000mt) 402 944 1654 Soymeal Feed Demand Base (1000mt) 2035 2243 2412 Scenario1: Increased Per Capita Cons. 4.13% 12.23% 17.25% Scenario2: Constrained Corn Area -0.02% -0.03% -0.04% Scenario3: Scenario 1 and 2 4.11% 12.20% 17.21% Scenario3: Difference from Base (1000mt) 84 273 415 Soymeal Import Demand Base (1000mt) 1944 2139 2301 Scenario1: Increased Per Capita Cons. 4.32% 12.83% 18.09% Scenario2: Constrained Corn Area -0.02% -0.03% -0.04% Scenario3: Scenario 1 and 2 4.31% 12.80% 18.04% Scenario3: Difference from Base (1000mt) 84 273 415
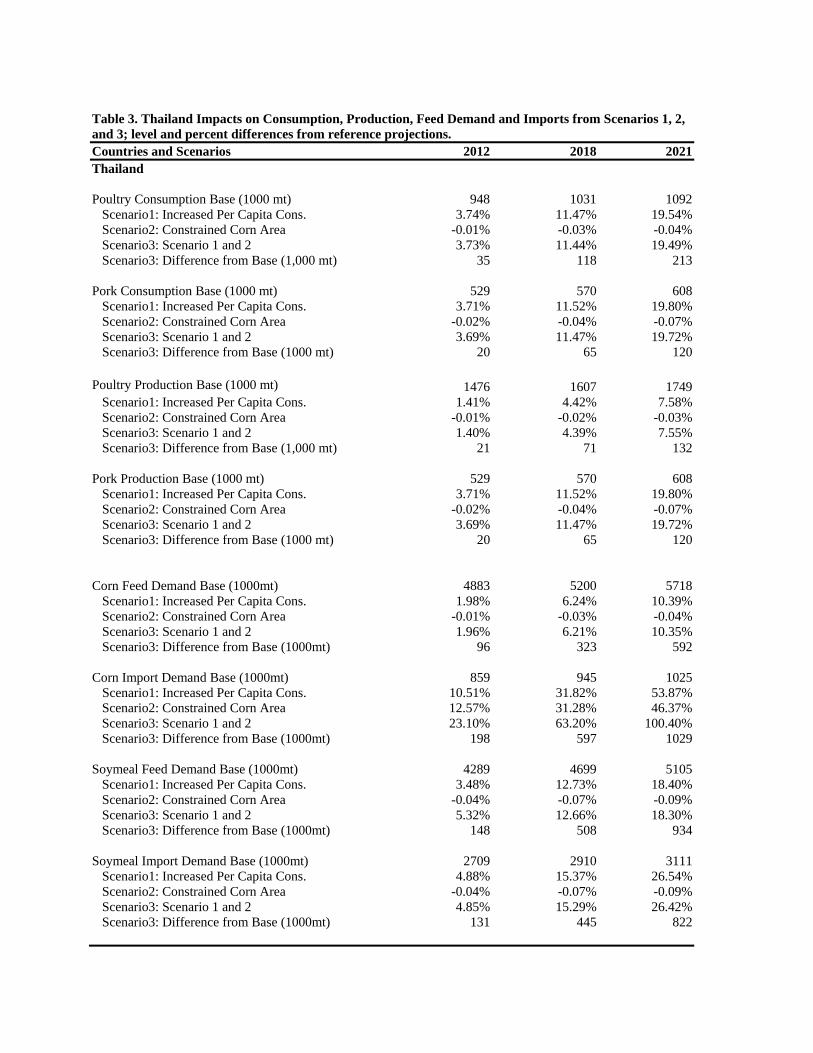
Table 3. Thailand Impacts on Consumption, Production, Feed Demand and Imports from Scenarios 1, 2, and 3; level and percent differences from reference projections.Countries and Scenarios 2012 2018 2021Thailand Poultry Consumption Base (1000 mt) 948 1031 1092 Scenario1: Increased Per Capita Cons. 3.74% 11.47% 19.54% Scenario2: Constrained Corn Area -0.01% -0.03% -0.04% Scenario3: Scenario 1 and 2 3.73% 11.44% 19.49% Scenario3: Difference from Base (1,000 mt) 35 118 213 Pork Consumption Base (1000 mt) 529 570 608 Scenario1: Increased Per Capita Cons. 3.71% 11.52% 19.80% Scenario2: Constrained Corn Area -0.02% -0.04% -0.07% Scenario3: Scenario 1 and 2 3.69% 11.47% 19.72% Scenario3: Difference from Base (1000 mt) 20 65 120 Poultry Production Base (1000 mt) 1476 1607 1749 Scenario1: Increased Per Capita Cons. 1.41% 4.42% 7.58% Scenario2: Constrained Corn Area -0.01% -0.02% -0.03% Scenario3: Scenario 1 and 2 1.40% 4.39% 7.55% Scenario3: Difference from Base (1,000 mt) 21 71 132 Pork Production Base (1000 mt) 529 570 608 Scenario1: Increased Per Capita Cons. 3.71% 11.52% 19.80% Scenario2: Constrained Corn Area -0.02% -0.04% -0.07% Scenario3: Scenario 1 and 2 3.69% 11.47% 19.72% Scenario3: Difference from Base (1000 mt) 20 65 120 Corn Feed Demand Base (1000mt) 4883 5200 5718 Scenario1: Increased Per Capita Cons. 1.98% 6.24% 10.39% Scenario2: Constrained Corn Area -0.01% -0.03% -0.04% Scenario3: Scenario 1 and 2 1.96% 6.21% 10.35% Scenario3: Difference from Base (1000mt) 96 323 592 Corn Import Demand Base (1000mt) 859 945 1025 Scenario1: Increased Per Capita Cons. 10.51% 31.82% 53.87% Scenario2: Constrained Corn Area 12.57% 31.28% 46.37% Scenario3: Scenario 1 and 2 23.10% 63.20% 100.40% Scenario3: Difference from Base (1000mt) 198 597 1029 Soymeal Feed Demand Base (1000mt) 4289 4699 5105 Scenario1: Increased Per Capita Cons. 3.48% 12.73% 18.40% Scenario2: Constrained Corn Area -0.04% -0.07% -0.09% Scenario3: Scenario 1 and 2 5.32% 12.66% 18.30% Scenario3: Difference from Base (1000mt) 148 508 934 Soymeal Import Demand Base (1000mt) 2709 2910 3111 Scenario1: Increased Per Capita Cons. 4.88% 15.37% 26.54% Scenario2: Constrained Corn Area -0.04% -0.07% -0.09% Scenario3: Scenario 1 and 2 4.85% 15.29% 26.42% Scenario3: Difference from Base (1000mt) 131 445 822
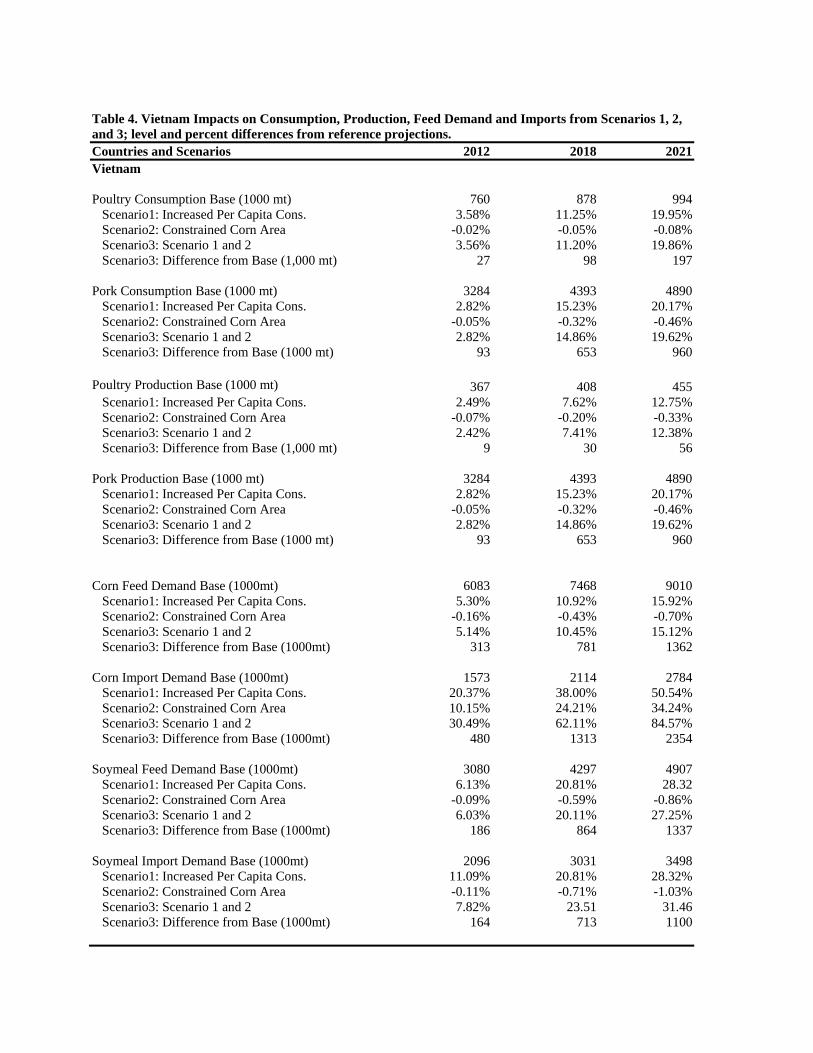
Table 4. Vietnam Impacts on Consumption, Production, Feed Demand and Imports from Scenarios 1, 2, and 3; level and percent differences from reference projections.Countries and Scenarios 2012 2018 2021Vietnam Poultry Consumption Base (1000 mt) 760 878 994 Scenario1: Increased Per Capita Cons. 3.58% 11.25% 19.95% Scenario2: Constrained Corn Area -0.02% -0.05% -0.08% Scenario3: Scenario 1 and 2 3.56% 11.20% 19.86% Scenario3: Difference from Base (1,000 mt) 27 98 197 Pork Consumption Base (1000 mt) 3284 4393 4890 Scenario1: Increased Per Capita Cons. 2.82% 15.23% 20.17% Scenario2: Constrained Corn Area -0.05% -0.32% -0.46% Scenario3: Scenario 1 and 2 2.82% 14.86% 19.62% Scenario3: Difference from Base (1000 mt) 93 653 960 Poultry Production Base (1000 mt) 367 408 455 Scenario1: Increased Per Capita Cons. 2.49% 7.62% 12.75% Scenario2: Constrained Corn Area -0.07% -0.20% -0.33% Scenario3: Scenario 1 and 2 2.42% 7.41% 12.38% Scenario3: Difference from Base (1,000 mt) 9 30 56 Pork Production Base (1000 mt) 3284 4393 4890 Scenario1: Increased Per Capita Cons. 2.82% 15.23% 20.17% Scenario2: Constrained Corn Area -0.05% -0.32% -0.46% Scenario3: Scenario 1 and 2 2.82% 14.86% 19.62% Scenario3: Difference from Base (1000 mt) 93 653 960 Corn Feed Demand Base (1000mt) 6083 7468 9010 Scenario1: Increased Per Capita Cons. 5.30% 10.92% 15.92% Scenario2: Constrained Corn Area -0.16% -0.43% -0.70% Scenario3: Scenario 1 and 2 5.14% 10.45% 15.12% Scenario3: Difference from Base (1000mt) 313 781 1362 Corn Import Demand Base (1000mt) 1573 2114 2784 Scenario1: Increased Per Capita Cons. 20.37% 38.00% 50.54% Scenario2: Constrained Corn Area 10.15% 24.21% 34.24% Scenario3: Scenario 1 and 2 30.49% 62.11% 84.57% Scenario3: Difference from Base (1000mt) 480 1313 2354 Soymeal Feed Demand Base (1000mt) 3080 4297 4907 Scenario1: Increased Per Capita Cons. 6.13% 20.81% 28.32 Scenario2: Constrained Corn Area -0.09% -0.59% -0.86% Scenario3: Scenario 1 and 2 6.03% 20.11% 27.25% Scenario3: Difference from Base (1000mt) 186 864 1337 Soymeal Import Demand Base (1000mt) 2096 3031 3498 Scenario1: Increased Per Capita Cons. 11.09% 20.81% 28.32% Scenario2: Constrained Corn Area -0.11% -0.71% -1.03% Scenario3: Scenario 1 and 2 7.82% 23.51 31.46 Scenario3: Difference from Base (1000mt) 164 713 1100
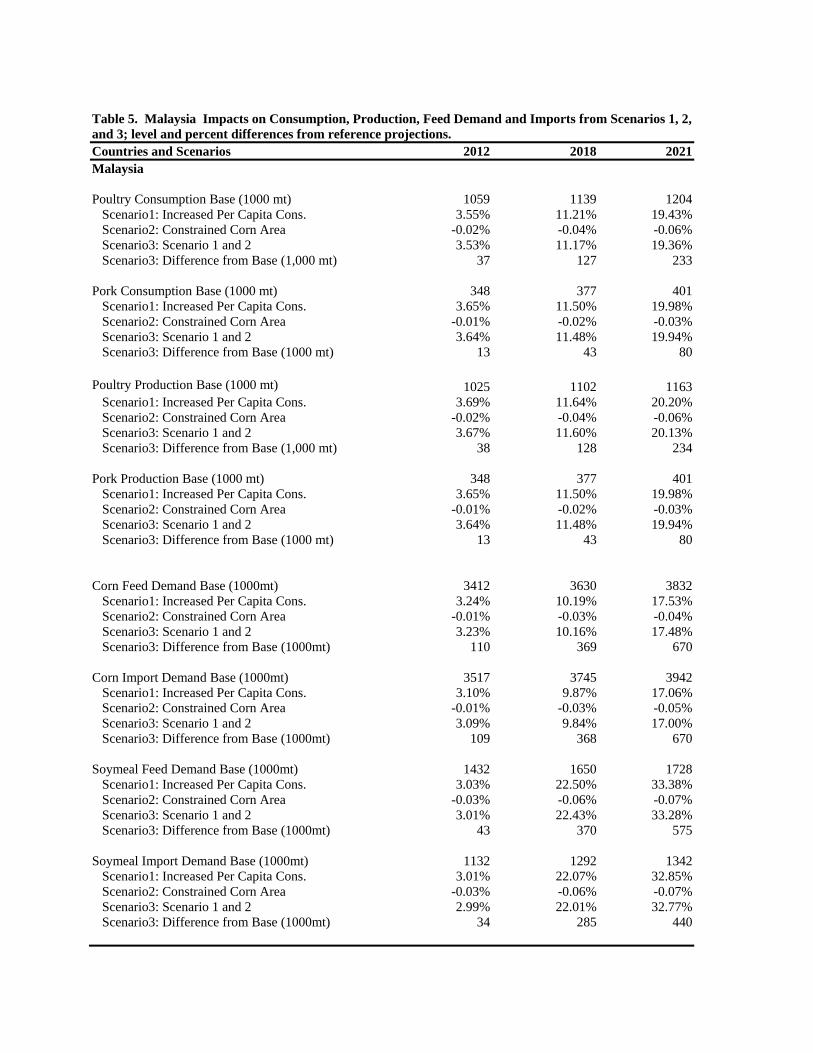
Table 5. Malaysia Impacts on Consumption, Production, Feed Demand and Imports from Scenarios 1, 2, and 3; level and percent differences from reference projections.Countries and Scenarios 2012 2018 2021Malaysia Poultry Consumption Base (1000 mt) 1059 1139 1204 Scenario1: Increased Per Capita Cons. 3.55% 11.21% 19.43% Scenario2: Constrained Corn Area -0.02% -0.04% -0.06% Scenario3: Scenario 1 and 2 3.53% 11.17% 19.36% Scenario3: Difference from Base (1,000 mt) 37 127 233 Pork Consumption Base (1000 mt) 348 377 401 Scenario1: Increased Per Capita Cons. 3.65% 11.50% 19.98% Scenario2: Constrained Corn Area -0.01% -0.02% -0.03% Scenario3: Scenario 1 and 2 3.64% 11.48% 19.94% Scenario3: Difference from Base (1000 mt) 13 43 80 Poultry Production Base (1000 mt) 1025 1102 1163 Scenario1: Increased Per Capita Cons. 3.69% 11.64% 20.20% Scenario2: Constrained Corn Area -0.02% -0.04% -0.06% Scenario3: Scenario 1 and 2 3.67% 11.60% 20.13% Scenario3: Difference from Base (1,000 mt) 38 128 234 Pork Production Base (1000 mt) 348 377 401 Scenario1: Increased Per Capita Cons. 3.65% 11.50% 19.98% Scenario2: Constrained Corn Area -0.01% -0.02% -0.03% Scenario3: Scenario 1 and 2 3.64% 11.48% 19.94% Scenario3: Difference from Base (1000 mt) 13 43 80 Corn Feed Demand Base (1000mt) 3412 3630 3832 Scenario1: Increased Per Capita Cons. 3.24% 10.19% 17.53% Scenario2: Constrained Corn Area -0.01% -0.03% -0.04% Scenario3: Scenario 1 and 2 3.23% 10.16% 17.48% Scenario3: Difference from Base (1000mt) 110 369 670 Corn Import Demand Base (1000mt) 3517 3745 3942 Scenario1: Increased Per Capita Cons. 3.10% 9.87% 17.06% Scenario2: Constrained Corn Area -0.01% -0.03% -0.05% Scenario3: Scenario 1 and 2 3.09% 9.84% 17.00% Scenario3: Difference from Base (1000mt) 109 368 670 Soymeal Feed Demand Base (1000mt) 1432 1650 1728 Scenario1: Increased Per Capita Cons. 3.03% 22.50% 33.38% Scenario2: Constrained Corn Area -0.03% -0.06% -0.07% Scenario3: Scenario 1 and 2 3.01% 22.43% 33.28% Scenario3: Difference from Base (1000mt) 43 370 575 Soymeal Import Demand Base (1000mt) 1132 1292 1342 Scenario1: Increased Per Capita Cons. 3.01% 22.07% 32.85% Scenario2: Constrained Corn Area -0.03% -0.06% -0.07% Scenario3: Scenario 1 and 2 2.99% 22.01% 32.77% Scenario3: Difference from Base (1000mt) 34 285 440
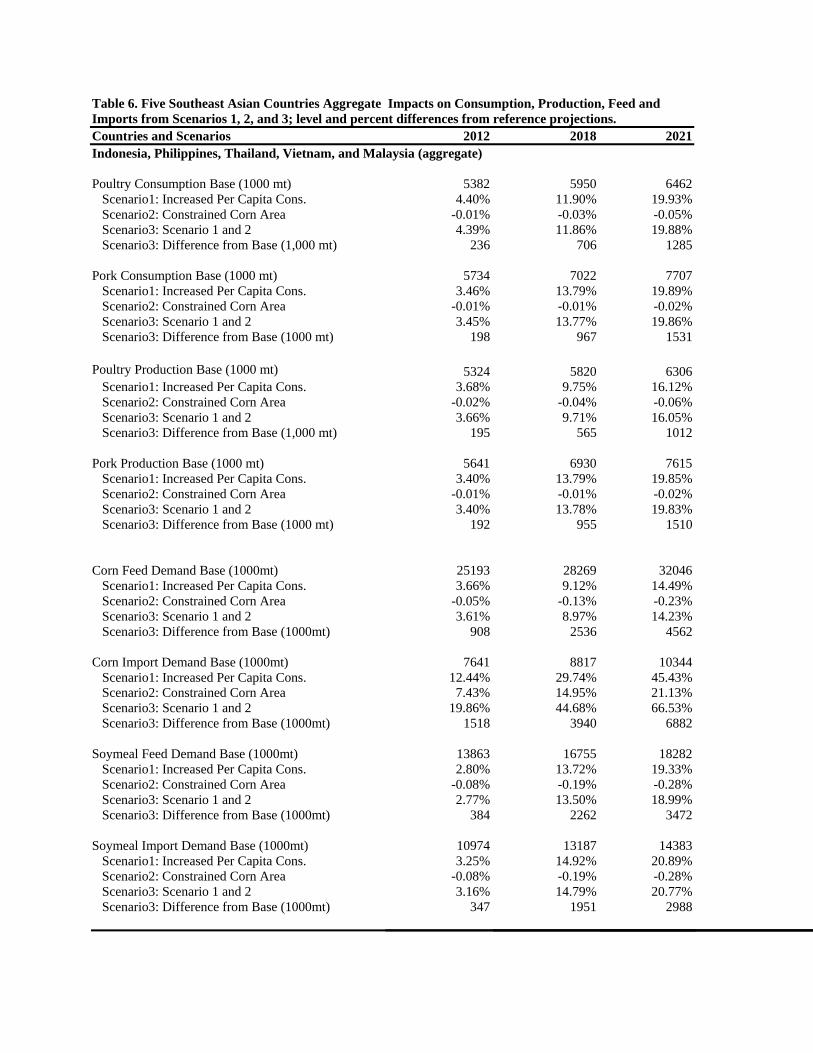
Table 6. Five Southeast Asian Countries Aggregate Impacts on Consumption, Production, Feed and Imports from Scenarios 1, 2, and 3; level and percent differences from reference projections. Countries and Scenarios 2012 2018 2021Indonesia, Philippines, Thailand, Vietnam, and Malaysia (aggregate) Poultry Consumption Base (1000 mt) 5382 5950 6462 Scenario1: Increased Per Capita Cons. 4.40% 11.90% 19.93% Scenario2: Constrained Corn Area -0.01% -0.03% -0.05% Scenario3: Scenario 1 and 2 4.39% 11.86% 19.88% Scenario3: Difference from Base (1,000 mt) 236 706 1285 Pork Consumption Base (1000 mt) 5734 7022 7707 Scenario1: Increased Per Capita Cons. 3.46% 13.79% 19.89% Scenario2: Constrained Corn Area -0.01% -0.01% -0.02% Scenario3: Scenario 1 and 2 3.45% 13.77% 19.86% Scenario3: Difference from Base (1000 mt) 198 967 1531 Poultry Production Base (1000 mt) 5324 5820 6306 Scenario1: Increased Per Capita Cons. 3.68% 9.75% 16.12% Scenario2: Constrained Corn Area -0.02% -0.04% -0.06% Scenario3: Scenario 1 and 2 3.66% 9.71% 16.05% Scenario3: Difference from Base (1,000 mt) 195 565 1012 Pork Production Base (1000 mt) 5641 6930 7615 Scenario1: Increased Per Capita Cons. 3.40% 13.79% 19.85% Scenario2: Constrained Corn Area -0.01% -0.01% -0.02% Scenario3: Scenario 1 and 2 3.40% 13.78% 19.83% Scenario3: Difference from Base (1000 mt) 192 955 1510 Corn Feed Demand Base (1000mt) 25193 28269 32046 Scenario1: Increased Per Capita Cons. 3.66% 9.12% 14.49% Scenario2: Constrained Corn Area -0.05% -0.13% -0.23% Scenario3: Scenario 1 and 2 3.61% 8.97% 14.23% Scenario3: Difference from Base (1000mt) 908 2536 4562 Corn Import Demand Base (1000mt) 7641 8817 10344 Scenario1: Increased Per Capita Cons. 12.44% 29.74% 45.43% Scenario2: Constrained Corn Area 7.43% 14.95% 21.13% Scenario3: Scenario 1 and 2 19.86% 44.68% 66.53% Scenario3: Difference from Base (1000mt) 1518 3940 6882 Soymeal Feed Demand Base (1000mt) 13863 16755 18282 Scenario1: Increased Per Capita Cons. 2.80% 13.72% 19.33% Scenario2: Constrained Corn Area -0.08% -0.19% -0.28% Scenario3: Scenario 1 and 2 2.77% 13.50% 18.99% Scenario3: Difference from Base (1000mt) 384 2262 3472 Soymeal Import Demand Base (1000mt) 10974 13187 14383 Scenario1: Increased Per Capita Cons. 3.25% 14.92% 20.89% Scenario2: Constrained Corn Area -0.08% -0.19% -0.28% Scenario3: Scenario 1 and 2 3.16% 14.79% 20.77% Scenario3: Difference from Base (1000mt) 347 1951 2988
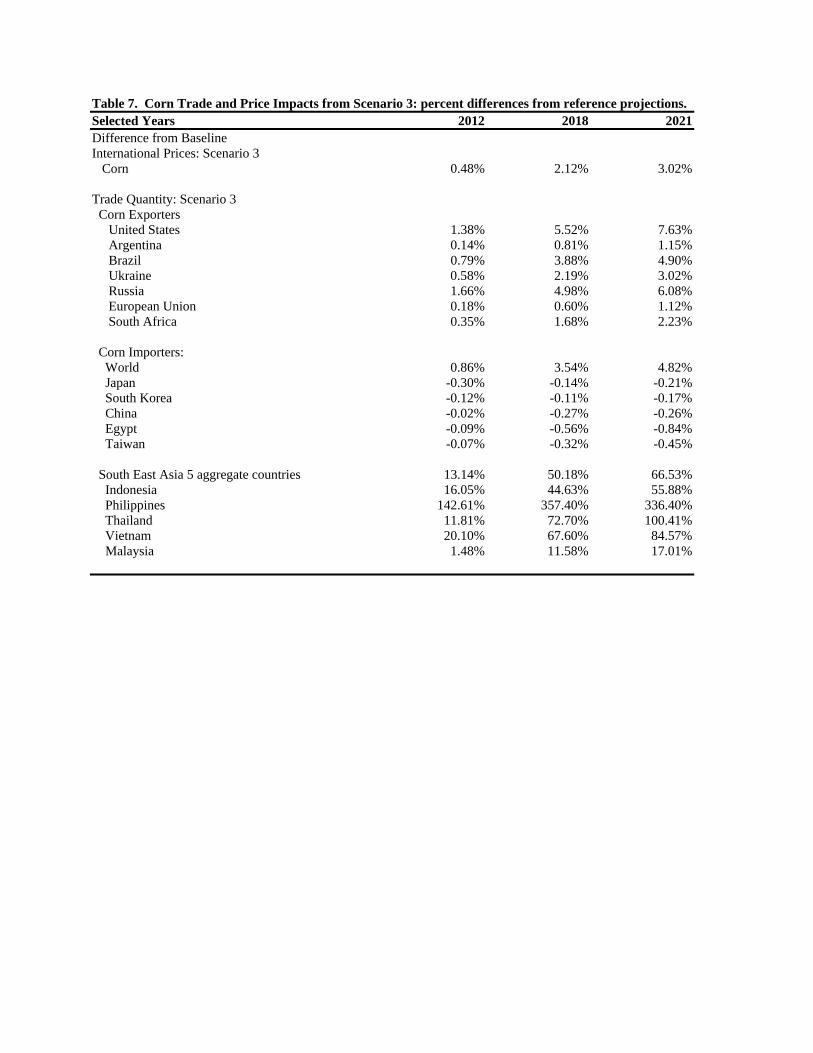
Table 7. Corn Trade and Price Impacts from Scenario 3: percent differences from reference projections. Selected Years 2012 2018 2021Difference from Baseline International Prices: Scenario 3 Corn 0.48% 2.12% 3.02% Trade Quantity: Scenario 3 Corn Exporters United States 1.38% 5.52% 7.63% Argentina 0.14% 0.81% 1.15% Brazil 0.79% 3.88% 4.90% Ukraine 0.58% 2.19% 3.02% Russia 1.66% 4.98% 6.08% European Union 0.18% 0.60% 1.12% South Africa 0.35% 1.68% 2.23% Corn Importers: World 0.86% 3.54% 4.82% Japan -0.30% -0.14% -0.21% South Korea -0.12% -0.11% -0.17% China -0.02% -0.27% -0.26% Egypt -0.09% -0.56% -0.84% Taiwan -0.07% -0.32% -0.45% South East Asia 5 aggregate countries 13.14% 50.18% 66.53% Indonesia 16.05% 44.63% 55.88% Philippines 142.61% 357.40% 336.40% Thailand 11.81% 72.70% 100.41% Vietnam 20.10% 67.60% 84.57% Malaysia 1.48% 11.58% 17.01%
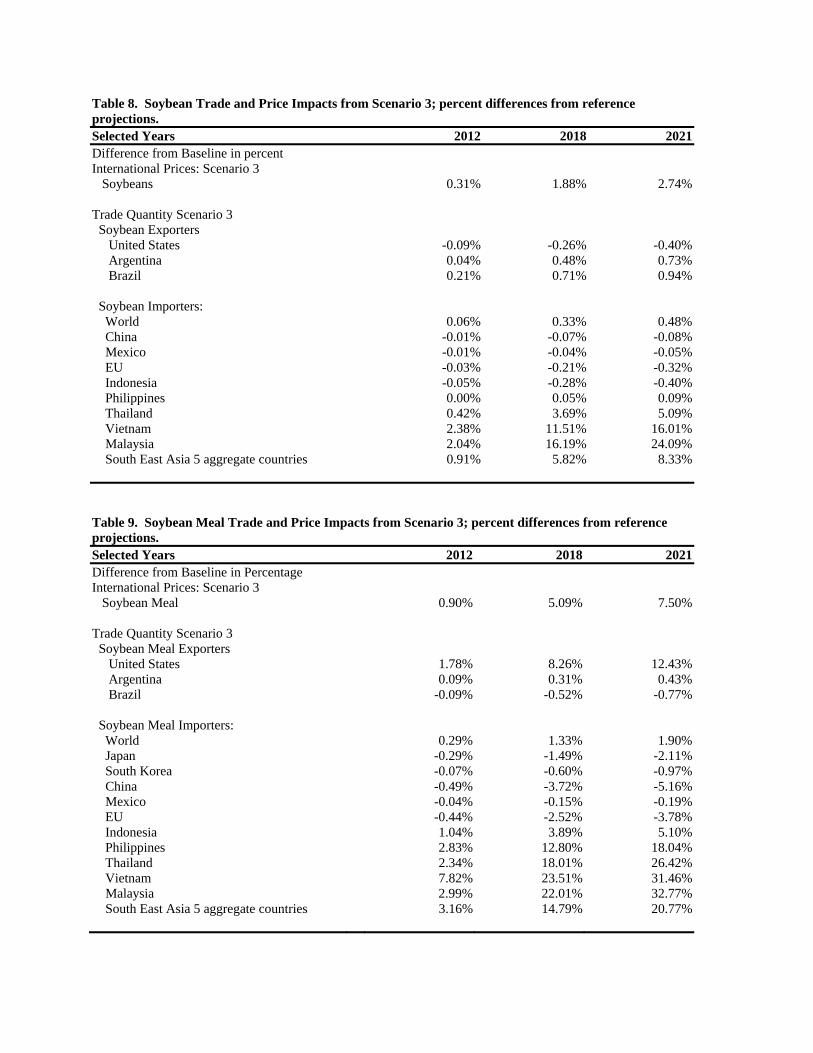
Table 8. Soybean Trade and Price Impacts from Scenario 3; percent differences from reference projections. Selected Years 2012 2018 2021Difference from Baseline in percent International Prices: Scenario 3 Soybeans 0.31% 1.88% 2.74% Trade Quantity Scenario 3 Soybean Exporters United States -0.09% -0.26% -0.40% Argentina 0.04% 0.48% 0.73% Brazil 0.21% 0.71% 0.94% Soybean Importers: World 0.06% 0.33% 0.48% China -0.01% -0.07% -0.08% Mexico -0.01% -0.04% -0.05% EU -0.03% -0.21% -0.32% Indonesia -0.05% -0.28% -0.40% Philippines 0.00% 0.05% 0.09% Thailand 0.42% 3.69% 5.09% Vietnam 2.38% 11.51% 16.01% Malaysia 2.04% 16.19% 24.09% South East Asia 5 aggregate countries 0.91% 5.82% 8.33% Table 9. Soybean Meal Trade and Price Impacts from Scenario 3; percent differences from reference projections. Selected Years 2012 2018 2021Difference from Baseline in Percentage International Prices: Scenario 3 Soybean Meal 0.90% 5.09% 7.50% Trade Quantity Scenario 3 Soybean Meal Exporters United States 1.78% 8.26% 12.43% Argentina 0.09% 0.31% 0.43% Brazil -0.09% -0.52% -0.77% Soybean Meal Importers: World 0.29% 1.33% 1.90% Japan -0.29% -1.49% -2.11% South Korea -0.07% -0.60% -0.97% China -0.49% -3.72% -5.16% Mexico -0.04% -0.15% -0.19% EU -0.44% -2.52% -3.78% Indonesia 1.04% 3.89% 5.10% Philippines 2.83% 12.80% 18.04% Thailand 2.34% 18.01% 26.42% Vietnam 7.82% 23.51% 31.46% Malaysia 2.99% 22.01% 32.77% South East Asia 5 aggregate countries 3.16% 14.79% 20.77%
Recommended