this version: 13 October 2006
Assessing the distributional impact of “imputed rent” and “non-cash employee income” in micro-data:
Case studies based on EU-SILC (2004) and SOEP (2002)
by Joachim R. Frick*,1,2, Jan Goebel1, Markus M. Grabka1
Paper prepared for the International Conference:
"Comparative EU-Statistics on Income and Living Conditions: Issues and Challenges,"
Helsinki, 6-8 November 2006.
DRAFT – DO NOT QUOTE WITHOUT PERMISSION OF AUTHORS 1 SOEP at DIW Berlin, 2 TU Berlin and IZA Bonn * Corresponding author <[email protected]> Mail Address: c/o DIW Berlin, Department SOEP, Königin-Luise-Str. 5, 14195 Berlin, Germany.
2
Extended Summary
There is general agreement about the importance of integrating non-monetary
income components into cash-based income measures in order to improve the comparability
of distribution results across time and space. Based on micro-data from the first round of
EU-SILC (EU Statistics on Income and Living Conditions) collected in 12 EU countries in
2004 and placing strong emphasis on methodological aspects of determining non-cash
incomes, this paper investigates the incidence, scope and distributional impact of “imputed
rent” and “private use of company cars”.
Imputed rent can be calculated using a variety of approaches. Thus in the present
paper EU-SILC-based results for Denmark, France and Finland – with each of these
countries applying a different method – are contrasted to findings derived from the 2002
wave of the German Socio-Economic Panel Study (SOEP). This makes it possible to
operationalize three different methods for the very same population, thus supporting
sensitivity analyses keeping all other influential factors constant. In general, there is a
tendency toward decreasing inequality and poverty once including imputed rent in the
income measure. Inequality decomposition by age shows a rising income advantage from
owner-occupied housing (including tenants with reduced rent payments) for the elderly,
confirming the importance of owner-occupied (and reduced rent) housing as a means of old
age provision.
However, while we can identify some cross-national differences, we cannot clearly
determine the degree to which the variation between Denmark, Finland, and France actually
depends on the choice of the methodology applied to measure IR. A further complication
results from the fact that for Denmark and Finland, only a gross measure of IR is given in
the currently available EU-SILC data, while for France, a net measure is included.
Apparently a gross measure is not appropriate for the type of welfare-oriented analysis
presented here. Furthermore, we find evidence that the substantive results on inequality are
3
sensitive to the choice of the approach in the German data, thus supporting the principal
demand for an extensively harmonized measure across countries.
Results for “company cars” show a great deal of variety in the incidence of this non-
cash employee income component (as low as 2 to 3% in Ireland and Norway and as much as
25% in Finland and Sweden). While this income source accounts for not more than 2% of
overall compensation in any of the countries considered, there is a general finding that the
additional consideration of “company cars” in the employee income measure yields higher
degrees of wage dispersion.
Concluding, the empirical assessment of EU-SILC data demonstrates the relevance
of including non-cash components when comparing income and wage distribution results
across Europe. At the same time, it becomes apparent that cross-national comparability is
very much a matter of data availability (e.g., for a measure of net IR, this pertains to
information about the relevant costs to be deducted at the micro-level) as well as the
national framework (e.g., size of the private rental market as basis of the opportunity cost
approach to generating IR). As such, any deviation from a generally proposed approach to
capture such non-cash income effects will have to be well justified so as not to jeopardize
cross-national comparability. However, given explicit cross-national variation, e.g., in the
tax and transfer regimes, “functional equivalents” for capturing non-cash income
components are being sought, and not necessarily “national applications of pre-defined
algorithms”.
4
Contents 1 Why consider non-cash income components at all? ........................................................5 2 The case of “imputed rent” (IR).......................................................................................7
2.1. Principles...................................................................................................................7 2.1.1 The “rental equivalence method” or “opportunity cost” approach..................8 2.1.2 The “user cost method” or “capital market” approach ....................................9 2.1.3 The “self-assessment” approach ....................................................................11 2.2. Empirical implementation in EU-SILC 2004 and SOEP 2002...............................11 2.2.1 Methods used in EU-SILC 2004....................................................................12 2.2.2 Methods applicable to SOEP 2002 ................................................................15 2.3. Imputed Rent: Comparative inequality analyses based on EU-SILC and SOEP ...19 2.4. Concluding methodological comments on IR.........................................................26
3 The case of “company cars” (CC) .................................................................................29 3.1. Empirical application using EU-SILC....................................................................30 3.2. Company Cars: Comparative inequality analyses based on EU-SILC...................31
4 Conclusions and perspectives .......................................................................................34 References..............................................................................................................................37 Annex:....................................................................................................................................38
Annex 1: Mortgage interest of an annuity (a stylized case)...........................................38 Annex 2: Non-cash employee income in EU-SILC.......................................................39
5
“If net imputed rent is included in income, one must be careful that it is measured in a way that leads to greater international standardization instead of nation-specific measures of its value”
(Smeeding and Weinberg 2001, p. 12).
1 Why consider non-cash income components at all?
Empirical research on economic inequality almost always relies on monetary income
measures (sometimes also consumption expenditures), largely ignoring income in kind.
Exceptions to this rule may arise, for example, when incorporating the face value of US
food stamps as a kind of near-cash income. By and large, however, there is agreement about
the importance of integrating non-monetary income components into cash-based income
measures. It offers the chance to improve the comparability of distribution results across
different population subgroups at a given point in time, as well as across time and space,
that is, across regions or countries (see e.g., Smeeding & Weinberg 2001, and the
recommendations of the Canberra Group 2001 on how to establish household income
statistics for comparative purposes). Non-cash income advantages may stem from either
privately or publicly provided sources or transfers, and may be related e.g., to the provision
of goods and services in the health, education, or housing sector. Improved statistical
coverage of these issues is seen as crucial within the framework of welfare comparisons
across EU member states and the respective National Action Plans for Social Inclusion
(NAP-Incl). There is ample evidence that cash and non-cash public transfers vary
substantially across Europe. Thus, any statistical conceptualization of welfare comparisons
in the form of micro-data for comparative research, such as the ECHP and EU-SILC, will be
biased if based solely on monetary income, and will provide inconsistent time series if the
harmonization of social policies played a role in changing the policy instruments used (e.g.,
when moving from in-kind to cash transfers or vice versa).1 Designed to address these
1 It must be noted that such interregional variation may be relevant not only at the cross-national level but also within countries. A very illustrative example is given by the substantially different instruments used for housing subsidization in Germany. On the one hand, “object subsidization” by means of social housing (where the construction of the building was subsidized and renters pay below-market rent over a specified period) was
6
issues, the recently launched pan-European research project AIM-AP (Accurate Income
Measurement for the Assessment of Public Policies)2 includes studies focusing on both the
individual and combined distributional impacts of an improved incorporation of non-cash
income components in the areas of education, health, housing, home production and fringe
benefits in a number of EU member states. The project also investigates the possibility of
considering non-cash incomes in the existing integrated European tax benefit model
(EUROMOD, see Immervoll et al 1999).
The present paper focuses on two specific types of non-cash income that are or will
be included in EU-SILC: “imputed rent” and “non-cash employee income”. The first
component can be summarized as the income advantages enjoyed by households residing
either in owner-occupied housing or in rental housing paying below-market rent. The
second component encompasses non-cash elements of employee income provided by
employers for free or at a reduced price as part of the employee compensation package. In
the 2004 EU-SILC definition, however, this latter component merely contains the “private
use of company cars”.3 After describing the principles and actual implementation of both
non-cash components in EU-SILC 2004 and SOEP 2002, we will focus on the incidence and
relevance as well as the impacts of both of these non-cash components on the overall
income distribution. Section 2 deals with imputed rent (IR) and Section 3 with non-cash
employee income (here: company cars). Section 4 draws preliminary conclusions on the
future harmonization of such measures in light of the need for improved cross-national
comparability.
the preferred approach for decades in West Germany. In more recent times, however, needy households are granted direct (monetary) subsidization through housing allowances. As such, any (interregional) comparison between West and East Germany focusing only on monetary income will be biased in favor of East Germany. 2 This project is funded by the European Commission within the 6th framework program, priority 7: Citizens and Governance in a knowledge based society, Contract No CIT5-CT-2005-028412 and coordinated by Holly Sutherland, University of Essex/ISER. 3 Obviously, there exists a link between these two areas, given that employer-provided housing at a reduced rent may be considered under both frameworks. In fact, an investigation by Eurostat showed that Finland and France consider including employer-provided housing advantages in the measure of non-cash employee income (variable HY030) to be more appropriate than inclusion in imputed rent (variable HY030). As important as this will be for cross-national comparison, we will not further investigate this issue in the present paper.

7
2 The case of “imputed rent” (IR)
2.1. Principles
When dealing with income advantages derived from housing, the COMMISSION
REGULATION (EC) No. 1980/2003 defines imputed rent as follows: “The imputed rent
refers to the value that shall be imputed for all households that do not report paying full
rent, either because they are owner-occupiers or they live in accommodation rented at a
lower price than the market price, or because the accommodation is provided rent-free. The
imputed rent shall be estimated only for those dwellings (and any associated buildings such
a garage) used as a main residence by the households. The value to impute shall be the
equivalent market rent that would be paid for a similar dwelling as that occupied, less any
rent actually paid (in the case where the accommodation is rented at a lower price than the
market price), less any subsidies received from the government or from a non-profit
institution (if owner-occupied or the accommodation is rented at a lower price than the
market price), less any minor repairs or refurbishment expenditure which the owner-
occupier households make on the property of the type that would normally be carried out by
landlords. The market rent is the rent due for the right to use an unfurnished dwelling on the
private market, excluding charges for heating, water, electricity, etc.”4
According to this definition, potential beneficiaries of IR include owner-occupiers,
rent-free tenants and tenants with below-market rent, including those who live in public or
social housing as well as those who have been granted a rent reduction by their respective
landlord (e.g., relatives or employer).
4 COMMISSION REGULATION (EC) No 1980/2003 of 21 October 2003 implementing Regulation (EC) No 1177/2003 of the European Parliament and of the Council concerning Community statistics on income and living conditions (EU-SILC) as regards definitions and updated definitions.
8
The approaches discussed in the following have been used to capture IR, both
theoretically and empirically, in the EU-SILC and the SOEP as well as in other micro-
datasets.
2.1.1 The “rental equivalence method” or “opportuni ty cost” approach
The “rental equivalence” method focuses on the opportunity cost of housing in non-
subsidized rental markets. It is often based on a hedonic regression approach, following in
principle a two-step procedure (“regression rental equivalence”):
a) Run a regression model with rent (per housing unit or better, per square meter) as
dependent variable based on the population of tenants in the private, non-subsidized market.
RHS-variables may include a wide range of characteristics of the dwelling, occupancy, and
so on.
b) Apply the resulting coefficients to otherwise similar owner-occupiers. This
procedure may be extended to tenants paying below-market rent. Obviously, this
straightforward approach can be improved by correcting for potential selectivity into the
owner status (e.g., by applying a Heckman selection correction) as well as by considering
measurement error in the imputation process, i.e., by adding an error term to the imputed
rental value, thus maintaining (the proper) variance of the final construct. As mentioned
above, a major advantage of this method is to allow the definition of IR for all potential
beneficiaries including tenants paying no or below-market rent.
An alternative way to derive the gross imputed rental value is to use a stratification
of data on rent paid by “true” tenants, either within the same dataset or as given in external
rental statistics (“stratification rental equivalence”). Stratification variables may include
information on size of the flat/house, year of construction, quality of the building, regional
information and the like. Depending on the size of the underlying data and the distribution
across the various stratification variables, all available households are assigned to one of the

9
strata in which – as a consequence - identical rental data is found. As such, this approach
might suffer from insufficient variation across individual households.
After defining gross imputed rent, either by means of regression or stratification, all
relevant costs need to be deducted in order to obtain the required net measure of IR. This
includes specific costs such as operating and maintenance (excluding heating), for both
tenants with below-market rent and owners. Above and beyond this, owner-specific costs
also need to be considered: interest payments from the purchase of the home5, property
taxes6, depreciation (i.e., consumption of fixed capital), etc. It is particularly the deduction
of interest payments within this net calculation that reduces the income advantage derived
from owner-occupied housing. Interest and mortgage payments are especially important
over the course of an entire lifetime, because, with time, total mortgage payments represent
a higher percentage of the total mortgage that has to be paid off, and the level of actual
ownership increases. As a result, older homeowners tend to benefit more from the income
advantages of owner-occupied housing.
2.1.2 The “user cost method” or “capital market” ap proach
This approach has its starting point in the alternative use of capital on the capital market. A
household's decision to move into homeownership represents a trade-off: it means forgoing
the opportunity to invest in financial assets that would create real income flows through
interest or dividends. Taking a capital market approach, Saunders et al. (1992) described
their empirical calculation of imputed interest from homeowner capital tied up in housing as
follows: "Hence the implicit rate of return on housing equity will equal a safe private
market rate of return [...] on an equal value of investment. The annual rate of return which
5 Owner-specific housing costs include the costs of financing the self-occupied home. With respect to IR one needs to differentiate between repayment of a mortgage (amortization which resembles savings) and mortgage interest (considered as consumption). Thus, only interest on mortgages should be deducted from gross imputed rent. 6 Whether property taxes need to be deducted in the EU-SILC data depends on whether this component is already considered in other variables such as HY120 and HY140.
10
is used in this case is approximated by a two per cent real return (two per cent above the
change in overall consumer prices for a country in the year studied). Inflation plus two per
cent was thus multiplied by home equity to estimate imputed rent." (Saunders et al.,
1992:11).
In many microdata sets (e.g., the US PSID), the capital market approach is calculated
based on the current market value of owner-occupied housing, V, as estimated by the
homeowner, deducting any outstanding mortgages, M. Information on the market value of
the home may also be obtained from external statistics: in the BHPS, for example, regional
and county-level housing prices are used to construct estimates of current home value. By
combining this information with details provided by the respondents on home purchases and
mortgages, a value for current outstanding mortgage debt and therefore net housing wealth
or home equity can be generated. In any case, if the resulting value of net home equity, V -
M, is positive, IR is calculated on the basis of this value and a nominal interest rate, I;
otherwise, IR is assigned a value of zero.7
A problem with the capital market approach as applied to the PSID data is that it is
based on the homeowner’s own estimation of the current market value, which may be
subjectively distorted due to the homeowner’s personal affinity to his or her property. This
is especially true for long-time homeowners, who may base their estimations on the original
purchase price and not the value the property would actually have on the market today.8 A
valid net measure of IR would require deduction of all relevant owner-specific costs (see
Section 2.1.1). Besides this potential overestimation, the failure to consider depreciation as
7 Although widely used in income distribution analyses, this method may seriously overestimate the true return on the investment in real estate because applying a nominal interest rate to equity confounds the effect of inflation on returns. Instead of applying a nominal interest rate, i, to total home equity given by the difference of market value, V, and outstanding mortgages, M, this nominal interest rate may be applied to the outstanding mortgage only, while the calculation of the return on the investment in housing needs to consider inflation, i.e., the real interest rate, r, should be applied to the dwelling’s current market value, V. Obviously, even in the absence of taxation, i (V - M), is different from (r V) – (i M). By definition, the latter measure will produce smaller estimates for IR (see Frick & Grabka, 2003 for an illustration of this differential treatment of V and M in case of the PSID). 8. Kiel and Zabel (1999) provide evidence that the self-estimates by US homeowners slightly overestimate actual house prices by approximately 5 percent. Recent buyers report house values 8.4 percent higher than the stated sales prices. Length of tenure has a significantly negative effect on owners’ valuation.
11
the building ages may be an additional inherent problem of this approach. Finally, it should
be noted that this approach can be used only for owner-occupiers.
2.1.3 The “self-assessment” approach
This approach is based on rather simple questions addressed to either owners or
tenants. Owner-occupiers, for example, are asked for a fictitious market rent if they were to
rent their accommodation. A valid net measure of IR for owners would require deduction of
all relevant owner-specific costs (see Section 2.1.1).
Subsidized tenants would be asked for an assessment of what their “normal rent”
(market rent) would be if their rent payments were not subsidized. In this case, IR would be
derived on the basis of the difference between actual rent paid and self-assessed market rent.
2.2. Empirical implementation in EU-SILC 2004 and SOEP 2002
In the following section, the empirical implementation of IR in EU-SILC and SOEP is
described. Although a measure of IR is slated for inclusion in EU-SILC 2007, in the 2004
version it is only available for Denmark, Finland, and France. Furthermore, each of these
countries uses a different approach, and gross measures are used for IR in Finland and for
owners in Denmark (i.e., not deducting interest payments on mortgages) while the French
version is yet the only one providing the targeted net measure. In the case of SOEP, all three
approaches described above can be operationalized as net measures for the survey year 2002
which allows for effective sensitivity analysis with respect to the choice of methodology.
The German SOEP is the longest-running European household panel. This annual
survey was started in 1984, and in 2005, interviews were conducted with about 11,400
households and more than 21,000 adult respondents. Detailed information is available at
http://www.diw.de/gsoep and in Haisken-DeNew & Frick (2005); recent developments and
12
plans for further enhancements of this survey are described in Wagner, Frick & Schupp
(2006).
2.2.1 Methods used in EU-SILC 2004
According to the results of a questionnaire on the “Methodology to estimate imputed
rent for EU-SILC (target variable HY030G/HY030N)” distributed by Eurostat to all
member states in February 2006, the statistical offices of Denmark, Finland and France use
the following approaches9.
Denmark
Except for the answers to the above-mentioned Eurostat questionnaire, there is no
information available on the Danish approach10. The approach currently applied by Statistics
Denmark for EU-SILC is a mixture of the “user cost method” for owner-occupiers and the
“self-assessment method” for tenants (whereas the “rental equivalence method” is used for
the Household Budget Survey and in National Accounts). Imputed rent for owners is in
principle calculated as 4% of the taxable value of the property, which is considered a
“relatively good estimate of the market value” (Statistics Denmark). These property values
are provided by the municipalities. Tenants are asked whether their rent payments
correspond approximately to market rent, or whether they enjoy any kind of reduction
(including rent-free housing). Those paying reduced rent are asked to state the difference
between “normal rent” and “rent actually paid”. This value is taken as imputed rent for
tenants. Although Statistics Denmark considers this approach to be “most feasible and
transparent in the case of Denmark”, it obviously does not consider any relevant costs
involved, leaving a gross measure of IR, which by definition overstates the income
advantage as such and most likely the share of beneficiaries as well.
9 Thanks to Jean-Marc Museux (Eurostat) for being very supportive in providing helpful information. 10 However, it should be noted that Statistics Denmark has established a task force with experts from the Household Budget Survey, National Accounts and the SILC-project that is currently (re)considering its position concerning imputed rent in the SILC-data set.
13
Finland11:
Statistics Finland uses the same method to impute IR in all its statistics, namely the
“stratification rental equivalence approach”, drawing on information from an external data
source. Based on average market rent per square meter as given in the rent statistics of
Statistics Finland, households are stratified into a total of 128 strata constructed from the
following variables: year of construction (6 classes); number of rooms (4 classes); dwelling
type (3 classes); region (2 classes). Every owner-occupier and tenant household in a given
stratum of the EU-SILC dataset is assigned the same value of gross rent per square meter
(excluding costs for heating, water, electricity, etc). From this imputed rental equivalence
value, the following costs (and the source/method to generate this cost component) are
deducted: depreciation (imputed); minor repairs and structural insurance (mean imputation
based on HBS); maintenance charges, ground rent, extra heating costs (all asked in
SILC/IDS). Finally, from the resulting gross imputed rent (SILC-variable HY030G), interest
paid on mortgage (derived from register information and stored in SILC-variable HY100G)
needs to be deducted, yielding a household-specific value for net imputed rent. This variable
in EU-SILC is HY030N, but in the data version available to the authors, this net value is not
generated for Finland. In order to control for the relevance of considering this component,
the following analysis will consider both gross as well as net imputed rent for Finland (the
latter calculated by the authors as described above). We will attempt to answer the empirical
question of the degree to which the gross version overstates the share of households with
this income advantage, as well as the “true” value of the income advantage.
Imputed rent for Finnish tenants who pay below-market rent and have leased their
homes from another private household are given an imputed rental value calculated as the
maximum difference between estimated gross rent and rent actually paid (in case of
negative differences an imputed rent of zero is assigned). For households in social housing,
11 Helpful information was provided by Veli-Matti Tormalehto (Statistics Finland).
14
no imputed rent is calculated at all, since – according to the national Finnish definition – this
implicit income advantage is considered a “social transfer in kind” and thus included in the
corresponding EU-SILC variable. Obviously, given the effective means-testing of social
housing, this (non-)implementation will impact on the share of renters benefiting from IR as
well as on their respective income position and overall inequality.
France
In France, the regression-based “rental equivalence method” is used to generate net
imputed rental values, not only in EU-SILC, but also in the Household Budget Survey and
the National Accounts. A description of the French approach, together with an analysis of
the impact of including IR on poverty by tenure status, is given in Marquier (2003). The
underlying hedonic regression of rent is performed on an external data source, the 2002
Housing Survey. This survey includes a set of variables (the “tronc commun des enquêtes-
ménages”) which all households surveys conducted by INSEE have in common, thus
making it possible to export the rent equations to other surveys including EU-SILC. A total
of eight regression models are estimated: a) for houses and flats separately, and b) for the
groups of “owners still paying off their mortgage”, “outright owners”, “tenants in public
housing”, and “other tenants paying reduced rent”. The very comprehensive list of
independent variables includes Household income (5 classes), Year of completion of the
house (7 classes), climate zone (7 classes), nationality (4 classes), degree of urbanization (7
classes), household type (8 classes), occupation (7 classes), employment status (6 classes),
type of work contract (3 classes), marital status (4 classes), number of unemployed persons
in the household, number of persons at work in the household, age of the reference person
of the household (13 classes), diploma of the reference person of the household (9 classes),
type of dwelling (individual or collective), surface of the dwelling, rural/town
centre/subway.
15
A Heckman correction is not applied, and depreciation (consumption of fixed capital)
is not considered. Although the IR measure for France is considered the net of all relevant
costs, it is unfortunately not clear from the documentation in the Eurostat questionnaire
which costs actually have been deducted from gross imputed rent.
2.2.2 Methods applicable to SOEP 2002
With the SOEP 2002 data, three of the above-mentioned methods can be implemented: the
regression-based “opportunity cost approach”, the “capital market approach”, and the “self-
assessment approach”. While the first method makes it possible to define IR for owner-
occupiers as well as for any tenant living either at reduced rent or rent-free, the
implementation of two other approaches define IR for owner-occupiers only. In the
following, these approaches are described in greater detail:
(a) The regression-based opportunity cost approach
Implementation of the opportunity cost approach for Germany relies on a hedonic
regression estimation of the logged gross rent per square meter (not including costs for
heating and warm water) actually paid by main tenants in privately financed housing
(excluding social housing and any households with reduced rent). RHS variables include:
condition of building, size of housing unit in square meters, year of construction, occupancy
in years12, community size, regional information about levels of market rent (six
classifications), city centre, East vs. West Germany, type of house, basic amenities (central
heating, yard, etc.), disposable income, nationality of head, SOEP subsample identifiers. In
order to control for eventual selection into the state of ownership, a Heckman selection
correction is applied. In the regression we also control for eventual clustering effects at the
regional (county) level.
12 By controlling for years of occupancy we partially control for potential “tenure discount” effects.
16
Applying the resulting regression coefficients to the population of otherwise
comparable owner-occupiers and subsidized tenants yields an estimate of the gross value at
market prices (without costs of heating and hot water), thereby avoiding distortions resulting
from subjective estimations by the homeowners. In order to maintain variation in the
resulting estimates of IR, a randomly chosen error term from the true distribution of renters
is added. Finally, multiplying the inverse of the estimated monthly fictitious rent by the size
of the housing unit (in square meters) and by the number 12 yields an annual measure of
gross imputed rent.
Finally, all relevant costs must be deducted in order to achieve a net measure of IR.
For owner-occupiers, owner-specific maintenance and operating costs as well as interest on
mortgages and taxes13 need to be considered. Information on interest and mortgage
payments for the previous year serves as the basis for determining the interest payment
levels, which are unfortunately not observed separately in SOEP. Instead, information on
owners’ mortgage repayments is surveyed as monthly loan or mortgage payments including
interest. In order to differentiate amortization from interest, we assume a (German) standard
repayment scheme with a fixed repayment period of 30 years using an annuity scheme
(constant redemption amount). We assume constant payments based on 7% annual interest
and a 1% principal over the course of an average period of 30 years (see Annex 1). In
addition, we assume that mortgage payments begin at the same time as the household moves
into its new home. Thus, in the beginning of the repayment period, interest payments clearly
13 Obviously, tax regimes differ widely across countries with respect to general taxability (what is taxed), tax rate, deductibility of costs related to property purchase, and various forms of promotion of home-ownership. This variability cannot be described to a full extent in this paper. In the case of Germany, the magnitude of tax issues is less relevant: taxes on the acquisition of real estate (Grunderwerbssteuer) need to be paid in the year of purchase (3.5 % of market value), local property taxes (Grundsteuer) are rather low (1% to 1.5% of the tax-relevant property value which is based on a 1936 evaluation scheme that is far below the market value) and net imputed rent is not taxed at all. Mortgage interest is not tax-deductible in Germany. The deduction of relevant costs including taxation as such might vary considerably across countries and should be a major concern for cross-national comparability.

17
exceed the mortgage repayment. As times goes by, the share of the mortgage paid off
increases, leaving an increasing income advantage from IR. 14
Operating, maintenance, and repair costs are taken into account with a lump sum of
approx. 1.60 euros per month/m2 rather than considering real but discretionary investments
by the owners. This might be seen as an alternative way to deal with depreciation. In case of
owner-related costs exceeding the estimated income advantage (especially at the beginning
of the mortgage repayment period), IR is assigned a value of zero (i.e., there is no negative
value of IR).
For rent-free households, we do not deduct any costs, assuming that operating costs
are part of the income advantage. For tenants with below-market rent, IR is defined as the
difference between currently paid rent and estimated fictitious rent (assuming constant
operating costs for renters and owners). Again, if currently paid rent exceeds estimated
market rent, IR is set to zero. Within the group of renters with below-market rent, one can
differentiate “tenants in social housing” and “tenants with rent reductions from relatives or
employers”. In the latter group, we also consider a lump-sum tax of 10% on IR from
company housing for households with a working-age head of household; this tax is to be
paid on fringe benefits in Germany15.
(b) The capital market approach
This approach starts with a self-assessment of the current gross market value of the
housing unit by the respondent. Because this information was only gathered from owner-
occupiers in the 2002 survey year, IR cannot be specified for tenants in SOEP according to
the capital market approach (unless there was reliable external information available which
could be matched to the micro-data). Homeowners who do not own their property outright
14 We do not allow for interest payments if occupancy lasts for more than 30 years or if the property is inherited. However, for cases where the true repayment period is shorter than 30 years, our approach will introduce bias towards an overestimation of interest payments, which in turn will yield lower amounts of IR. 15 In the empirical part of the paper “social housing” and “reduced rent for other reasons” will be analyzed together.
18
are also asked for the outstanding mortgage debt for the self-occupied home.16 The
difference between market value and outstanding mortgage debt gives a measure of net
equity, which is then multiplied by a real interest rate of x% in order to derive IR. For
sensitivity purposes in the following empirical analyses we apply x=2%, 3%, and 4%
respectively. From each we deduct maintenance, operating, and repair costs as described
above for the opportunity cost approach (i.e., lump sum of approx. 1.60 euros/month/ m2).
(c) The self-assessment approach
In the SOEP, owner-occupiers are asked for an estimate of what they think would be the
“monthly rent without heating costs”: And if you lived in this flat or house as tenant: what
do you estimate would be the monthly rent without heating costs ? About …… euros. ”
Starting from this self-assessed gross measure, we again need to deduct maintenance,
operating and repair costs (i.e., lump sum of approx. 1.60 euros/month/m2) and interest
payments on mortgages as described above for the opportunity cost approach. A net
measure of IR is given if the remaining value is positive, otherwise IR is set to zero. Given
the focus on owner-occupiers, this approach does not provide an estimate of IR for tenants.
It must be noted that this self-assessment variable is highly affected by item non-
response: about 22% of all owner-occupiers do not provide a valid answer, most likely
because they lack a sufficient overview of the housing market. Higher non-response on this
question can be found among elderly homeowners, homeowners in rural areas, longtime
homeowners, and homeowners in buildings needing renovation. This can be taken as an
indication that members of these groups know less about the true market value of their
properties, which also tend to be less valuable given the above-mentioned characteristics. In
other words, ignoring this population by assuming randomness of the missing process would
introduce an upward bias in the measure of IR. In order to keep the survey sample
16 In case of item non-response on the market value and the outstanding debt, regression-based multiple imputation methods have been applied (see Frick, Grabka & Marcus 2006).
19
population complete as well as to counter possible selectivity problems, a regression-based
imputation is carried out for these non-responding households.17
2.3. Imputed Rent: Comparative inequality analyses based on EU-SILC and SOEP
There is considerable empirical evidence in the literature about the impact of IR on
substantive research results, especially on income inequality and poverty. International
findings include the following:
o Smeeding et al. (1993): leveling effect on inequality in Germany, Sweden,
Canada, Netherlands
o Meulemans / Cantillon (1993): declining income inequality in Belgium
o Eurostat (1998, 2005): poverty-reducing effects in selected EU countries
o Yates (1994): slightly declining income inequality in Australia
o Frick / Grabka (2003): declining poverty and inequality in Germany, USA, UK).
Somewhat less prominent are the studies that explicitly consider the potential
impacts and interferences of the choice of method, as well as the empirical implementation
of the various built-in assumptions, on substantive research (see Frick & Grabka 2001,
2003, using data for the US, the UK and West Germany, and Eurostat 2006b, using the
Spanish HBS).
A general finding is that the consideration of IR in the income measure, ceteris
paribus, improves the relative income position of the elderly. However, the degree of
“poverty reduction” as well as the impact on overall inequality depend heavily on the
methodology used.
The empirical implementations in this paper allow us to contrast results on the
incidence and relevance of IR as well as its impact on inequality for four countries using
17 The basis are owner-occupiers who provided a valid answer to this self-assessed information; the dependent variable is the logarithmic of the self-assessed market rent per square meter. Covariates coincide with those in the hedonic regression model for the opportunity cost approach. We also assign an error term chosen from the distribution of the true residuals.

20
three distinct methods for varying populations or modifications. Thus, the tables in this
section reflect the following versions:
For Germany, the 2002 SOEP data provide net measures of IR based on:
o a regression-based opportunity cost approach for both owner-occupiers and tenants, as
well as for owner-occupiers only (2 variations)
o a capital market approach (assuming a real interest rate of 2%, 3% and 4% for sensitivity
purposes) for owner-occupiers (3 variations).
o a self-assessment approach for owner-occupiers (1 variation).
Results for these six estimates will be contrasted to those derived from EU-SILC 2004
for the following countries:
o Denmark, using a gross measure of IR based on the “capital market” or “user cost”
approach (computed as 4% of the value of taxable equity) for owner-occupiers and a
self-assessed value for renters in subsidized housing
o Finland, providing a gross (as well as a net) measure of IR based on the stratification
approach (2 variations), but not granting IR to tenants in social housing.
o France, using a net measure of IR resulting from a regression-based “rental equivalence”
or “opportunity cost” approach.
The basic unit for the present study is the individual in the context of his or her
household. Disposable annual income18 as of the previous year is transformed into
equivalent income by applying the modified OECD equivalence scale19. Assuming constant
economies of scale, the same equivalization approach is applied to potential income
advantages derived from IR.
18 In order to reduce the impact of outliers and measurement error in the EU-SILC data, we apply a 1% top and bottom-trimming to equivalent disposable income. 19 A weight of 1.0 is given to the head of household; 0.5 to other household members aged more than 14 years and 0.3 to younger members.

21
After briefly describing the overall distribution of the population by housing tenure
and country (Table 1), we investigate the share of beneficiaries by income decile and age
group (incidence analysis; Table 2). Measuring IR as a share of annual equivalent post-
government income gives information about the relevance of this income source across the
income and age distribution (Tables 3 and 4, respectively). Table 5 focuses on the impact of
IR on a range of inequality and poverty measures20. Inequality and poverty decomposition
by age (Table 6 and Tables 7 to 9, respectively) reveals the relevance of IR as a means of
old-age provision (it must be noted that, in contrast to some of the literature, we explicitly
consider IR for tenants as well).
The impact of IR is presented in Tables 3 to 9 mainly by contrasting the results for
the baseline model (given by the purely cash-based measure) with those derived from the
measure including IR. In other words, we present the absolute value of the respective term
of interest (e.g., income share, poverty risk rate, inequality measure, etc.) as well as the
percentage deviation of the respective results once the non-cash component has been
included.
Housing tenure and IR (Tables 1 and 1a): As expected, the vast majority of
Danes and Finns live in owner-occupied housing (more than two-thirds), followed by the
French (about 60%), and finally Germans, with less than 50%. Less obvious but more
important for the analysis at hand, we find that 10% of the overall population in Germany
live in subsidized rental housing, and that in Finland and France this share is even higher
(17% and 18%, respectively)21.
Table 1a adds information on the share of beneficiaries of IR in the four countries by
tenure status. For Germany, we consider here only the opportunity cost approach, which can
20 For the analyses of inequality with and without IR, we apply some well established measures that are sensitive to income changes at different parts of the distribution: i.e., the Gini coefficient, Mean Log Deviation (MLD) and the Half Squared Coefficient of Variation (Half SCV). Poverty measures as suggested by Foster, Greer & Thorbecke (1984) are applied, with alpha being set to the value of zero (poverty risk rate, FGT0) and to the value of 2 (poverty intensity, FGT2). 21 Unfortunately, the EU-SILC data for Denmark does not allow for a similar differentiation of renters.
22
be extended to renters (see above); for Finland we included both a gross and a net measure
of IR. About 45% of the entire population of Germany enjoys a positive value of IR. Broken
down by tenure status, this is true for three-quarters of all owners and roughly 20% of all
renters. In line with the higher share of owner-occupiers in Denmark, Finland and France,
the overall percentage share of beneficiaries of IR is also much higher in these countries
(between 65% and 74%) than in Germany. A particularly striking result is that almost all
individuals in owner-occupied housing in these three countries enjoy positive IR, which in
Denmark and Finland might be related to the fact that a gross measure of IR is applied. As
such, we also find a slight reduction in the incidence of IR in Finland once a net measure of
IR is employed, although the share is still above 96%. For France, which also considers a
net measure, it is not clear why we find such a high share of IR incidence among owners:
this might be related to a differential treatment of relevant costs (but this point is not
clarified in the Eurostat documentation). Further sensitivity analyses for Germany show that
non-consideration of operating and maintenance costs in the opportunity-cost approach
would yield a share of 85% of owners with positive IR (as compared to 75% once correctly
deducting these costs). This obviously makes a strong case for the harmonized treatment of
such costs. Furthermore, all rent-free tenants enjoy IR in Germany, but this is not the case
in Finland and France, where the corresponding shares are only 74% and 82% respectively.
The share of IR-beneficiaries among tenants with reduced rent payments is – as expected –
very high in Germany and France. However, the above-mentioned treatment of tenants in
social housing in Finland yields a distinctively lower share of IR recipients there.
Beneficiaries from IR: Incidence (Table 2): Across all countries and variations
there is a general tendency for IR to be more prevalent among higher cash incomes. In
Germany, this is also evident when looking at owners only, but there is a leveling effect
when considering tenants as well. This is caused in particular by low-income renters in
23
public or social housing. Comparing the gross and net figures for Finland, we find clear
indications of bias towards higher incomes in the gross measure.
Income effects by income decile and age: Relevance (Tables 3 and 4):
In Germany, the inclusion of IR causes income to rise by about 5% to 7% depending on the
approach taken. There is a tendency for the relevance of IR to decrease with increasing
income. The additional consideration of (mostly low-income) tenants strongly reinforces
this picture. Again, comparing the Finnish results based on gross and net IR, there is clear
indication that gross IR overstates the “true” income advantage among high-income
households. First, the overall income advantage is reduced from 12% using gross IR to 10%
using net IR; but more important, this decrease is concentrated among higher incomes.
Extrapolating this finding to Denmark, where also gross measure is used as well for the
group of owner-occupiers, we can assume that the U-shaped pattern found here might be
“corrected” by employing a net measure.
Table 4 clearly shows the much more pronounced importance of IR for the elderly in
Germany, whose share of IR is twice as high as for the younger cohorts (13% and 6%,
respectively) when using the opportunity cost model for owners and renters. Again the
Finnish data exemplifies the effects of moving from a gross to a net measure: for the elderly,
who have usually already paid off their mortgages, the income advantage remains basically
unchanged, whereas it decreases for younger owners, who tend to still be paying off theirs.
Inequality and poverty effects (Table 5): To start with, it is important to note
that the inequality and poverty results of the baseline models for all countries are in line
with the literature: Denmark and Finland exhibit the lowest degree of inequality and
poverty, followed by France and Germany showing the highest degrees of inequality
(especially at the upper end of the distribution). In principle, including IR yields the
expected decrease in inequality for all countries – and also a surprisingly similar-sized
decrease – no matter what inequality measure is applied. This result is strongly supported by
24
the findings for poverty as measured by the FGT-index: the poverty reduction effect is
positively related to the value of alpha.22
It must be noted that the picture is rather unclear for the capital market approach in
Germany, where we find positive as well as negative changes (but none of them much
different from zero) as well as for the change in the decile ratios in all four countries
considered here.
Inequality decomposition by age (Table 6): As shown above, the inclusion of
imputed rent in the income measure generally tends to decrease inequality and poverty –
except for the case of Denmark. Decomposition of inequality (assessed by the MLD) by age
group shows that the elderly enjoy a rising income advantage resulting from owner-
occupied housing and reduced-rent housing, emphasizing the importance of owner-occupied
housing as a means of old-age provision. All these results are in line with those presented in
Eurostat (2006) based on the Spanish HBS as well as in Frick & Grabka (2003) for the US,
the UK, and West Germany. While inequality decomposition results for the middle age
groups change least in Germany, France, and Finland when including IR, we also find
increasing inequality among the young population in Finland and France. In line with the
findings above, the Finnish data shows a stronger reduction in between-group inequality
when including a net measure of IR as compared to a gross measure (which overstates the
true income advantage of the younger rich). The results for Denmark appear to be an outlier,
given that decomposition shows an increase in inequality for all three age groups once IR is
included. It is not clear whether this is due to the gross nature of the IR measure.
Poverty risk rate and poverty intensity by age (Tab les 7 and 8): The
baseline models show very similar poverty risk rates for the elderly in all countries (about
15% to 17%), whereas in Germany, it is the youth who have the highest risk rates (21%). In
all countries, the middle-aged population experiences the lowest risk of living in poverty.
22 Decreasing poverty (risk rate and intensity) due to inclusion of IR is given by definition, since we keep the poverty line from the baseline model constant for this exercise.
25
The results for poverty intensity (using FGT2) are also very similar across countries, with
the elderly being “less poor” than the middle-aged. As mentioned above, we keep the
poverty line constant after including IR, and as such – almost by definition – poverty risk
and intensity are reduced. However, the degree of this change varies considerably across age
groups. In line with our previous results, in all variations, children appear to improve the
least from the inclusion of IR.
Poverty Decomposition (based on FGT2) by age (Table 9): This conclusion
is strongly confirmed when decomposing poverty intensity before and after introducing IR
into the income measure. In all countries’ baseline models, the contribution of the youth to
aggregate poverty exceeds 40% although their respective population share varies between
just 26% and 30%. After inclusion of IR, their contribution to aggregate poverty rises by as
much as 7% in Denmark, 10% in Germany, 14% in France and even 27% in Finland. On the
other end of the age distribution, we find the expected corresponding massive reduction in
poverty intensity for the elderly (ranging from –34% in Germany to –55% in Finland).
Again, this is to be interpreted as evidence that personal investments in property constitute a
very effective means of old-age provision. These findings are perfectly in line with those of
Zaidi et al (2006) for Denmark (also using EU-SILC data), who find a 25% to 10%
reduction in the poverty risk rate among the elderly due to including the IR of men aged 75
and over (the corresponding figures for women of this age group are 22% and 9%,
respectively).
Inequality Rankings (Tables 10 and 10a): From a cross-national comparative
perspective, it is useful to look at whether the inclusion of IR in the monetary equivalent
post-government income measure yields a different ranking of countries according to
inequality from the baseline model using cash income only. Focusing first on the results for
the entire population, Table 10 reveals that country rankings according to Gini, MLD and
Half SCV do not change at all when considering IR, although the rankings for the three
26
measures do not coincide perfectly (Denmark and Finland swap ranks when using MLD
instead of Gini and Half SCV). However, there are indications of re-ranking of countries
due to consideration of IR when looking at various age groups (Table 10a): assessing
inequality by means of the MLD, it now appears that in the middle-aged population (25-64
years) Denmark and Finland trade places, and the same is true for the elderly in France and
Germany.
2.4. Concluding methodological comments on IR
Germany: The preferred method of defining net IR for Germany on the basis of
SOEP data is the regression-based opportunity cost approach. This approach can be
implemented using a set of standard variables available in most population surveys; it also
can easily be applied to tenants with below-market rent (including rent-free tenants) which
is especially interesting for longitudinal research on income mobility in case of changing
tenure status. Limitation of the implementation of this approach for countries with small
private rental markets do not apply for Germany, where this share is more than 50% of the
housing market and represented accordingly strong in the SOEP micro-data.
However, from a methodological point of view, it is most interesting to realize some
conflicting results across the various methods. For Germany, where we can apply different
approaches (for different populations either including or excluding tenants in subsidized
housing) using the very same data, we find e.g., the expected leveling effect of IR on
income inequality in both, the regression-based opportunity-cost approach and the self-
assessment approach. However, for the capital-market approach inequality (when measured
by means of Gini coefficient and MLD) is slightly increasing once including IR.
These inconsistencies also show up in Table 11 when analyzing the correlation of
the various IR measures on the basis of SOEP2002. This analysis includes only the
population of owner-occupiers, for which all of these methods can be implemented.
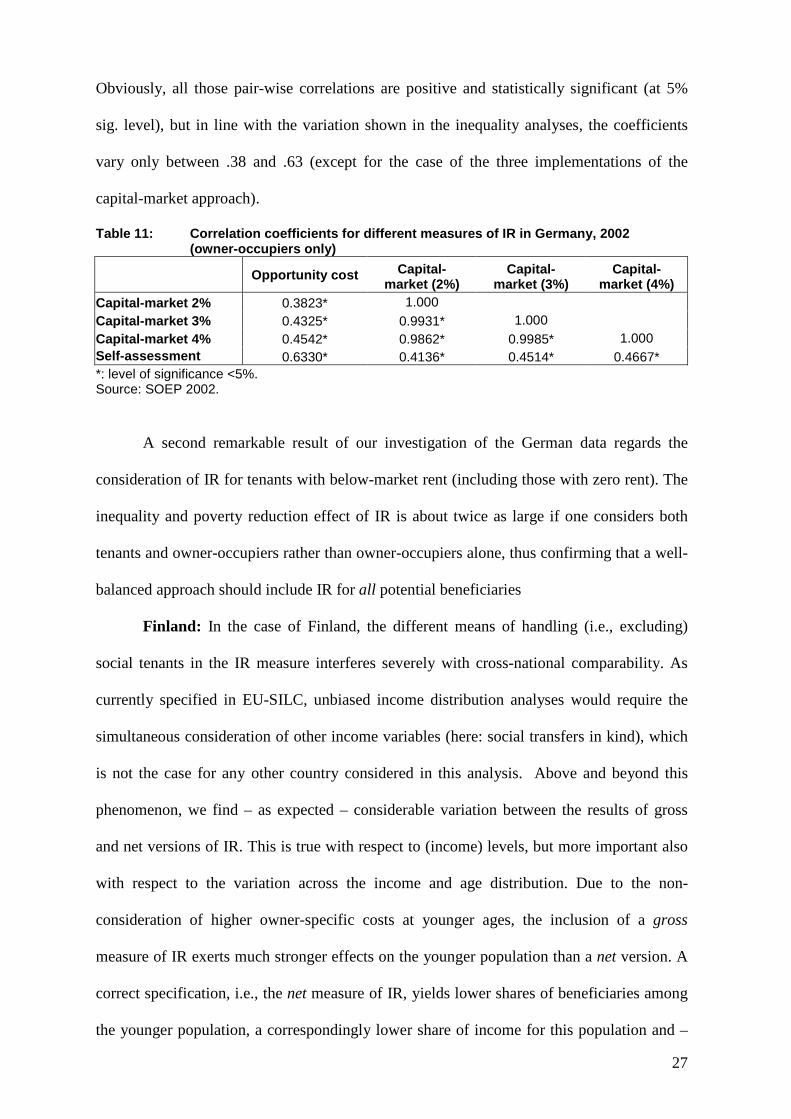
27
Obviously, all those pair-wise correlations are positive and statistically significant (at 5%
sig. level), but in line with the variation shown in the inequality analyses, the coefficients
vary only between .38 and .63 (except for the case of the three implementations of the
capital-market approach).
Table 11: Correlation coefficients for different me asures of IR in Germany, 2002 (owner-occupiers only)
Opportunity cost Capital-
market (2%) Capital-
market (3%) Capital-
market (4%) Capital-market 2% 0.3823* 1.000 Capital-market 3% 0.4325* 0.9931* 1.000 Capital-market 4% 0.4542* 0.9862* 0.9985* 1.000 Self-assessment 0.6330* 0.4136* 0.4514* 0.4667* *: level of significance <5%. Source: SOEP 2002.
A second remarkable result of our investigation of the German data regards the
consideration of IR for tenants with below-market rent (including those with zero rent). The
inequality and poverty reduction effect of IR is about twice as large if one considers both
tenants and owner-occupiers rather than owner-occupiers alone, thus confirming that a well-
balanced approach should include IR for all potential beneficiaries
Finland: In the case of Finland, the different means of handling (i.e., excluding)
social tenants in the IR measure interferes severely with cross-national comparability. As
currently specified in EU-SILC, unbiased income distribution analyses would require the
simultaneous consideration of other income variables (here: social transfers in kind), which
is not the case for any other country considered in this analysis. Above and beyond this
phenomenon, we find – as expected – considerable variation between the results of gross
and net versions of IR. This is true with respect to (income) levels, but more important also
with respect to the variation across the income and age distribution. Due to the non-
consideration of higher owner-specific costs at younger ages, the inclusion of a gross
measure of IR exerts much stronger effects on the younger population than a net version. A
correct specification, i.e., the net measure of IR, yields lower shares of beneficiaries among
the younger population, a correspondingly lower share of income for this population and –
28
as shown by inequality and poverty decomposition – an even more pronounced importance
of IR as a means of old-age provision.
Denmark: Given that EU-SILC for Denmark also defines a gross measure of IR, we
may extrapolate the Finnish case to the Danish results. Thus we can presume that a similar
bias exists in favor of the young population, and that the “true” income advantages of IR for
the young will be smaller when a net measure is employed.
Concluding, no matter what approach for defining IR is chosen, it is crucial to give
adequate consideration to the national institutional framework. This includes, for example,
policies promoting home ownership when interpreting empirical results using IR measures
such as the (non-)taxation of net IR, the (non-)taxation of capital gains on the sale of an
owner-occupied home up to a certain amount, the deductibility of mortgage interest, and the
deductibility of local property taxes. It may even be appropriate to determine IR for owners
of multiple homes in private use (second homes, holiday flats) ,although this is not
recommended by Eurostat (for EU-SILC). Certainly a limitation on this approach is the
restricted information available from most survey data, which tends to concentrate on the
primary address.
Above and beyond these arguments, the following measurement issues should be
considered when determining IR in micro data:
o Population: Are all potential beneficiaries identifiable in the micro-data and is it possible
to derive a measure of IR for all of them?
o Estimation of “true” market value / rent: Is information available within the survey or is
it necessary to use external information?
o Is there a potential bias in self-assessed data on market value, outstanding debt, market
rent?
29
o Might item non-response on any relevant component be source of bias (especially in the
case of self-assessments)?
o Opportunity-cost-approach
o regression-based: Are detailed covariates available describing the housing unit?
o stratification-based: Is true variation understated?
o Costs: Are all relevant cost components considered or at all attributable in order to
derive a true net measure of IR ?
3 The case of “company cars” (CC)
The rationale of the following analysis is very similar to the one for IR in Section 2
above. There we analyzed the implication of non-cash income components for a welfare-
oriented measure (equivalent post-government income), while in this section we will
concentrate on the relevance of non-cash compensation schemes on the labor market. Labor
economists are increasingly aware that including non-cash labor income components in the
analysis of wage distributions can have important effects and cause crucial changes over
time. To cite one example, Pierce’s (2001) study based on US micro-data uses a wide
definition of compensation, which considers voluntary fringe benefits (related to leave,
pensions, and health insurance) and legally required compensation costs (e.g.,
compensation insurance and social security). He finds that including voluntary fringe
benefits increases dispersion measures, while the opposite is true for the inclusion of legally
required compensation components. Analyzing trends over the 1980s and 1990s he argues
that “Fringe benefits have become less equally distributed […] and compensation inequality
rose […] by a greater amount than did wage inequality” (Pierce 2001: 1520). However,
when comparing the following results to this finding, it should be kept in mind that Pierce
30
uses a very wide definition of non-cash components, while in the EU-SILC data at hand,
this refers only to one component, namely “private use of company cars”.
3.1. Empirical application using EU-SILC
This section focuses on the impact of non-cash employment income (EU-SILC
variable PY020G) on the distribution of cash and near-cash employee income (EU-SILC
variable PY010G). Annex 2 gives a list of future components of this variable starting from
survey year 2007. In the current version of EU-SILC 2004, only the value of “private use of
company cars (CC)” is included. In exact definition this variable is supposed to encompass
“Company cars and associated costs (e.g., free fuel, car insurance, taxes and duties as
applicable) provided for either private use or both private and work use. […] The value of
goods and services provided free shall be calculated according to the market value of these
goods and services. The value of the goods and services provided at reduced price shall be
calculated as the difference between the market value and the amount paid by the
employee.” (Eurostat 2006a: 5-6)23
An effective cross-national comparative analysis of these measures requires that all
of these components are defined in the same way: for wages and salaries one would like this
to be a gross measure in order to reduce the impact of national tax and transfer systems.24
Unfortunately, this is not the case for several countries in EU-SILC 2004 that have to be
excluded from the analyses:
o France, because the value of CC is already included in the cash employee income
measure and cannot be differentiated
23 The available documentation does not give any indication for national deviations from this Eurostat recommendation, neither with respect to the definition nor the measurement of income advantages from the private use of company cars (CC). 24 However, even gross incomes may inhibit national specificities that interfere with distributional analyses, e.g., the gross pay scheme for white-collar workers in the German public service differs according to marital status and number of children.
31
o Portugal, Italy, Greece and Spain, because gross cash employee income is missing
altogether.
In other words, this analysis can be performed on the basis of EU-SILC 2004 data
for the following countries only: Belgium (BE), Denmark (DK), Estonia (EE), Finland (FI),
Ireland (IE), Luxembourg (LU), Norway (NO), and Sweden (SE), assuming the same
definition and measurement of CC in all these countries according to Eurostat
recommendations.
3.2. Company Cars: Comparative inequality analyses based on EU-SILC
The population of interest for the following analysis are individuals (up to 65 years
of age) with a positive measure of gross annual cash and near-cash employee income (EU-
SILC variable PY010G)25. Obviously, there is a selection process underway here given that
individuals outside the labor force as well as the unemployed are not included. However,
this will be ignored for the sake of our descriptive exercise: namely, to measure the
incidence and relevance of non-cash employee income components across Europe and their
impact on the distribution of cash employee income.
For the analyses of inequality with and without CC, we again apply some well
established measures giving more weight to income changes at different parts of the
distribution26. We investigate the share of beneficiaries by cash employee income quintile
(incidence analysis; Table CC-1). Measuring CC as a share of cash employee income
provides information about the relevance of this income source across the income
distribution (Table CC-2). Table CC-3 focuses on the impact of CC on a range of inequality
measures. In Tables CC-2 and CC-3 we contrast the results for the baseline model (given by
25 In order to reduce the impact of outliers and measurement error, we apply a 1% top and bottom-trimming. 26 Gini, Mean Log Deviation (MLD), the Half Squared Coefficient of Variation (Half SCV) and the Atkinson measure with e varying between 0.5 and 1.5
32
a cash-based compensation measure) with those derived from the measure including CC –
i.e., we present the percentage deviation of the respective results once including the non-
cash component.
Although this analysis is of a fairly exploratory nature, one might expect that non-
cash components (here: the use of a company car for private purposes) are less common
among lower incomes. Following from this, one would expect inequality to increase once
including a measure of CC, and that this increase would be more accentuated when using
inequality measures that are sensitive to changes in the upper part of the income distribution
(e.g., half SCV).
Incidence: Beneficiaries of non-cash employee income (Table CC-1:)
The share of beneficiaries of CC varies to a great extent across Europe. While in Norway
and Ireland only 2% to 3 % of the population under analysis enjoy such fringe benefits, the
share is between 5% and 8% in Luxembourg, Estonia, Belgium and Denmark, and indeed
extraordinarily high in Finland and Sweden, where about 25% of all individuals with
positive cash labor income also have a company car for private use. In line with our
expectations, this compensation component is more prevalent among higher incomes, and in
fact, there is a continuous increase in the share of beneficiaries across income quintiles:
about one in two individuals among the top 20% of cash labor income earners in Finland
and Sweden, as well as about one in four individuals in the same income group in Belgium
and Denmark uses a company car for private purposes.
Relevance: Income effects (Table CC-2:) We define the relevance of the
income advantage from “company cars” based on the proportional share of the overall
compensation from non-cash employee income. Although Table CC-1 showed a very high
incidence in a few of the eight countries considered here, CC is of only moderate
importance overall. We find the highest share in Estonia (slightly more than 2%) and the
lowest in Belgium (0.4%). Again, when comparing this effect across the income
33
distribution, the results are in line with those presented in Table CC-1: the higher the cash-
income quintile, the higher the relevance of the non-cash component.
Inequality effects (Table CC-3): In principle, the baseline models exhibit
inequality information that is generally in line with our expectations: the Scandinavian
countries of Denmark and Finland show the lowest degree of wage inequality and the liberal
Irish labor market appears to be most unequal, together with transition economy of Estonia.
More important, however, for the sake of this paper is the finding that – in line with Pierce
(2001) – the inclusion of CC in the overall compensation measure yields a higher degree of
inequality. This is true for all countries and all measures applied (there is only a minor
exception to this rule for the 90:50 decile ratio in Estonia27).
Inequality rankings (Table CC-4): As expected, Denmark and Finland show the
lowest degree of inequality according to all measures employed (as shown in Table CC-3
above). At the same time, Finland and Sweden exhibit by far the highest share of
beneficiaries of CC (Table CC-1). As such, from a comparative perspective, it might be
relevant to note whether the inclusion of CC in the cash employee income measure yields a
different ranking of countries by inequality than the baseline model using cash income only.
Although country rankings according to Gini and MLD do not coincide for all countries
(Sweden shows the highest inequality according to the MLD but is ranked fifth according to
Gini as well as Half SCV), not a single country is ranked differently than in the respective
baseline model. This result, however, might also be influenced by fact that in none of the
eight countries considered is the income share coming from CC more than 2.1% (e.g.,
Estonia). Thus one would expect that a more comprehensive measure of non-cash employee
components, an objective of EU-SILC 2007, would also yield a more diversified impact on
overall compensation inequality.
27 This deviation is most likely not statistically significant different from zero. Obviously, given the nature of the underlying survey data, confidence bands should be provided for all these measures. However, this would hamper the readability of such tables even more.
34
4 Conclusions and perspectives
In regard to the “comparability” issue, comparisons of cash-based welfare positions
across time and space need to be complemented by the consideration of non-cash measures:
only in this way can a complete measure of the analytical construct of interest be achieved
(e.g., housing transfers, which may be granted either in cash or in kind). We have shown
that, first, both of the non-cash components considered in this paper (IR and CC) are of
significant relevance across Europe. Second, we have seen that there is considerable degree
of cross-national variation in the incidence and relevance of both components. Most
important from the point of distribution analysis, within-country income variation (i.e.,
“equivalent household income” in the case of IR and “gross employee income” in the case
of CC) is significantly affected. From a comparative point of view, such cross-national
differences with respect to the country-specific degree of inequality due to the inclusion of
IR or CC may also yield different rankings of countries (e.g., as measured by the Gini
coefficient). Above and beyond these findings, it would be advantageous to analyze the
effectiveness of certain policies such as the promotion of homeownership. This can be
illustrated by means of inequality and poverty decomposition analysis if IR is included,
which can provide important insight into the relevance of investing in property as a means
of old-age provision.
Especially with respect to IR, cross-national comparability is clearly influenced by the
choice and implementation of alternative methodologies. While the “rental equivalence
methods” estimate the opportunity costs of housing, the “user cost or capital market”
estimates the opportunity cost of capital. Obviously, in times of volatile financial and
housing markets, IR measures according to these two approaches do not have to coincide.
Furthermore, the choice of approaches is also very much a matter of data availability
and other national restrictions. For example, in the case of IR and given the sample size of

35
the available micro data, the non-subsidized rental market in the UK is presumably too
small to be analyzed using the regression-based rental equivalence approach. This argument
can easily be extended to even more countries if the regression was based only on non-
subsidized tenants with new contracts in order to explicitly consider “tenure discount”.
As to the “completeness” issue, if a given component (e.g., imputed rent) is very
unequally distributed, adjusting for this one component of non-cash income may even
complicate the comparability issue further, in contrast to ignoring this component
altogether. This problem becomes obvious in the case of “employer-subsidized rent”, where
the question under discussion is whether to categorize this income advantage as either “non-
cash income from housing” (EU-SILC variable HY030) or as “non-cash employee income”
(EU-SILC variable PY020). Clearly, if not all countries in a cross-national analysis deal
with this in the same way, biases will be built into the analysis, for example, if one includes
only one variable or the other instead of both at the same time.
Finally, due to the lack of longitudinal data in EU-SILC as of 2004, we could not
investigate the relevance and importance of non-cash components in income mobility
analyses. However, it is likely that the inclusion of IR in the income measure especially for
elderly people with low income will not only improve their income position and reduce their
poverty risk rate, as shown in the analyses presented here, but will also help to stabilize
income above and beyond the expected low degree of variation of other income sources
such as income from the public pension system. The comprehensive inclusion of IR for non-
owner occupiers living in rent-free or rent-reduced accommodation will also be crucial for
mobility analyses in cases where parents hand over their deeds to their children (e.g., for tax
purposes) in exchange for lifelong usufructuary rights to live in their formerly privately
owned properties.
A similar conclusion can be drawn for income mobility regarding the “private use of
company cars” (as well as for any other non-cash wage component to be included in future
36
EU-SILC wage measures): any explanatory model focusing on the relevance of cash wages
as the determinant of changing jobs might be biased if relevant non-cash components are
overlooked: e.g., a person moving to another job with the same (or even lower) nominal
cash payments but also receiving private use of a company car.
Summing up, further work standardizing the method for calculating and measuring
non-cash income components (e.g., IR) as well as harmonizing the relevant inputs (e.g., the
relevant owner-specific costs to be deducted from gross IR in order to achieve a comparable
net measure) should be of central concern to those working to produce and analyze cross-
national comparative income data, such as EU-SILC – as is true for any potential
component of non-cash employee income. It is obvious that even for the three countries for
which there is information on IR in EU-SILC 2004 (Denmark, Finland and France) the
degree of harmonization achieved is in no way acceptable. The problem is not so much that
different approaches are applied: this in itself may well be justified. Rather, it is that the
costs leading to various gross and net versions of IR, as well as the populations potentially
enjoying IR, are defined differently across countries. Thus in the Finnish data the implicit
income advantage of tenants in public housing is considered as a “social transfer in kind”
and thus included in a different EU-SILC variable. This might indeed be a meaningful way
to deal with this phenomenon, but it is not advisable to apply different approaches within a
dataset explicitly designed for cross-national research.
As such, any deviation from a generally proposed approach to capture such non-cash
income effects will have to be well justified so as not to jeopardize cross-national
comparability. However, given explicit cross-national variation (including the variation in
tax and transfer regimes), “functional equivalents” for capturing non-cash income
components are being sought, and not necessarily “national applications of pre-defined
algorithms”.
37
References Canberra Group (2001) Expert Group on Household Income Statistics: Final Report and
Recommendations, Ottawa. Eurostat (1998): Recommendations on Social Exclusion and Poverty Statistics, 31st Meeting of the
statistical programme committee, Luxembourg, 26 & 27 November 1998, CPS 98/31/2, Luxembourg.
Eurostat (2005): First Meeting of the Working Group on Living Conditions (HBS, EU-SILC and IPSE: HBS and Imputed Rent, 8-10 June 2005, Doc. EU-SILC DOC 155/05/EN.
Eurostat (2006a): New income components in EU_SILC 2007 onwards: A Review. Meeting of the Working Group “Statistics on living conditions (HBS, EU-SILC and IPSE), 15-16 May 2006, EU-SILC DOC 165/06/EN.
Eurostat (2006b): Imputed Rent, Third meeting of the EU-SILC Task Force on methodological issues, 4-5 April 2006, EU-SILC DOC TFMC-12/06
Foster, J., J. Greer, and E. Thorbecke (1984): A Class of Decomposable Poverty Measures. Econometrica, 52 (3), 761-766.
Frick, J. R. and Grabka, M. M. (2003): Imputed Rent and Income Inequality: A Decomposition Analysis for the U.K., West Germany, and the USA. The Review of Income and Wealth, 49(4): 513-537.
Frick, J. R. und Grabka, M. M. (2001): Der Einfluß von Imputed Rent auf die personelle Einkommensverteilung. Jahrbücher für Nationalökonomie und Statistik, 221(3): 285-308.
Frick, J. R., Grabka, M. M. and Marcus, J. (2006): Editing and Imputation of Non-Response in the 2002 wealth module of the German SOEP. DIW Data Documentation, DIW Berlin.
Gottschalk, P. and T. M. Smeeding (1997) “Cross-National Comparisons of Earnings and Income Inequality,” Journal of Economic Literature, XXXV, 633-687.
Haisken-DeNew, John P. and Frick, Joachim R. (2005): Desktop Companion to the German Socio-Economic Panel Study (GSOEP), Version 8.0 – Update to Wave 21, DIW Berlin.
Immervoll, H., C. O'Donoghue and H. Sutherland (1999): An Introduction to EUROMOD. Euromod Working Paper EM0/99. September 1999 http://www.iser.essex.ac.uk/msu/emod/publications/emwp0.pdf
Marquier, Rémy (2003): Imputation de loyers fictifs aux propriétaires occupants: Quel impact sur les contours de la population pauvre ? INSTITUT NATIONAL DE LA STATISTIQUE ET DES ÉTUDES ÉCONOMIQUES, Décembre 2003.
Meulemans, B. and B. Cantillon (1993) : “De geriusloze kering: De nivellering van de intergenerationele welvaartsverschillen (Levelling of Intergenerational Inequality),” Economisch en Social Tijschrift, 3, 421-448.
Pierce, B. (2001) Compensation Inequality. Quarterly Journal of Economics, p. 1493-1525. Saunders, P. et al. (1992) Non-cash Income, Living Standards, Inequality and Poverty: Evidence
from the Luxembourg Income Study, Discussion Papers No. 35, Social Policy Research Centre (SPRC), The University of New South Wales, Australia.
Smeeding, T. M. and D. H. Weinberg, (2001) “Toward a Uniform Definition of Household Income,” The Review of Income and Wealth, 47(1), 1-24.
Smeeding, T. M., P. Saunders, J. Coder, S. Jenkins, J. Fritzell, A. J. M Hagenaars, R. Hauser, and M. Wolfson (1993) “Poverty, Inequality, and Family Living Standards Impacts across Seven Nations: The Effect of Non-cash Subsidies for Health, Education, and Housing,” The Review of Income and Wealth, 39(3), 229-256.
Wagner, Gert G., Frick, Joachim R. and Schupp, Jürgen (2006): Enhancing the Power of Household Panel Studies – The Case of the German Socio-Economic Panel Study (SOEP). DIW Data Documentation No. 13, August 2006, Berlin: DIW Berlin. http://www.diw.de/deutsch/produkte/publikationen/datadoc/docs/diw_datadoc_2006-013.pdf
Yates, J. (1994) “Imputed Rent and Income Distribution,” The Review of Income and Wealth, 40(1), 43-66.
Zaidi, A., M. Makovec, M. Fuchs, B. Lipszyc, O. Lelkes, M. Rummel, B. Marin and K. de Voos (2006) Poverty of Elderly People in EU25, European Centre for Social Welfare Policy and Research, 10 July 2006 (revised version), Vienna: Austria.
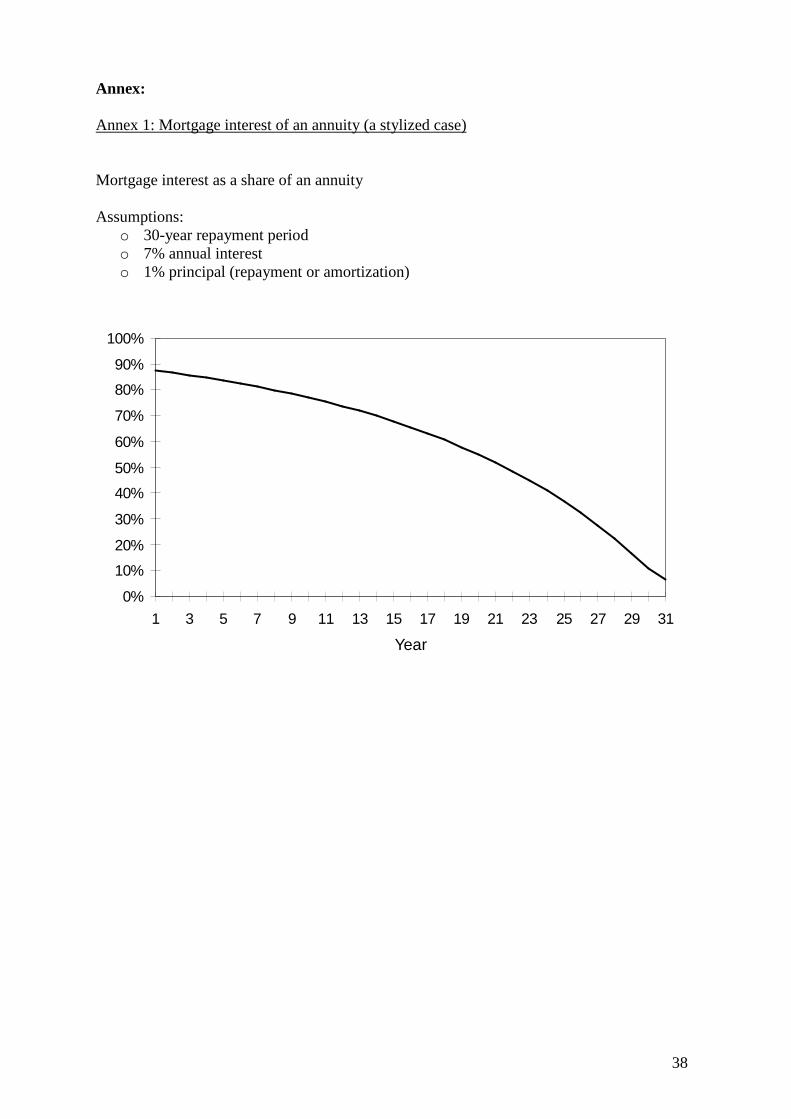
38
Annex: Annex 1: Mortgage interest of an annuity (a stylized case) Mortgage interest as a share of an annuity Assumptions:
o 30-year repayment period o 7% annual interest o 1% principal (repayment or amortization)
0%
10%
20%
30%
40%
50%
60%
70%
80%
90%
100%
1 3 5 7 9 11 13 15 17 19 21 23 25 27 29 31
Year
39
Annex 2: Non-cash employee income in EU-SILC Source: Eurostat 2006a: 5-6 Non cash employee income It refers to the non-monetary income components which may be provided free or at reduced price to an employee as part of the employment package by an employer. Till 2006, the value recorded under PY020(G/N) should only include company cars. From 2007 onwards, the variable gross non-cash employee income should include:
o Company cars and associated costs (e.g. free fuel, car insurance, taxes and duties as applicable) provided for either private use or both private and work use;
o Free or subsidised meals, luncheon vouchers; o Reimbursement or payment of housing-related expenses (e.g. Gas, electricity, water,
telephone or mobile telephone bills); o Other goods and services provided free or at reduced price by the employer to their
employees, when they are a significant component of the income at national level or they constitute a significant component of the income of particular groups of households.
The value of goods and services provided free shall be calculated according to the market value of these goods and services. The value of the goods and services provided at reduced price shall be calculated as the difference between the market value and the amount paid by the employee. It excludes:
o The cost of providing any of these goods and services by the employer if they are only required for the employees to carry out their work;
o Accommodation services at a place of work which cannot be used by the households to which the employees belong;
o Accommodation provided free or at reduced rent by the employer to the employees as the main residence of the household (the imputed value of the accommodation provided free or at reduced rent is included under ‘Imputed rent’ (HY030G)). According to the recommendation of the TF on methodological issues, this variable would be introduced as cash employee income.
o Accommodation provided free or at reduced rent to an employee as the secondary residence of the household.
o Allowances paid to employees for the purchase of tools, equipment, clothes etc. needed exclusively or primarily for their work;
o Special meals or drinks necessitated by exceptional working conditions; o Any goods or services provided to employees at the place of work or required
because of the nature of their work (e.g. a medical examination required for work).
Recommended