Assessing the ability of rural agrarian areas to provide Cultural Ecosystem Services (CES): a Multi Scale Social Indicator Framework (MSIF) Article
Accepted Version
CarvalhoRibeiro, S. M., Pinto Correia, T., Paracchini, M. L., Schuepbach, B., Ode Sang, A., Vanderheyden, V., Southern, A., Jones, P., Contreras, B. and O'Riordan, T. (2016) Assessing the ability of rural agrarian areas to provide Cultural Ecosystem Services (CES): a Multi Scale Social Indicator Framework (MSIF). Land Use Policy, 53. pp. 819. ISSN 02648377 doi: https://doi.org/10.1016/j.landusepol.2015.04.024 Available at http://centaur.reading.ac.uk/40144/
It is advisable to refer to the publisher’s version if you intend to cite from the work.
To link to this article DOI: http://dx.doi.org/10.1016/j.landusepol.2015.04.024
Publisher: Elsevier
All outputs in CentAUR are protected by Intellectual Property Rights law, including copyright law. Copyright and IPR is retained by the creators or other copyright holders. Terms and conditions for use of this material are defined in
brought to you by COREView metadata, citation and similar papers at core.ac.uk
provided by Central Archive at the University of Reading

the End User Agreement .
www.reading.ac.uk/centaur
CentAUR
Central Archive at the University of Reading
Reading’s research outputs online

1
• Title 1
Assessing the ability of rural agrarian areas to provide Cultural Ecosystem Services 2 (CES): A Multi Scale Social Indicator Framework (MSIF) 3
• Author names and affiliations. 4
Author 1: Carvalho-Ribeiro, Sónia 5
ICAAM- Instituto de Ciências Agrárias e Ambientais Mediterrânicas University of Évora. 6 Núcleo da Mitra, Edifício Principal, Gab 202, Apartado 94, 7002-554 Évora,Portugal, 7 Phone: + 351 266 740800 (ext 4445), email: [email protected] 8
Author 2: Pinto Correia, Teresa. ICAAM- Instituto de Ciências Agrárias e Ambientais 9
Mediterrânicas. DPAO - Department Landscape Environment and Planning,University of 10 Évora (UE), Núcleo da Mitra, Edifício Principal, Gab 203, Apartado 94, 7002-554 11 Évora,Portugal, Phone: + 351 266 740800 (ext 4445), email, [email protected] 12
Author 3: Paracchini, Maria Luisa, 13
Joint Research Centre JRC, TP 262, 21020 Ispra, Italy phone +39 2332 789897 fax +39 14 0332 785230 email [email protected] 15
Author 4: Schuepbach, Beatrice. 16
Agroscope, Institute for Sustainability Sciences (ISS).Reckenholzstrasse 191.CH-8046 17 Zürich.Switzerland. phone: +41 44 377 73 28 fax: +41 44 377 72 01. e-mail: 18 [email protected]. 19
Author 5: Ode Sang, Asa 20
Swedish University of Agricultural Sciences. Phone:040-415428 email [email protected] 21
Author 6: Vanderheyden, Vincent Université de Liège – Institut de géographie 22
Allée du Six-Août, 2 – Bât. B11 4000 Liège Belgium Phone : +32 4 366 52 65 email: 23 [email protected] 24
Author 7: Southern, Adrian 25
The Royal Society for the Protection of Birds, 46 the Green, South Bar. Banbury. England. 26 OX16 9AB Phone: +44 1295 676464 email: [email protected] 27
Author 8: Jones, Philip 28
University of Reading, Centre for Agricultural Strategy, Reading UK. RG6 6AR. Email: 29 [email protected] 30
Author 9: Beatriz Contreras 31
Author 10: Tim O´Riordan, Emeritus Professor, 32
University of East Anglia, School of Environmental Sciences, Phone + 441 603 810 534, 33 email, [email protected] 34
35

2
Corresponding author. Carvalho-Ribeiro, Sónia 36
Current address: 37
Universidade Federal de Minas Gerais, Centro de Sensoriamento Remoto, Av. Antônio 38 Carlos, 6627, Belo Horizonte - MG, CEP 31270-900, Tel: +55 31 3409-5449 Fax: +55 31 39 3409-5410 [email protected] 40
41
Abstract 42
Assessing the ways in which rural agrarian areas provide Cultural Ecosystem Services 43 (CES) is proving difficult to achieve. This research has developed an innovative 44 methodological approach named as Multi Scale Indicator Framework (MSIF) for capturing 45 the CES embedded into the rural agrarian areas. This framework reconciles a literature 46 review with a trans-disciplinary participatory workshop. Both of these sources reveal that 47 societal preferences diverge upon judgemental criteria which in turn relate to different 48 visual concepts that can be drawn from analysing attributes, elements, features and 49 characteristics of rural areas. We contend that it is now possible to list a group of possible 50 multi scale indicators for stewardship, diversity and aesthetics. These results might also 51 be of use for improving any existing European indicators frameworks by also including 52 CES. This research carries major implications for policy at different levels of governance, 53 as it makes possible to target and monitor policy instruments to the physical rural settings 54 so that cultural dimensions are adequately considered. There is still work to be developed 55 on regional specific values and thresholds for each criteria and its indicator set. In 56 practical terms, by developing the conceptual design within a common framework as 57 described in this paper, a considerable step forward towards the inclusion of the cultural 58 dimension in European wide assessments can be made. 59
60
Highlights 61
- This work develops a Multi Scale Indicator Framework (MSIF) 62
- MSIF is able to include Cultural Ecosystem Services (CES) such as aesthetics into multi 63 scale assessments 64
- By using MSIF, rural areas’ physical features were related to aesthetics, diversity and 65 stewardship criteria 66
- Agricultural areas with higher land uses/ land cover ratio likely fulfil societal demands 67 such as diversity, stewardship and aesthetics. 68
3
1. INTRODUCTION 69
It is well established that agricultural and forestry activities in Europe, in addition to 70
providing provisioning services, i.e. food, fuel and fibre, provide a variety of non-71
material benefits to society. These include cultural ecosystem services (CES) such as: 72
cultural identity; spiritual services (sacred, religious, or other forms of spiritual 73
inspiration derived from ecosystems); inspiration (use of natural motifs or artefacts in 74
art, folklore, etc.); aesthetic appreciation; and recreation and tourism (Burkhard, Kroll et 75
al. 2009, Cooper, Hart et al. 2009, Sayadi, Gonzalez-Roa et al. 2009, García-Llorente, 76
Martín-López et al. 2012, Pinto-Correia and Kristensen 2013). Societal demand for 77
these cultural ecosystem services is well documented worldwide (MEA 2005, OECD 78
2006, TEEB 2010). In the European Union, for example, both the Common Agricultural 79
Policy (CAP Pillar II, Axis 3) and the EU Biodiversity Strategy to 2020 (EU, 2011) 80
recognise societal demand for CES by calling for the “maintenance, restoration and 81
upgrading of the cultural and natural heritage of villages, rural landscapes and high 82
nature value sites”. However, despite such policy acknowlement, CES are not explicitly 83
identifiable as policy instruments, but rather tend to be embedded within the landscape 84
concept, with no attempt, for example, to link the maintenance of specific CES to 85
landscape payments. Compounding this policy limitation is a lack of reliable assessment 86
of the contributions of different farming systems, or farming practices, to the “non-87
material” qualities embedded into different cultural ecosystem services, such as 88
aesthetics, identity or diversity, meaning that these relationships are understood largely 89
in terms of whole landscapes contributing to bundles of CES. 90
Given that agricultural/rural policy decisions implemented at one scale of governance 91
may have consequences on the delivery of CES at other scales, there have been calls for 92
the application of multi-scale approaches to policy setting and monitoring (Cash, Adger 93
et al. 2006, Dick, Maes et al. 2014, Lefebvre, Espinosa et al. 2014). The relevant 94
literature on this subject is scarce and this exposes a number of conceptual and 95
methodological difficulties. Foremost among these difficulties is the mismatch between 96
the spatial scale at which environmental processes operate and are measured and the 97
spatial scale at which agricultural management operates, a fact that is often not 98
systematically captured in theoretical frameworks used to link these processes (Pelosi, 99
Goulard et al. 2010). Particular challenges arise from data aggregation methods and the 100

4
establishment of indicators, as well as appropriate assessment of linkages across scales 101
(Volk and Ewert 2011). 102
Something which particularly needs to be addressed is the question of how to assess and 103
measure different CES at multiple scales of governance. A well-established approach 104
for understanding the ways in which rural agrarian areas provide goods and services to 105
society is that of deriving criteria and indicators for assessing the ability of rural areas to 106
provide such goods. The existing literature on such indicators is vast and the indicators 107
proposed can be broadly categorized into: i) environmental indicators, for example the 108
United Nations Statistics Division Environmental Indicators (UNSD, 2014); ii) 109
sustainability indicators (including the social, economic and environmental 110
dimensions); and iii) landscape indicators (including landscape visual characteristics). 111
The scalability and generalizability of these different classes of indicators varies. While 112
environmental indicators are transferable between sites and regions, landscape 113
indicators cannot be applied everywhere (Cassatela and Peano 2011). For this reason 114
studies contributing to the very rich body of empirical work assessing visual concepts 115
and attributes for deriving preferences for rural agrarian areas are often framed within 116
the context of specific landscapes (see Section 2.2.1). This fact raises concerns about the 117
generalizability (Cassatela and Peano 2011) of landscape-based indicators between 118
different scales of analysis, and implies that multi-scale assessment of this class of 119
indicators would be very challenging (van Zanten, Verburg et al. 2014). 120
In spite of these limitations, however, this very rich theoretical and empirical work on 121
landscape preferences and perceptions should not be thought of just as a collection of 122
case studies (van Zanten, Verburg et al. 2014). We argue instead that exploring the 123
diversity of landscape preferences expressed in this literature, through different 124
frameworks, might aid the development of a suitable framework for assessing the roles 125
and values of landscape and its elements in provision of cultural ecosystem services 126
(CES). 127
There is an extensive body of research on the assessment of the efficacy of public 128
policies and planning approaches for delivering public goods and ecosystem services. 129
However, the majority of the assessment frameworks proposed in this literature focus 130
on fairly familiar environmental constructs, such as land use and water quality (for 131
example, see the EU Common Monitoring Evaluation Framework (EC, 2006)) and do 132
5
not comprehensively address cultural ecosystem services (Paracchini, Capitani et al. 133
2012). With the possible exception of recreation (Paracchini, Zulian et al. 2014), current 134
indicators fail to provide effective frameworks for either measuring the progress of 135
wider social welfare, or for developing or reforming policy to cope with newly 136
emerging social problems (Ahn, Choi et al. 2012). So far, most attempts to include these 137
wider values and services have encountered difficulties when seeking translation into 138
policy. In consequence, none of the frameworks so far suggested have demonstrated 139
their utility for assessing the effectiveness of current policies in delivering various 140
public goods and ecosystem services (Arler 2000, Turpin, Dupraz et al. 2009, 141
Paracchini, Pacini et al. 2011, Pinto-Correia, Machado et al. 2013). 142
This research aims to fill this gap by developing a methodological framework to 143
evaluate the ways in which rural agrarian areas provide cultural ecosystem services 144
(CES). We call this approach the Multi Scale Social Indicator Framework (MSIF). In 145
order to address the multi scale issue, the framework distinguishes indicators into two 146
groups based on whether they are (i) generalizable over all regions (G), or (ii) 147
applicable only to one, or a few, specific regions (RS). In this context, an indicator is 148
considered G if it is possible to apply it throughout Europe, even though its range and 149
thresholds might vary from region to region. To provide examples, an indicator related 150
to olive groves could only be applied in Mediterranean regions, and would therefore be 151
classified as RS, while an indicator related to outdoor recreation is applicable to the 152
whole of Europe and therefore would be classified as G. 153
This approach is built upon the assumption, supported by some previous studies, that it 154
is possible to capture and assess societal preferences, in the context of the rural agrarian 155
areas, at different spatial scales, ranging from the European, national and regional scales 156
to the landscape and local level (Carvalho- Ribeiro, Madeira et al. 2013, Dick, Maes et 157
al. 2014). Previous studies, when measuring societal preferences at broader spatial 158
scales, have used a ‘top-down’ approach, based on use of proxy indicators (mostly 159
environmental indicators), derived from Europe-wide datasets, often integrated into 160
composite indices (for example, see Paracchini et al, Pinto Correia et al. and Jones et al 161
this issue). At the local and regional scales, landscape preference surveys (see Section 162
2.1.2.), have used a ‘bottom-up approach, eliciting data through primarily data 163
collection, i.e. surveys, of the preferences of groups that are local to the specific 164
landscape in question (for an example of this approach, see Almeida et al this issue). 165

6
However, the problem of bridging these different scales remains unresolved, as is the 166
problem of how to validate the results from broader scale assessments, i.e. based on 167
proxy indicators, while overcoming downscaling issues (Mander, Muller et al. 2005). 168
The MSIF attempts to overcome these problems. 169
The effectiveness of any social indicator framework in capturing preferences for 170
landscape hinges on the extent to which it can discern preferences from among the 171
complex perceptions of rural agrarian settings in which they are embedded. In this 172
context preferences towards rural landscapes are understood to be pre-cognitive 173
responses to specific landscape features, elements or characteristics, which generate 174
feelings of liking or disliking (Antrop 2000, Surova and Pinto-Correia 2008, Swanwick 175
2009, Carvalho-Ribeiro, Migliozzi et al. 2013). Perceptions, on the other hand, are 176
cognitively based and hence more difficult to assess. As defined by Antrop (2000:19) 177
“perception, as complex learning processes, analyses the observation immediately and 178
interactively and links the results with our knowledge and past experience”. In view of 179
the subtly of these distinctions, and the difficulties involved in measuring perceptions, 180
this study focuses predominantly on the preferences of society as a whole, and not on 181
the particular preferences, or perceptions of individuals or particular user groups. 182
One further question that had to be addressed in constructing the MSIF is the possibility 183
of achieving any kind of consensus on the list of measures to be used as indicators of 184
the contribution of different elements of the physical rural agrarian areas to cultural 185
ecosystem services. This study directly explores this issue and describes a novel 186
approach for identifying and evaluating a range of possible measures/indicators that are 187
both available and meaningful at multiple levels of governance. This study therefore 188
addresses three broad questions: 189
1. Is it possible to identify a meaningful set of measures/indicators for conveying social 190
preferences for the rural agrarian areas of Europe? 191
2. Are available measures/indicators only region specific, or can a set be defined that are 192
broadly applicable to all rural agrarian areas of Europe? 193
3. At what scale(s) are these measures/indicators most meaningful, and as a corollary, 194
are these measures/indicators scalable and therefore relevant to inform policy making at 195
different levels of governance? 196
197

7
2. METHODOLOGICAL FRAMEWORK 198
The research questions were addressed by means of a two-stage methodology: 199
1. A comprehensive literature review, based on a Science Direct web search. 200
2. A symposium and participatory workshop with scholars and practitioners in 201
landscape science was held, during the International Association of Landscape Ecology 202
(IALE EU) congress held in Manchester in September 2013 (http://www.iale2013.eu/). 203
The literature review explored the criteria and visual concepts /attributes relating to 204
preferences towards landscape by society as a whole. The participatory workshop was 205
designed as a forum for gathering assessments by landscape researchers and 206
practitioners on the characteristics, elements, or features of rural areas which contribute 207
to the criteria and visual concepts highlighted in the literature as important in preference 208
formation. As illustrated in Figure 1, the primary purpose of this study was to combine 209
these two methodologies to construct a robust framework of indicators (i.e. the MSIF) 210
capturing societal preference for rural agrarian areas, applicable to different spatial 211
scales, as a means to informing policy making at multiple levels of governance. 212
213
Figure 1 here 214
215
2.1 A SYSTHEMATIC LITERATURE REVIEW ON PREFERENCES BY 216
SOCIETY CONCERNING RURAL AGRARIAN AREAS OF EUROPE 217
The literature review was initiated using the advanced search tools available on the 218
Science Direct web platform (http://www.sciencedirect.com/science/search) using the 219
following search terms: “landscape preferences in Europe”, “rural agrarian areas”, 220
“scale” and “indicators”. This search identified 466 articles in this topic area (as of June 221
2013). The literature review involved the identification, from within this body of 222
literature of multi-scale measures that might be suitable for use as indicators conveying 223
social preferences concerning rural agrarian areas (Flick 2002). This was followed by a 224
systematised classification of these measures as a means to making more sense out of 225
the disparate (and confusing) state of both theoretical and empirical work on societal 226
preferences for rural agrarian areas. The classification identified existing measures into 227
one of three hierarchical categories: i) criteria upon which preferences might be based 228
(preferences framed on a user based activity e.g. collecting mushrooms might be 229
different for the same individual´s preferences for aesthetically pleasing landscapes); ii) 230

8
visual concepts or attributes conveying preferences; and iii) features, elements or 231
characteristics of the rural areas able to represent these concepts/attributes. This last 232
group, at the base of the hierarchy, then formed the pool from which we hoped to derive 233
a list of measures and ultimately a robust set of indicators (Tveit, Ode et al. 2006). 234
The literature review found an extensive array of possible criteria and visual concepts 235
which could be related to preferences for rural agrarian areas (presented in sections 236
2.1.1.and 2.1.2. respectively). In order to screen out unsuitable indicators, an approach 237
proposed by Tveit et al (2006) was employed. This filters the selection according to a 238
number of technical criteria, i.e. the soundness and clarity of the theoretical basis; 239
transferability; quantifiability; mappability; availability; and policy relevance. 240
241
2.1.1. A review of the criteria used to describe preferences for rural agrarian areas 242
One of the major findings of the literature review is that preferences for rural agrarian 243
areas vary markedly according to the criteria on which preference is expressed 244
(Coeterier 1996, Gobster, Nassauer et al. 2007, Rogge, Nevens et al. 2007, Sevenant 245
and Antrop 2009, Swanwick 2009, Sevenant and Antrop 2010). These criteria, which 246
are anthropegenically mediated, may represent the nature of the interaction of the user 247
with the landscape, or represent perceptions of physical or cultural aspects of the 248
landscape (Coeterier 1996, Gobster, Nassauer et al. 2007, Rogge, Nevens et al. 2007, 249
Sevenant and Antrop 2009, Swanwick 2009, Sevenant and Antrop 2010). Six criteria 250
can be identified from the literature. 251
1. Preferences with a functional basis, largely in the context of a user based 252
activity- for example, preferences of tourists (recreation, bird watching), 253
preferences of hunters, etc. Here, preferences vary over specific user 254
groups (Schmitz, De Aranzabal et al. 2007, Fyhri, Jacobsen et al. 2009); 255
2. Preferences on the basis of visual concepts such as: stewardship, 256
coherence, disturbance, historicity, visual scale, imageability, diversity, 257
naturalness and ephemera (Ode, Tveit et al. 2008, Fry, Tveit et al. 2009, 258
Ode, Fry et al. 2009, Ode, Hagerhall et al. 2010, Ode and Miller 2011, 259
Ode Sang and Tveit 2013); 260
3. Preferences for certain attributes of landscapes, such as refuge and 261
security, or legibility and mystery (Appleton 1975, Appleton 1998, 262
Kaplan and Kaplan 2011); 263
9
4. Preferences based on scenery, i.e. scenic beauty, tranquility, etc. 264
focussing on beautiful and idyllic countryside (Carlson 1977, Van Den 265
Berg, Vlek et al. 1998, Daniel 2001, Barrett, Farina et al. 2009, Tempesta 266
2010) 267
5. Preferences in the context of landscape identity, i.e. elements of the 268
physical landscape that conveys sense of place (Proshansky, Fabian et al. 269
1983, Duncan and Ley 1993) such as preferences for traditional farming 270
practices-in some cases relating to quality and certified products (Antrop 271
1997, Sayadi, Gonzalez-Roa et al. 2009, Wu 2010, Stanchi, Freppaz et al. 272
2012); and 273
6. Preferences for particular types of land cover (Ulrich 1986, Dramstad, 274
Fry et al. 2001, Dramstad, Tveit et al. 2006, Carvalho-Ribeiro, Ramos et 275
al. 2013). Preferences for different land cover seem to vary across Europe. 276
For example in southern Europe the montado agro forestry system is 277
highly valued, whereas other land cover types e.g. orchards, are valued in 278
other parts of Europe. 279
The authors’ contend that using different “criteria” such as these for identifying and 280
classifying preferences for rural agrarian landscapes is not only possible but also 281
desirable. This assumption is based on an acknowledgement that the basis of 282
preferences may vary, even for the same individual, according to the criteria by which 283
their preferences are expressed. For example, preferences for someone picking berries, 284
i.e. so called functional preferences, might be different from the same individual when 285
seeking aesthetically pleasing landscapes, i.e. aesthetics (Tahvanainen, Tyrvainen et al. 286
2001). 287
The literature review also made clear that there is a need to further address visual 288
concepts relating to landscape preferences, as this is a focus of a considerable body of 289
work within the literature. This question is revisited in Section 2.1.2 below. 290
2.1.2. A review of landscape preferences 291
Before beginning the process of selecting an indicator set for the multi-scale indicator 292
framework (MSIF) further consideration needs to be given to the landscape scale. The 293
European Landscape Convention defines landscape as “an area, as perceived by people, 294
whose character is the result of the action and interaction of natural and/or human 295
10
factors” (ELC 2000). This definition captures the notion that landscape is a multi-296
dimensional concept. Landscapes result from the ways that different components of the 297
environment, both ecological (geology, soils, climate, flora and fauna) and cultural 298
(institutions formal and informal), and society as a whole, interact together in material 299
and imaginary ways (Selman 2006). Modern theories therefore present landscapes as 300
holistic entities, within which natural and human processes merge. Communities, 301
legislators, industry, local stakeholders and the public at large have different 302
expectations from landscape, and their particular preferences all have an influence on 303
landscape planning (McMichael, Butler et al. 2003). Whilst recognising that 304
assessments must take place at multiple scales, the landscape scale itself is of particular 305
importance, as it is here that conflicting interests, e.g. production and conservation, need 306
to be coordinated (Tress, Tress et al. 2001). It is therefore here, at the landscape scale, 307
that societal demands for cultural ecosystem services unfold and provision of them 308
occurs (Selman 2006). 309
Because of the multi-dimensional nature of landscapes, the body of work on “landscape 310
visual concepts” or “landscape attributes” is vast. A Web of Science search using these 311
expressions as search terms undertaken in 2013 found 16,916 articles, and by April 312
2014 this number had risen to 18,046. Space does not permit a full review of such a 313
huge quantity of literature, or even a review solely of existing frameworks for analysing 314
visual qualities, such as, for example, the Landscape Character Assessment (LCA) 315
(Swanwick 2002). 316
However, from the literature review a number of key concepts emerged as important in 317
determining preference for rural agrarian areas, such as the concept of stewardship. 318
While stewardship has been identified as an important determinant of landscape 319
preference (Nassauer 2011, Ode Sang and Tveit 2013), the manner and extent of 320
operation of stewardship remains obscure, in part because the effect seems to vary both 321
between and within individuals and groups (Tips and Vasdisara 1986) and according to 322
landscape context (Ode Sang and Tveit 2013). In this study, therefore, rather than try to 323
identify a set of features, elements and characteristics contributing to preference for 324
landscapes in general, we have constrained the analysis to landscapes under 325
stewardship, i.e. where management gives the landscape a ‘cared for’ appearance. No 326
attempt was made to identify variation in the weightings given to these elements, 327
features or landscape characteristics reflecting relative importance expressed by 328
11
different groups. However, the study did assess which of these features, elements and 329
characteristics were and were not readily scalable. 330
Two further concepts identified in the literature review as important determinants of 331
societal preferences for landscape were diversity, i.e. the diversity embedded in 332
landscapes and the aesthetic values associated with landscapes (Ribe 1989, Hamilton 333
2001, Van Eetvelde and Antrop 2004, Ode, Hagerhall et al. 2010, Kaplan and Kaplan 334
2011, Ode and Miller 2011). The concern with these concepts, in the context of the 335
MSIF, is that considerable challenges have been demonstrated in trying to make them 336
operational as well as scalable. A number of rigorous studies have shown that both the 337
perceptions of diversity in landscapes and their associated aesthetic qualities are fully 338
anthropogenic and occur at a “human” scale dubbed the “perceptible realm” by Gobster 339
et al. (2007). Only a few researchers have taken up the challenge of 340
upscaling/downscaling indicators of diversity or aesthetics in order to frame cross scale 341
policy making. 342
In order to fully develop the MSIF, it will be necessary to build upon the work of 343
previous studies and identify, for each one of these criteria or visual concepts (see 344
Section 2.1.2) identified in the literature, i.e. stewardship, diversity or aesthetics, a list 345
of landscape features, elements or characteristics contributing to these. If this is 346
possible, it will be then be feasible to assess preferences by society as a whole at 347
different levels of governance. It was to explore these possibilities that the symposium 348
and participatory workshop mentioned in Section 2.2 were organized. 349
2.2. SYMPOSIUM AND PARTICIPATORY WORKSHOP 350
Seven papers presented during a symposium of the IALE 2014 conference 351
(http://www.iale2013.eu/scaling-social-indicators) were identified which focussed on 352
the three research questions introduced at the end of the Introduction section above. The 353
authors of these papers, along with other expert stakeholders, subsequently attended the 354
workshop where the criteria/visual concepts of stewardship, diversity and aesthetics as 355
described in Section 2.1.1 were tested. Three “stations” or discussion areas were located 356
in the room, each with a wall-mounted table to collect stakeholder input on one of the 357
criteria/visual concepts. Alongside each table (see Table 1) was a full definition of each 358
of the criteria/visual concepts, accompanied by the following generic discussion 359
question: 360

12
‘What are the landscape characteristics or features which you feel would be the 361
best indicator(s) for: Stewardship/Diversity/Aesthetics?’ 362
Table 1 here 363
In each one of these “stations” one facilitator helped participants to fill in the wall-364
mounted table (Figure 2). 365
Figure 2 here 366
The participants moved around the stations in a carrousel approach. As soon as the 367
participants arrived at each station, the facilitators read the definition of the criteria and 368
prompted the discussion by reading the question. 369
Participants were given 15 minutes at each station. If a participant suggested a possible 370
indicator, the facilitator prompted discussion of that suggestion among the other 371
members of the group. There was no imperative to reach agreement within the group on 372
the choice of features or characteristics for use as indicators for the different criteria; the 373
only requirement was to discuss each suggestion within the group. The tables were 374
filled in one row at a time, to collect specific data and judgements about each suggested 375
indicator using the columns in the table. The same measure/ indicator could be repeated 376
for different criteria/visual concepts. The group discussions were tape recorded. Each 377
time the group changed station, the facilitators changed the colour of their pen so that 378
the contributions of each participant group could be subsequently identified. This 379
permitted the post-workshop identification of participants with particular sets of 380
indicators. After this carrousel exercise there was a plenary discussion. To start the 381
plenary session participants were asked to vote, i.e. expressing their own preferences, on 382
the relevance of each suggested indicator. They did this by sticking five coloured dots 383
against indicators at the three stations. Participants could place one dot against each of 384
the five most relevant indicators, or place multiple dots against any single indicator to 385
express weighting. Following the voting, indicators and their scores were presented to 386
the whole group by the facilitator of each station. This was followed by a group 387
discussion and an evaluation of the session. 388
3. RESULTS 389

13
This results section is organized into two sub-sections: Section 3.1 covers the content of 390
the indicator dataset derived from the workshop; while Section 3.2 describes and 391
critiques the process by which the data in the indicator dataset was gathered, and then 392
considers ways in which the three research questions can be answered using this data. 393
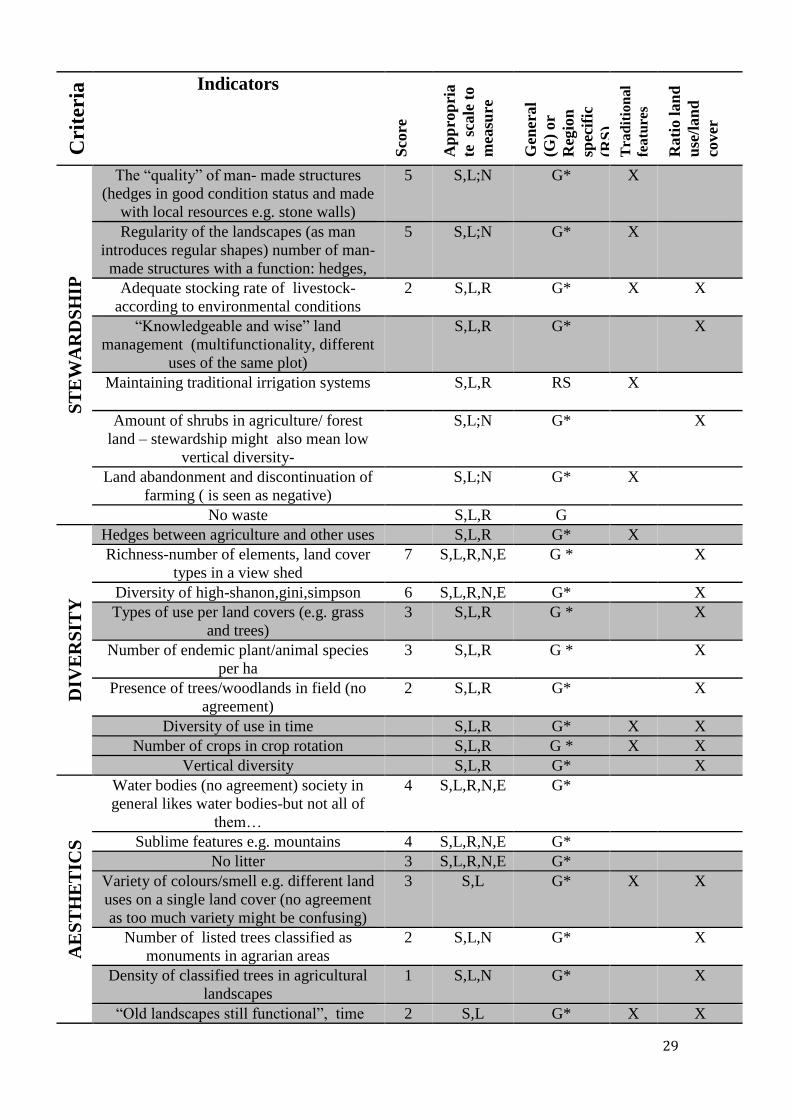
3.1 The proposed indicator set 394
Table 2 shows, for the three criteria analysed, i.e. stewardship, diversity, aesthetics 395
(column 1), the set of potential measures/indicators that were derived from the 396
workshop participants (column 2). Column 3 of the table shows the score that each 397
measure/indicator obtained in the voting. Column 4 highlights the possibility of 398
measuring each indicator at different geographical scales and Column 5 classifies 399
measures/ indicators as either Region Specific (RG) or General (G) on the basis of their 400
level of generalizability. 401
402
A set of 40 putative indicators were gathered from the three workshop stations (see 403
anexxe1). From the 13 indicators identified with stewardship, those that scored highest 404
in the voting were: 405
“quality” of man-made structures, and 406
man-made structures with a function 407
Both of these indicators denote active farm management. Twelve diversity indicators 408
were suggested, with three scoring highly in the voting: 409
edges between agriculture and other land uses 410
the number of elements and land covers in a view shed, and 411
high diversity indexes (e.g. Simpson’s Diversity Index ‘D’ or Shannon Index 412
‘H’) 413
For aesthetics, high voting scores were obtained for two of the 15 suggestions, namely: 414
water bodies 415
sublime features (such as mountains) 416
Some of the workshop participants noted (see Section 3.2.2) that some of the 417
measures/indicators listed in annexe 1 cannot be classified, because of various 418
limitations. To remove these weaker measures the list of measures was filtered using an 419

14
approach proposed by Tveit et al (2006) (please see the filtering criteria in Section 2.1. 420
and the detailed assessment in Annexe 1). The results of this filtering exercise are 421
shown in Table 2. 422
A review of all the measures/indicators retained after the filtering exercise ( Table2) 423
revealed that some physical landscape characteristics, or features, are important 424
contributors for more than one of the three preference criteria.The indicators that are 425
important to more than one criteria are shaded in grey. For example, hedges were 426
identified to as important for both the stewardship and diversity criteria. Also, 427
traditional elements/features were felt to be important for both stewardship and 428
aesthetics, while the presence of waste/litter is negative for both stewardship and 429
aesthetics. There are two landscape elements and characteristics that are important for 430
all 3 criteria. Those are (i) elements indicating traditional farming practices and 431
activities and (ii) a high number of land uses on a land cover type (i.e. a high land 432
use/land cover ratio)(Table 2 Columns 6 and 7, respectively ). 433
3.2.2. The process of gathering the list of indicators 434
The workshop involved 16 participants from 7 different countries: Greece, Belgium, 435
Italy, the Netherlands, Switzerland, Germany, Japan, Poland, Norway, the UK and 436
Portugal. There were four participants with landscape planning and management 437
expertise, three with expertise in geography, two in environmental sciences (agriculture 438
and forestry), one in biology (biodiversity), two in economic sciences, and one in 439
psychology. Thirteen out of 16 participants were academic researchers (including 440
principal investigators, post-doctoral researchers and PhD students) and three 441
participants considered themselves to be practitioners. 442
The majority of the participants (14 out of 16) classified the workshop as well 443
organized, while 12 out of 16 felt they were able to communicate and were listened to. 444
The aspects of the workshop that participants liked the most were the organization of 445
the event and the opportunity for brainstorming (14 out of 16). 446
The three aspects of the workshop that the participants liked the least were the lack of 447
time for discussion (identified as a problem by five participants), the fact that the 448
facilitators handled discussions around the three criteria in different ways (identified by 449
four participants), and that some of the concepts being suggested were ambiguous and 450
might have been explained to the group at an earlier stage (identified by four 451

15
participants). Participants also experienced some difficulties in accepting other people´s 452
views on these topics. In addition, the dominance of particular individuals also 453
apparently hampered the participatory process to some extent. Six of the participants 454
(around a third) were not completely satisfied with the outcomes of the workshop, 455
pointing out that more work was needed on refining the list of indicators suggested by 456
participants. 457
As already indicated, it was to address this particular concern that the indicators were 458
subsequently filtered to derive a final robust set of 29 (out of 40) indicators using the 459
approach suggested by Tveit et al (2006) (Annexe1, where retained indicators are 460
shaded grey). It should be noted that some of these 29 indicators scored relatively 461
poorly on data availability and in order to retain them it was necessary to make some 462
assumptions about the feasibility of additional data collection at moderate costs. There 463
are still several screening issues that still need addressing and this work on indicator 464
selection is progressing. Despite these remaining data quality issues, the data gathered 465
at the workshop suggests that it is indeed possible to achieve some degree of consensus 466
on a list of meaningful and relevant indicators for the three criteria/visual concepts. As 467
participants came from a range of disciplines and geographical regions, there was 468
considerable heterogeneity in the suggested measures and justifications for these. This 469
suggests that it would have been very difficult to achieve complete agreement on all 470
indicators, a view supported by the fact that some participants voiced strong opposition 471
to some suggestions. 472
Addressing the first of three research questions, it can be stated that, although 473
arguments remain on the relevance and validity of some of the indicators proposed, this 474
study has at least demonstrated that this methodological approach is sufficiently robust 475
to derive a preliminary indicator set appropriate for the MSIF. 476
In addressing the second of the research questions, it was expected, a priori, that the 477
majority of indicators would be framed in a region-specific manner due to issues of 478
landscape specificity. However, the results of the workshop demonstrated (see Column 479
5, Table 2) that the majority of the indicators can be classified as general (G) – meaning 480
that it would be possible to use them throughout Europe, even though their range and 481
thresholds might vary from region to region (please see * in Table 2). The workshop 482
participants did identify a few RS indicators, such traditional irrigation systems, which 483
are prominent only in Southern Europe due to drier climate. It is perhaps important to 484

16
reflect on these results in light of the background of the workshop participants. 485
Participants were generally experienced academic researchers and practitioners they 486
were therefore very knowledgeable on what indicators might be applied everywhere, or 487
only locally. A less experienced group might have drawn more on the specificities of 488
the rural areas they were personally familiar with, rather than thinking in more general 489
terms. 490
In terms of the third and final research question, i.e. the scalability of indicators, as 491
shown in column 4, the majority of the potential indicators elicited by participants can 492
be measured at a range of spatial scales (and therefore levels of governance): namely 493
site, landscape, regional and national scales. Indeed most can be derived through the use 494
of high resolution satellite imagery, using both remote sensing and GIS technologies. It 495
should be pointed out, however, that many of the indicators believed to be available 496
through remote sensing, would only be available for the whole of Europe with an 497
enormous input of time and financial resources. This is a significant problem which the 498
use of MSIF needs to address. One cost effective way of approaching the data 499
acquisition issue would be to deploy expenditures preferentially on those indicators that 500
contribute to more than one criteria/visual concept and which better target policy across 501
different levels of governance. Our suggestion would be to focus on the land uses/land 502
cover ratio, as this also will tell us about the level of multi-functionality– this being an 503
important issue to other policy instruments within CAP, particularly Pillar II. 504
505
4. DISCUSSION 506
In addition to providing provisioning outputs, agricultural and forest areas are today 507
understood and expected to meet multiple societal demands (Pinto Correia and Carvalho 508
Ribeiro 2012, Pinto-Correia and Kristensen 2013). In spite of policy recognition of this 509
fact, societal expectations for, and provision of, cultural ecosystem services from rural 510
landscapes barely register in extant indicator datasets, official or otherwise (Paracchini, 511
Zulian et al. 2014). 512
Cultural ecosystem services (e.g. aesthetics) delivered by sites, landscapes or other 513
geographical units, are particularly difficult to assess due to their multi-faceted and 514
often perception-based nature. One of the innovations of the current study is that it 515
builds upon the theoretical and empirical work of landscape sciences, particularly in the 516
areas of landscape preferences, landscape attributes and visual concepts, as a means to 517

17
characterising cultural ecosystem services. We have demonstrated the usefulness of 518
such an approach through the construction of the MSIF framework, through which 519
bundles of cultural ecosystem services provided by rural areas can be framed into a set 520
of three criteria, with associated indicators, to account for societal preferences. In 521
addition, the study has identified, by means of a literature review and participatory 522
workshop, through a transdisciplinary approach, the links between the material/physical 523
elements of landscapes and the different cultural ecosystem services that they provide. 524
Previous work on landscape preferences has not notably addressed the issues involved 525
in upscaling/downscaling of societal preferences for rural agrarian areas. The few 526
studies that have touched on scale issues have been limited to reviews of landscape 527
preference case studies through meta-analysis (van Zanten, Verburg et al. 2014). The 528
authors’ contend that, because MSIF achieves multiple goals simultaneously, i.e. it: (i) 529
engages with the complexity of findings from a comprehensive set of landscape 530
preference studies; (ii) frames landscape preferences into different “criteria”/“visual 531
concepts” linked to different cultural ecosystem services; and (iii) identifies features 532
linked to these criteria/visual concepts that can be mapped at different scales of 533
governance, it successfully addresses the ways in which physical landscape elements 534
contribute to the non-material qualities of different CES. Further, the MSIF addresses 535
not only the issue of upscaling/downscaling of rural landscape preferences, but also 536
goes some way to understanding how elements of the physical landscape contribute to 537
the bundle of cultural ecosystem services generated by rural agrarian landscapes. This 538
represents considerable innovation. 539
The results of the study have shown that it is indeed possible to build a “moderately 540
consensual” list of indicators for conveying aesthetics, stewardship and diversity of 541
rural agrarian areas in Europe. The process of gathering this list of indicators was very 542
much “negotiated” amongst participants, in spite of strong divergences of opinion. For 543
example, where participants defended their favoured indicators rigidly, negotiation 544
could become very complex. Because the workshop was held during an 545
interdisciplinary conference, participants came from a diversity of backgrounds, i.e. 546
social sciences, environmental sciences and geography, encompassing both researchers 547
and practitioners and this contributed to the heterogeneity of the workshops outputs. 548
Fortunately, there was a clear commitment within the participating group to deal with 549
problems that may arise from this inter-disciplinarity and they welcomed the challenge 550

18
involved in this task and made a serious effort to ensure the quality of the outcomes. 551
This goal was facilitated by a recognition that good dialogue between participants from 552
different backgrounds was imperative. Even with a very high commitments from all the 553
stakeholders involved into the exercise, from a total of 40 possible indicators elicited by 554
workshop participants, only 29 met the criteria of robustness as adapted from the work 555
of Tveit et al (2006). Those 29 were afterwards screened, to eliminate overlap and 556
ambiguity, yielding 19 unique and preliminary indicators. Review of these data revealed 557
that some landscape elements, such as hedges, are important for more than one criterion 558
(stewardship and diversity). It is therefore likely these particular indicators, where they 559
exist, will be among the most useful for the assessment of cultural ecosystem services, 560
particularly if these are further developed through qualitative analyses of complimentary 561
data (e.g. data for the conservation status of hedges). 562
It is recognised that measuring some of these indicators would be both time consuming 563
and very expensive. For example, vertical diversity, or land uses:land cover ratio are 564
difficult to measure when using information derived from remote sensing alone. Thus it 565
would be necessary to reconcile remote sensing data with field surveys. Although there 566
are already some widely available field survey datasets available, (for example the 567
Eurostat LUCAS survey, http://ec.europa.eu/eurostat/statistical-568
atlas/gis/viewer/?myConfig=LUCAS-2012.xml), which include photographs of each 569
data point, it is still not known whether this is adequate for creating indicators such as 570
vertical diversity, or land uses:land use ratio, in a systematic manner. Therefore a 571
continuous monitoring of these elements, namely through remote sensing and GIS 572
technologies, might further help to develop this indicator set. As these elements and 573
characteristics can be measured through time and at multiple scales, it is possible to 574
derive list of those that, if properly addressed and calculated, might help to frame policy 575
making at multiple levels of governance. For example in Europe there are, at the 576
moment, two operational indicators sets, namely the EU agri-environmental indicators 577
(AEI) and the Common Monitoring Evaluation Framework (CMEF). While AEI 578
monitor the integration of environmental concerns into the CAP, the common 579
monitoring and evaluation framework (CMEF) measures the performance of the CAP 580
both in Pillar I and II. By definition, the AEI framework focuses on the environment, 581
but includes some indicators belonging to the social domain, such as “farmers’ training 582
levels and use of environmental farm advisory services” and “risk of land 583
abandonment”, necessary to build a storyline of the reasons why integration of 584
19
environmental concern in the CAP may or may not have happened. The CMEF 585
framework hosts instead a more consistent number of social indicators, since some of 586
the CAP objectives specifically aim at improving the social context of rural areas, such 587
as “Improving the competitiveness of the agricultural and forestry sector” and 588
“Improving the quality of life in rural areas”. The indicators presented in this work 589
(Table 1) can be of use for enhancing the CMEF framework. One indicator that might 590
be of particular interest is the land uses/land cover ratio. High ratio scores suggests that 591
the more uses that are made of a single land cover the more likely it is that a rural area 592
will be able to fulfill criteria such as aesthetics, diversity and stewardship. The land 593
uses/land cover ratio can be assessed on the basis of a combination of land cover maps 594
with agricultural data (Verburg and Overmars 2009, Verburg, van de Steeg et al. 2009). 595
There are land cover maps at different spatial scales (e.g. CORINE for the whole 596
Europe and different member country land cover databases). However, it is 597
acknowledged that CORINE land-cover classes might hide considerable diversity of 598
land uses and ecosystem service provision in contrasting European areas. Another 599
related issue is that for some of the social indicators even a high resolution land cover 600
map might not provide the details needed. As an alternative, there are farm-databases, 601
such as FADN1 and FSS
2, which provide relatively easy-access data for land use. 602
This work shows that having data on landscape elements such as hedges, water bodies, 603
litter, traditional farming practices, as well as data on land uses/land cover ratio, can be 604
informative for assessing the ability of rural agrarian areas in supplying cultural 605
ecosystem services. This might contribute to better target policy making by relating 606
those social dimensions to physical rural settings. This is a crucial test for the 607
achievement of the EU Biodiversity Strategy to 2020 targets. A main target of the 608
Strategy is to map and assess ecosystems and their services. In MAES (EC, 2014) it is 609
reported that cultural ecosystem services for agro-ecosystems can be mostly calculated 610
on the basis of data which may be regionally available, while for some of these services 611
further conceptual development is needed. The approach presented in this study fills an 612
important gap, related to the possibility of calculating indicators for cultural ecosystem 613
services at the EU level. This is very important as integrated assessments in this 614
1 FADN http://ec.europa.eu/agriculture/rica/database/database.cfm
2Farm Structure Survey
http://epp.eurostat.ec.europa.eu/cache/ITY_SDDS/EN/ef_esms.htm both (accessed
27.05.2014)

20
category are currently severely under-represented (EC, 2014). Furthermore, results 615
presented in this study provide an important conceptual advance for the inclusion of 616
cultural ecosystem services in established indicator frameworks on which EU policy 617
assessments are based (e.g. Eurostat agri-environmental indicators, CMEF indicators 618
etc). 619
What still is missing in the evaluation undertaken here is the required thresholds of the 620
indicator set to each regional context. Some indicators (i.e. hedges) do not have the 621
same role everywhere, while diversity in land cover compositions can be valued 622
differently in different regions. The way to approach these regional specificities still 623
needs to be developed through a European-wide framework. It is therefore necessary to 624
put the regional contexts into the broader European picture. The merits of different 625
approaches to fine-tune this approach, together with suggestions for improving the 626
workshop process are discussed in Table 3. 627
Table 3 here. 628
5. CONCLUSION 629
Three major research questions set the frame of this study. The first question asked: “Is 630
it possible to summarize a reliable set of insightful measures/indicators for conveying 631
societal preferences for rural agrarian landscapes of Europe?” Both the literature 632
review and the transdisciplinary process developed through the workshop revealed that 633
it is indeed possible to derive a moderate consensus on a list of indicators and so the 634
work on elaborating such list needs to be continued. 635
Question 2: “Are these indicators region specific? Or is there a set that can be said to 636
be generally applicable for all the rural agrarian landscapes of Europe?” The majority 637
of the indicators can be classified as general (G), meaning that it is possible to use them 638
throughout Europe, although value ranges and thresholds might vary from region to 639
region. Consolidation of thresholds and ranges regionally still needs to be developed. 640
Question 3: “At what geographical scale(s) are these measures/indicators be most 641
meaningful? Is it possible to transfer a selected set of measure/indicators across scales 642
in such a way those can inform policy making at different scales of governance?” The 643
majority of possible indicators elicited by participants can be derived at multiple scales 644
of governance, namely: site, landscape, regional and national scales, mostly through the 645

21
use of high resolution satellite imagery, using both remote sensing and GIS 646
technologies. 647
From a policy perspective these findings suggest that it would be possible to undertake 648
Europe-wide assessments of societal preferences for a number of critical land use 649
strategies across Europe. This could include the extension of the biodiversity and habitat 650
enhancement strategies, the widening of the rural forestry and tourism programmes, the 651
introduction of aesthetics and stewardship considerations to ecological assessments, and 652
the scope for designing landscapes of health and exercise as part of any forthcoming 653
wellbeing strategy. What is particularly exciting is that this work could lead to a better 654
participatory planning process for designing fresh approaches to the shaping of 655
ecological and cultural values for “new landscapes”. 656
These results might also be of use for improving existing European indicators 657
frameworks by incorporating cultural ecosystem service provision into them. This 658
would likely have major implications for policy at different levels of governance, as this 659
would make it possible to target to, and monitor policy instruments in, physical rural 660
settings so that the cultural dimension is adequately considered. Taking into 661
consideration the diversity of landscape and regional contexts in Europe, there is still 662
work to be done to allow for region-specific values and thresholds to be applied to each 663
criteria and its indicator set. In practical terms, by developing the conceptual design 664
within a common framework, as described in this paper, using common data sets and 665
sources, a considerable step towards to the inclusion of the cultural ecosystem services 666
in official European wide assessments can be made. 667
668
6. ACKNOWLEDGEMENTS 669
We are grateful to all workshop participants for their essential contribution to the study. 670
Special thanks go to the organising staff of the IALE Europe Conference 671
http://www.iale2013.eu/. Acknowledgements are also due to the Portuguese Science 672
Foundation (FCT) for the funding provided to the post-doctoral scholarship under which 673
the lead author undertook this work (reference SFRH/BPD/69329/2010). This work was 674
funded by FEDER Funds through the Operational Programme for Competitiveness 675
Factors – COMPETE and National Funds through FCT – Foundation for Science and 676
Technology under the Strategic Project PEst-C/AGR/UI0115/2011. 677
678

22
REFERENCES 679
Ahn, S.-H., Y. Choi and Y.-M. Kim (2012). "Static Numbers to Dynamic Statistics: 680 Designing a Policy-Friendly Social Policy Indicator Framework." Social 681
Indicators Research 108(3): 387-400. 682 Antrop, M. (1997). "The concept of traditional landscapes as a base for landscape 683
evaluation and planning. The example of flanders region." Landscape and Urban 684 Planning 38(1-2): 105-117. 685
Antrop, M. (2000). "Background concepts for integrated landscape analysis." 686
Agriculture Ecosystems & Environment(77): 17-28. 687 Appleton, J. (1975). The Experience of Landscape. London & New York, Wiley. 688 Appleton, J. (1998). "Living in the landscape: Toward an aesthetics of environment." 689
British Journal of Aesthetics 38(1): 104-105. 690
Arler, F. (2000). "Aspects of landscape or nature quality." Landscape Ecology 15(3): 691 291-302. 692
Barrett, T. L., A. Farina and G. W. Barrett (2009). "Aesthetic landscapes: An emergent 693 component in sustaining societies." Landscape Ecology 24(8): 1029-1035. 694
Burkhard, B., F. Kroll, F. Müller and W. Windhorst (2009). "Landscapes‘ Capacities to 695 Provide Ecosystem Services – a Concept for Land-Cover Based Assessments." 696 Landscape Online 15: 1-22. 697
Carlson, A. A. (1977). "On the possibility of quantifying scenic beauty." Landscape 698
Planning 4(C): 131-172. 699 Carvalho- Ribeiro, S. M., L. Madeira and T. Pinto Correia (2013). "Developing 700
comprehensive indicators for monitoring rural policy impacts on landscape in 701
Alentejo, Southern Portugal." Danish Journal of Geography 113(2): 87-96. 702
Carvalho-Ribeiro, S. M., A. Migliozzi, G. Incerti and T. Pinto Correia (2013). "Placing 703 land cover pattern preferences on the map: bridging methodological approaches 704
of landscape preference surveys and spatial pattern analysis." Landscape and 705 Urban Planning 114: 53- 68. 706
Carvalho-Ribeiro, S. M., I. L. Ramos, L. Madeira, F. Barroso, H. Menezes and T. Pinto 707
Correia (2013). " Is land cover an important asset for addressing the subjective 708 landscape dimensions?" Land Use Policy 35: 50-60 709
Cash, D. W., W. N. Adger, F. Berkes, P. Garden, L. Lebel, P. Olsson, L. Pritchard and 710 O. Young (2006). "Scale and cross-scale dynamics: Governance and Information 711
in a multilevel World." Ecology & Society 11(2): [online] URL 712 http://ecologyandsociety.org/vol11/iss12/art18/. 713
Cassatela, C. and A. Peano (2011). Landscape Indicators: Assessing and Monitoring 714 landscape quality. 715
Coeterier, J. F. (1996). "Dominant attributes in the perception and evaluation of the 716 Dutch landscape." Landscape and Urban Planning 34(1): 27-44. 717
Cooper, T., K. Hart and D. Baldock (2009). Provision of Public Goods through 718
Agriculture in the European Union Report Prepared for DG Agriculture and 719 Rural Development, Contract No 30-CE-0233091/00-28, Institute for European 720 Environmental Policy IEEP. London. 721
Daniel, T. C. (2001). "Whither scenic beauty? Visual landscape quality assessment in 722 the 21st century." Landscape and Urban Planning 54(1-4): 267-281. 723
Dick, J., J. Maes, R. I. Smith, M. L. Paracchini and G. Zulian (2014). "Cross-scale 724 analysis of ecosystem services identified and assessed at local and European 725
level." Ecological Indicators 38(0): 20-30. 726

23
Dramstad, W. E., G. Fry, W. J. Fjellstad, B. Skar, W. Helliksen, M. L. Sollund, M. S. 727
Tveit, A. K. Geelmuyden and E. Framstad (2001). "Integrating landscape-based 728 values - Norwegian monitoring of agricultural landscapes." Landscape and 729 Urban Planning 57(3-4): 257-268. 730
Dramstad, W. E., M. S. Tveit, W. J. Fjellstad and G. L. A. Fry (2006). "Relationships 731 between visual landscape preferences and map-based indicators of landscape 732 structure." Landscape and Urban Planning 78(4): 465-474. 733
Duncan, J. and D. Ley (1993). "Place/ culture/ representation." Place/ culture/ 734 representation. 735
ELC (2000). The European Landscape Convention, Council of Europe. Strasbourg. 736 Flick, U. (2002). An Introduction to qualitative research. London. 737 Fry, G., M. S. Tveit, A. Ode and M. D. Velarde (2009). "The ecology of visual 738
landscapes: Exploring the conceptual common ground of visual and ecological 739 landscape indicators." Ecological Indicators 9(5): 933-947. 740
Fyhri, A., J. K. S. Jacobsen and H. Tømmervik (2009). "Tourists' landscape perceptions 741 and preferences in a Scandinavian coastal region." Landscape and Urban 742
Planning 91(4): 202-211. 743 García-Llorente, M., B. Martín-López, I. Iniesta-Arandia, C. A. López-Santiago, P. A. 744
Aguilera and C. Montes (2012). "The role of multi-functionality in social 745 preferences toward semi-arid rural landscapes: An ecosystem service approach." 746
Environmental Science & Policy 19–20(0): 136-146. 747 Gobster, P. H., J. I. Nassauer, T. C. Daniel and G. Fry (2007). "The shared landscape: 748
what does aesthetics have to do with ecology?" Landscape Ecology 22: 959-972. 749
Hamilton, A. (2001). "Aesthetics and the environment: The appreciation of nature, art 750
and architecture." British Journal of Aesthetics 41(4): 444-446. 751 Kaplan, R. and S. Kaplan (2011). "Anthropogenic/anthropogenerous: Creating 752
environments that help people create better environments." Landscape and 753
Urban Planning 100(4): 350-352. 754 Lefebvre, M., M. Espinosa, S. Paloma Gomez, M. L. Paracchini, A. Piorrc and I. 755
Zasadac (2014). "Agricultural landscapes as multi-scale public good and the role 756 of the Common Agricultural Policy." Journal of Environmental Planning and 757 Management. 758
Mander, U., F. Muller and T. Wrbka (2005). "Functional and structural landscape 759 indicators: Upscaling and downscaling problems." Ecological Indicators 5(4): 760
267-272. 761 McMichael, A. J., C. D. Butler and C. Folke (2003). "New visions for adressing 762
sustainability." Science 302(12 December): 1919-1920. 763 MEA (2005). Ecosystems and Human Well-being. Synthesis., World Health 764
Organization. 765 Nassauer, J. I. (2011). "Care and stewardship: From home to planet." Landscape and 766
Urban Planning 100(4): 321-323. 767
Ode, A., G. Fry, M. S. Tveit, P. Messager and D. Miller (2009). "Indicators of perceived 768 naturalness as drivers of landscape preference." Journal of Environmental 769 Management 90(1): 375-383. 770
Ode, A., C. M. Hagerhall and N. Sang (2010). "Analysing Visual Landscape 771 Complexity: Theory and Application." Landscape Research 35(1): 111-131. 772
Ode, A. and D. Miller (2011). "Analysing the relationships between indicators of 773 landscape complexity and preference." Environmental Planning B: Planning & 774
Design 38: 24-40. 775
24
Ode, A., M. S. Tveit and G. Fry (2008). "Capturing landscape visual character using 776
indicators: Touching base with landscape aesthetic theory." Landscape Research 777 33(1): 89-117. 778
Ode Sang, Å. and M. S. Tveit (2013). "Perceptions of stewardship in Norwegian 779
agricultural landscapes." Land Use Policy 31(0): 557-564. 780 OECD (2006). The new rural paradigm. Policies and governance. Paris, OECD 781 Paracchini, M. L., C. Capitani, A. M. Schmidt, E. Andersen, D. M. Wascher, P. J. 782
Jones, R. Simoncini, S. Carvalho Ribeiro, G. H. Griffiths, S. R. Mortimer, L. 783 Madeira, I. Loupa Ramos and T. Pinto Correia (2012). Measuring societal 784
awareness of the rural agrarian landscape: indicators and scale issues. EUR 785 25192 EN - 2012, Joint Research Centre. 786
Paracchini, M. L., C. Pacini, M. L. M. Jones and M. Pérez-Soba (2011). "An 787
aggregation framework to link indicators associated with multifunctional land 788 use to the stakeholder evaluation of policy options." Ecological Indicators 11(1): 789 71-80. 790
Paracchini, M. L., G. Zulian, L. Kopperoinen, J. Maes, J. P. Schägner, M. Termansen, 791
M. Zandersen, M. Perez-Soba, P. A. Scholefield and G. Bidoglio (2014). 792 "Mapping cultural ecosystem services: A framework to assess the potential for 793 outdoor recreation across the EU." Ecological Indicators 45(0): 371-385. 794
Pelosi, C., M. Goulard and G. Balent (2010). "The spatial scale mismatch between 795
ecological processes and agricultural management: Do difficulties come from 796 underlying theoretical frameworks?" Agriculture, Ecosystems & Environment 797 139(4): 455-462. 798
Pinto-Correia, T. and L. Kristensen (2013). "Linking research to practice: The landscape 799
as the basis for integrating social and ecological perspectives of the rural." 800 Landscape and Urban Planning 120(0): 248-256. 801
Pinto-Correia, T., C. Machado, F. Barroso, P. Picchi, N. Turpin, J.-P. Bousset, N. 802
Chabab and Y. Michelin (2013). "How do policy options modify landscape 803 amenities? An assessment approach based on public expressed preferences." 804
Environmental Science & Policy 32(0): 37-47. 805 Pinto Correia, T. and S. M. Carvalho Ribeiro (2012). "The Index of Function Suitability 806
(IFS): A new tool for assessing the capacity of landscapes to provide amenity 807
functions." Land Use Policy 29(1): 23–34. 808 Proshansky, H. M., A. K. Fabian and R. Kaminoff (1983). "Place-identity: Physical 809
world socialization of the self." Journal of Environmental Psychology 3(1): 57-810 83. 811
Ribe, R. G. (1989). "The aesthetics of forestry: What has empirical preference research 812 taught us?" Environmental Management 13(1): 55-74. 813
Rogge, E., F. Nevens and H. Gulinck (2007). "Perception of rural landscapes in 814 Flanders: Looking beyond aesthetics." Landscape and Urban Planning 82(4): 815 159-174. 816
Sayadi, S., M. C. Gonzalez-Roa and J. Calatrava-Requena (2009). "Public preferences 817 for landscape features: The case of agricultural landscape in mountainous 818 Mediterranean areas." Land Use Policy 26: 334–344. 819
Schmitz, M. F., I. De Aranzabal and F. D. Pineda (2007). "Spatial analysis of visitor 820 preferences in the outdoor recreational niche of Mediterranean cultural 821
landscapes." Environmental Conservation 34(4): 300-312. 822 Selman, P. (2006). Planning at the landscape scale. London and New York, Routledge. 823

25
Sevenant, M. and M. Antrop (2009). "Cognitive attributes and aesthetic preferences in 824
assessment and differentiation of landscapes." Journal of Environmental Management 825 90(9): 2889-2899. 826 Sevenant, M. and M. Antrop (2010). "Transdisciplinary landscape planning: Does the 827
public have aspirations? Experiences from a case study in Ghent (Flanders, 828 Belgium)." Land Use Policy 27(2): 373-386. 829
Stanchi, S., M. Freppaz, A. Agnelli, T. Reinsch and E. Zanini (2012). "Properties, best 830 management practices and conservation of terraced soils in Southern Europe 831 (from Mediterranean areas to the Alps): A review." Quaternary International 832
265: 90-100. 833 Surova, D. and T. Pinto-Correia (2008). "Landscape preferences in the cork oak 834
Montado region of Alentejo, southern Portugal: Searching for valuable 835
landscape characteristics for different user groups." Landscape Research 33(3): 836 311-330. 837
Swanwick, C. (2002). Landscape Character Assessment. Guidance for England and 838 Scotland, Scottish Natural Heritage 839
Swanwick, C. (2009). "Society's attitudes to and preferences for land and landscape." 840 Land Use Policy 26(Supplement 1): S62-S75. 841
Tahvanainen, L., L. Tyrvainen, M. Ihalainen, N. Vuorela and O. Kolehmainen (2001). 842 "Forest management and public perceptions - visual versus verbal information." 843
Landscape and Urban Planning 53(1-4): 53-70. 844 TEEB (2010). "Chapter 2 Biodiversity, ecosystems and ecosystem services ". 845 Tempesta, T. (2010). "The perception of agrarian historical landscapes: A study of the 846
Veneto plain in Italy." Landscape and Urban Planning 97(4): 258-272. 847
Tips, W. E. J. and T. Vasdisara (1986). "The influence of the socio-economic 848 background of subjects on their landscape preference evaluation." Landscape 849 and Urban Planning 13(Short communication): 225-230. 850
Tress, B., G. Tress, H. Decamps and A. M. d'Hauteserre (2001). "Bridging human and 851 natural sciences in landscape research." Landscape and Urban Planning 57(3-4): 852
137-141. 853 Turpin, N., P. Dupraz, C. Thenail, A. Joannon, J. Baudry, S. Herviou and P. Verburg 854
(2009). "Shaping the landscape: Agricultural policies and local biodiversity 855
schemes." Land Use Policy 26(2): 273-283. 856 Tveit, M., A. Ode and G. Fry (2006). "Key concepts in a framework for analysing visual 857
landscape character." Landscape Research 31(3): 229-255. 858 Ulrich, R. S. (1986). "Human responses to vegetation and landscapes." Landscape and 859
Urban Planning 13(C): 29-44. 860 Van Den Berg, A. E., C. A. J. Vlek and J. F. Coeterier (1998). "Group differences in the 861
aesthetic evalution of nature development plans: A multilevel approach." Journal 862 of Environmental Psychology 18(2): 141-157. 863
Van Eetvelde, V. and M. Antrop (2004). "Analyzing structural and functional changes 864
of traditional landscapes - two examples from Southern France." Landscape and 865 Urban Planning 67(1-4): 79-95. 866
van Zanten, B. T., P. H. Verburg, M. J. Koetse and P. J. H. van Beukering (2014). 867 "Preferences for European agrarian landscapes: A meta-analysis of case studies." 868 Landscape and Urban Planning 132(0): 89-101. 869
Verburg, P. H. and K. P. Overmars (2009). "Combining top-down and bottom-up 870 dynamics in land use modeling: exploring the future of abandoned farmlands in 871
Europe with the Dyna-CLUE model." Landscape Ecology 24(9): 1167-1181. 872

26
Verburg, P. H., J. van de Steeg, A. Veldkamp and L. Willemen (2009). "From land 873
cover change to land function dynamics: A major challenge to improve land 874 characterization." Journal of Environmental Management 90(3): 1327-1335. 875
Volk, M. and F. Ewert (2011). "Scaling methods in integrated assessment of agricultural 876
systems—State-of-the-art and future directions." Agriculture, Ecosystems & 877 Environment 142(1–2): 1-5. 878
Wu, J. (2010). "Landscape of culture and culture of landscape: Does landscape ecology 879
need culture?" Landscape Ecology 25(8): 1147-1150. 880
881
882

27
Figures 883
Figure 1. Schematic representation of the whole methodological framework of MSIF 884
885
886
887
888
889
890
891
892
893
894
895
896
897
898
Figure 2. The participatory workshop in action 899
900
901
C/VC/CES
STEWARDSHIP
DIVERSITY
ASTHETICS
…
IDENTITY
Literature review Participatory Workshop
Criteria for preference(C)
Attributes, elements, features
related to the
different C/VC/CES
Indicators
…
Ratio land use/land cover
Visual concepts (VC)
Scale at which can be
measured?
Tool for policy making and
monitoring of Cultural ES
Cultural Ecosystem
Services(CES)

28
Tables 902
Table 1. Criteria and related definitions 903
Criteria Definition
STEWARDSHIP Refers to the sense of order and care present in the landscape
reflecting active and careful management (Ode Sang and Tveit,
2013).
DIVERSITY Is defined as the richness and diversity of landscape elements and
features noted for their proximity and location, as well as the
grain size of the landscape (Tveit et al., 2006).
AESTHETICS Relates to landscape characteristics or features which are able to
promote a feeling of liking or disliking (adapted from Gobster et
al., 2007).
904
Table 2. List of measures/indicators derived from the workshop and its preliminary 905
assessment 906
29
Cri
teri
a Indicators
Sco
re
Ap
pro
pri
a
te sc
ale
to
mea
sure
Gen
eral
(G)
or
Reg
ion
spec
ific
(RS
)
Tra
dit
ion
al
fea
ture
s
Rati
o l
an
d
use
/lan
d
cover
ST
EW
AR
DS
HIP
The “quality” of man- made structures
(hedges in good condition status and made
with local resources e.g. stone walls)
5 S,L;N
G* X
Regularity of the landscapes (as man
introduces regular shapes) number of man-
made structures with a function: hedges,
5 S,L;N
G* X
Adequate stocking rate of livestock-
according to environmental conditions
2 S,L,R G* X X
“Knowledgeable and wise” land
management (multifunctionality, different
uses of the same plot)
S,L,R
G* X
Maintaining traditional irrigation systems S,L,R
RS X
Amount of shrubs in agriculture/ forest
land – stewardship might also mean low
vertical diversity-
S,L;N
G* X
Land abandonment and discontinuation of
farming ( is seen as negative)
S,L;N
G* X
No waste S,L,R G
DIV
ER
SIT
Y
Hedges between agriculture and other uses S,L,R G* X
Richness-number of elements, land cover
types in a view shed
7 S,L,R,N,E G * X
Diversity of high-shanon,gini,simpson 6 S,L,R,N,E G* X
Types of use per land covers (e.g. grass
and trees)
3 S,L,R G * X
Number of endemic plant/animal species
per ha
3 S,L,R G * X
Presence of trees/woodlands in field (no
agreement)
2 S,L,R G* X
Diversity of use in time S,L,R G* X X
Number of crops in crop rotation S,L,R G * X X
Vertical diversity S,L,R G* X
AE
ST
HE
TIC
S
Water bodies (no agreement) society in
general likes water bodies-but not all of
them…
4 S,L,R,N,E G*
Sublime features e.g. mountains 4 S,L,R,N,E G*
No litter 3 S,L,R,N,E G*
Variety of colours/smell e.g. different land
uses on a single land cover (no agreement
as too much variety might be confusing)
3 S,L G* X X
Number of listed trees classified as
monuments in agrarian areas
2 S,L,N G* X
Density of classified trees in agricultural
landscapes
1 S,L,N G* X
“Old landscapes still functional”, time 2 S,L G* X X

30
907
908
depth, time origin is long
Listed built elements 1 S,L,N G* X
Sound/tranquillity S,L,N G*
Features associated with stewardship (no
agreement) we like to see cared for rural
areas, neat, ordered and clean
S,L,N RS X
Amount of waste and decay of man-made
structures (is seen as negative)
S,L,N G* X
Light pollution (negative) S,L,N G

31
Table 3. Advantages and disadvantages of the workshop method 909
910
Advantages Disadvantages Ways to improve the approach
The division of participants into small groups is
useful:
- gives time for all participants to contribute and
encourages participation from less confident
individuals,
-the cross-talk taking place in the small groups
provided an opportunity for participants to learn
from each other.
- the fact that there is very little structured
process that needed to be followed meant that
individuals were allowed to contribute as much
or as little as they wanted; the process did not
dominate the spirit of the group.
Because there was little opportunity to discuss the
merits of ideas within the whole group, there is a
danger that the merit of good ideas might be missed
by the wider group through lack of understanding.
Provide more time for the plenary discussion-This
can be done by for example reducing the time in the
stations. It might have been better to allow more time
for the first round of small group discussions and less
time for subsequent rounds instead of a fixed 15
minutes in each station. When a group comes to a
station previously occupied by other groups, they are
building on the information already provided by the
earlier group(s), i.e. some of the thinking has already
been done.
The process of dissolving groups between
stations was useful in that it altered the dynamics
of the groups, particularly breaking up negative
interactions between individuals, such as
dominance of passive by assertive individuals.
As the group was changing every 15 minutes there
was not a lot of opportunity for the testing of the
merits of ideas being suggested by participants
cross-questioning.
Organize a second round of voting after the plenary
session. If there had been wider discussion of the ideas
raised a second round of voting would have been
possible, so that participants could revise their
opinions in light of new information received in the
plenary discussion. This will also encourage
participants cross questioning
The very explicitly goal oriented tasks, coupled
with clear instructions of a straightforward
methodology, meant that there was little wastage
of time (in clarifying purpose of methods) and
The facilitation process was not homogeneous. To give more “strict rules” to the stations
facilitators in order to have similar processes
occurring in the different stations. (Rules and ways to
proceed were given to facilitators beforehand,
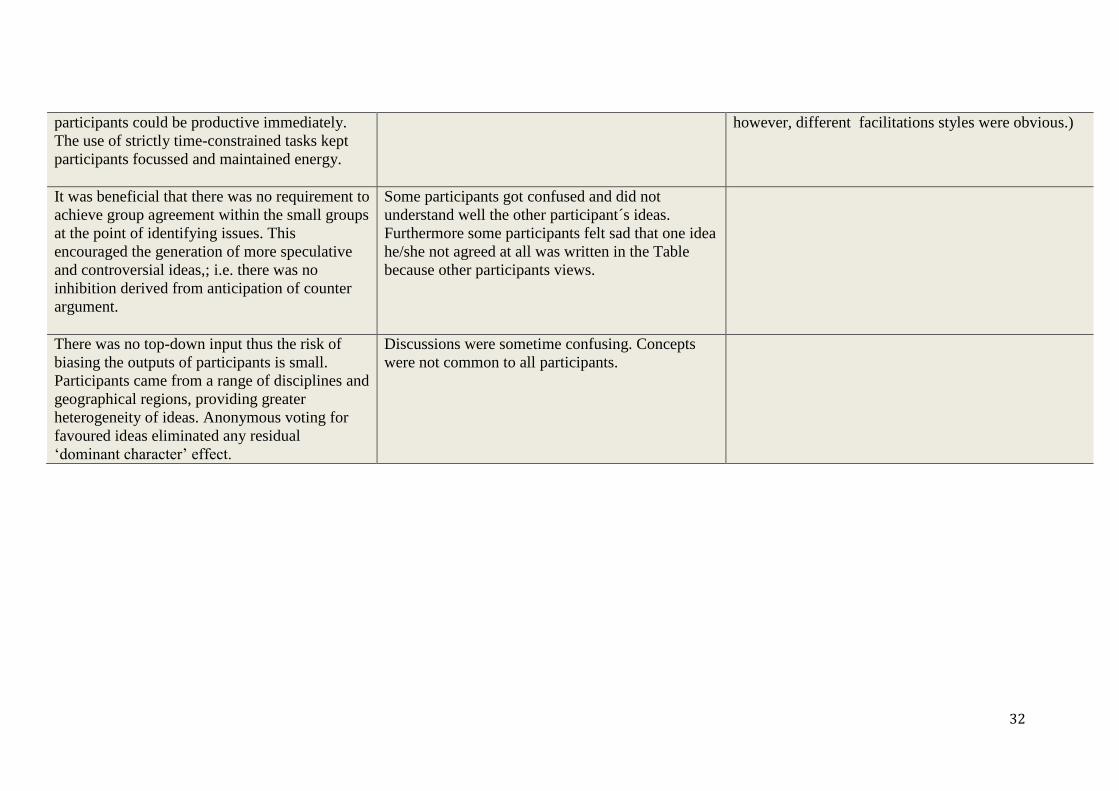
32
participants could be productive immediately.
The use of strictly time-constrained tasks kept
participants focussed and maintained energy.
however, different facilitations styles were obvious.)
It was beneficial that there was no requirement to
achieve group agreement within the small groups
at the point of identifying issues. This
encouraged the generation of more speculative
and controversial ideas,; i.e. there was no
inhibition derived from anticipation of counter
argument.
Some participants got confused and did not
understand well the other participant´s ideas.
Furthermore some participants felt sad that one idea
he/she not agreed at all was written in the Table
because other participants views.
There was no top-down input thus the risk of
biasing the outputs of participants is small.
Participants came from a range of disciplines and
geographical regions, providing greater
heterogeneity of ideas. Anonymous voting for
favoured ideas eliminated any residual
‘dominant character’ effect.
Discussions were sometime confusing. Concepts
were not common to all participants.

33
911
Annexe 1. Assessment of the workshop indicators using the criteria listed by Tveit et al 912
(2006) 913
Recommended