Assessing Students for Instruction
Mercer ch. 3

Steps for Individualized Programming
1. Assess to identify target skill or content
2. Determine factors likely to facilitate learning
3. Plan instruction 4. Begin daily data-managed
instruction
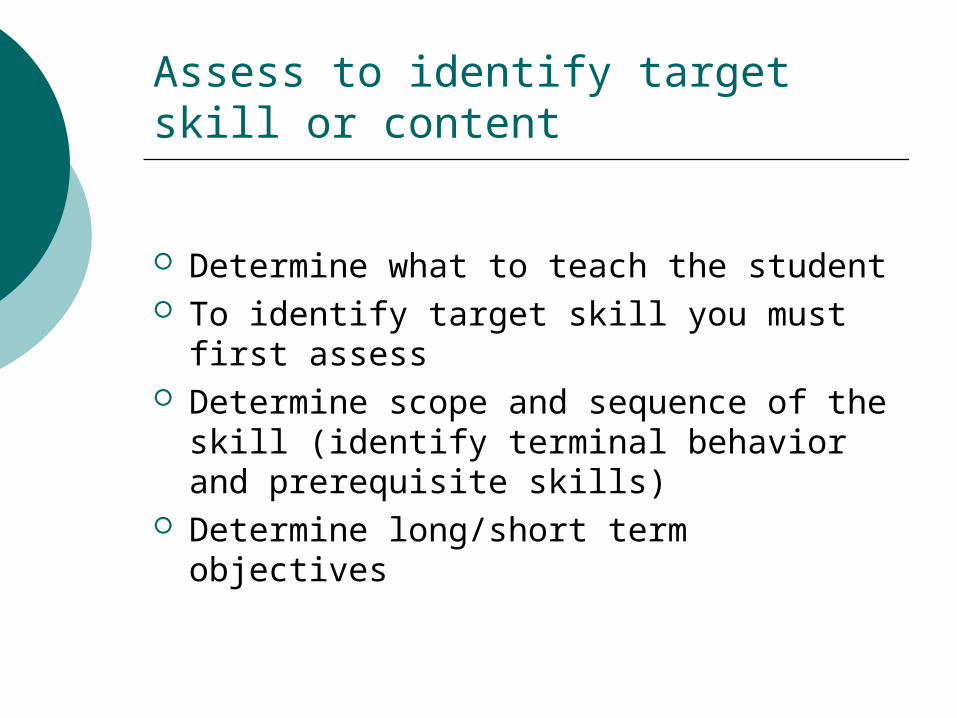
Assess to identify target skill or content
Determine what to teach the student To identify target skill you must first
assess Determine scope and sequence of the skill
(identify terminal behavior and prerequisite skills)
Determine long/short term objectives

Determine factors likely to facilitate learning
Focus on HOW to teach the student Look at environmental variable that
influence achievement Systematic observations – look at ABC’s Formal assessment Criterion tests Rating scales Interviews Alternative assessments

Plan instruction
Look at what to teach in step 1 Combine with how to teach in step 2 Constant monitoring of student
progress

Begin daily data-managed instruction
Is the student making adequate progress through the teach – test – teach cycle
If not consider 4 options Repeat same instructions Modify instructional procedures Introduce a new teaching strategy Change to an earlier task

Stages of Learning
Acquisition Proficiency Maintenance Generalization Adaption
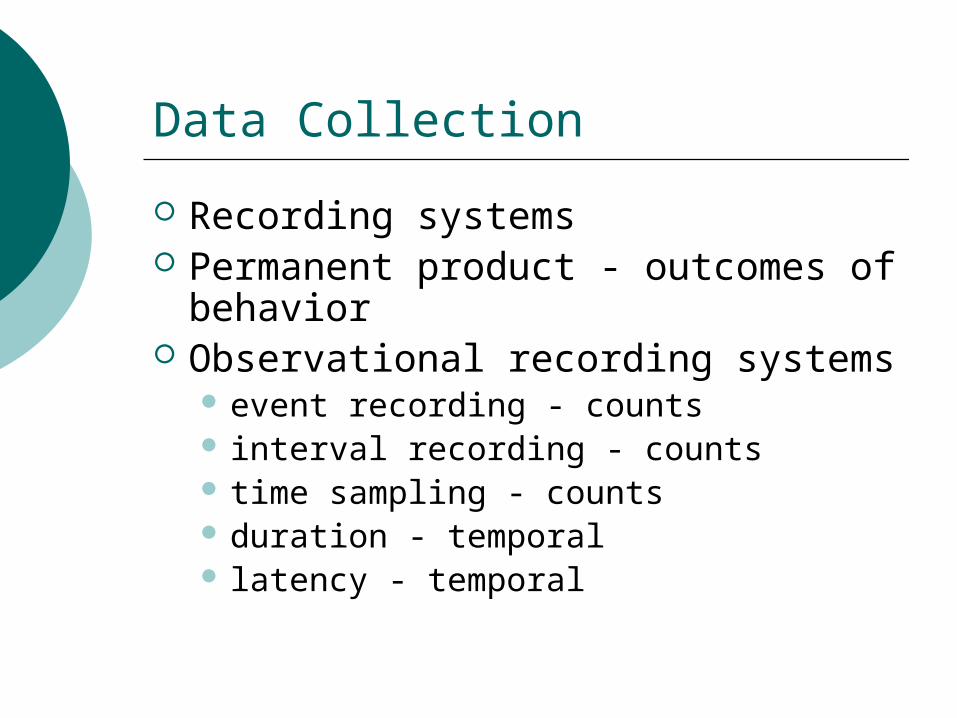
Data Collection
Recording systems Permanent product - outcomes of
behavior Observational recording systems
event recording - counts interval recording - counts time sampling - counts duration - temporal latency - temporal
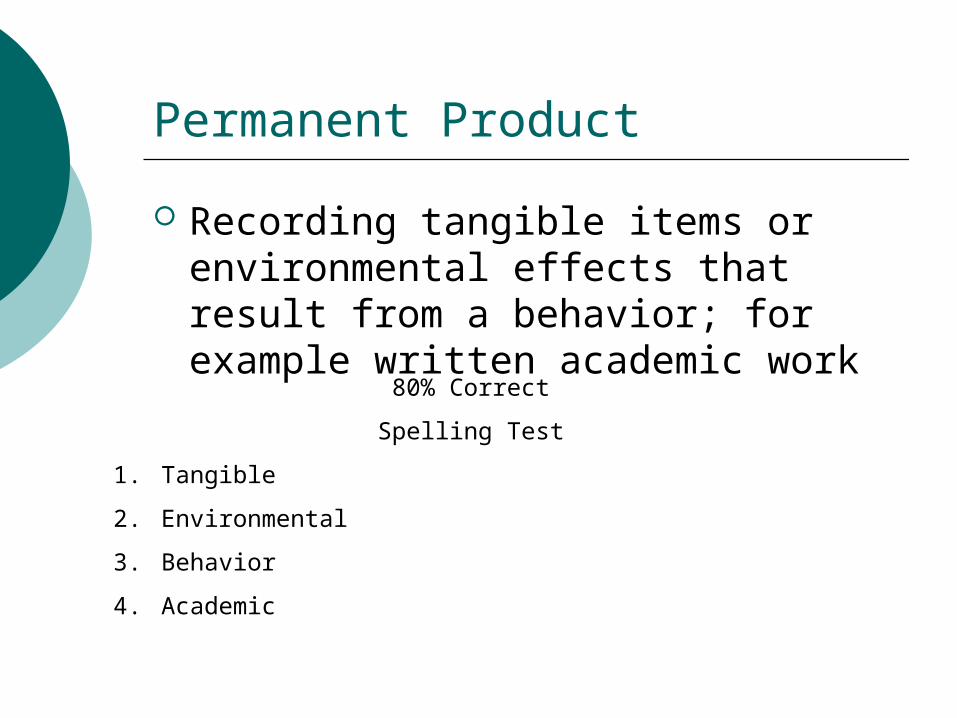
Permanent Product
Recording tangible items or environmental effects that result from a behavior; for example written academic work
80% Correct
Spelling Test
1. Tangible
2. Environmental
3. Behavior
4. Academic

Event recording
Recording a tally or frequency count of behavior as it occurs within an observation period; an observational recording procedure
Assignments Day Due Completed 1 5 // 2 6 /// 3 6 //// 17 9

Interval recording
An observational recording system in which an observation period is divided into a number of short intervals. The observer counts the number of intervals when the behavior occurs
+ - + + - -- + + + + -Number of
intervals attending
Total number of intervals

Time sampling
An observational recording system in which an observation period is divided into equal intervals; the target behavior is observed at the end of each interval
40 minutesNumber of intervals
on task
_________________
Total number of intervals
+ - + - + + - + + -

Duration
Recording the amount of time between the initiation of a response and its conclusion; an observational recording procedure
Observation time:11:00 – 11:30
Duration Min.Start Stop11:04 11:08 411:11 11:16 511:21 11:23 211:26 11:30 4

Latency
Recording the amount of time between the presentation of the cue and the initiation of a response. Latency
Signal Begin(Minutes)
11:02 11:05 3 11:03 11:06 3 11:01 11:02 1 11:04 11:07 3 10:59 11:01 2 12

Simple Line Graph
Set of boundariesaxes
x-axis - abscissa, horizontaly-axis - ordinate, verticalAxes are drawn in a ratio of 2:3
If y = 2, then x = 3
Abscissa
The x-axis serves as the boundary of the graph.
Shows how frequently data were collected during the period represented on the graph.
The right boundary of the graph ends at the last session. Horizontal line – bottom boundary

Ordinate
Vertical line serves as the left-hand boundary of the graph.
The label identifies the target behavior and kind of data that is being reported.

Simple line graph
High School Student Detentions
0
20
40
60
80
100
1st Qtr 2nd Qtr 3rd Qtr 4th QtrGrading Periods
2003-2004
# st
uden
t de
tent
ions
East

Alternative Grading
“I see many of you anticipated a pop quiz today.”
Concerns in Grading
Assigned grades have different meaning to teachers, school counselors, parents, and students
Teachers’ concerns about standards of performance for students with accommodations
Classroom teachers’ concerned that inclusion of students with disabilities in their classroom might result in decreased standards for all students
Concerns Cont.
In the 1990s research in secondary schools found 60% students with disabilities were graded using the same criteria as their peers without disabilities
Most students with disabilities are passing their courses, but receiving much lower grades than peers without disabilities
High percentage of students with LD who received poor grades over a period of time, drop out

Grading Options
Letter/Number Grades Most common method Does not accurately convey the feedback for areas of improvement and how
much a student has learned Progress Checklists
Contain criterion related goals assessing students at a starting point
Provides feedback to parents & students on progress Can be time consuming
Contracts Provide feedback on what goals are accomplished Does not provide feedback when unsuccessful in reaching goals
Work Samples Accurately displays progress and product but may not show
precise growth in process By itself, will not give a student direction for improvement – need
input from teacher

Grading Options Cont.
CBAs Directly assess mechanical skills (rote facts, rules, sequences),
tests basic skills not concepts Effectively show progress by using graphs
Mastery Levels Divides content into subcomponents with pretests to create a
minimum performance standard and posttests to examine mastery
Multiple Grading All grades are averaged together Doesn’t give information on how to improve
Portfolios Contains works in progress Focus on meaningful, personal learning goals
Rubrics Provide criteria describing student performance at various levels
of proficiency

Common Assessment Accommodations
TimingExtended timeAlter time of dayAdminister test over several sessions and daysAllow frequent breaks
PresentationAudiocassetteLarge printRepeated directionsSign language assistanceBrailleMagnification
SettingSmall-group administrationHospital administrationStudy carrelSeparate roomHomebound
ResponseDictate to scribeSign language assistanceBraille writerWord processor
Recommended