RESEARCH Open Access
Assembling a geospatial database oftsetse-transmitted animal trypanosomosisfor AfricaGiuliano Cecchi1*, Massimo Paone2, Udo Feldmann3, Marc JB Vreysen3, Oumar Diall1 and Raffaele C Mattioli2
Abstract
Background: African animal trypanosomosis (AAT), or nagana, is widespread within the tsetse-infested belt ofsub-Saharan Africa. Although a wealth of information on its occurrence and prevalence is available in theliterature, synthesized and harmonized data at the regional and continental scales are lacking. To fill this gapthe Food and Agriculture Organization of the United Nations (FAO) launched the Atlas of tsetse and AAT,jointly implemented with the International Atomic Energy Agency (IAEA) in the framework of the ProgrammeAgainst African Trypanosomosis (PAAT).
Methods: The Atlas aims to build and regularly update a geospatial database of tsetse species occurrenceand AAT at the continental level. The present paper focuses on the methodology to assemble a dynamic databaseof AAT, which hinges on herd-level prevalence data as estimated using various diagnostic techniques. A range ofancillary information items is also included (e.g. trypanosome species, survey period, species and breed of animals,husbandry system, etc.). Input data were initially identified through a literature review.
Results: Preliminary results are presented for Ethiopia, Kenya and Uganda in East Africa: 122 papers were identified andanalyzed, which contained field data collected from January 1990 to December 2013. Information on AAT wasextracted and recorded for 348 distinct geographic locations. The presented distribution maps exemplify the range ofoutputs that can be directly generated from the AAT database.
Conclusions: Activities are ongoing to map the distribution of AAT in all affected countries and to develop the tsetsecomponent of the Atlas. The presented methodology is also being transferred to partners in affected countries, with aview to developing capacity and strengthening data management, harmonization and sharing. In the future, geospatialmodelling will enable predictions to be made within and beyond the range of AAT field observations. This variety ofinformation layers will inform decisions on the most appropriate, site-specific strategies for intervention against AAT.Data on the occurrence of human-infective trypanosomes in non-human hosts will also provide valuable informationfor sleeping sickness control and elimination.
Keywords: African animal trypanosomosis, GIS, Atlas, Kenya, Uganda, Ethiopia, Tsetse, Glossina, Epidemiology, Zoonosis
* Correspondence: [email protected] and Agriculture Organization of the United Nations (FAO),Sub-regional Office for Eastern Africa, Addis Ababa, EthiopiaFull list of author information is available at the end of the article
© 2014 Food and Agriculture Organization of the United Nations; licensee BioMed Central Ltd. This is an Open Access articlein the spirit of the BioMed Central Open Access Charter (http://www.biomedcentral.com/info/about/charter), without anywaiver of FAO’s privileges and immunities under international law, convention or agreement. The views expressed in thisarticle are those of the author(s) and do not necessarily reflect the views of the Food and Agriculture Organization of theUnited Nations.
Cecchi et al. Parasites & Vectors 2014, 7:39http://www.parasitesandvectors.com/content/7/1/39
Résumé
Introduction: La trypanosomose animale africaine (TAA), aussi appelée nagana, est largement répandue dans leszones d’Afrique sub-saharienne infestées par les glossines. Malgré la grande quantité d’informations disponibles dans lalittérature sur sa répartition et prévalence, les données synthétisées et harmonisées aux niveaux régional et continentalsont inexistantes. Pour faire face à ce problème, l’Organisation des Nations Unies pour l’alimentation et l’agriculture(FAO) a ouvert un chantier sur l’Atlas des glossines et de la TAA, exécuté conjointement avec l’Agence Internationalede l’Energie Atomique (AIEA) dans le cadre du Programme de Lutte contre la Trypanosomose Africaine (PLTA).
Méthodes: L’Atlas vise à créer et mettre à jour régulièrement une base de données spatialisée au niveau continentalsur l’infection trypanosomienne animale et sur les différentes espèces de glossine. Cet article se concentre sur laméthodologie pour développer une base de données dynamique de la TAA, qui repose sur des données deprévalence au niveau du troupeau estimée par différentes techniques de diagnostic. Plusieurs informationssupplémentaires sont incluses (ex. espèce de trypanosomes, date de collecte des données, espèce et race des animauxet système d’élevage, etc.). Dans une première phase de développement, les données à utiliser ont étés identifiées àtravers un examen systématique de la littérature publiée.
Résultats: Cet article présente les résultats préliminaires pour l’Ethiopie, le Kenya et l’Ouganda en Afrique de l’Est : 124articles ont été identifiés et analysés, qui contiennent des données de terrain collectées entre Janvier 1990 etDécembre 2013. Les informations sur la TAA ont été extraites et enregistrées pour 348 localités différentes. Les cartesde répartition ici présentées donnent un exemple des couches d’information pouvant être générées directement àtravers l’Atlas.
Conclusions: Les activités sont en cours pour cartographier la TAA dans tous les pays affectés, et pour développer lacomposante ‘glossines’ de l’Atlas. La méthodologie ici présentée est en train d’être transférée aux partenaires dans lespays affectés, dans le but de développer les capacités et de renforcer la gestion, l’harmonisation et le partage desdonnées. Dans le futur, la modélisation géospatiale permettra de faire des prédictions soit à l'intérieur soit au-delà desobservations de terrain. Cet éventail de couches d’information doit éclairer les décisions sur les stratégies d’interventioncontre la TAA les plus appropriées pour chaque site. Les données sur l’infection desanimaux avec des trypanosomes zoonotiques seront également de grande valeur pour la lutte et l’élimination de lamaladie du sommeil.
BackgroundAfrican animal trypanosomosis (AAT), also known as na-gana, refers to a group of vector-borne parasitic diseasesof ruminants, camels, equines, swine and carnivores [1].The aetiological agents (several species of unicellular fla-gellates called trypanosomes) are transmitted by the in-fected bite of the tsetse fly (Genus: Glossina). The diseasecauses heavy direct losses to livestock keepers as mea-sured by mortality, morbidity and reduced productivity atthe herd level. In the deprived rural settings where it oc-curs, AAT further reduces food security by limiting the ex-ploitation of animal draught power and by constrainingthe optimal utilization of fertile lands [2]. Nagana is widelydistributed across the tsetse-infested belt of sub-SaharanAfrica, where approximately 60 million cattle are esti-mated to be at risk of infection over an area of about 10million km2 [3]. Sleeping sickness, or human African try-panosomosis (HAT), is the human form of the disease,which occurs in more circumscribed foci of endemicity[4,5] and 70 million people are estimated to be at risk ofcontracting the disease [5,6].After a long period of neglect, during the last 15 years
ambitious initiatives have been trying to address the
problem of tsetse-transmitted trypanosomosis in its con-tinental dimension.In 1997, the Programme against African Trypanoso-
mosis (PAAT) was established to assist affected Africancountries in their efforts to control and eventually elim-inate the disease [7]. PAAT brought together the effortsof the Food and Agriculture Organization of the UnitedNations (FAO), the World Health Organization (WHO),the International Atomic Energy Agency (IAEA) and theAfrican Union Interafrican Bureau for Animal Resources(AU-IBAR). At the same time, resolutions of the WorldHealth Assembly prompted WHO to strengthen its sup-port to countries affected by sleeping sickness [8,9], withthe objective to eliminate HAT as a public health prob-lem and to establish sustained surveillance systems inall endemic countries. Finally, successive decisions of theHeads of State and Government of the African Unionin 2000 (AHG/156 – XXXVI) and 2001 (AHG/169 –XXXVII) endorsed and committed to the plan of ac-tion for the Pan-African Tsetse and TrypanosomosisEradication Campaign (PATTEC) [10].If sound decisions are to be made, these important initia-
tives need reliable epidemiological information at a range of
Cecchi et al. Parasites & Vectors 2014, 7:39 Page 2 of 10http://www.parasitesandvectors.com/content/7/1/39
spatial scales. For example, spatially-explicit evidence is ne-cessary to select priority areas for intervention [11], bothwhere disease control can be regarded as a cost-effectiveoption [12,13], and where the elimination of the tsetse flyvector appears as a feasible and sustainable endeavour [14].In order to meet this need for harmonized and compre-
hensive spatial information, a recent WHO/FAO initiativein the framework of PAAT (i.e. the Atlas of HAT), hasfocused on the systematic mapping of HAT occurrence[4,15,16] and risk [6,17]. In a related activity, a compre-hensive and spatially-explicit dataset has also been as-sembled for sleeping sickness cases reported from non-endemic countries [18].Despite a compelling need, the substantial progress
made in mapping HAT has not yet been matched bycomparable advances in the continental mapping of tse-tse and AAT [3]. Tsetse distribution maps at the Africanlevel are old [19,20] and continental maps of AAT havenever been generated [3]. This knowledge gap poses ser-ious constraints to evidence-based decision-making, andseverely limits the possibility to assess the progress to-wards the goals set by various stakeholders at the con-tinental level.In an effort to fill this gap, FAO launched the Atlas of
tsetse and AAT, an initiative to which IAEA has adheredto in the framework of PAAT [21,22]. Its immediate goalis to assemble contemporary, georeferenced data on theoccurrence of Glossina species and AAT in sub-SaharanAfrica. The present paper focuses on the AAT compo-nent and describes the methodology developed to assem-ble a database of AAT distribution. Preliminary results arepresented for three east African countries, i.e. Ethiopia,Kenya and Uganda, and the way forward is outlined.
MethodsThe general approach adopted to build the Atlas of tse-tse and AAT is summarized in Figure 1. In essence, allpublications and input data derived from the varioussources are collated and stored in a centralized data re-pository. Subsequently, selected information items areextracted from the sources, harmonized and entered intoa geo-spatial database. The database is structured intothree simple tables, which are devoted to data sources,geographical data and epidemiological information re-spectively. The data abstraction protocol is described indetail in the Additional file 1, and it is an adaptation ofsimilar work carried out for malaria [23]. Geographic In-formation Systems (GIS) enable distribution maps to begenerated directly from the geo-database, while geospa-tial modelling will be used in the future to make predic-tions on tsetse and AAT distribution within and beyondthe range of field observations.At the present first stage of development, the Atlas is fo-
cusing on information published in peer-reviewed articles
from scientific journals. Grey literature and additional un-published datasets will be addressed at a later stage.
Data sourcesThe search strategy used to identify suitable scientificpublications makes use of internet libraries, archivesand indexes. In particular, the PAAT Tsetse and Try-panosomosis Information Bulletin (http://www.fao.org/ag/againfo/programmes/en/paat/ttiq.html), PubMed Central(http://www.ncbi.nlm.nih.gov/pubmed/) and CabDirect (http://www.cabdirect.org/) are the main tools used for data search.A temporal criterion of inclusion was applied, in that pa-pers were only taken into consideration if containing fielddata collected from January 1990 onwards.For each identified data source, a file is stored in the
data repository, and a record is created in the ‘Datasources’ table of the AAT geo-database. The record in-cludes a unique numerical identifier for the data source,the names of the authors, as well as the title and the yearof publication. The study country is also noted, along-side external and internal links – the former correspond-ing to a URL (i.e. internet address of the paper), and thelatter to an internal link to the respective PDF file in thedata repository. The ‘Data sources’ table is completedwith information on the type of spatially-explicit datathe paper contains (i.e. data on animal trypanosomosis,on tsetse occurrence, or both). This latter flag enablespapers to be rapidly selected for data extraction for theAAT and the tsetse components of the Atlas.
Geographical dataThe table for geographical data is designed to captureinformation on the locations of epidemiological rele-vance, as described and referred to in the data sources.In particular, the table for geographic data includes: aunique numeric identifier of the location, the locationname, the geographic coordinates (i.e. latitude and longi-tude, based on the WGS84 datum), the country name andthe names of lower-level administrative units (provinces,districts, etc.). Each location is identified by a single set ofcoordinates, and therefore it is represented as a pointentity in the GIS. If not available in the papers, geographiccoordinates are searched from a variety of sources, includ-ing many publicly available gazetteers [15].Although represented as point entities, the epidemio-
logical data referring to the different locations will alwayshave a bidimensional area of applicability. For example, ifall animals sampled in a survey come from a single villageand they are managed sedentarily, the survey point willprobably refer to an area of a few square kilometres. Bycontrast, if a source reports the AAT prevalence for awhole district, it is the centroid of the district that willidentify the survey in the database and in the GIS, andthat point will be representative of a broader area. If
Cecchi et al. Parasites & Vectors 2014, 7:39 Page 3 of 10http://www.parasitesandvectors.com/content/7/1/39
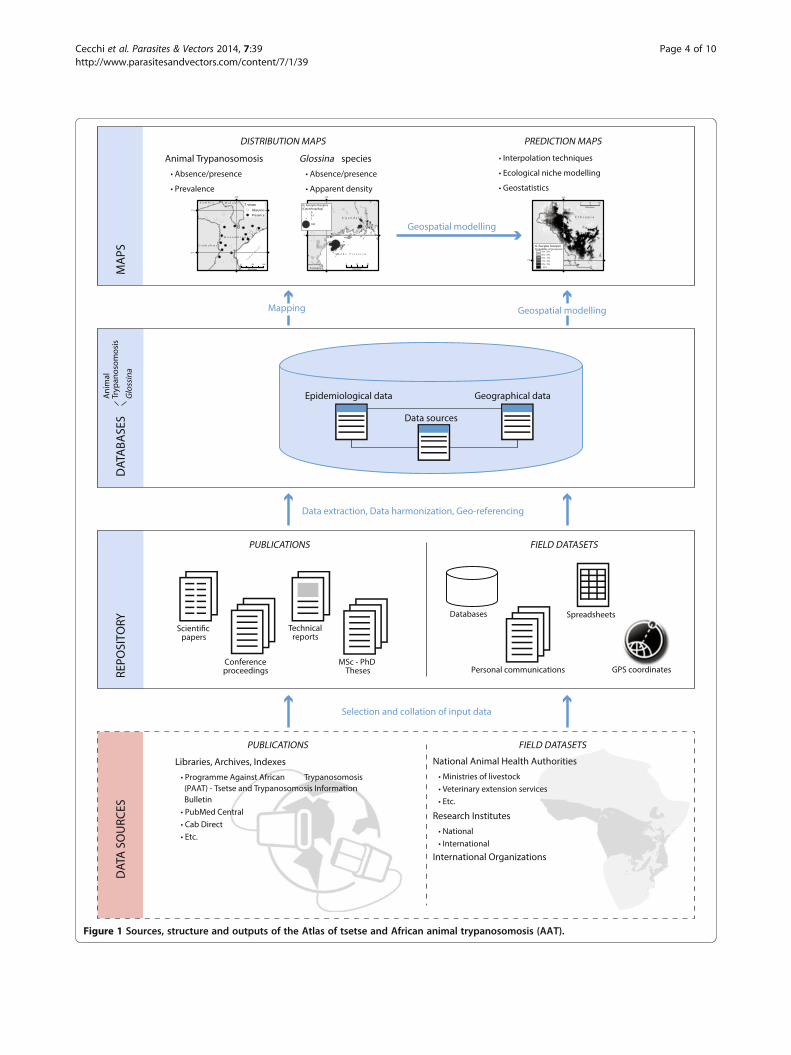
Figure 1 Sources, structure and outputs of the Atlas of tsetse and African animal trypanosomosis (AAT).
Cecchi et al. Parasites & Vectors 2014, 7:39 Page 4 of 10http://www.parasitesandvectors.com/content/7/1/39
available, the exact surface area of the survey is recordedin the database (in km2). However, in most cases the datasource (i.e. the paper) only enables the size of the study areato be estimated with a degree of approximation. Therefore,six broad categories were defined: ≤ 10 km2, > 10 and ≤25 km2, > 25 and ≤ 100 km2, > 100 and ≤ 500 km2, > 500and ≤ 1,000 km2, and > 1,000 and ≤ 10,000 km2. Lastly, ifthe geographic information included in the paper is sovague, or so widely spread, that it does not even fall in thelast category, the related epidemiological data are not con-sidered and are excluded from the Atlas.
Epidemiological dataThe table containing epidemiological data is the corner-stone of the AAT database. Each record is structured asfollows: a unique identifier of the survey, the surveyperiod, diagnostic method, sample size, animal species,animal breed, age range, sex and husbandry system.Note is taken on whether the sample can be consideredrandom, and therefore representative of the populationof the area as a whole. Also, information on recent orongoing interventions against tsetse and on the use oftrypanocidal drugs is recorded. In this context, recentinterventions are those implemented in the few yearspreceding the survey. Trypanosomal infections can becaptured in terms of presence/absence, estimated preva-lence and number of infected animals. Each record alsoincludes identifiers for the geographic location and forthe source, which enable the epidemiological records tobe linked to the complementary information in the ta-bles ‘Data Sources’ and ‘Geographical data’.More details are provided below on such relevant as-
pects as the species of hosts and parasites that are con-sidered in the Atlas, and on diagnostic methods.
Hosts and parasite speciesThe range of animal hosts selected for inclusion in theAtlas of AAT is wide, and comprises all domestic andwild vertebrates for which data can be identified. Thisincludes cattle, sheep, goats, pigs, horses, donkeys,mules, camels, dogs, as well as a number of wild animalsincluding reptiles. Vertebrate hosts for which trypanoso-mal infection may not have a direct economic impactwere included to gain insights into the epidemiologicalsignificance of the different reservoirs.Concerning the parasite species, the causative agents
of nagana include several species of tsetse-transmittedtrypanosomes. Four species of major veterinary import-ance are recognized, and they are therefore selected forinclusion in the Atlas of AAT: Trypanosoma vivax (sub-genus Duttonella), T. congolense and T. simiae (sub-genusNannomonas) and T. brucei (sub-genus Trypanozoon). Al-though rarely reported, T. suis (sub-genus Pycnomonas), aswine-specific trypanosome [1], is also included in the
database. Information on the occurrence of the differentsubgroups (or types) of T. congolense (namely savannah,forest/riverine and Kenya coast/kilifi) is also recorded whenbiochemical and molecular tools have enabled this level ofcharacterization (the three subgroups of T. congolense beingmorphologically indistinguishable). A similar approach isapplied to record the Tsavo strain of T. simiae [24,25], ini-tially classified as another type of T. congolense [26].Within T. brucei, three sub-species are recognized,among which T. b. brucei is the one with major veterinaryimportance. However, because of their epidemiologicalrelevance as causative agents of sleeping sickness, the twohuman-infective subspecies (i.e. T. b. gambiense and T. b.rhodesiense) are also included in the Atlas of AAT if re-ported from non-human vertebrate hosts.By contrast, T. godfreyi, which infects the same swine
hosts as T. simiae but is less pathogenic, is not includedin the database as it has only been isolated naturally fromtsetse [27,28]. Also, non-tsetse-transmitted trypanosomessuch as T. evansi (causing the wasting disease Surra) andT. equiperdum (responsible for dourine, a disease ofequines), which have a much broader geographic distribu-tion than AAT, are not included in the Atlas.As a rule, efforts are also made to record in the data-
base all types of mixed infections (i.e. animals found tobe infected with more than one species/sub-species/subgroup of trypanosomes). However, refinement of thiscomponent of the database might be needed because ofthe challenges posed by the very high number of possiblecombinations of mixed infections (especially when mo-lecular tools are used for diagnosis).
Diagnostic methodsA criterion of inclusiveness guided the choice of the diag-nostic methods. All methods that are capable of demon-strating past or present trypanosomal infections, eitherdirectly or indirectly, were considered. These compriseparasitological diagnostics, sub-inoculation methods, im-munological tests and molecular methods [29].Parasitological diagnosis is predicated on the direct
observation of trypanosomes in the body fluids of af-fected animals. In the field or in the laboratory, with theaid of a microscope, a drop of blood can be examinedfor the presence of trypanosomes in the wet blood filmtechnique. Fixed blood films can be examined (Giemsa-stained thick and thin smears), and concentration tech-niques can be applied to increase the sensitivity of thediagnosis — i.e. the haematocrit centrifugation tech-nique (HCT) [30], subsequently improved in the buffy-coat technique (BCT) [31]. Less utilized parasitologicaltechniques include the miniature anion-exchange col-umns (MAECT) [32].Sub-inoculation methods are based on the transfer of
infection from a suspected case to another susceptible
Cecchi et al. Parasites & Vectors 2014, 7:39 Page 5 of 10http://www.parasitesandvectors.com/content/7/1/39
vertebrate host (animal sub-inoculation), to an inverte-brate host (xenodiagnosis), or to an in vitro culture [29].The latter category includes the kit for in vitro isolationof trypanosomes (KIVI) [33], originally developed for theisolation of the human infective T. b. gambiense andlater applied also to AAT.In immunological diagnosis, the detection of anti-
bodies or antigens replaces the detection of parasitesthat characterizes parasitological methods. For the diag-nosis of AAT these methods include the rarely usedcomplement fixation test (CFT) [34], the indirect fluor-escent antibody test (IFAT) [35], and the card agglutin-ation trypanosomosis test (CATT) [36] – the latter beingwidely used for sleeping sickness. More widely used inthe veterinary field is the enzyme-linked immunosorbentassay (ELISA), in particular the indirect ELISA for anti-body detection (Ab-ELISA) [37]. In contrast, the antigen-detection ELISA (Ag-ELISA) [38,39] failed to live up to itsearly promises [29] and it is no longer utilized in the fieldof AAT diagnosis.Molecular tools, based on the detection of nucleic
acids (DNA and RNA), constitute the last category ofmethods for detecting livestock-infective trypanosomes.Characterized by a very high sensitivity, these tools in-clude the DNA hybridization and most notably the poly-merase chain reaction (PCR). Two groups of PCR can bedistinguished in AAT diagnosis: species-specific [40],and multiple-species [41], the main advantage of the lat-ter being a less costly and time-consuming application.Importantly, the identification of the serum resistance-associated (SRA) gene as a molecular marker of T. b.rhodesiense [42] enables detection of human-infectivetrypanosomes in non-human hosts [43,44].The lack of specificity in the clinical signs of AAT pre-
vents definite clinical diagnosis, which is therefore notconsidered in the Atlas. By contrast, the packed cell vol-ume (PCV) is often measured in AAT epidemiologicalstudies as a measure of anaemia, and therefore it is in-cluded in the database. If available from the data source,the average PCV is recorded for the herd as a whole, aswell as separately for the AAT-positive and AAT-negativeanimals.
Data processingIn the process of data extraction, each data source is an-alyzed independently by two persons. For a number ofinformation items, the text of the paper is reproducedverbatim in the database. This is the case, for example,for the description of the diagnostic method, the hus-bandry system and the presence of recent or ongoing in-terventions against tsetse and AAT in the study area.This literal recording enables the full wealth of informa-tion contained in the paper to be retained. Subsequently,harmonization enables the heterogeneous descriptive
information to be lumped into broad categories for eas-ier data extraction. For example, harmonization in thedescription of diagnostic methods enables diagnostic-specific data subsets to be easily generated for suchmethods as BCT, ELISA or PCR.Notes are taken throughout the database to capture
relevant nuances and, lastly, possible questions andrequests for clarifications to the authors of the papersare recorded, which have the potential to contributeto the future refinement and improvement of thedatabase.
ResultsAs we write, a total of 122 peer-reviewed publications havebeen identified, downloaded and processed, which containspatially-explicit data on AAT collected since January 1990in Ethiopia, Kenya and Uganda (49, 44, and 31 papersrespectively, the sum exceeding the total because a few pa-pers have a multinational scope). The complete list of pub-lications is provided in the Additional file 2.These 122 sources provided epidemiological information
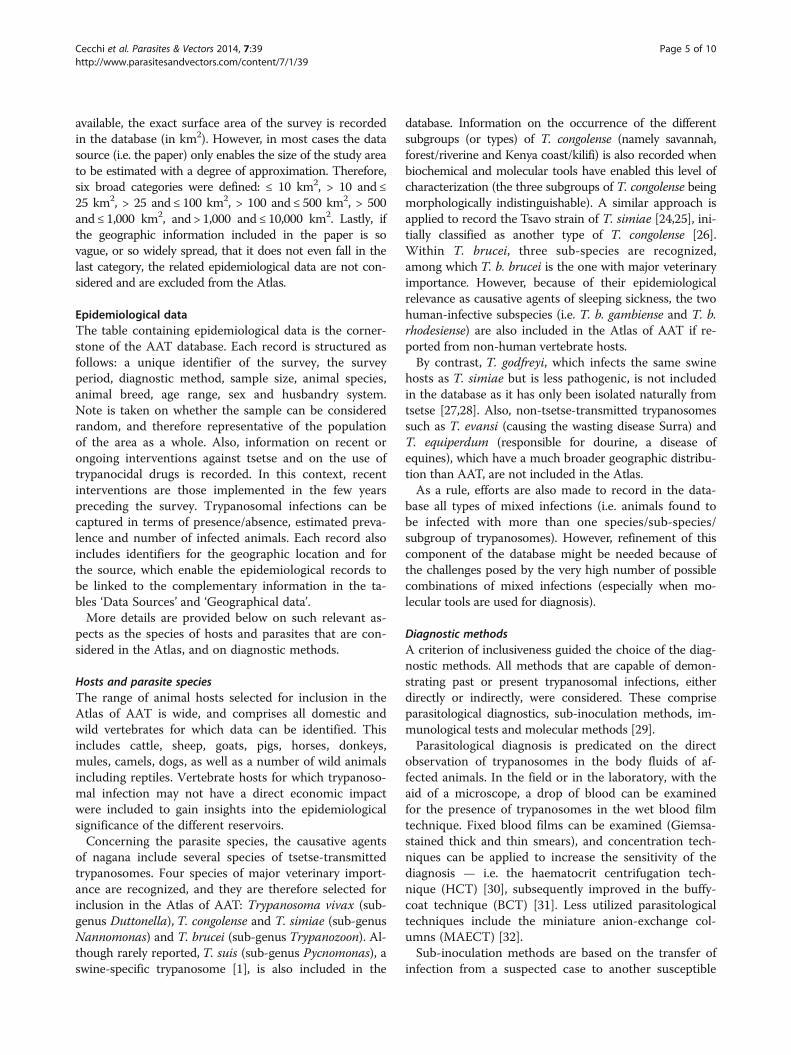
for 348 distinct geographic locations in Ethiopia (146),Kenya (103) and Uganda (99).Figure 2 shows the resulting map of AAT occurrence
in the three study countries. This is a comprehensivemap that includes all species of vertebrate hosts, alldiagnostic methods and all species of animal-infective,tsetse-transmitted trypanosomes (T. vivax, T. congolense,T. simiae, T. brucei and T. suis). Locations where AAT-causing trypanosomes were not detected are recorded inthe database, but they are not shown in Figure 2. This isbecause data on the absence of detection always needmore contextual information to be properly interpreted.In other words, geographic locations reporting absenceof detection of AAT may provide a misleading messageunless information is also provided on such relevant as-pects as the number and species of animals tested andthe diagnostic method used.Absence data can arguably be integrated in a more
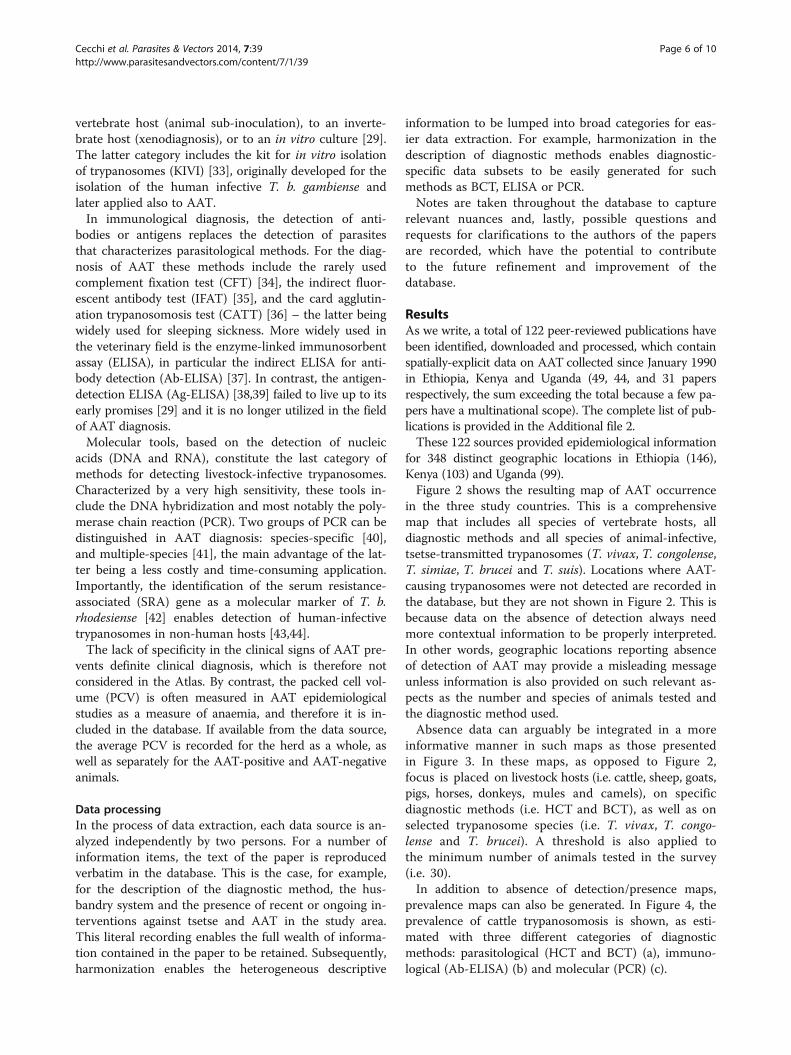
informative manner in such maps as those presentedin Figure 3. In these maps, as opposed to Figure 2,focus is placed on livestock hosts (i.e. cattle, sheep, goats,pigs, horses, donkeys, mules and camels), on specificdiagnostic methods (i.e. HCT and BCT), as well as onselected trypanosome species (i.e. T. vivax, T. congo-lense and T. brucei). A threshold is also applied tothe minimum number of animals tested in the survey(i.e. 30).In addition to absence of detection/presence maps,
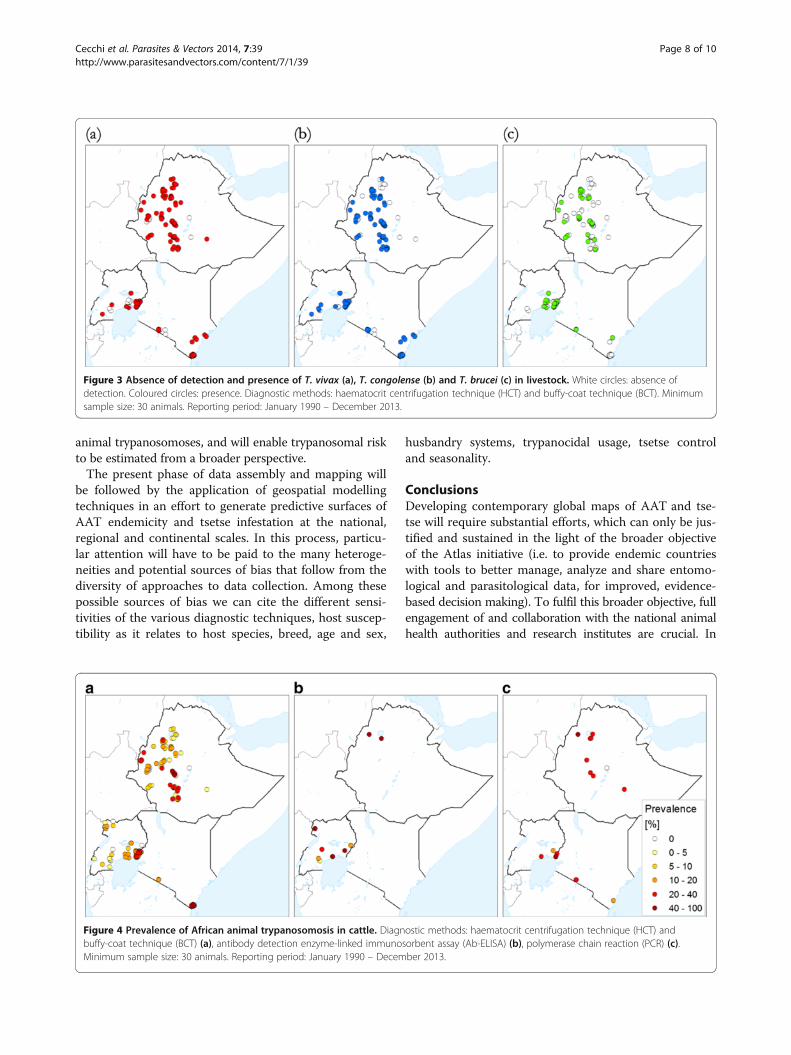
prevalence maps can also be generated. In Figure 4, theprevalence of cattle trypanosomosis is shown, as esti-mated with three different categories of diagnosticmethods: parasitological (HCT and BCT) (a), immuno-logical (Ab-ELISA) (b) and molecular (PCR) (c).
Cecchi et al. Parasites & Vectors 2014, 7:39 Page 6 of 10http://www.parasitesandvectors.com/content/7/1/39
DiscussionThe paper presents a methodology to assemble a contin-ental database of tsetse-transmitted animal trypanoso-mosis for Africa. The pilot activity in Ethiopia, Kenyaand Uganda is proof of concept that information is avail-able in the literature and that technical tools are maturefor continental maps of AAT to be generated and dis-seminated. Transparent communication of all the datasources used (Additional file 2) may enable scientists topoint out supplementary scientific papers for inclusion.However, it is apparent that information gaps in numer-ous geographical areas will require additional, unpub-lished data sources to be utilized if a complete picture isto be derived.Continued technical support by FAO and IAEA to
tsetse-affected countries facilitates access to this broaderbase of contemporary field data on AAT (e.g. [47,48]),and it also permits dissemination of the methodology at
the local level through a range of capacity developmentactivities. The potential exists for affected countries toadopt the presented methodology and build national At-lases of tsetse and AAT, and activities in this directionare ongoing in a number of countries [49]. Also, datasharing tools are available through the PAAT Informa-tion System (e.g. FAO Geonetwork), which can be usedto maximize dissemination of geospatial information onAAT [50].Activities are ongoing at FAO to apply the presented
methodology to all countries affected by nagana, and todevelop the tsetse component of the Atlas. In the processof assembling data on the distribution of Glossina species,attention is also being given to trypanosomal infection inthe tsetse vector, although these types of datasets arescant. Geo-referenced information on the occurrence ofanimal- and human-infective trypanosomes in tsetse flieswill complement data on the occurrence of human and
Figure 2 The occurrence of African animal trypanosomosis in Ethiopia, Kenya and Uganda. Reporting period: January 1990 – December2013. Data were extracted from peer-reviewed scientific papers. The inset shows the predicted distribution of tsetse flies [45,46].
Cecchi et al. Parasites & Vectors 2014, 7:39 Page 7 of 10http://www.parasitesandvectors.com/content/7/1/39
animal trypanosomoses, and will enable trypanosomal riskto be estimated from a broader perspective.The present phase of data assembly and mapping will
be followed by the application of geospatial modellingtechniques in an effort to generate predictive surfaces ofAAT endemicity and tsetse infestation at the national,regional and continental scales. In this process, particu-lar attention will have to be paid to the many heteroge-neities and potential sources of bias that follow from thediversity of approaches to data collection. Among thesepossible sources of bias we can cite the different sensi-tivities of the various diagnostic techniques, host suscep-tibility as it relates to host species, breed, age and sex,
husbandry systems, trypanocidal usage, tsetse controland seasonality.
ConclusionsDeveloping contemporary global maps of AAT and tse-tse will require substantial efforts, which can only be jus-tified and sustained in the light of the broader objectiveof the Atlas initiative (i.e. to provide endemic countrieswith tools to better manage, analyze and share entomo-logical and parasitological data, for improved, evidence-based decision making). To fulfil this broader objective, fullengagement of and collaboration with the national animalhealth authorities and research institutes are crucial. In
Figure 4 Prevalence of African animal trypanosomosis in cattle. Diagnostic methods: haematocrit centrifugation technique (HCT) andbuffy-coat technique (BCT) (a), antibody detection enzyme-linked immunosorbent assay (Ab-ELISA) (b), polymerase chain reaction (PCR) (c).Minimum sample size: 30 animals. Reporting period: January 1990 – December 2013.
Figure 3 Absence of detection and presence of T. vivax (a), T. congolense (b) and T. brucei (c) in livestock. White circles: absence ofdetection. Coloured circles: presence. Diagnostic methods: haematocrit centrifugation technique (HCT) and buffy-coat technique (BCT). Minimumsample size: 30 animals. Reporting period: January 1990 – December 2013.
Cecchi et al. Parasites & Vectors 2014, 7:39 Page 8 of 10http://www.parasitesandvectors.com/content/7/1/39
particular, the highest priority is presently being given tosupporting countries planning and implementing field in-terventions against trypanosomosis, with a focus on pro-jects conducted in the framework of PATTEC.
Additional files
Additional file 1: Protocol for the abstraction of African animaltrypanosomosis data. The protocol describes how data on theoccurrence and prevalence of African animal trypanosomiasis areassembled into a geospatial database within the framework of theinitiative “the Atlas of tsetse and African animal trypanosomiasis”.
Additional file 2: List of papers analyzed to generate maps ofAfrican animal trypanosomosis in Ethiopia, Kenya and Uganda.Reporting period: January 1990 – December 2013. The list contains the122 publications that have been identified as containing spatially-explicitdata on African animal trypanosomosis collected since January 1990 inEthiopia, Kenya and Uganda.
AbbreviationsAAT: African Animal Trypanosomosis; AU-IBAR: African Union InterafricanBureau for Animal Resources; Ab-ELISA: Antibody-detection ELISA;Ag-ELISA: Antigen-detection ELISA; CATT: Card Agglutination TrypanosomosisTest; CFT: Complement Fixation Test; ELISA: Enzyme-Linked ImmunosorbentAssay; FAO: Food and Agriculture Organization of the United Nations;GIS: Geographic Information Systems; HCT: Haematocrit CentrifugationTechnique; HAT: Human African Trypanosomosis; IFAT: Indirect FluorescentAntibody Test; IAEA: International Atomic Energy Agency; KIVI: Kit for In VitroIsolation of Trypanosomes; MAECT: Miniature Anion-Exchange Columns;PCV: Packed cell volume; PATTEC: Pan-African Tsetse and TrypanosomosisEradication Campaign; PCR: Polymerase Chain Reaction; PAAT: Programmeagainst African Trypanosomosis; BCT: Buffy-Coat technique; WHO: WorldHealth Organization.
Competing interestsThe authors declare that they have no competing interests.
Authors’ contributionsGC designed and coordinated the study, and drafted the manuscript. MP, GCand RCM selected the data. MP and GC processed the data. RCM, OD, UFand MJBV coordinated and supervised the collaboration between FAO andIAEA in the framework of PAAT. All authors have jointly conceptualized andcontributed to the manuscript, and read and approved the final version ofthe submitted manuscript.
AcknowledgmentsThe Atlas of tsetse and African animal trypanosomosis is an initiative of theFood and Agriculture Organization of the United Nations (FAO),implemented in collaboration with the International Atomic Energy Agency(IAEA) in the framework of the Programme against African Trypanosomosis(PAAT). The Atlas is supported by the Government of Italy through the FAOTrust Fund for Food Security and Food Safety (Project GTFS/RAF/474/ITA –‘Improving food security in sub-Saharan Africa by supporting the progressivereduction of tsetse-transmitted trypanosomosis in the framework of theNEPAD’).
DisclaimersThe boundaries and names shown and the designations used on the mapspresented in this paper do not imply the expression of any opinionwhatsoever on the part of FAO and IAEA concerning the legal status of anycountry, territory, city or area or of its authorities, or concerning thedelimitation of its frontiers or boundaries. Dotted lines on maps representapproximate border lines for which there may not yet be full agreement.The views expressed in this paper are those of the authors and do notnecessarily reflect the views or policies of FAO and IAEA.© Food and Agriculture Organization of the United Nations
Author details1Food and Agriculture Organization of the United Nations (FAO),Sub-regional Office for Eastern Africa, Addis Ababa, Ethiopia. 2Food andAgriculture Organization of the United Nations (FAO), Animal Production andHealth Division, Rome, Italy. 3Joint Food and Agriculture Organization/International Atomic Energy Agency Programme, Vienna, Austria.
Received: 21 December 2013 Accepted: 18 January 2014Published: 21 January 2014
References1. Taylor K, Authié EM-L: Pathogenesis of Animal Trypanosomiasis. In The
Trypanosomiases. Edited by Maudlin I, Holmes P, Miles M. Wallingford, UK:CABI Publishing; 2004:331–353.
2. Shaw A, Cecchi G, Wint GRW, Mattioli R, Robinson T: Mapping theeconomic benefits to livestock keepers of intervening against bovinetrypanosomosis in Eastern Africa. Prev Vet Med 2014, 113(2):197–210.
3. Cecchi G, Mattioli RC: Global geospatial datasets for Africantrypanosomiasis management: a review. In Geospatial datasets andanalyses for an environmental approach to African trypanosomiasis. Edited byCecchi G, Mattioli RC. Rome: Food and Agriculture Organization of theUnited Nations; 2009:1–39.
4. Simarro PP, Cecchi G, Paone M, Franco JR, Diarra A, Ruiz JA, Fèvre EM,Courtin F, Mattioli RC, Jannin JG: The Atlas of human Africantrypanosomiasis: a contribution to global mapping of neglected tropicaldiseases. Int J Health Geogr 2010, 9:57.
5. WHO: Control and surveillance of human African trypanosomiasis. InTechnical Report Series. Geneva: World Health Organization; 2013.
6. Simarro PP, Cecchi G, Franco JR, Paone M, Fèvre EM, Diarra A, Ruiz JA,Mattioli RC, Jannin JG: Estimating and mapping the population at risk ofsleeping sickness. PLoS Negl Trop Dis 2012, 6(10):e1859.
7. Hursey BS: The programme against African trypanosomiasis: aims,objectives and achievements. Trends Parasitol 2001, 17(1):2.
8. WHO: Resolution 50.36, 50th World Health Assembly. Geneva: World HealthOrganization; 1997.
9. WHO: Resolution 56.7, 56th World Health Assembly. Geneva: World HealthOrganization; 2003.
10. Kabayo JP: Aiming to eliminate tsetse from Africa. Trends Parasitol 2002,18(11):473–475.
11. Mattioli R, Feldmann U, Hendrickx G, Wint W, Jannin J, Slingenbergh J:Tsetse and trypanosomiasis intervention policies supporting sustainableanimal-agricultural development. J Food Agr Environ 2004, 2:310–314.
12. Van den Bossche P, Delespaux V: Options for the control of tsetse-transmitted livestock trypanosomosis. An epidemiological perspective.Vet Parasitol 2011, 181(1):37–42.
13. Shaw AP, Torr SJ, Waiswa C, Cecchi G, Wint GR, Mattioli RC, Robinson TP:Estimating the costs of tsetse control options: an example for Uganda.Prev Vet Med 2013, 110(3–4):290–303.
14. Vreysen M, Robinson A, Hendrichs J (Eds): Area-wide control of insect pests:from research to field implementation. Dordrecht, The Netherlands: Springer;2007.
15. Cecchi G, Paone M, Franco JR, Fèvre E, Diarra A, Ruiz J, Mattioli R, Simarro PP:Towards the Atlas of human African trypanosomiasis. Int J Health Geogr2009, 8:15.
16. Cecchi G, Courtin F, Paone M, Diarra A, Franco JR, Mattioli RC, Simarro PP:Mapping sleeping sickness in Western Africa in a context ofdemographic transition and climate change. Parasite 2009, 16(2):99–106.
17. Simarro PP, Cecchi G, Franco JR, Paone M, Fèvre EM, Diarra A, Ruiz JA,Mattioli RC, Jannin JG: Risk for human African trypanosomiasis, CentralAfrica, 2000-2009. Emerg Infect Dis 2011, 17(12):2322–2324.
18. Simarro PP, Franco JR, Cecchi G, Paone M, Diarra A, Ruiz JA, Jannin JG:Human African trypanosomiasis in non-endemic countries (2000-2010).J Travel Med 2012, 19(1):44–53.
19. Ford J, Katondo KM: Maps of tsetse flies (Glossina) distribution in Africa,1973 according to sub-generic groups on scale of 1:5 000 000. Bull AnimHealth Prod Afr 1977, 25:187–193.
20. Katondo K: Revision of second edition of tsetse distribution maps: an interimreport. Insect Sci Appl 1984, 5(5):381–388.
21. Cecchi G, Paone M, Feldmann U, Vreysen M, Mattioli R: Developingcontinental maps of African animal trypanosomosis. In 31st Meeting of theInternational Scientific Council for Trypanosomiasis Research and Control
Cecchi et al. Parasites & Vectors 2014, 7:39 Page 9 of 10http://www.parasitesandvectors.com/content/7/1/39
(ISCTRC)12-16 October 2011. Bamako, Mali: African Union - InterafricanBureau for Animal Resources (AU-IBAR); 2013.
22. Cecchi G, Paone M, Feldmann U, Vreysen M, Mattioli R: Developingcontinental maps of Glossina species. In 31st Meeting of the InternationalScientific Council for Trypanosomiasis Research and Control (ISCTRC)12-16October 2011. Bamako, Mali: African Union - Interafrican Bureau for AnimalResources (AU-IBAR); 2013.
23. Guerra C, Hay S, Lucioparedes L, Gikandi P, Tatem A, Noor A, Snow R:Assembling a global database of malaria parasite prevalence for theMalaria Atlas Project. Malar J 2007, 6(1):17.
24. Stevens JR, Noyes HA, Dover GA, Gibson WC: The ancient and divergentorigins of the human pathogenic trypanosomes, Trypanosoma bruceiand T. cruzi. Parasitology 1999, 118(1):107–116.
25. Gibson WC, Stevens JR, Mwendia CM, Ngotho JN, Ndung’u JM: Unravellingthe phylogenetic relationships of African trypanosomes of suids.Parasitology 2001, 122(6):625–631.
26. Majiwa PA, Maina M, Waitumbi JN, Mihok S, Zweygarth E: Trypanosoma(Nannomonas) congolense: molecular characterization of a new genotypefrom Tsavo, Kenya. Parasitology 1993, 106(2):151–162.
27. McNamara J, Mohammed G, Gibson W: Trypanosoma (Nannomonas)godfreyi sp. nov. from tsetse flies in The Gambia: biological andbiochemical characterization. Parasitology 1994, 109(04):497–509.
28. Stevens J, Brisse S: Systematics of Trypanosomes of Medical andVeterinary Importance. In The Trypanosomiases. Edited by Maudlin I,Holmes P, Miles M. Wallingford, UK: Cabi Publishing; 2004:1–23.
29. Eisler M, Dwinger R, Majiwa P, Picozzi K, Maudlin I, Holmes P, Miles M:Diagnosis and epidemiology of African animal trypanosomiasis. In TheTrypanosomiases. Edited by Maudlin I, Holmes P, Miles M. Wallingford, UK:CABI Publishing; 2004:253–267.
30. Woo P: The haematocrit centrifuge technique for the diagnosis ofAfrican trypanosomiasis. Acta Trop 1970, 27(4):384–386.
31. Murray M, Murray P, McIntyre W: An improved parasitological techniquefor the diagnosis of African trypanosomiasis. Trans R Soc Trop Med Hyg1977, 71(4):325–326.
32. Lumsden W, Kimber C, Evans D, Doig S: Trypanosoma brucei: miniatureanion-exchange centrifugation technique for detection of lowparasitaemias: adaptation for field use. Trans R Soc Trop Med Hyg 1979,73(3):312–317.
33. Aerts D, Truc P, Penchenier L, Claes Y, Le Ray D: A kit for in vitro isolationof trypanosomes in the field: first trial with sleeping sickness patients inthe Congo Republic. Trans R Soc Trop Med Hyg 1992, 86(4):394–395.
34. Lötzsch R, Deindl G: Trypanosoma congolense: III. Serological responses ofexperimentally infected cattle. Exp Parasitol 1974, 36(1):27–33.
35. Luckins A, Mehlitz D: Evaluation of an indirect fluorescent antibody test,enzyme-linked immunosorbent assay and quantification ofimmunoglobulins in the diagnosis of bovine trypanosomiasis.Trop Anim Health Pro 1978, 10(1):149–159.
36. Magnus E, Vervoort T, Van Meirvenne N: A card-agglutination test withstained trypanosomes (CATT) for the serological diagnosis of TBgambiense trypanosomiasis. Ann Soc Belg Med Trop 1977, 58(3):169–176.
37. Voller A, Bidwell D, Bartlett A: Enzyme immunoassays in diagnosticmedicine: Theory and practice. Bull World Health Organ 1976, 53(1):55.
38. Rae P, Luckins A: Detection of circulating trypanosomal antigens byenzyme immunoassay. Ann Trop Med Parasitol 1984, 78(6):587–596.
39. Nantulya V, Musoke A, Rurangirwa F, Saigar N, Minja S: Monoclonalantibodies that distinguish Trypanosoma congolense, T. vivax andT. brucei. Parasite Immunol 1987, 9(4):421–431.
40. Moser DR, Cook GA, Ochs DE, Bailey CP, McKane MR, Donelson JE:Detection of Trypanosoma congolense and Trypanosoma bruceisubspecies by DNA amplification using the polymerase chain reaction.Parasitology 1989, 99(Pt 1):57–66.
41. Desquesnes M, McLaughlin G, Zoungrana A, Davila AM: Detection andidentification of Trypanosoma of African livestock through a singlePCR based on internal transcribed spacer 1 of rDNA. Int J Parasitol 2001,31(5–6):610–614.
42. De Greef C, Chimfwembe E, Kihang’a Wabacha J, Bajyana Songa E, Hamers R:Only the serum-resistant bloodstream forms of Trypanosoma bruceirhodesiense express the serum resistance associated (SRA) protein. Ann SocBelg Med Trop 1992, 72(Suppl 1):13–21.
43. Welburn SC, Picozzi K, Fevre EM, Coleman PG, Odiit M, Carrington M,Maudlin I: Identification of human-infective trypanosomes in animal
reservoir of sleeping sickness in Uganda by means of serum-resistance-associated (SRA) gene. Lancet 2001, 358(9298):2017–2019.
44. Gibson W, Backhouse T, Griffiths A: The human serum resistanceassociated gene is ubiquitous and conserved in Trypanosoma bruceirhodesiense throughout East Africa. Infect Genet Evol 2002, 1(3):207–214.
45. Wint W, Rogers D: Predicted distributions of tsetse in Africa. Rome: Report ofthe Environmental Research Group Oxford Ltd and TALA Research Group.Department of Zoology, University of Oxford, for the Animal Health Serviceof the Animal Production and Health Division of the Food and AgricultureOrganisation of the United Nations; 2000.
46. Wint GRW: Kilometre resolution Tsetse Fly distribution maps for the LakeVictoria Basin and West Africa: Report to the Joint Food and AgricultureOrganization of the United Nations/International Atomic Energy AgencyProgramme. Rome: Food and Agriculture Organisation of the UnitedNations; 2001.
47. Adam Y, Marcotty T, Cecchi G, Mahama C, Solano P, Bengaly Z, Van denBossche P: Bovine trypanosomosis in the Upper West Region of Ghana:entomological, parasitological, and serological cross-sectional surveys.Res Vet Sci 2012, 92:462–468.
48. Seck M, Bouyer J, Sall B, Bengaly Z, Vreysen M: The prevalence of Africananimal trypanosomoses and tsetse presence in Western Senegal.Parasite 2010, 17(3):257–265.
49. Ahmed SK, Rahman HMA, Cecchi G: The spatial distribution of bovinetrypanosomosis in tsetse-infested areas of Sudan: past & present. In 32nd
Meeting of the International Scientific Council for Trypanosomiasis Researchand Control (ISCTRC)8-12 September 2013. Khartoum, Sudan: African Union -Interafrican Bureau for Animal Resources (AU-IBAR). in press.
50. Cecchi G, Mattioli R: FAO GeoNetwork in a Multinational DevelopmentProgramme - the case of the Programme Against African Trypanosomiasis.OSGeo J 2007, 2:20–23.
doi:10.1186/1756-3305-7-39Cite this article as: Cecchi et al.: Assembling a geospatial database oftsetse-transmitted animal trypanosomosis for Africa. Parasites & Vectors2014 7:39.
Submit your next manuscript to BioMed Centraland take full advantage of:
• Convenient online submission
• Thorough peer review
• No space constraints or color figure charges
• Immediate publication on acceptance
• Inclusion in PubMed, CAS, Scopus and Google Scholar
• Research which is freely available for redistribution
Submit your manuscript at www.biomedcentral.com/submit
Cecchi et al. Parasites & Vectors 2014, 7:39 Page 10 of 10http://www.parasitesandvectors.com/content/7/1/39
Recommended