Initiating Coverage
FC Research Analyst: Michelle Weerasinghe
SRI LANKA
CEYLON TOBACCO COMPANY PLC BUY
CTC.N0000 JULY 2015
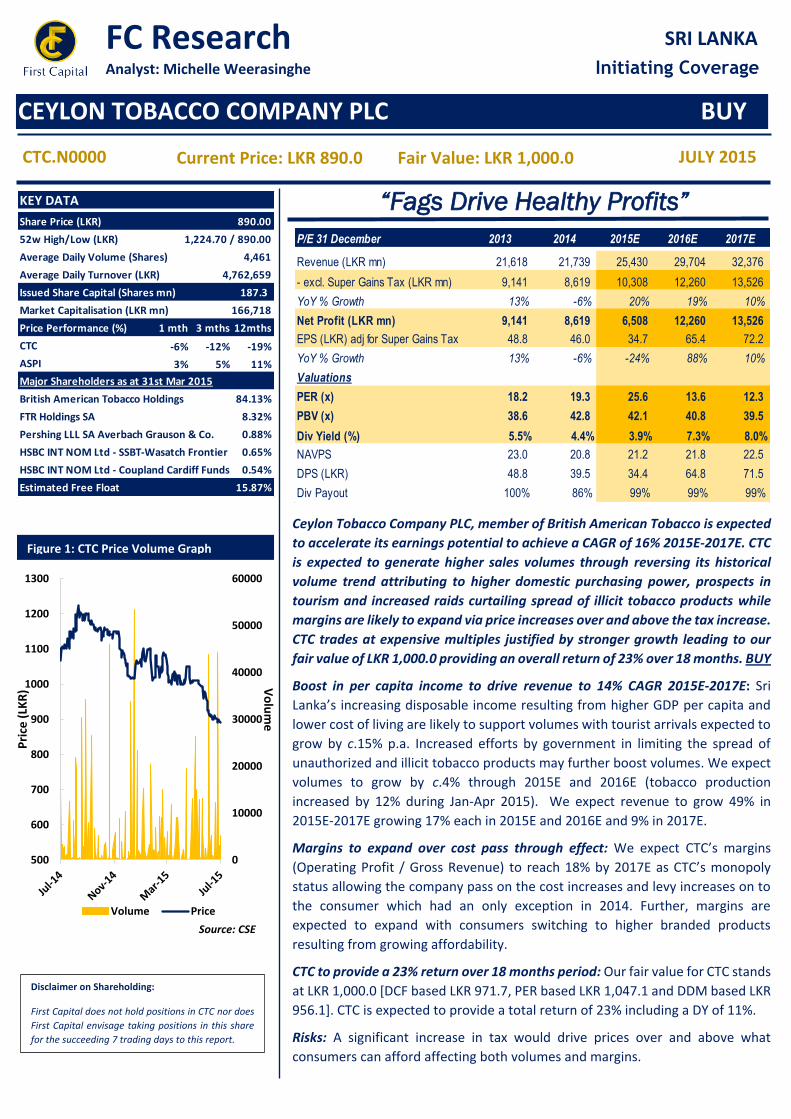
“Fags Drive Healthy Profits”
Current Price: LKR 890.0 Fair Value: LKR 1,000.0
Ceylon Tobacco Company PLC, member of British American Tobacco is expected
to accelerate its earnings potential to achieve a CAGR of 16% 2015E-2017E. CTC
is expected to generate higher sales volumes through reversing its historical
volume trend attributing to higher domestic purchasing power, prospects in
tourism and increased raids curtailing spread of illicit tobacco products while
margins are likely to expand via price increases over and above the tax increase.
CTC trades at expensive multiples justified by stronger growth leading to our
fair value of LKR 1,000.0 providing an overall return of 23% over 18 months. BUY
Boost in per capita income to drive revenue to 14% CAGR 2015E-2017E: Sri
Lanka’s increasing disposable income resulting from higher GDP per capita and
lower cost of living are likely to support volumes with tourist arrivals expected to
grow by c.15% p.a. Increased efforts by government in limiting the spread of
unauthorized and illicit tobacco products may further boost volumes. We expect
volumes to grow by c.4% through 2015E and 2016E (tobacco production
increased by 12% during Jan-Apr 2015). We expect revenue to grow 49% in
2015E-2017E growing 17% each in 2015E and 2016E and 9% in 2017E.
Margins to expand over cost pass through effect: We expect CTC’s margins
(Operating Profit / Gross Revenue) to reach 18% by 2017E as CTC’s monopoly
status allowing the company pass on the cost increases and levy increases on to
the consumer which had an only exception in 2014. Further, margins are
expected to expand with consumers switching to higher branded products
resulting from growing affordability.
CTC to provide a 23% return over 18 months period: Our fair value for CTC stands
at LKR 1,000.0 [DCF based LKR 971.7, PER based LKR 1,047.1 and DDM based LKR
956.1]. CTC is expected to provide a total return of 23% including a DY of 11%.
Risks: A significant increase in tax would drive prices over and above what
consumers can afford affecting both volumes and margins.
Figure 1: CTC Price Volume Graph
Disclaimer on Shareholding:
First Capital does not hold positions in CTC nor does
First Capital envisage taking positions in this share
for the succeeding 7 trading days to this report.
Source: CSE
0
10000
20000
30000
40000
50000
60000
500
600
700
800
900
1000
1100
1200
1300
Vo
lum
e
Pri
ce (
LKR
)
Volume Price
KEY DATA
Share Price (LKR)
52w High/Low (LKR)
Average Daily Volume (Shares)
Average Daily Turnover (LKR)
187.3
Price Performance (%) 1 mth 3 mths 12mths
CTC -6% -12% -19%
ASPI 3% 5% 11%
84.13%
8.32%
0.88%
0.65%
0.54%
4,762,659
890.00
4,461
1,224.70 / 890.00
HSBC INT NOM Ltd - Coupland Cardiff Funds PLC
Issued Share Capital (Shares mn)
Market Capitalisation (LKR mn) 166,718
Major Shareholders as at 31st Mar 2015
British American Tobacco Holdings
FTR Holdings SA
Pershing LLL SA Averbach Grauson & Co.
HSBC INT NOM Ltd - SSBT-Wasatch Frontier
Estimated Free Float 15.87%
P/E 31 December 2013 2014 2015E 2016E 2017E
Revenue (LKR mn) 21,618 21,739 25,430 29,704 32,376
- excl. Super Gains Tax (LKR mn) 9,141 8,619 10,308 12,260 13,526
YoY % Growth 13% -6% 20% 19% 10%
Net Profit (LKR mn) 9,141 8,619 6,508 12,260 13,526
EPS (LKR) adj for Super Gains Tax 48.8 46.0 34.7 65.4 72.2
YoY % Growth 13% -6% -24% 88% 10%
Valuations
PER (x) 18.2 19.3 25.6 13.6 12.3
PBV (x) 38.6 42.8 42.1 40.8 39.5
Div Yield (%) 5.5% 4.4% 3.9% 7.3% 8.0%
NAVPS 23.0 20.8 21.2 21.8 22.5
DPS (LKR) 48.8 39.5 34.4 64.8 71.5
Div Payout 100% 86% 99% 99% 99%

FC Research
2
“Fags Driving Healthy Profits”
1.0 Introduction
“Cigarette Monopolist”: Ceylon Tobacco Company PLC, a member of the
British American Tobacco is the only legal cigarette manufacturer in Sri Lanka
with its presence in the country for over 100 years. CTC’s local portfolio of
products carry some of the renowned brands including Dunhill and Benson &
Hedges.
Share Price Performance: Following the steep rise in prices during 2012 and
2013 period CTC price has been stagnating around LKR 1,000-1,200 mark
during 2014. With 2014 profitability declining CTC has fallen by 16% to LKR
890.0 during the year. With an estimated free float of 15.87% CTC has been
recognized as an illiquid counter holding c.6% of the total market
capitalization.
Figure 3: ASPI vs CTC
Figure 2: CTC Market Share
58%
42%
CTC Beedi and others
Source: FC Research Mystery Shopping Survey
Source: Annual Report
-
500
1,000
1,500
2,000
Index
CTC ASPI
Brand Price (LKR)
Dunhill Switch 35.0
Dunhill 33.0
Benson & Hedges 33.0
John Player Gold Leaf 30.0
John Player Gold Leaf Click 32.0
Bristol 22.0
Four Aces 20.0
Three Roses 14.0
Capstan 10.0
Source: FC Research
FC Research
3
“Fags Driving Healthy Profits”
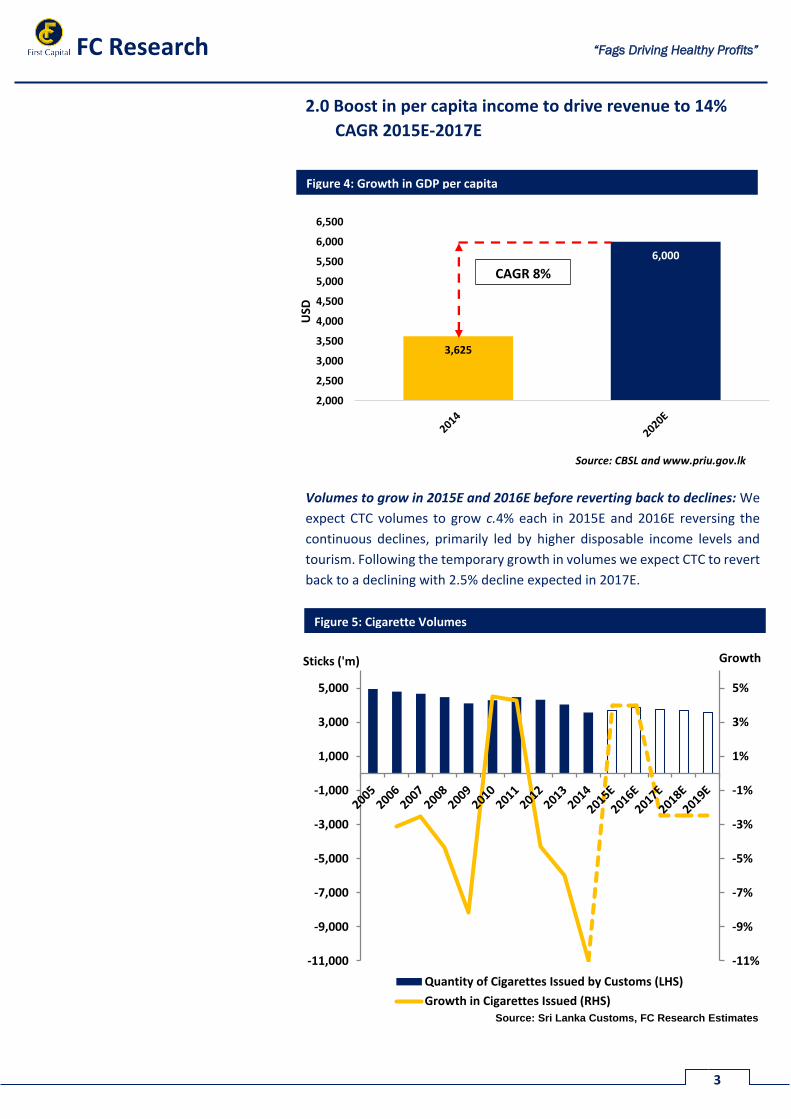
2.0 Boost in per capita income to drive revenue to 14%
CAGR 2015E-2017E
Volumes to grow in 2015E and 2016E before reverting back to declines: We
expect CTC volumes to grow c.4% each in 2015E and 2016E reversing the
continuous declines, primarily led by higher disposable income levels and
tourism. Following the temporary growth in volumes we expect CTC to revert
back to a declining with 2.5% decline expected in 2017E.
Source: CBSL and www.priu.gov.lk
Figure 4: Growth in GDP per capita
3,625
6,000
2,000
2,500
3,000
3,500
4,000
4,500
5,000
5,500
6,000
6,500
USD
CAGR 8%
Figure 5: Cigarette Volumes
-11%
-9%
-7%
-5%
-3%
-1%
1%
3%
5%
-11,000
-9,000
-7,000
-5,000
-3,000
-1,000
1,000
3,000
5,000
GrowthSticks ('m)
Quantity of Cigarettes Issued by Customs (LHS)
Growth in Cigarettes Issued (RHS)Source: Sri Lanka Customs, FC Research Estimates

FC Research
4
“Fags Driving Healthy Profits”
GDP per capita to grow at 8%: We expect Sri Lanka’s per capita GDP to grow
at an annual average of 8% during 2014-2020E. Mean household income has
increased at a 12% CAGR 2007-10 and 8% CAGR 2010-13. We expect the
household income to grow at 8% level, which in turn would enable more
consumer affordability of purchasing CTC brands.
Higher income level may lead to substitute from Beedi to Cigarettes:
Currently market share of Beedi, the inexpensive substitute for cigarettes
accounts for nearly 42% as CTC experienced a decline in volumes primarily in
rural markets (domestic cigarette volumes declined by 11% in 2014 YoY).
However with the increase in household purchasing power we expect an
increase in cigarette market share.
Tourist Arrivals to increase by c.17% CAGR: Being bullish on tourism, FC
Research expect Sri Lanka to hit 2.5mn target of tourist arrivals in 2017E.
Tourist arrivals in Sri Lanka increased 14% to 830,051 from Jan-May 2015 with
growth seen in the Chinese and Indian arrivals. It is expected that increase in
tourist arrivals would contribute positively on CTC’s revenue attributing to
growth in sales volumes.
Increased raids to curtail spread of illegal tobacco products: Government
efforts which continue to restrict the spread of illegal tobacco products have
influenced positively on CTC’s revenue resulting in improved earnings
(1Q2015 profits up by 25% QoQ to LKR 4.3mn). During 1Q2015, a total of 249
raids have yielded 6mn illegal cigarettes at a market value of LKR 180mn.
Figure 6: Mean Household Income after expenditure for food and drink and
personal care and health – Sri Lanka
15
17
19
21
23
25
27
29
31
33
LKR
(Th
ou
san
ds)
2007 2010 2013 2016E
Figure 7: Tourism targets 2.5mn tourist arrivals
in 2017E
494438448
654
8561,006
1,275
1,527
1,800
2,116
2,487
0
500
1,000
1,500
2,000
2,500
3,000
Tou
rist
Arr
ival
s ('
00
0)
Source: www.statistics.gov.lk and FC Research Estimates
Source: SLTDA and FC Research Estimates

FC Research
5
“Fags Driving Healthy Profits”
3.0 Margins to expand over cost pass through effect
3.1 CTC’s monopoly status provides opportunity to grow margins
despite cost and levy increase
Margin to reach 18%: We expect CTC’s operating profit margins (Operating
Profit / Gross Revenue) to reach 18% by 2017E heavily supported by the
ability of CTC to pass on cost and levy increases via price increases to
consumers.
Revenue growth rate over and above tax growth rate: CTC maintained its
margins by keeping up its revenue growth rate above its tax growth rate
continuously during its history. It is expected that the historical trend is likely
Figure 8: Net Profit margins
Source: Annual Report FC Research Estimates
Source: Annual Reports and FC Research Estimates
Figure 9: Higher revenue growth rate than Tax growth rate
16%
18%Price Growth expands net
operating margins

FC Research
6
“Fags Driving Healthy Profits”
to be repeated (2016E revenue growth rate 15.4% and tax growth rate
15.0%), consequently driving revenues above its tax growth.
Annual price increases: CTC generally re-prices its products twice annually.
The price increases are expected to increase revenue per share thus
contributing to the growth in earnings.
3.2 Investment into brands & new products
CTC has been constantly investing in their products adding value to its local
consumers. CTC had undertaken a pack modernization initiative on its JPGL
brand while the company introduced two premium priced variants to further
strengthen the image of the brand, which included the introduction of
capsule technology - JPGL Click offering the “SWITCH” technology.
3.3 Government regulations influence margins but unlikely to
squeeze CTC
A key source of national revenue: CTC contributed LKR 73.6bn as excise, tax
and levies which accounts to nearly 7% of government’s total tax revenue in
2014. Due to the inherent negative health aspect related to tobacco industry
CTC is exposed to inevitably rigorous regulatory environment. Later in 2014
Government raised excise on cigarettes withdrawing VAT and NBT.
Additional recurring costs condense margins: Regulation on Pictorial Health
Warnings (PHW) covering 60% of the front and back pack faces which came
into effect from 1 January 2015 brought additional expenses to CTC. This
recurring expense contributed in condensing profits by LKR 60mn in 2014 and
is expected to continue to affect future profits.
Other tax revenue, 93%
Excise duty and other taxes by CTC,
7%
Figure 10: CTC’s contribution to Government Tax revenue (2014)
Source: Annual Reports of CTC and Ministry of Finance

FC Research
7
“Fags Driving Healthy Profits”
4.0 CTC to provide a 23% return
CTC Earnings CAGR of 16% 2015E-17E: We expect CTC’s earnings to reach
LKR 13.5bn in 2017E (16% CAGR). CTC earnings are likely to reach LKR 10.3 bn
(up 20% before Super Gains Tax) and LKR 12.3bn (up 19%). FC Research has
written off the super gains tax against the 2015E resulting in a net profit of
LKR 6.5 bn.
Super Gains Tax assumptions: We have assumed that the super gains tax
which is a one off tax, has been charged by the Government on the taxable
profit for 2013 in 2015E.
4.1 CTC Total Return of 23% over 18 months period
Fair Value of LKR 1,000.0 over 18 months period: FC Research target price
for CTC stands at LKR 1,000.0 providing a capital gain of 12% based on the
company’s value as at Dec 2016. The target price of LKR 1,000.0 is based on
Figure 11: Earnings to grow at 16% CAGR 2015E-2017E
4,000
6,000
8,000
10,000
12,000
14,000
16,000
LKR
(M
n)
CAGR 16%
Source: Annual Reports and FC Research Estimates
P/E 31 December 2013 2014 2015E 2016E 2017E
Revenue (LKR mn) 21,618 21,739 25,430 29,704 32,376
- excl. Super Gains Tax (LKR mn) 9,141 8,619 10,308 12,260 13,526
YoY % Growth 13% -6% 20% 19% 10%
Net Profit (LKR mn) 9,141 8,619 6,508 12,260 13,526
EPS (LKR) adj for Super Gains Tax 48.8 46.0 34.7 65.4 72.2
YoY % Growth 13% -6% -24% 88% 10%
Valuations
PER (x) 18.2 19.3 25.6 13.6 12.3
PBV (x) 38.6 42.8 42.1 40.8 39.5
Div Yield (%) 5.5% 4.4% 3.9% 7.3% 8.0%
NAVPS 23.0 20.8 21.2 21.8 22.5
DPS (LKR) 48.8 39.5 34.4 64.8 71.5
Div Payout 100% 86% 99% 99% 99%

FC Research
8
“Fags Driving Healthy Profits”
the average price of LKR 971.7 via DCF valuations, LKR 1,047.10 via PER based
valuations and LKR 956.10 via DDM based valuations.
Dividend Yield of 11%: FC Research expects a DPS of LKR 34.4 for 2015E out
of which LKR 3.45 DPS has already been paid. A balance dividend of LKR 30.95
is expected to be paid for 2015 (provided company pays Super Gains Tax
during the year). We expect the company to a further LKR 64.79 DPS on 2016E
earnings. Thereby we expect overall dividend of LKR 95.74 over the next 18
months resulting in a dividend yield of 11%.
4.2 Discounted Cash flow Valuation
Return
Target Price 1,000.0
Current Price 890.0
Capital Gain (LKR) 110.0
Dividend FY16E (LKR) 95.7
Capital Gain % 12%
Dividend Yield % 11%
Total Return % 23%
Valuations 2016E
NPV 172,679
(+) Cash 9,338
(-) Debt -
Total Value of Equity 182,017
No. of shares 187
Value of Equity per share 972
COE (K e )
Rf 11%
Rm 18%
1.0
Ke=Rf+ (Rm-Rf) 18%
Ke 18%
Kd 6%
D/E Assumption 40 / 60
Terminal Growth (%) 3%
WACC 13%
WACC
972 11% 12% 13% 14% 15%
1% 1001 920 852 794 745
2% 1084 986 906 839 783
3% 1188 1068 972 893 827
4% 1322 1170 1052 957 880
5% 1499 1301 1152 1036 943
WACC
Terminal
Growth (%)
Expected CTC price for 2016E
DCF Valuation based target price 971.7
PER based target price 1,047.1
DDM based target price 956.1
Average Target Price 991.6
Target price (Rounded up) 1,000.0

FC Research
9
“Fags Driving Healthy Profits”
4.3 Average PER of 16.0 times
CTC price has been trading between 18.0x – 22.0x bands during the last 3
years. On a conservative note, we expect CTC to trade at a PER of 16.0x on
2016E earnings by end of 2016E. CTC’s 2016E EPS is expected to reach LKR
65.45. At 16.0x earnings, the price for CTC stands at LKR 1,047.10.
4.4 Dividend Discount Model Valuation
Valuations 2016E
NPV - Dividends 179,098
No. of shares 187
Value of Equity per share 956.1
Figure 12: PE Band Graph
Source: CSE and FC Research Estimates
PER based Valuation
FY16E Earnings (LKR 'Mn) 12,260
No. of Shares ('Mn) 187
FY16E EPS 65.45
Expected Average PER 16.0x
Price at 16.0x FY16E Earnings 1,047.1
956 10% 11% 12% 13% 14%
1% 988 894 817 753 699
2% 1087 972 880 804 742
3% 1214 1069 956 866 792
4% 1384 1194 1052 941 852
5% 1622 1361 1175 1035 926
Terminal
Growth
(%)
WACC
FC Research
10
“Fags Driving Healthy Profits”
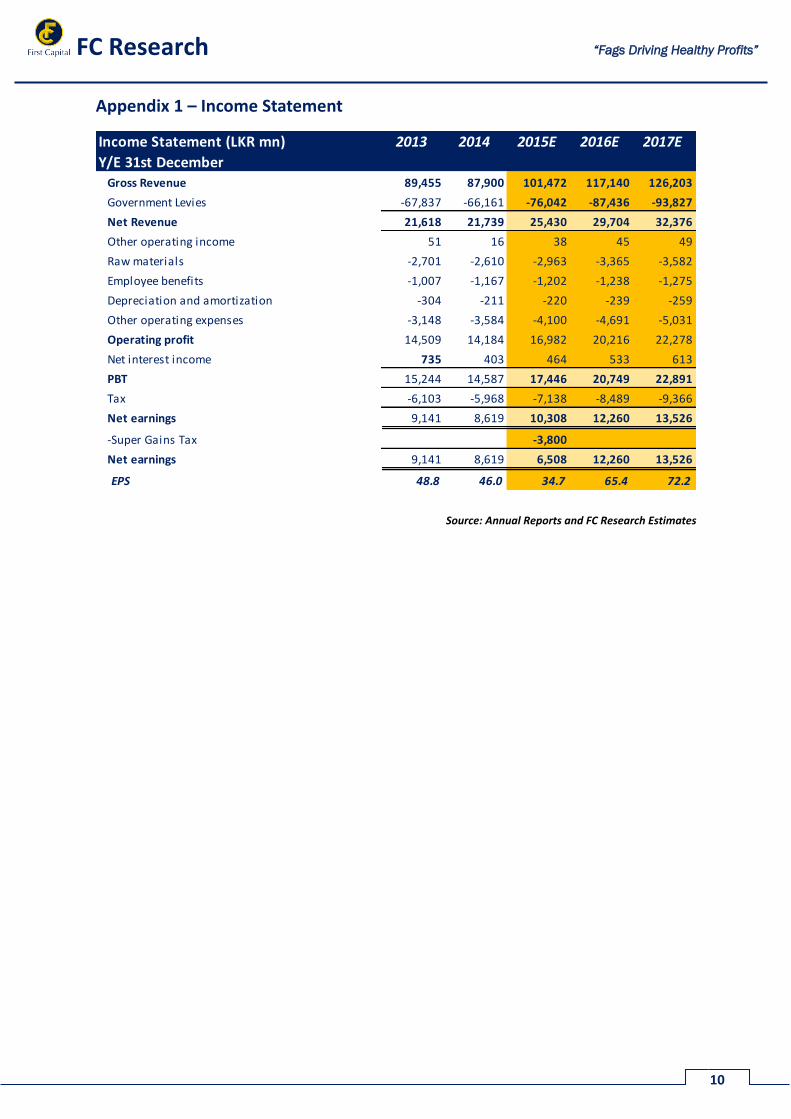
Appendix 1 – Income Statement
Source: Annual Reports and FC Research Estimates
Income Statement (LKR mn) 2013 2014 2015E 2016E 2017E
Y/E 31st December
Gross Revenue 89,455 87,900 101,472 117,140 126,203
Government Levies -67,837 -66,161 -76,042 -87,436 -93,827
Net Revenue 21,618 21,739 25,430 29,704 32,376
Other operating income 51 16 38 45 49
Raw materials -2,701 -2,610 -2,963 -3,365 -3,582
Employee benefits -1,007 -1,167 -1,202 -1,238 -1,275
Depreciation and amortization -304 -211 -220 -239 -259
Other operating expenses -3,148 -3,584 -4,100 -4,691 -5,031
Operating profit 14,509 14,184 16,982 20,216 22,278
Net interest income 735 403 464 533 613
PBT 15,244 14,587 17,446 20,749 22,891
Tax -6,103 -5,968 -7,138 -8,489 -9,366
Net earnings 9,141 8,619 10,308 12,260 13,526
-Super Gains Tax -3,800
Net earnings 9,141 8,619 6,508 12,260 13,526
EPS 48.8 46.0 34.7 65.4 72.2

FC Research
11
“Fags Driving Healthy Profits”
Appendix 2 – Balance Sheet
Source: Annual Reports and FC Research Estimates
Balance Sheet (LKR mn) 2013 2014 2015E 2016E 2017E
As at 31st DecemberAssets
Non Current Assets
Property plant and equipment 1,599 1,708 1,875 2,061 2,218
Intangible assets 28 18 14 10 6
Investments in subsidiaries 0 0 0 0 0
Net surplus assets on retirement benefit plan 594 588 588 588 588
Receivables 97 134 134 134 134
Total Non Current Assets 2,318 2,447 2,610 2,792 2,945
Current Assets
Inventories 2,962 3,065 3,538 4,084 4,400
Trade & other receivables 1,636 956 1,103 1,274 1,372
Cash & cash equivalents 8,251 9,010 9,133 9,338 9,480
Total Current Assets 12,849 13,030 13,774 14,696 15,253
Total Assets 15,167 15,478 16,384 17,488 18,198
Equity and Liabilities
Equity
Stated capital 1,873 1,873 1,873 1,873 1,873
Retained earnings 2,443 2,025 2,090 2,213 2,348
Total equity 4,316 3,898 3,964 4,086 4,221
Non - Current Liabilities
Deferred tax 295 348 348 348 348
Total Non - Current Liabilties 295 348 348 348 348
Current Liabilities
Trade & other payables 6,224 7,124 7,965 8,946 9,521
Current tax Liabilities 3,254 3,126 3,126 3,126 3,126
Dividends payable 955 824 824 824 824
Unclaimed dividends 123 157 157 157 157
Total Current Liabilities 10,556 11,231 12,072 13,053 13,629
Total Liabilities 10851 11,579 12,420 13,402 13,977
Total Equity & Liabilities 15,167 15,478 16,384 17,488 18,198

FC Research
12
“Fags Driving Healthy Profits”
Appendix 3 – Cash flow Statement
Source: Annual Reports and FC Research Estimates
Cashflow Statement (LKR mn) 2013 2014 2015E 2016E 2017E
Y/E 31st DecemberCash Flow from Operating Activities
Profit before tax 15,244 14,587 17,446 20,749 22,891
Depreciation & amortization expenses 304 211 220 239 259
Net interest Income -735 -403 -464 -533 -613
Write off of PPE 22 0 0 0 0
Provision for consumables 68 10 0 0 0
Notional interest income -4 -2 0 0 0
Amortisation of employee benefit expenses 3 0 0 0 0
Actuarial gain on defined benefit obligation -24 -34 0 0 0
(Profit)/Loss on disposal of PPE -9 -5 0 0 0
Operating profit before working capital changes 14,869 14,364 17,203 20,455 22,537
(Increase)/Decrease in Inventories -192 -110 -473 -546 -316
(Increase)/Decrease in Trade & Other Receivables 744 642 -148 -170 -99
Increase/(Decrease) in Trade & Other Payables -672 901 841 981 575
Net Change in Working Capital -120 1,432 220 265 161
Operating Activities
Cash generated from operations 14,749 15,796 17,423 20,719 22,698
Interest paid -2 0 0 0 0
Income taxes paid -6,265 -6,043 -10,938 -8,489 -9,366
Gratuity paid 0 0 0 0 0
Net Cash from Operating Activities 8,482 9,753 6,485 12,230 13,332
Investing Activities
Purchase of PPE -288 -311 -383 -421 -413
Return on investment subsidiary 1 0 0 0 0
Proceeds from sale of PPE 24 6 0 0 0
Interest received 662 403 464 533 613
Net Cash from Investing Activities 399 98 81 112 201
Financing Activities
Dividends paid -8,565 -9,088 -6,443 -12,137 -13,390
Unclaimed dividends paid -2 -4 0 0 0
Net Cash from Financing Activities -8,567 -9,092 -6,443 -12,137 -13,390
Net cash during the year 312 759 123 205 142
Net cash at beginning 7,939 8,251 9,010 9,133 9,338
Net cash at end 8,251 9,010 9,133 9,338 9,480

No.1, Lake Crescent,
Colombo 2
Sales Desk: +94 11 2145 000
Fax: +94 11 2145 050
HEAD OFFICE BRANCHES
No.1, Lake Crescent, Matara Negombo
Colombo 2 No. 24, Mezzanine Floor, No.72A, 2/1,
Sales Desk: +94 11 2145 000 E.H. Cooray Building, Old Chilaw Road,
Fax: +94 11 2145 050 Anagarika Dharmapala Mw, Negombo
Matara
Tel: +94 41 2237 636 Tel: +94 31 2233 299
SALES BRANCHES
CEO Jaliya Wijeratne +94 71 5329 602 Negombo
Priyanka Anuruddha +94 76 6910 035
Colombo Priyantha Wijesiri +94 76 6910 036
Damian Le Grand +94 77 7383 237
Nishantha Mudalige +94 76 6910 041 Matara
Isuru Jayawardana +94 76 7084 953 Sumeda Jayawardana +94 76 6910 038
Anushka Buddhika +94 77 9553 613
Gamini Hettiarachchi +94 76 6910 039
Thushara Abeyratne +94 76 6910 037
Nishani Prasangi +94 76 6910 033
Ishanka Wickramanayaka +94 77 7611 200
RESEARCH
Dimantha Mathew +94 11 2145 016 Amanda Lokugamage +94 11 2145 018
Reshan Wediwardana +94 11 2145 017 Michelle Weerasinghe +94 11 2145 018
FIRST CAPITAL GROUP
HEAD OFFICE BRANCHES
No. 2, Deal Place, Matara Kurunegala Kandy
Colombo 3 No. 24, Mezzanine Floor, No. 6, 1st Floor, No.213-215,
Tel: +94 11 2576 878 E.H. Cooray Building, Union Assurance Building, Peradeniya Road,
Anagarika Dharmapala Mawatha, Rajapihilla Mawatha, Kandy
Matara Kurunegala
Tel: +94 41 2222 988 Tel: +94 37 2222 930 Tel: +94 81 2236 010
Disclaimer:
This Review is prepared and issued by First Capital Equities (Pvt) Ltd. based on information in the public domain, internally developed and other sources, believed to be correct.
Although all reasonable care has been taken to ensure the contents of the Review are accurate, First Capital Equities (Pvt) Ltd and/or its Directors, employees, are not
responsible for the correctness, usefulness, reliability of same. First Capital Equities (Pvt) Ltd may act as a Broker in the investments which are the subject of this document or
related investments and may have acted on or used the information contained in this document, or the research or analysis on which it is based, before its publication. First
Capital Equities (Pvt) Ltd and/or its principal, their respective Directors, or Employees may also have a position or be otherwise interested in the investments referred to in this
document. This is not an offer to sell or buy the investments referred to in this document. This Review may contain data which are inaccurate and unreliable. You hereby waive
irrevocably any rights or remedies in law or equity you have or may have against First Capital Equities (Pvt) Ltd with respect to the Review and agree to indemnify and hold
First Capital Equities (Pvt) Ltd and/or its principal, their respective directors and employees harmless to the fullest extent allowed by law regarding all matters related to your
use of this Review. No part of this document may be reproduced, distributed or published in whole or in part by any means to any other person for any purpose without prior
permission.
First Capital Equities (Pvt) Ltd
Recommended