Supplementary material 1
In the sample treated by an isothermal holding at 650 C for 10 s, no
interphase- precipitated carbides can be found. Instead, some randomly precipitated
carbides can be observed. In order to identify the type of these precipitates, analysis
on the orientation relationship was carried out. A TEM bright field (BF) image in
Supplementary Fig. 1a shows the inhomogeneous distribution of the precipitates. The
corresponding dark field (DF) image in Supplementary Fig. 1b was taken from the
selected area diffraction (SAD) spot indicated by the arrow as shown in
Supplementary Fig. 1c. The analysis of SAD pattern, as presented in Supplementary
Fig. 1d, indicated that these precipitates did not obey the Baker-Nutting orientation
relationship (B-N OR) with the ferrite matrix. On the other hand, Supplementary Fig.
1d reveals the Nishiyama-Wassermann orientation relationship (N-W OR); i.e.,
(1 1 0 )α // (1 1 1)MC and [0 0 1]α // [0 1 1 ]MC. For the interphase precipitation and
supersaturated precipitation in ferrite, the MC carbides obey the B-N OR with the
ferrite matrix. On the other hand, if the MC carbides are formed in the supersaturated
austenite, they obey a cube-to-cube orientation relationship with the austenite. With
the decomposition of austenite to ferrite, ferrite may adopt either the Kurdjumov-
Sachs orientation relationship (K-S OR) or the N-W OR with the austenite matrix. As
a result, the K-S or N-W OR is inherited. Thus, the diffraction patterns from the
1
carbides that did not display the BN-OR (as shown in Supplementary Fig. 1c and d)
provide evidence to suggest that these carbides originated from strain-induced
carbides in the prior austenite. It should be noted that strain-induced carbides in the
prior austenite are not uniformly distributed, as shown in Fig. 4a and b and
Supplementary Fig. 1a and b.
Supplementary fig. 1. (a) TEM BF showing randomly precipitated MC carbides in small-grained ferrite
in the sample for 10 s holding condition, (b) the corresponding DF image of (a) taken from the
diffraction spot indicated by the arrow in (c), and (d) the diffraction pattern analysis for (c), which
2
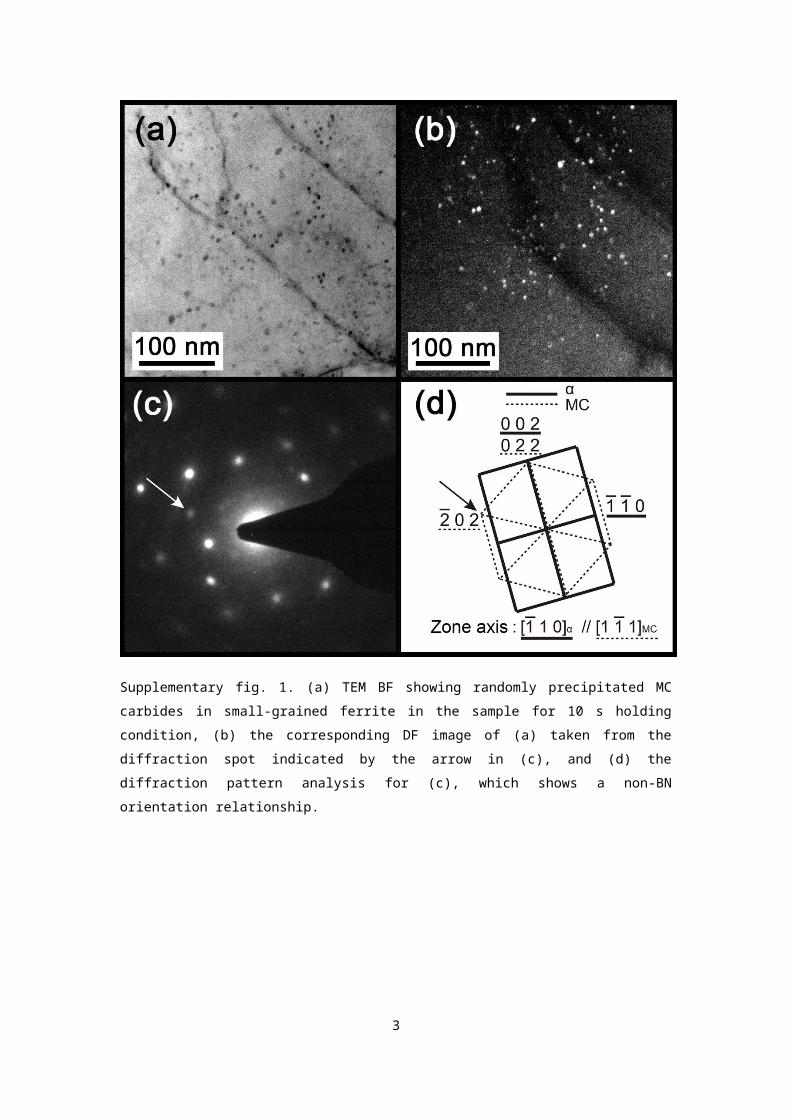
shows a non-BN orientation relationship.
3
Recommended