LULUCF Workshop, Stresa (IT), 26.-27. April, 2017
Area Estimates of Land Cover and Land Management
from Statistical Data
Roland Hiederer, Raul Abad-Viñas, Giacomo Grassi, Tibor Priwitzer, Simone Rossi European Commission Joint Research Centre, Ispra
Estimating Areas at NUTS Levels 0, 1 and 2for 1970 - 2015
2
1. Purpose
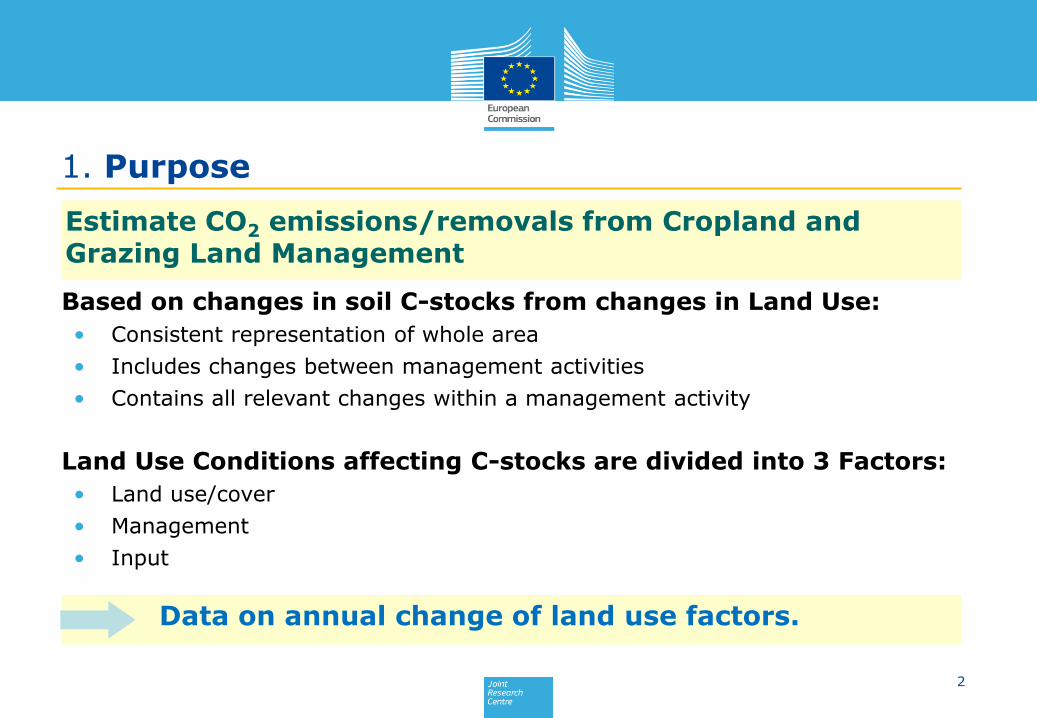
Estimate CO2 emissions/removals from Cropland and Grazing Land Management
Based on changes in soil C-stocks from changes in Land Use:
• Consistent representation of whole area
• Includes changes between management activities
• Contains all relevant changes within a management activity
Land Use Conditions affecting C-stocks are divided into 3 Factors:
• Land use/cover
• Management
• Input
Data on annual change of land use factors.
3
1. Data Processing
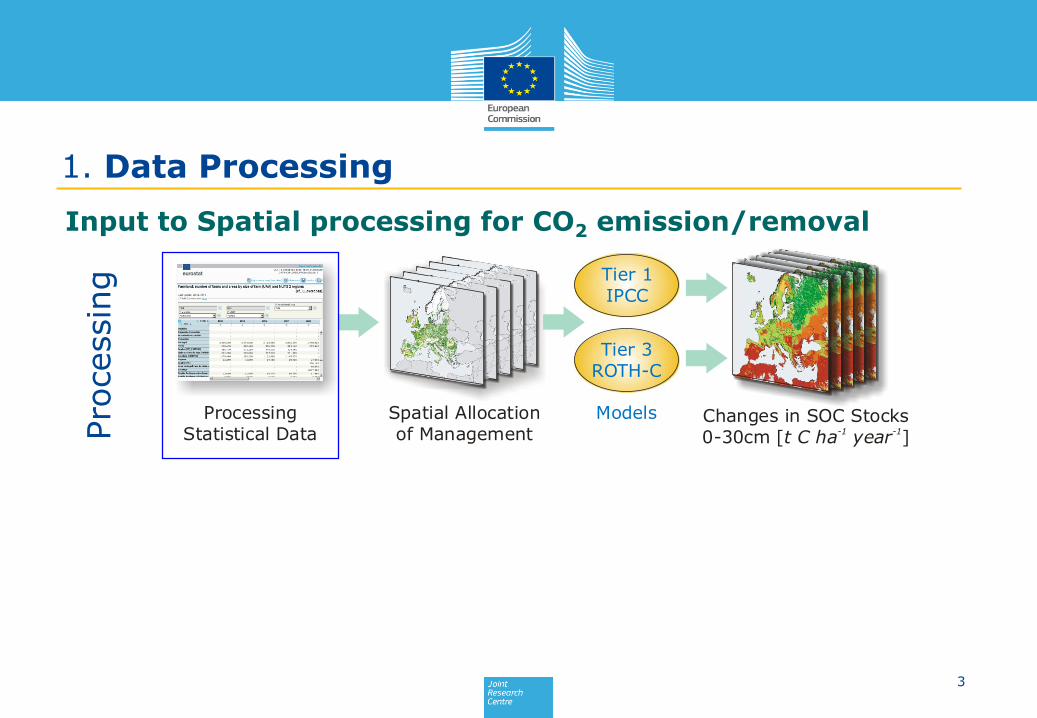
Input to Spatial processing for CO2 emission/removal
Spatial Allocationof Management
Models
1990 2010 2015 202020001970 2050
Run-up period Base period
Tier 1IPCC
Tier 3ROTH-C
ProcessingStatistical Data
CO removals/emissions
from CM and GM2
Territorial Reference Scenario 2017
2020 - 2050*
Changes in SOC Stocks0-30cm [ ]t C ha year
-1 -1
BaselineBaseline
1970 - 2015 1970 - 2015
* Land use change from Territorial Reference Scenario 2017
1970 - 2010 - ...2010
ProjectionActual
Pro
cessin
gPeriod
4
2. Data Requirements
Perennial
Cover
Annual
Crop
Rice
cultivation
Perennial
Crop
Set-aside
< 20 years
Medium
C input
Low
C input
Medium
C input
Medium
C input
Low
C input
Medium
C input
Low
C input
Medium
C input
High C input
with organic
amendments
High C input
without org.
amendments
Crop residues
removed or
burnt
Organic
amendments
Low residue
crops or rotation
with bare fallow
N-min fertiliser
or N-fixing crop
Organic
amendments
Practice
increasing C
input by
enhancing
residues
Practice
increasing C
input by
enhancing
residues
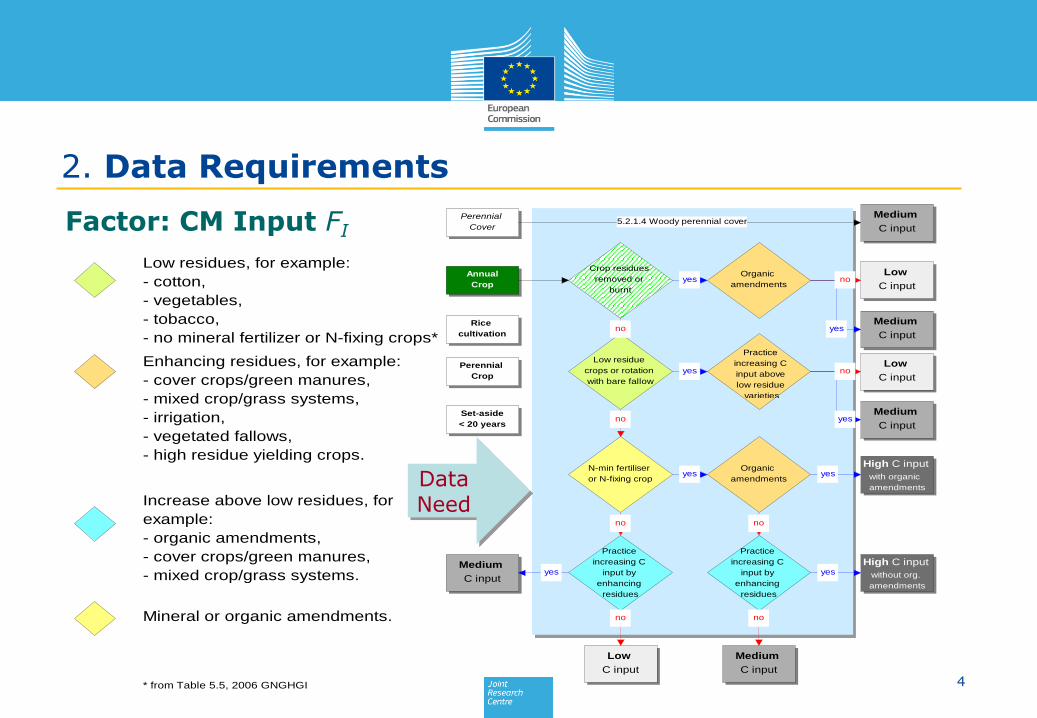
Increase above low residues, for
example:
- organic amendments,
- cover crops/green manures,
- mixed crop/grass systems.
Enhancing residues, for example:
- cover crops/green manures,
- mixed crop/grass systems,
- irrigation,
- vegetated fallows,
- high residue yielding crops.
Low residues, for example:
- cotton,
- vegetables,
- tobacco,
- no mineral fertilizer or N-fixing crops*
5.2.1.4 Woody perennial cover
Practice
increasing C
input above
low residue
varieties
* from Table 5.5, 2006 GNGHGI
Mineral or organic amendments.
no
no
yes
yes
yes
no
yes
no
yes yes
yes
no no
no no
yes
Factor: CM Input FI
DataNeed
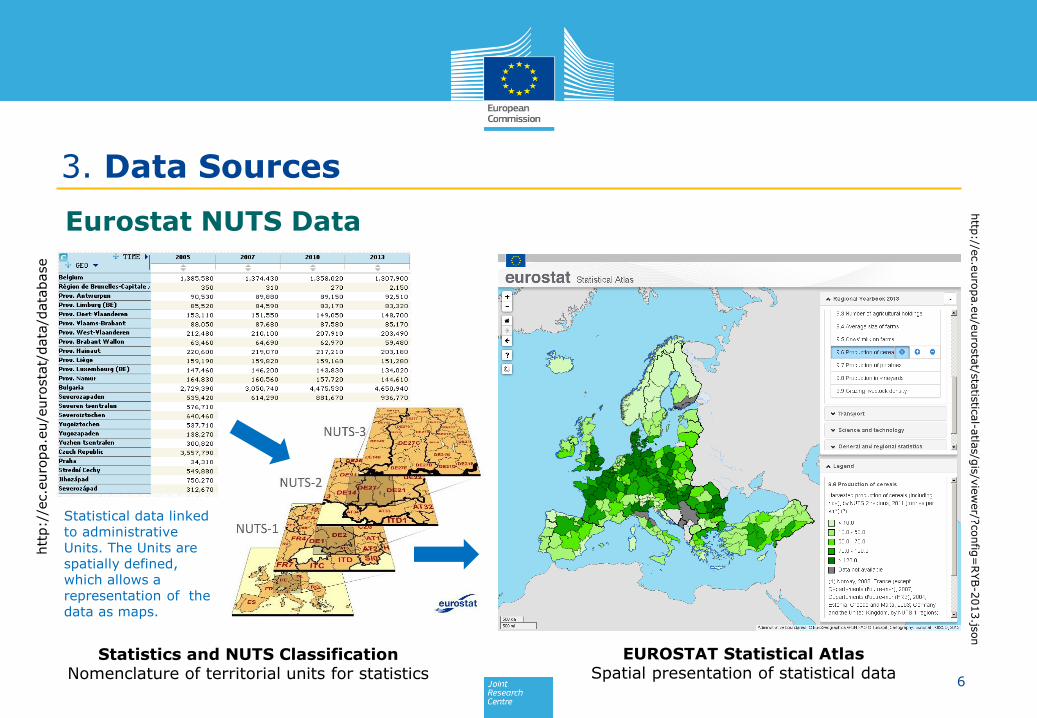
3. Data Sources
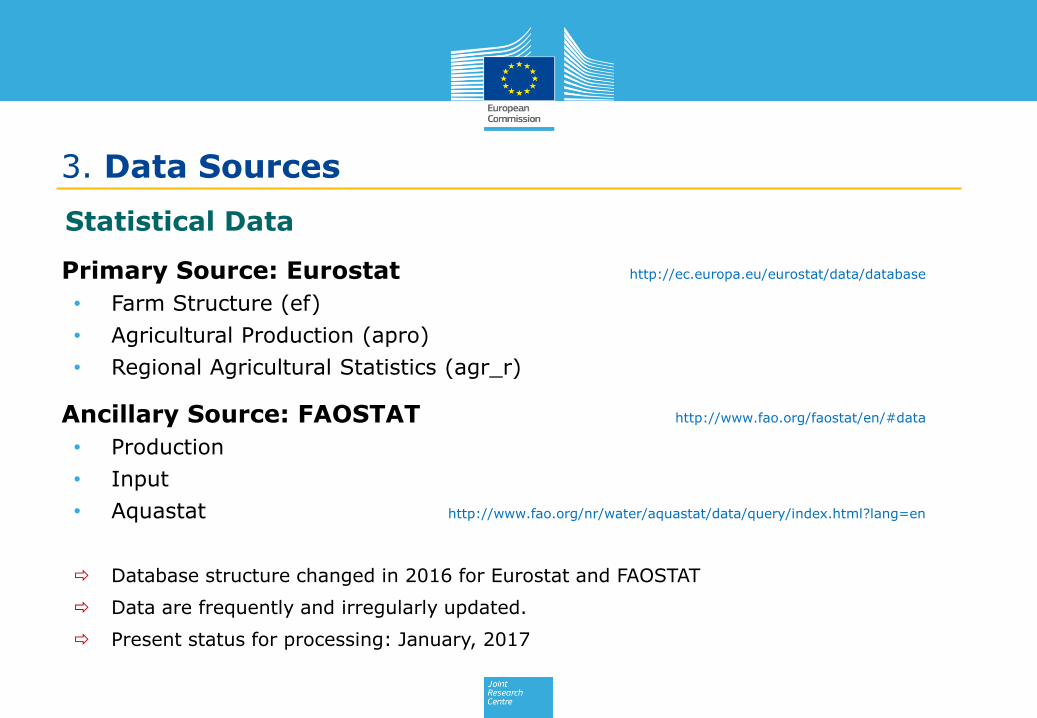
Primary Source: Eurostat http://ec.europa.eu/eurostat/data/database
• Farm Structure (ef)
• Agricultural Production (apro)
• Regional Agricultural Statistics (agr_r)
Ancillary Source: FAOSTAT http://www.fao.org/faostat/en/#data
• Production
• Input
• Aquastat http://www.fao.org/nr/water/aquastat/data/query/index.html?lang=en
Database structure changed in 2016 for Eurostat and FAOSTAT
Data are frequently and irregularly updated.
Present status for processing: January, 2017
Statistical Data
6
http
://ec.e
uro
pa.e
u/e
uro
sta
t/sta
tistic
al-a
tlas/g
is/v
iew
er/?
config
=RYB-2
013.js
on
EUROSTAT Statistical AtlasSpatial presentation of statistical data
Statistics and NUTS ClassificationNomenclature of territorial units for statistics
Statistical data linked to administrative Units. The Units are spatially defined, which allows a representation of the data as maps.
htt
p:/
/ec.e
uro
pa.e
u/e
uro
sta
t/data
/data
base
3. Data Sources
Eurostat NUTS Data
7
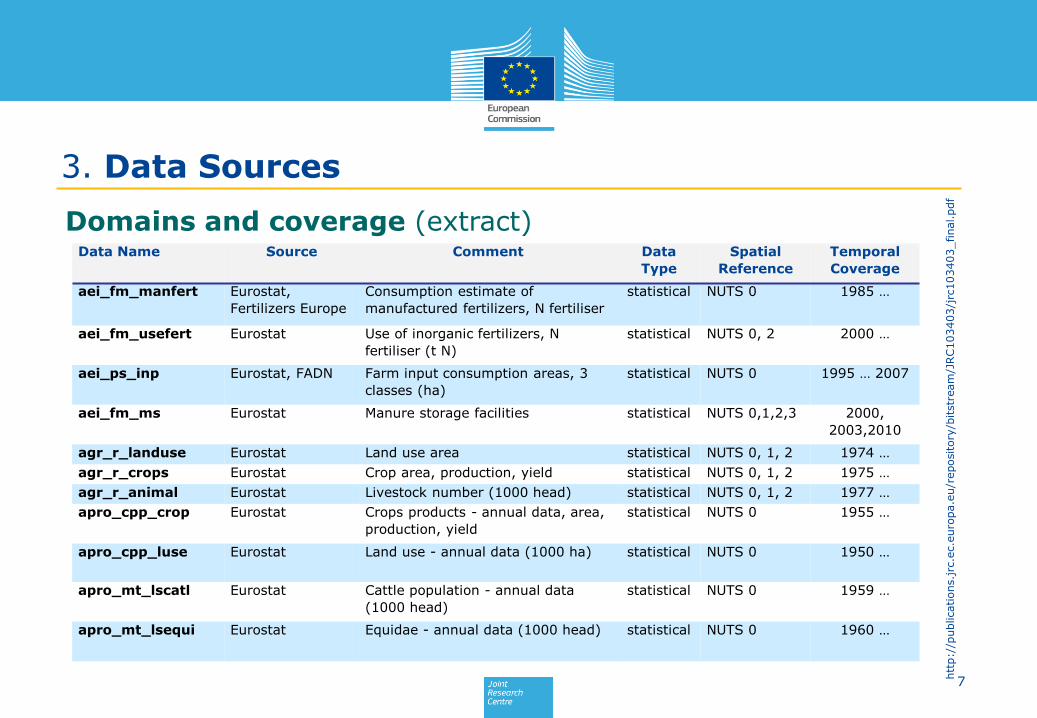
3. Data Sources
Domains and coverage (extract)Data Name Source Comment Data
Type
Spatial
Reference
Temporal
Coverage
aei_fm_manfert Eurostat,
Fertilizers Europe
Consumption estimate of
manufactured fertilizers, N fertiliser
statistical NUTS 0 1985 …
aei_fm_usefert Eurostat Use of inorganic fertilizers, N
fertiliser (t N)
statistical NUTS 0, 2 2000 …
aei_ps_inp Eurostat, FADN Farm input consumption areas, 3
classes (ha)
statistical NUTS 0 1995 … 2007
aei_fm_ms Eurostat Manure storage facilities statistical NUTS 0,1,2,3 2000,
2003,2010
agr_r_landuse Eurostat Land use area statistical NUTS 0, 1, 2 1974 …
agr_r_crops Eurostat Crop area, production, yield statistical NUTS 0, 1, 2 1975 …
agr_r_animal Eurostat Livestock number (1000 head) statistical NUTS 0, 1, 2 1977 …
apro_cpp_crop Eurostat Crops products - annual data, area,
production, yield
statistical NUTS 0 1955 …
apro_cpp_luse Eurostat Land use - annual data (1000 ha) statistical NUTS 0 1950 …
apro_mt_lscatl Eurostat Cattle population - annual data
(1000 head)
statistical NUTS 0 1959 …
apro_mt_lsequi Eurostat Equidae - annual data (1000 head) statistical NUTS 0 1960 …
htt
p:/
/publications.j
rc.e
c.e
uro
pa.e
u/r
epository
/bitstr
eam
/JRC103403/j
rc103403_final.pdf
8
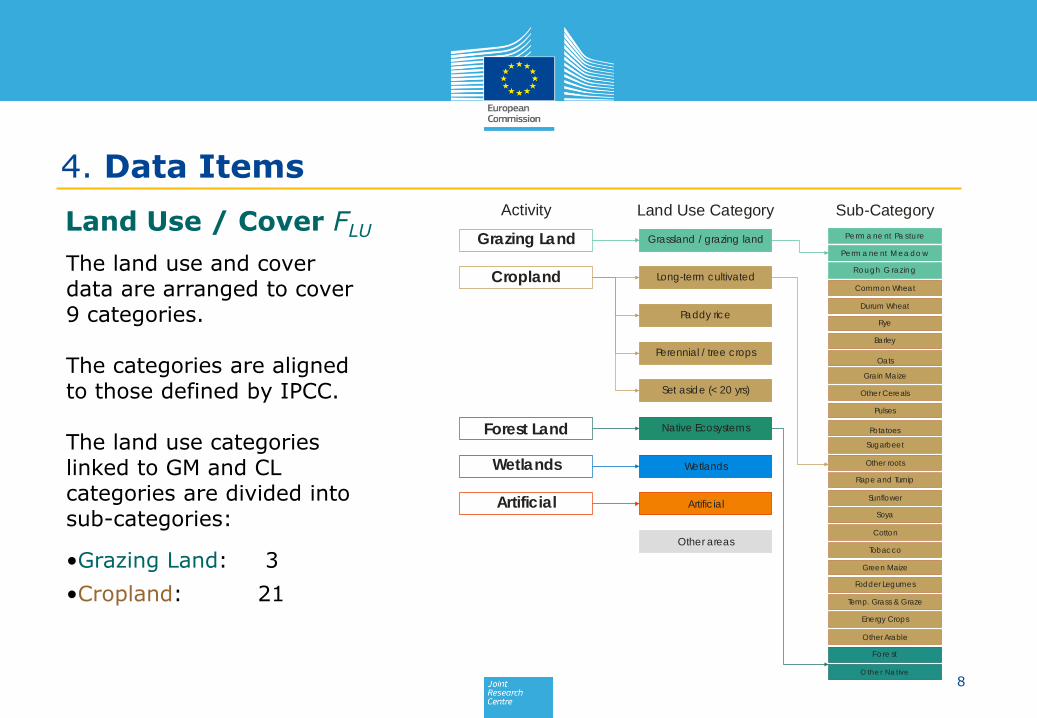
4. Data Items
Land Use / Cover FLU
The land use and cover data are arranged to cover 9 categories.
The categories are aligned to those defined by IPCC.
The land use categories linked to GM and CL categories are divided into sub-categories:
•Grazing Land: 3
•Cropland: 21
Land Use Category Sub-CategoryActivity
Grassland / grazing land
Long-term cultivated
Paddy rice
Cropland
Forest Land
Wetlands
Grazing Land
Perennial / tree c rops
Set aside (< 20 yrs)
Native Ecosystems
Wetlands
Artific ial
Other areas
Pe rm a ne nt Pa stu re
Pe rm a ne nt M e a d o w
Ro u g h G ra zin g
Fo re st
O the r Na tive
Artificial
Common Wheat
Durum Wheat
Rye
Barley
Oats
Grain Maize
Other Cereals
Pulses
Potatoes
Sugarbeet
Other roots
Rape and Turnip
Sunflower
Soya
Cotton
Tobac co
Green Maize
Fodder Legumes
Temp. Grass & Graze
Energy Crops
Other Arable
9
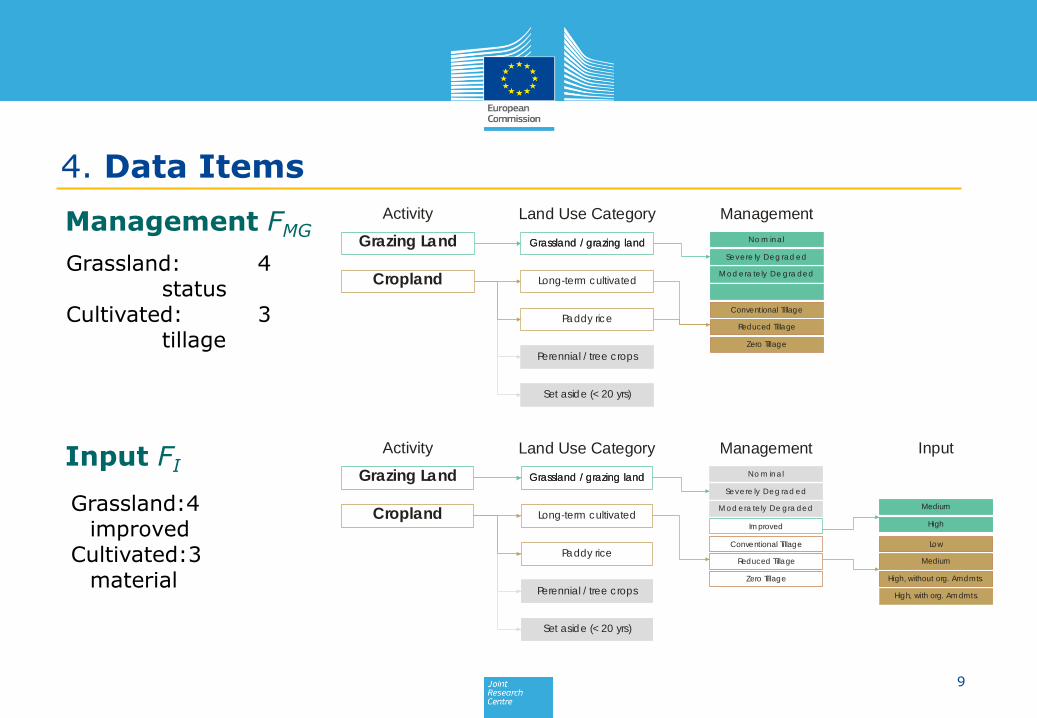
4. Data Items
Management FMG
Input FI
Grassland: 4status
Cultivated: 3tillage
Grassland:4improved
Cultivated:3material
Land Use Category ManagementActivity
Grassland / grazing land
Long-term cultivated
Paddy rice
Cropland
Grazing Land
Perennial / tree c rops
Set aside (< 20 yrs)
No m in a l
Se ve re ly De g ra d e d
M o d e ra te ly De g ra d e d
Im proved
Conventional Tillage
Reduced Tillage
Zero Tillage
Grassland / grazing land
Land Use Category Management InputActivity
Grassland / grazing land
Long-term cultivated
Paddy rice
Cropland
Grazing Land
Perennial / tree c rops
Set aside (< 20 yrs)
No m ina l
Se ve re ly De g ra d e d
M o d e ra te ly De g ra d e d
Im proved
Low
Medium
High, without org. Amdmts.
High, with org. Am dmts.
Medium
High
Grassland / grazing land
Zero Tillage
Reduced Tillage
Conventional Tillage
5. Processing Statistical Data
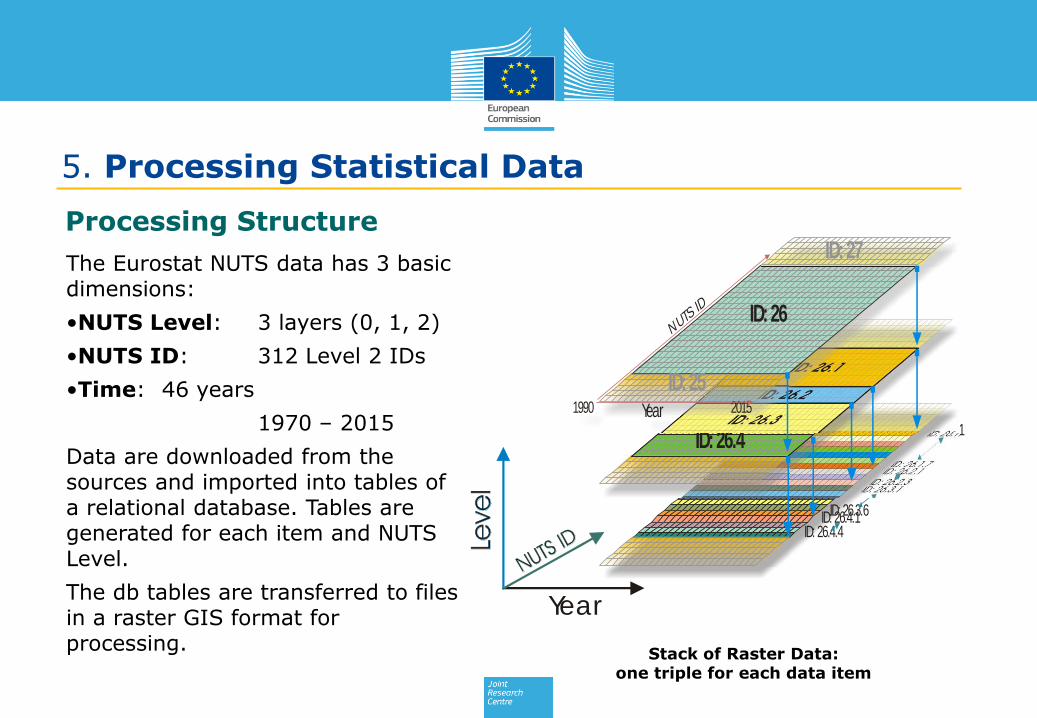
Processing Structure
The Eurostat NUTS data has 3 basic dimensions:
•NUTS Level: 3 layers (0, 1, 2)
•NUTS ID: 312 Level 2 IDs
•Time: 46 years
1970 – 2015
Data are downloaded from the sources and imported into tables of a relational database. Tables are generated for each item and NUTS Level.
The db tables are transferred to files in a raster GIS format for processing.
Stack of Raster Data:one triple for each data item
ID: 26.1.1
ID: 26.1.7ID: 26.2.1ID: 26.2.3ID: 26.3.1
ID: 26.3.6ID: 26.4.1ID: 26.4.4
ID: 26.1ID: 26.2
ID: 26.3ID: 26.4
1990 2015
NUTS ID
Year
ID: 26
ID: 27
ID: 25
Year
11
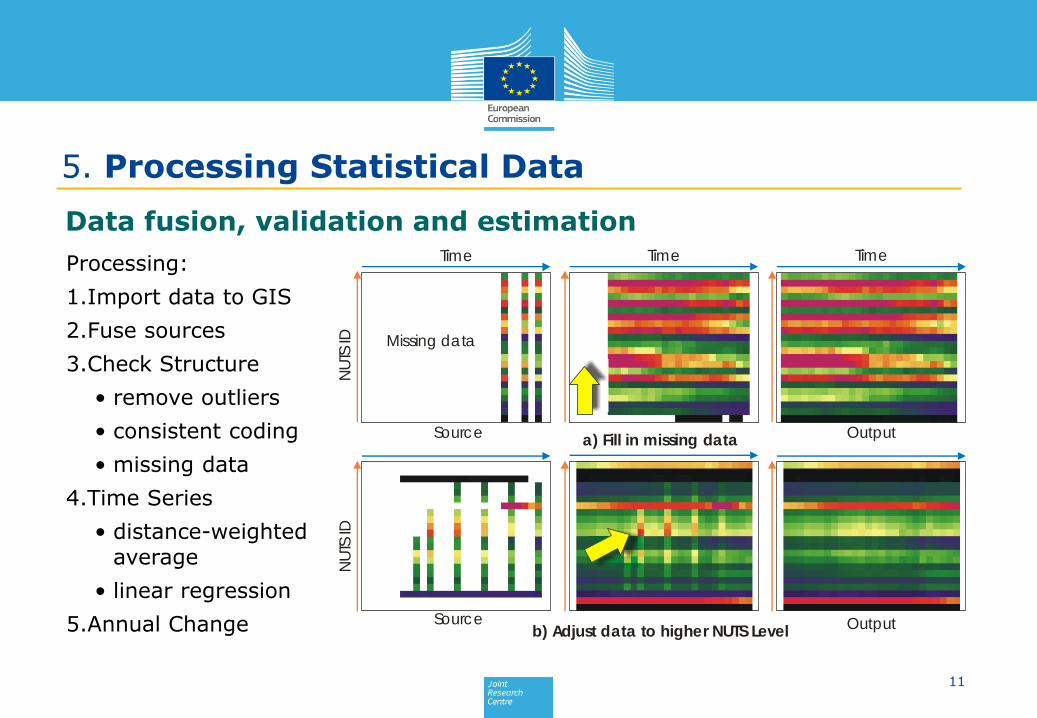
Processing:
1.Import data to GIS
2.Fuse sources
3.Check Structure
• remove outliers
• consistent coding
• missing data
4.Time Series
• distance-weighted average
• linear regression
5.Annual Change
5. Processing Statistical Data
Data fusion, validation and estimation
NU
TS ID
NU
TS ID
Time Time Time
Missing data
a) Fill in missing data
b) Adjust data to higher NUTS Level
Source
Source
Output
Output
12
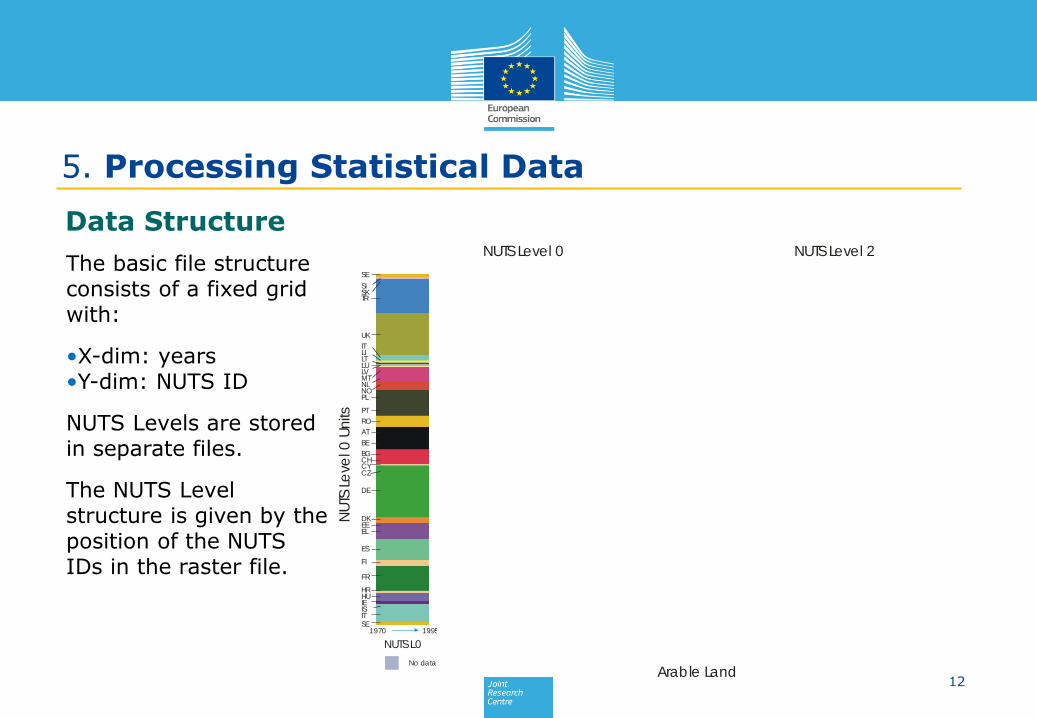
Data Structure
NUTS L0 AGR_R EF_LU EF_LUFAOSTAT Processed
NUTS Level 0
NU
TS L
eve
l 0 U
nits
NU
TS Le
vel 2
Units
AGR_R
NUTS Level 2
FAOSTAT Processed
19701970 1970
19951995 1995
No
FA
OST
AT
da
ta.
SE
SISKTR
UK
ITLILTLULVMTNLNO
PT
PL
RO
AT
BE
BGCH
CZCY
DE
DKEEEL
ES
FI
FR
HRHUIEISITSE
No data
Arable Land
The basic file structure consists of a fixed grid with:
•X-dim: years•Y-dim: NUTS ID
NUTS Levels are stored in separate files.
The NUTS Level structure is given by the position of the NUTS IDs in the raster file.
5. Processing Statistical Data

13
NUTS L0 AGR_R EF_LU EF_LUFAOSTAT Processed
NUTS Level 0
NU
TS L
eve
l 0 U
nits
NU
TS Le
vel 2
Units
AGR_R
NUTS Level 2
FAOSTAT Processed
19701970 1970
19951995 1995
No
FA
OST
AT
da
ta.
SE
SISKTR
UK
ITLILTLULVMTNLNO
PT
PL
RO
AT
BE
BGCH
CZCY
DE
DKEEEL
ES
FI
FR
HRHUIEISITSE
No data
Arable Land
Item: •Arable Land Area
Data sources:•Eurostat agr_r•Eurostat EF_LU•FAOSTAT
The imported data from the various sources are merged into a single layer, but separately for each item and NUTS Level.
Multi-source data merge
5. Processing Statistical Data
14
NUTS L0 AGR_R EF_LU EF_LUFAOSTAT Processed
NUTS Level 0
NU
TS L
eve
l 0 U
nits
NU
TS Le
vel 2
Units
AGR_R
NUTS Level 2
FAOSTAT Processed
19701970 1970
19951995 1995
No
FA
OST
AT
da
ta.
SE
SISKTR
UK
ITLILTLULVMTNLNO
PT
PL
RO
AT
BE
BGCH
CZCY
DE
DKEEEL
ES
FI
FR
HRHUIEISITSE
No data
Arable Land
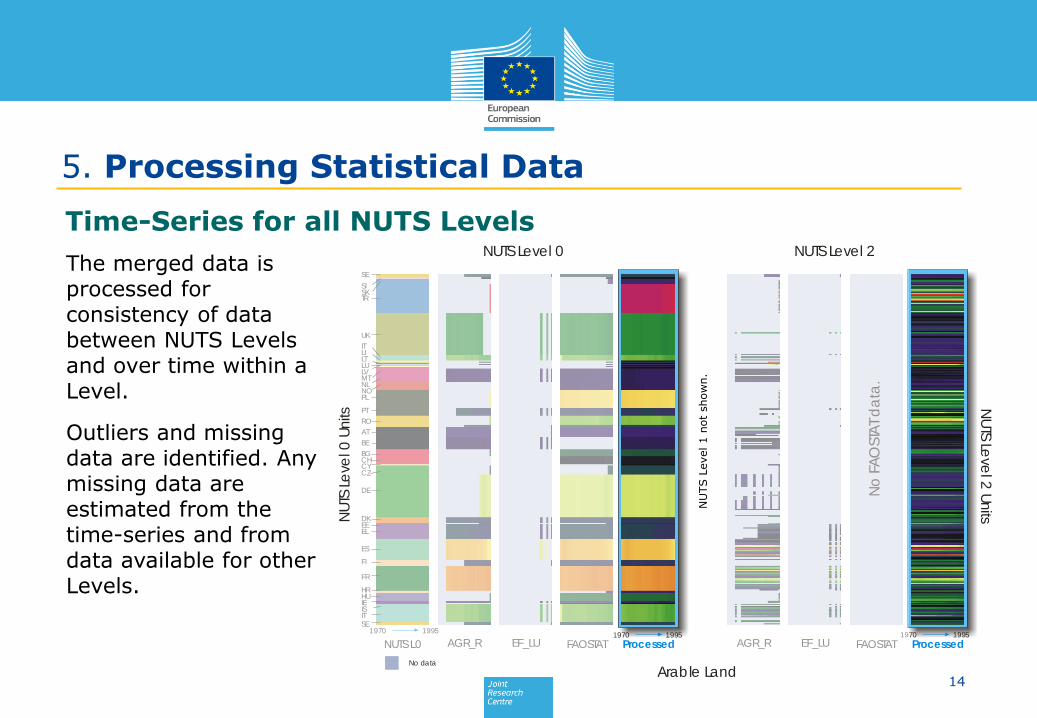
The merged data is processed for consistency of data between NUTS Levels and over time within a Level.
Outliers and missing data are identified. Any missing data are estimated from the time-series and from data available for other Levels.
NU
TS L
evel 1 n
ot
show
n.
Time-Series for all NUTS Levels
5. Processing Statistical Data
15
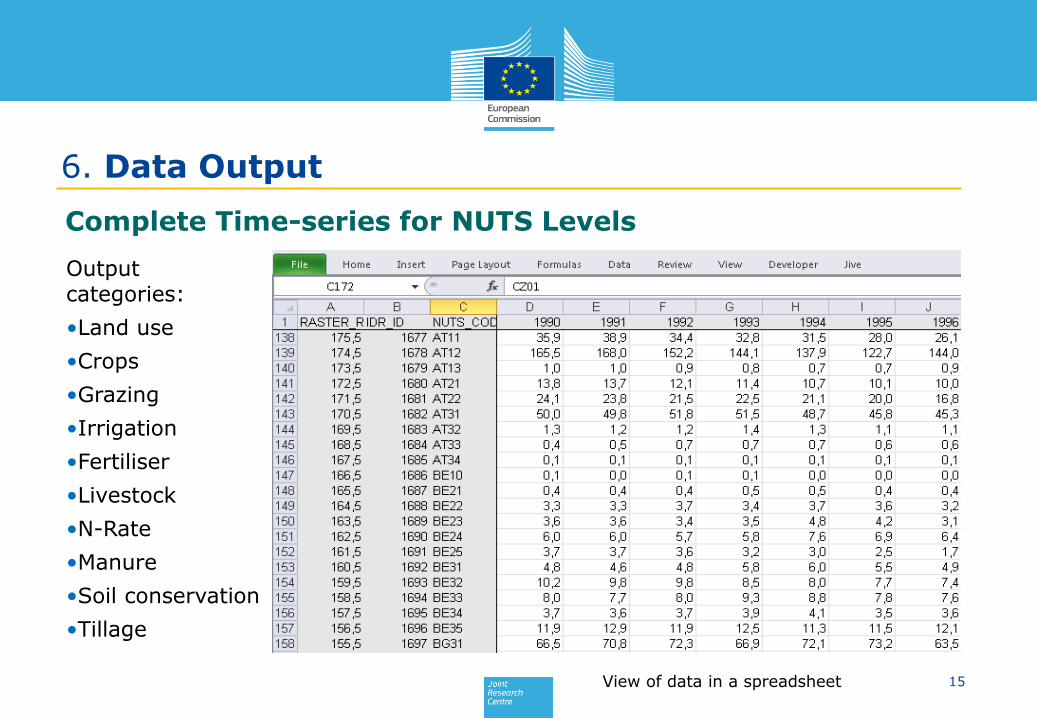
6. Data Output
Complete Time-series for NUTS Levels
Output categories:
•Land use
•Crops
•Grazing
•Irrigation
•Fertiliser
•Livestock
•N-Rate
•Manure
•Soil conservation
•Tillage
View of data in a spreadsheet

16
6. Data Output
Land Use Crop1 Tillage Soil Conserv.
Livestock Grazing N Fertiliser
N Rate Manure Mngmt.
Grassland Cereals Other Roots
Con-ventional
Bare Soil Dairy Cows Total Fodder
Manure N Rice Other Roots
Pasture Range
Cropland Common wheat
Rape & Turnip
Con-servation
Burnt Area Growing Cattle
Grazing Months
Min. N Consumpt.
Common wheat
Rape & Turnip
Daily Spread
Rice Durum wheat
Sunflower Zero Cover Crop Buffaloes Permanent Meadow
Org. N Consumpt.
Durum Wheat
Sunflower Solid Storage
Permanent Crop
Rye Soya Normal Crop Non Dairy Cows
Permanent Pasture
Other N Input
Rye Soya Dry Lot
Set-aside Barley Cotton Residues Growing Pigs
Rough Grazing
Barley Cotton Liquid Slurry
Native Oats Tobacco Breeding Pigs
Oats Tobacco Anaerob. Lagoon
Wetlands Grain Maize
Green Maize
Equidae Grain Maize Green Maize
Pit Below
Artificial Other Cereals
Fodder Legumes
Goats Other Cereals
Fodder Legumes
Deep Bedding
Other Pulses Temp. Grass
Sheep Pulses Temp. Grass
Potatoes Energy Crops
Poultry Potatoes Energy Crops
Sugar beet
Mushrooms Sugar beet
Complete Time-Series for NUTS Level 2
1 Area, Production, Yield and irrigated area
17
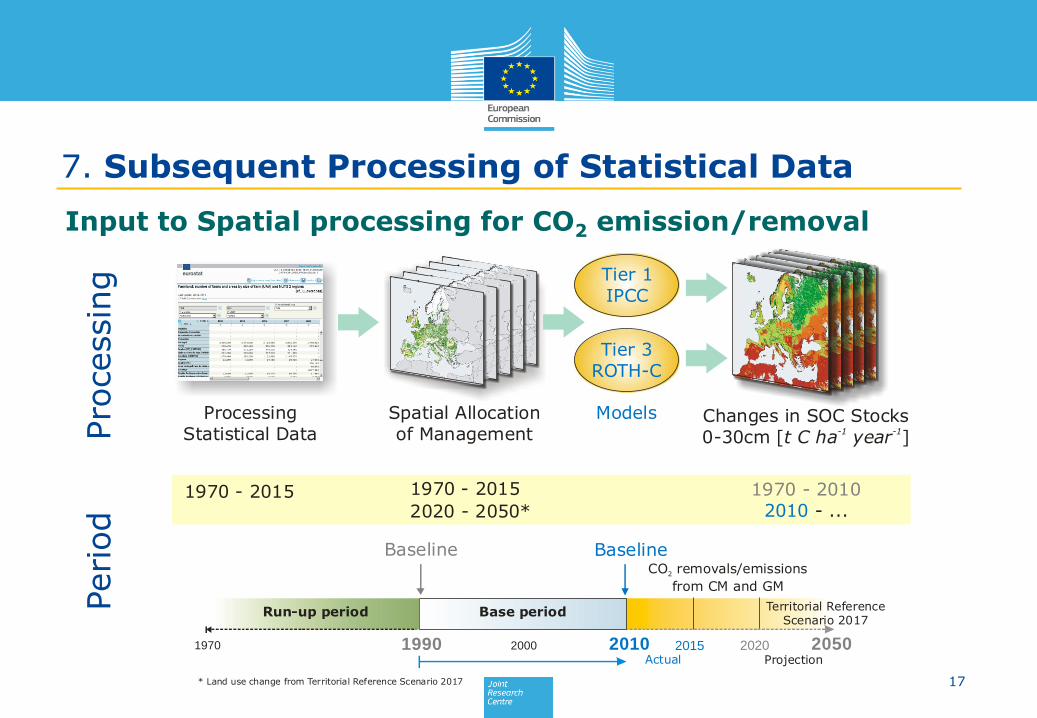
7. Subsequent Processing of Statistical Data
Input to Spatial processing for CO2 emission/removal
Spatial Allocationof Management
Models
1990 2010 2015 202020001970 2050
Run-up period Base period
Tier 1IPCC
Tier 3ROTH-C
ProcessingStatistical Data
CO removals/emissions
from CM and GM2
Territorial Reference Scenario 2017
2020 - 2050*
Changes in SOC Stocks0-30cm [ ]t C ha year
-1 -1
BaselineBaseline
1970 - 2015 1970 - 2015
* Land use change from Territorial Reference Scenario 2017
1970 - 2010 - ...2010
ProjectionActual
Pro
cessin
gPeriod
18
8. Summary
Statistical Data
• The basic data source is Eurostat.• Data from other sources are used in addition and for items for
which Eurostat data are not available.
Data Processing• Data are pre-processed in a relational database.• The data tables from the db are transferred to a GIS raster
format for processing.• Processing covers merging data, check for outliers, consistency
between NUTS Levels and estimating any missing data.
Output• The data covers all NUTS Levels 0, 1 and 2.• The temporal sequence covers 1970 to 2015.
19
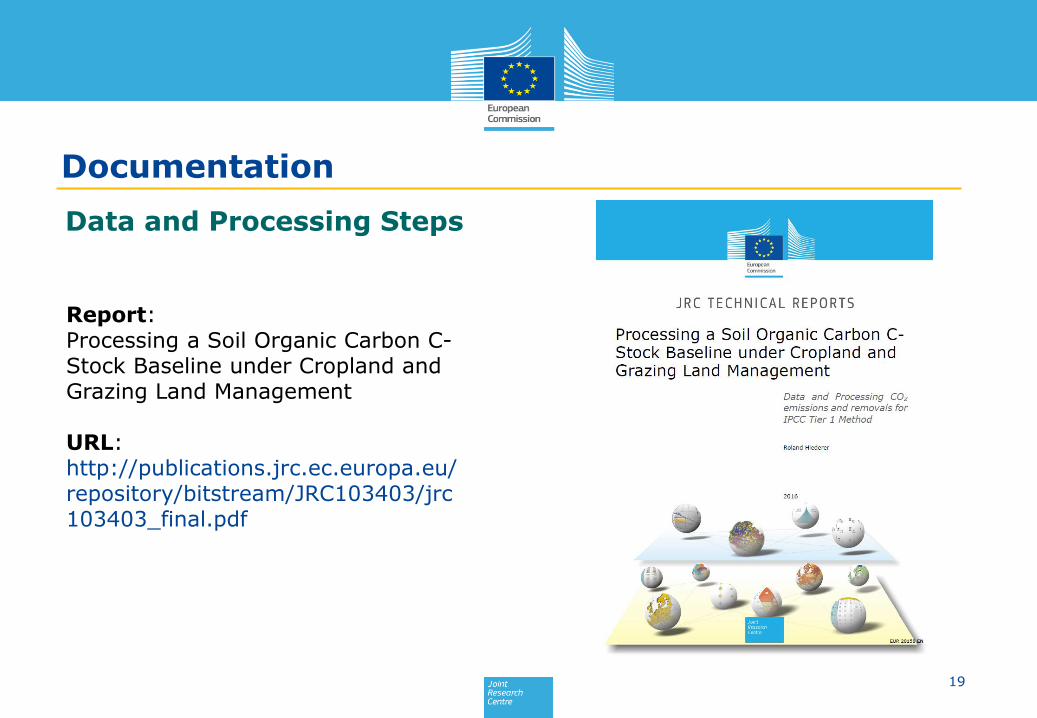
Documentation
Data and Processing Steps
Report:Processing a Soil Organic Carbon C-Stock Baseline under Cropland and Grazing Land Management
URL:http://publications.jrc.ec.europa.eu/repository/bitstream/JRC103403/jrc103403_final.pdf
Recommended