Are All Single Atoms Created Equal? Surface Density Dependent Catalytic Activity of Single Pd Atoms
Supported on Ceria
Yongseon Kim1,||, Greg Collinge2,3,||, Mal-Soon Lee2,3, Konstantin Khivantsev3, Sung June
Cho4,*, Vassiliki-Alexandra Glezakou2,3, Roger Rousseau2,3,*, Janos Szanyi3,*, Ja Hun 5
Kwak1,*
1 Department of Chemical Engineering, Ulsan National Institute of Science and Technology
(UNIST), 50 UNIST-gil, Ulsan 44919, Republic of Korea
2 Physical and Computational Sciences Directorate and Institute for Integrated Catalysis, 10
Pacific Northwest National Laboratory, Richland, WA 99354, USA
3 Institute for Integrated Catalysis, Pacific Northwest National Laboratory, Richland, WA
99352 USA
4 Department of Chemical Engineering, Chonnam National University, 77 Yongbong-ro, Buk-
gu, Gwangju 61186, Republic of Korea 15
*Corresponding authors: [email protected], [email protected],
[email protected], [email protected]
|| These authors contributed equally. 20
ABSTRACT The analogy between single atom catalysts (SACs) and molecular catalysts predicts that the
specific catalytic activity of these systems is constant. We provide evidence that this prediction
is not necessarily true. As a case in point, we show that the specific activity over ceria-
supported single Pd atoms linearly increases with metal atom density, originating from the 5
cumulative enhancement of lattice oxygen mobility. The long-range electrostatic fingerprints
(~1.5 nm) around each Pd site overlap with each other as surface Pd density increases,
resulting in the observed deviation from constant specific activity. These cooperative effects
exhaust previously active O atoms above a certain Pd density, leading to their permanent
removal and consequent drop in reaction rate. The findings of our combined experimental and 10
computational study show that the specific catalytic activity of reducible oxide-supported single
atom catalysts can be tuned by varying the surface density of single metal atoms.

MAIN
Supported single atom catalysts (SACs) have attracted considerable attention owing to their
unique activity, efficient utilization of supported noble metals, and potentially bridging the gap
between homogeneous and heterogeneous catalysis.1-4 Increasing the surface metal density 5
of SACs is commonly sought after to increase the mass activity of industrial catalysts.5-10
However, such efforts assume that the active sites of SACs exhibit constant specific
activity.1,11-13 Here, using CO oxidation as a probe reaction, we show that, the specific activity
of Pd/CeO2 SACs increases with Pd density due to synergistic nonlocal effects. This
phenomenon, however, is support-dependent as Pd SACs supported on non-reducible -Al2O3 10
exhibit constant specific activity for CO oxidation.
Numerous SACs have been characterized and reported to exhibit high activity for the CO
oxidation reaction including the seminal Pt/FeOx catalyst.14 The charge state of the single atom
centers is commonly invoked to explain this activity,15 reportedly enhancing CO and/or O2
adsorption. Subsequently, the choice of support and its redox state has been shown to impact 15
CO oxidation activity greatly,16,17 with irreducible supports, such as -Al2O3 or MgO, identified
as comparatively inactive18 or unstable19-21 without modification such as the induction of defect
sites22 or the addition of La23 or other heteroatom substituents.24 Conversely, single atoms on
reducible supports show considerable CO oxidation activity.25-27 Some supports have even
been reported to allow the stabilization of metallic single atoms.28 Spezzati et al. reported high 20
CO-oxidation activity of isolated Pd atoms supported on CeO2(111) and identified a PdOx
species as the active site.29,30 However, despite considerable research efforts on SACs, the
effect of surface density of single metal atoms on catalytic activity has not been elucidated.
In this study, we report the synergistic effect between single Pd atoms supported on CeO2.
H2-temperatrue programmed reduction (TPR) and in-situ Raman studies employed in this 25
work clearly show that the reducibility of the support is enhanced as the density of single Pd
atoms increases. Density functional theory (DFT) calculations confirm the lowering in oxygen
vacancy formation energies as the surface Pd density increases, while CO and O2 adsorption

energies remain unaffected. This suggests that the observed specific activity trends are due
to the activation of lattice O by Pd. Charge and spin density analysis allow us to identify the
active site as an overoxidized Pd>2+ in a [PdO4] square planar complex consistent with X-ray
Adsorption Spectroscopy (XAS). The Pd atom is overoxidized, past +2, and its coordinating
oxygens are valence unsaturated, making [PdO4] an excellent oxidizer with a considerable—5
and importantly, cumulative, range of effect. Thus, as the surface density of [PdO4] complexes
increases, their individual oxidation power also increases. The support mediates this process,
allowing for the shuttling of excess charge to nearby [PdO4], explaining why -Al2O3, a non-
reducible support, does not exhibit the same synergy.
10
RESULTS
CO oxidation on Pd/CeO2
The effect of surface single atom density on the catalytic properties of Pd/CeO2 (see Figure
S1 – S3 for characterization of CeO2) and Pd/Al2O3 catalysts was investigated in the model
reaction of CO oxidation as a function of surface Pd density, displayed in Figure 1(a) (Figure 15
S4(a) shows the relationship as a function of Pd weight loading).

Figure 1. (a) Specific activity of CO oxidation at steady state as a function of surface Pd density of
Pd/CeO2 and Pd/Al2O3. (b) Specific activity of Pd/CeO2 as function of time. (c) Arrhenius plots of 0.1,
0.2 and 0.4 Pd/CeO2 catalysts for CO oxidation.
The specific activity of Pd/CeO2 catalysts increased linearly with surface Pd density up to
~0.8 Pd/nm2. This behavior was observed for both initial (Figure S4(b)) and steady state 5
activities (Figure 1(a)). In the contrasting case of Pd/Al2O3 catalysts, the specific activity was
constant below ~0.034 Pd /nm2, in agreement with previously reported results.1,11,12 Specific
activity as a function of time for a selected series of Pd/CeO2 catalysts is also shown in Figure
1(b), (for the entire series of Pd/CeO2 and Pd/Al2O3 catalysts, see Figure S4(c) and (d)).
Pd/CeO2 catalysts with Pd surface densities in the range of 0.1-0.8 Pd /nm2 deactivated slowly 10
while catalysts with surface densities between 1.2-4 Pd/nm2 underwent rapid deactivation.
Sintering of Pd atoms/small metal clusters and, as we will show, the permanent removal of
previously catalytically active lattice O atoms are primarily responsible for this activity loss.
The apparent activation energies for Pd/CeO2 catalysts with Pd surface densities of 0.1, 0.2
and 0.4 Pd/nm2, estimated from Arrhenius plots in Figure 1(c), were 45, 35 and 40 kJ/mol, 15
respectively. These values are consistent with a Mars-van Krevelen (MvK) mechanism.31-35
Aberration-corrected high angle annular dark field scanning transmission microscopy (AC-
HAADF-STEM) imaging was used to visualize Pd atoms/particles in the CeO2 and Al2O3-
supported catalysts (Figures S5 and S6). Due to low z-contrast between Pd (z = 46) and Ce
(z = 58), we could not observe single Pd atoms in Pd/CeO2 samples with Pd loading ≤0.8 20
Pd/nm2.36-38 On 4 Pd/CeO2, Pd nanoparticles were observed despite the poor contrast,
implying their absence in the lower Pd density sample. For 0.034 Pd/Al2O3, despite the higher
z-contrast between Pd and Al, no Pd nanoparticles were observed, indicating that Pd is
atomically dispersed. At higher Pd surface densities (e.g., 0.20 Pd/Al2O3) distinctive Pd
nanoparticles were observed. 25
Since we could not directly confirm the presence of atomically dispersed Pd on CeO2,
additional structural analysis was carried out. Pd K-edge X-ray Adsorption Near Edge Spectra

(XANES) (Figure S7) and extended x-ray absorption fine structure (EXAFS) data (Figure S8)
were further used to estimate structural parameters (Table 1). The Fourier transformed EXAFS
spectra show primarily a Pd-O scattering at 1.99 Å with coordination number of 3.8±0.6 and
3.7±0.5 for 0.8 and 4 Pd/CeO2, respectively. In bulk PdO, Pd-Pd scattering appears around
3.06 and 3.45 Å with 4 and 8 coordination number, respectively.39 However, no Pd-Pd bond 5
was observed in either 0.8 or 4 Pd/CeO2 samples. Interestingly, the corresponding XANES is
shifted relative to that of PdO, indicating Pd to be in an oxidation state greater than 2+. These
results suggest that Pd is highly dispersed with Pd-O coordination number around 4 in an
overoxidized charge state.
Table 1. Structural parameters from Pd K-edge EXAFS analysis for 0.8 and 4 Pd/CeO2.(a) 10
Sample Pair CN(b) Bond distance (Å ) 2(pm2)(c) E(eV)(d) R-factor
(%)
0.8 Pd/CeO2 Pd-O 3.80.6 1.990.02 5211 4.92.5 3.0
4 Pd/CeO2 Pd-O 3.70.5 1.990.01 1118 4.3102 1.3
(a) Many-body reduction factor, S02 was set to 0.86. The number of the free fitting parameter for XAFS data, 11 was always less than the number of independent points given by the Nyquist theorem. (b) Coordination number, (c) The Debye-Waller factor and (d) Energy shift
CeO2 Redox Properties Modified by Pd Loading 15
Figure 2. H2-TPR profiles of (a) Pd/CeO2 (mcat = 0.05 g) and (b) Pd/Al2O3 (mcat = 0.1 g). The same scale of y-axis is used for the figures.
Since CeO2-based CO oxidation catalysts follow the MvK mechanism,35,40-44 the activity 20
must be related with the redox properties of catalysts. To gain information about this, we
conducted H2-TPR, see Figure 2(a) and (b) for Pd/CeO2 and Pd/Al2O3 catalysts, respectively.

On bare CeO2, surface and bulk reduction peaks at 510°C and above 700°C were observed,
respectively.40 With Pd present, the TPR profile dramatically changed. The intensity of the
reduction peak at 510 °C decreased and a new reduction peak appeared at 205 °C for 0.1
Pd/CeO2. The reduction peak gradually shifted toward lower temperature with increasing Pd
surface density, appearing at 125 °C for 0.4 Pd/ CeO2.45-47 At even higher surface Pd density, 5
very sharp and intense reduction peaks arose under 100 °C.
Table 2. Summary of H2-TPR over Pd/CeO2
Catalyst
Pd content
(molPd/gc
at)
Surface Pd density
(Pd/nm2)
H2-TPR (< 300 °C) Specific activity ×102 (b)
Reduction temperature
(°C)
H2 consumption
(mol/gcat)
CeO2 reduction
(mol/gcat) (a)
0.1 Pd/CeO2 2.4 0.1 205 56.2 53.9 3.9
0.2 Pd/CeO2 4.7 0.2 192 64.5 59.8 12.1
0.4 Pd/CeO2 9.4 0.4 129 77.5 68.1 22.1
1.2 Pd/CeO2 28.3 1.2 73 92.1 63.8 10.9
4 Pd/CeO2 94.3 4.1 36 125.6 31.3 6.9
(a) CeO2 reduction (µmol/gcat) = H2 consumption – Pd content (b) Specific activity (s-1) at steady state
10
H2-TPR clearly reveals that the hydrogen consumption (see Table 2) far exceeded the
amount of Pd loaded. We calculated the contribution from CeO2 reduction by subtracting off
the H2 needed for Pd reduction. Reduction increased with surface Pd density at atomic Pd
dispersion (0.1-0.4 Pd/nm2) and follows a linear trend just like the specific activity (Figure S9).
This result suggests a causal relationship between enhanced reducibility of CeO2 and increase 15
in specific activity, ultimately derived from higher surface Pd density. As the Pd loading is
further increased past 0.4 Pd/nm2, CeO2 reduction decreased and correspondingly, so did
specific activity. This could be due to a decrease in Pd dispersion, but may also be due to
lattice oxygen deactivation, which we will return to shortly. As seen in Figure 2(b), the reduction
temperature of Pd/Al2O3 catalysts was not affected by the surface Pd density. Very small 20
amounts of H2 were consumed at low-temperature (< 50 °C) on 0.017-0.20 Pd/Al2O3 and a
strong reduction peak is observed only with 0.68 Pd/Al2O3, well beyond the point at which
nanoparticles form.48, 49

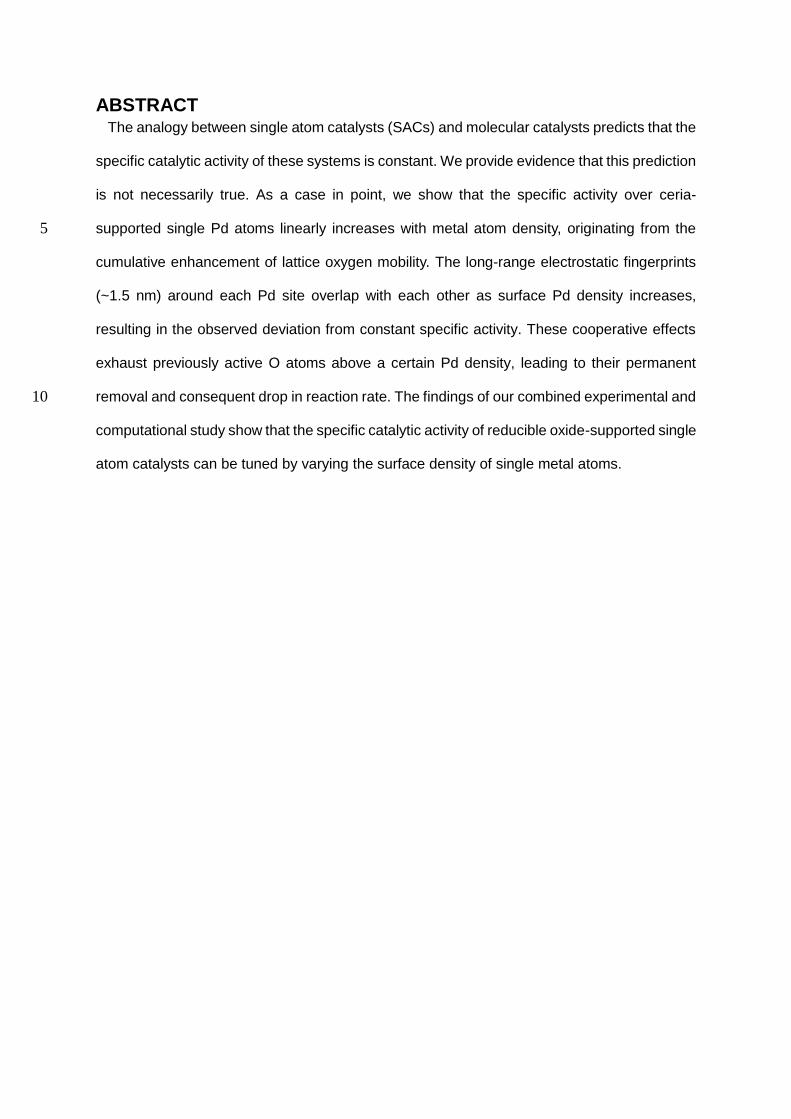
Figure 3. in-situ Raman spectra of (a) 0.2 Pd/CeO2, (b) 0.4 Pd/CeO2 and (c) 4 Pd/CeO2 ((1) room temperature
(RT) – He, (2) RT – 1%CO+2.5%O2/He, (3) RT – 2.5%O2/He, (4) 62 °C – 1%CO+2.5%O2/He, (5) 62 °C – 2.5%O2/He, (6) 125 °C – 1%CO+2.5%O2/He, and (7) 125 °C – 2.5%O2/He). Raman intensity was normalized with F2g (450-470 cm-1) band. The same scale of y-axis is used for the figures. 5
To investigate the observed CeO2 reduction under reaction conditions, we performed in-situ
Raman spectroscopy on the 0.2, 0.4 and 4 Pd/CeO2 catalysts at room temperature (RT), 62°C,
and 125°C. The results obtained are displayed in Figure 3. All samples were pretreated at
350°C in 20% O2/He for 0.5 h. At RT under He only, a Raman band representative of CeO2 at 10
450-470 cm-1 was observed along with weak bands at 270, 600 and 1174 cm-1 (Figure
S10).40,50,51 In CO+O2, a distinct band at 830 cm-1 was observed for 0.2 and 0.4 Pd/CeO2
catalysts. On the 4 Pd/CeO2 catalyst, this Raman band was rather intense after pre-treatment
and He flushing, but this band decreased in the presence of CO+O2 at room temperature. The
830 cm-1 band has been attributed to adsorbed peroxide species (O22-) on isolated two-15
electron defect sites, indicating oxygen vacancy is formed on Pd/CeO2 under reaction
condition.50 As CO is removed from the gas stream, the characteristic Raman band for the
peroxide disappeared on both single atom-containing catalysts (0.2 and 0.4 Pd/CeO2). At
62 °C, the Raman band of peroxide species re-appeared in the CO+O2 stream. The most
noticeable feature is the development of new bands at 1104 and 1514 cm-1 for the 0.4 Pd/CeO2. 20
These bands are assigned to superoxide (O2-) and weakly bound dioxygen (O2
δ-) species,
respectively.52 According to Hess et al.,52 those two dioxygen species can be attributed to the
creation of oxygen vacancies during CO oxidation and transfer of electron to adsorbed oxygen
molecule. As the temperature was further increased to 125 °C, the peroxide peak (830 cm-1)
appeared in a weak intensity under CO+O2 flow. Features for superoxide (1104 cm-1) and
weakly bound dioxygen (1514 cm-1) appeared on 0.2 Pd/CeO2, but their intensities were much
lower than in the 0.4 Pd/CeO2 catalyst. When CO was taken out of the gas stream, the two 5
features became very prominent on both 0.2 and 0.4 Pd/CeO2 catalysts, which might be due
to reaction of the charged oxygen species (O2- or O2
δ-) with gas phase CO or removal of
adsorbed CO on oxygen vacancies. On the other hand, as the surface Pd density further
increased to 4, the intensity of the dioxygen species became significantly lower than over 0.4
Pd/CeO2. The comparison of Raman spectra of 0.2 and 0.4 Pd/CeO2 catalysts clearly shows 10
the facile formation of oxygen vacancies on CeO2 surface with higher surface density of single
Pd atoms in reaction conditions. This result manifests itself in improved oxygen vacancy
formation with surface density of atomic Pd, consistent with results from H2-TPR.
In situ transmission FTIR spectroscopy was used to monitor both the nature of Pd species
present on the CeO2 support after oxidation at 623 K and the variation of the reducibility of 15
CeO2 as a function of Pd loading using CO as a probe molecule. The IR spectra collected
during sequential CO adsorption over Pd/CeO2 catalysts with Pd loadings of 0.2, 0.4 and 4
Pd/nm2 are displayed in Figure S11. IR bands characteristic of Pd ions are observed
exclusively for the 0.2 Pd/CeO2 sample with characteristic IR features centered between 2098
and 2154 cm-1. The 0.4 Pd/CeO2 catalyst exhibits similar IR features of adsorbed CO, however, 20
the intensity ratio of the high and low frequency bands changes dramatically as the Pd loading
increases, indicating changes in the population of Pd ions in different environments on(in) the
CeO2 surface. The series of IR spectra collected from the 4 Pd/CeO2 sample is fundamentally
different from the those of the other two catalysts: they are dominated by IR features of CO
adsorbed on metallic Pd sites (Pd particles). IR bands at 2082-2098 and at 1917-1952 cm-1 25
represent CO molecules bound linearly and in a bridging configuration to Pd0 centers of metal
particles, respectively. It is very interesting to note that upon CO introduction onto all three
samples the formation of CO2 is clearly observed. However, while CO2 is present as an
adsorbed species (sharp IR band at 2351 cm-1) on the atomically dispersed Pd/CeO2 samples,
we only observe the formation of gas phase CO2 (2349 cm-1) over the Pd particles. We
propose that the origin of CO2 formed over the single atom-containing samples is
fundamentally different from that formed on supported Pd particles. The results of DFT
calculations, which will be discussed below, clearly demonstrate that the presence of single 5
Pd atoms significantly reduces the energy of oxygen vacancy formation on CeO2. This, in turn,
means that certain oxygen species on the CeO2 surface in the vicinity of single Pd atoms
become very reactive toward CO, and readily produce CO2. Since these experiments are
carried out at room temperature the thus-formed CO2 stays on the CeO2 surface interacting
with the oxygen vacancies. In contrast, when Pd particles are present on the CeO2 support, 10
CO2 is formed by the reaction of CO with the surface oxide layer formed on the Pd particles
during the 673 K oxidation prior to CO adsorption.

Calculated Properties of the Pd/CeO2 System
Density functional theory calculations, on the dominant oxygen-terminated CeO2(100), were
employed to provide molecular level insights into the effect of surface Pd density on CO
oxidation activity. The 4-fold hollow sites of this surface can stabilize Pd adatoms. However,
as shown in Figure S12, upon deposition of single Pd atoms, exposing the stoichiometric 5
CeO2(100) surface to any partial pressure of oxygen will result in the irreversible adsorption
of one additional O2 molecule per Pd atom to form (PdO2)1 single-metal-centers, see Figure
S12a. These (PdO2)1 reside in a square planar configuration, with a 4-fold Pd coordination to
surface-bound oxygen atoms, labeled O1 – O4 in Figure 4a, Pd-O bond lengths of 1.94 Å –
1.98 Å . This is in excellent agreement with the EXAFS results shown in Table 1 (CN of 3.8 10
and Pd-O bond length of 1.99 Å ). Increasing the surface Pd density therefore corresponds to
decreasing the spatial separation of these [PdO4] sites.
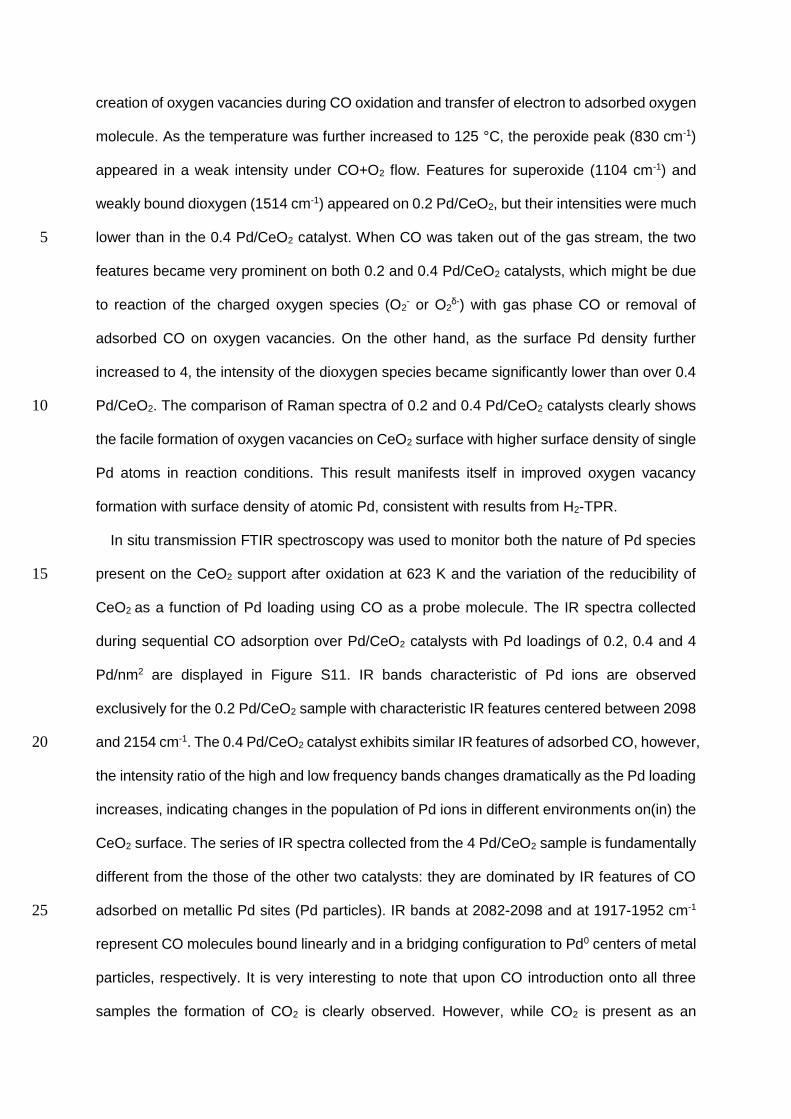
Figure 4. (a) Top-down view of the square planar [PdO4] active site on the CeO2(100) surface with atoms nearby Pd labeled to aid discussion found in the SI. (b) Spin density plot of the [PdO4] active site. 15 (c) Oxygen vacancy formation energies (EOVF) as a function of distance from Pd. (d) Approximate zone(s) of effect (semi-transparent blue circles) of each [PdO4], illustrating how overlapping zones produce a cumulative effect as Pd surface density increases. Brown atoms are Pd, green and red atoms are Ce and O of the CeO2(100) surface, respectively, and the two magenta atoms are O adatoms. 20
Through Bader analysis of the electron and spin density around each atom in and
surrounding the [PdO4] complex (see the SI for details), we are able to determine their
electronic states. We find that Pd is in an unusually overoxidized ~2.6+ state (consistent with
our XANES results) with its surrounding O atoms in markedly unsaturated charge states of
~1.7-. The incomplete valence saturation of Pd 4d and O 2p orbitals can be seen in Figure 4b, 5
clearly showing the presence of spin density (i.e., unpaired charge) in these orbitals, indicative
of partially charged states. This overoxidation occurs because the two additional O atoms (O1
and O2 in Figure 4a) require four total electrons to reach valence saturation, while neither Pd
nor the Ce4+ of the surface can be oxidized sufficiently to provide all four of these electrons.
Instead, Pd provides ~2.6 electrons (apparently the limit of its reducing power) and the 10
remaining electron deficiency is shared equally amongst the 4 Pd-coordinated O atoms (O1 –
O4 in Figure 4a) via charge delocalization.
This overall 2e- deficiency of the PdO4 moiety suggests that it would be an excellent oxidizer
whenever the nearby CeO2 surface is reduced as in CO oxidation via the MvK mechanism.
We confirm this by calculating the oxygen vacancy formation energy (OVFE) of O atoms as a 15
function of their distance from Pd. The results, shown in Figure 4c, are compared against the
calculated OFVE of the pristine CeO2(100) surface (~102 kJ/mol/O). Intriguingly, while the O
atoms in [PdO4] are more difficult to remove (OVFEs of ~133 and ~143 kJ/mol/O) than those
of the pristine surface, nearby O atoms are made dramatically more reactive (OVFEs of 22 –
43 kJ/mol). The effect is diminished around a Pd-O distance of ~8 Å (OVFE of 70 kJ/mol) 20
reaching a plateau (of ~88 kJ/mol) at ~12 Å . As a difference in reducibility between 0.1 and
0.2 Pd/nm2 is seen in our H2-TPR experiments, and our model only allows for a minimum
surface density of ~0.19 Pd/nm2, we suspect a significantly larger distance is required to
completely recover pristine surface behavior. Using the average of 8 Å and 12 Å as an
approximate “radius of [PdO4] effect”, we overlay an illustrative “zone of influence” (semi-25
transparent blue circles in Figure 4d) around each [PdO4] at different surface Pd densities
wherein O atoms are likely activated. Interestingly, areas begin to overlap as surface Pd

density increases, encompassing neighboring [PdO4] by 1.13 Pd/nm2. This suggests a
cumulative effect on oxygen activity as surface Pd density increases.
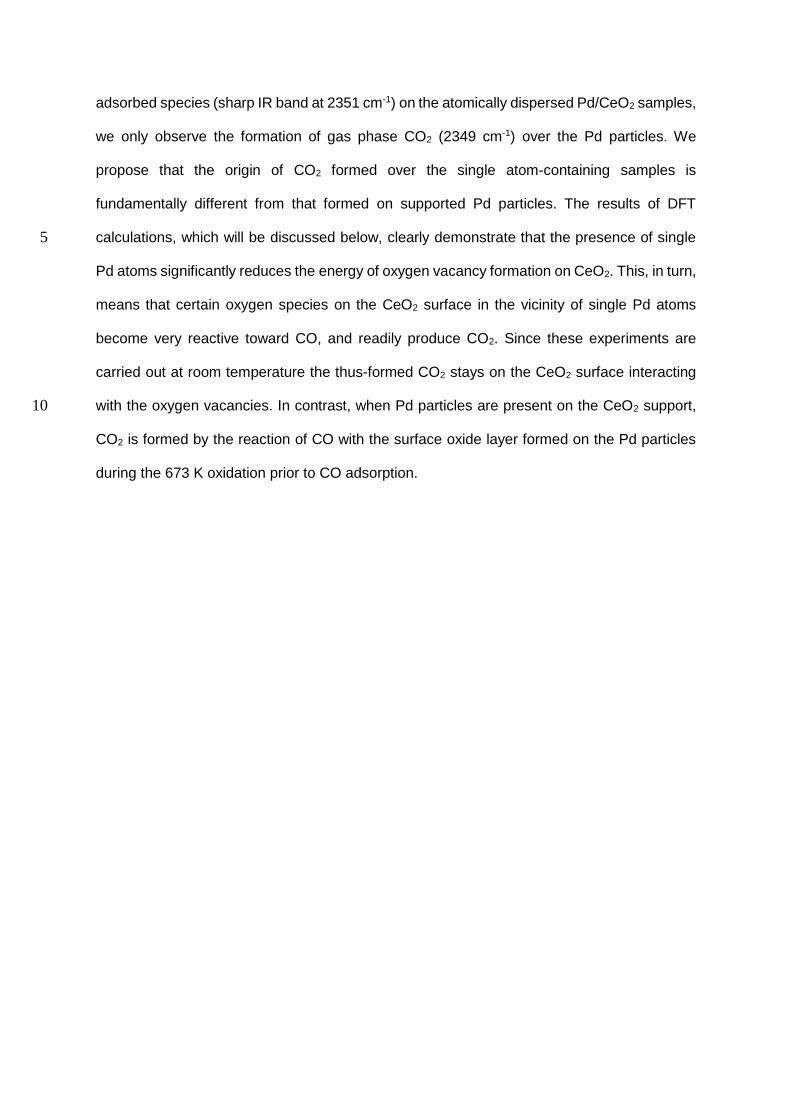
Figure 5. Quantities computed as a function of Pd Loading: (a) oxygen vacancy formation energies, (b) oxygen adsorption energies, and (c) average CO adsorption energies (side view of the corresponding 5 ball-and-stick model is shown inset). (d) Ball-and-stick models of the four surface Pd densities computed here. Symmetrically distinct O atoms are labeled 1 – 5 in each panel of (d). Each series in (a) and (b) corresponds to removal of the labeled O atoms or adsorption of an additional O atom to the labeled O atoms to form a superoxo (O2
-). The series in (c) corresponds to the adsorption of CO on all single Pd atom centers available in each system in (d). 10
To test this presumption, we compute OVFEs for the five most proximal (out to ~8 Å ) O
atoms to Pd (including the O atoms in [PdO4]) as a function of surface Pd density, shown in
Figure 5a. The results indicate that oxygen activity is progressively enhanced as surface Pd
density increases, with a general downward trend in OVFEs seen for the O atoms not directly 15
coordinated to Pd (labeled O3 - O5 in Figure 4). Regardless of surface Pd density, the Pd-
coordinated O atoms (labeled O1 and O2 in Figure 4) remain more tightly bound than O atoms
in pristine CeO2(100), indicating these O atoms are not likely involved in the CO oxidation
reaction. In Figure 5b and 5c, respectively, we show that O2 and CO adsorption energies are

minimally affected by surface Pd density, indicating that the primary cause of the enhanced
CO oxidation activity, as seen in experiment, is driven by the increased O reactivity. An
analysis of the charge distribution, seen in Figures S16 – S18, reveals that [PdO4] is
consistently reduced after O atom removal, regardless of which O atom is removed. As can
be seen in Figure S19, for the O3 atom most proximal to [PdO4], the most likely participant in 5
CO oxidation, the OVFEs correlate well with the change in work function (), with large
corresponding to the highest OVFEs. This indicates that nonlocal electrostatic effects to be
the source of the observed OVFE trends.
The OVFE and O2 adsorption energy of O3 at surface Pd density of 1.13 Pd/nm2 (see Figure
5a and 5b) deserves highlighting. We find that the OVFE is thermoneutral to within expected 10
errors, suggesting that this O atom should be very active. However, the subsequent re-
adsorption of O2 is lacking an enthalpic driving force so once this O vacancy forms, it will be
permanent. This is consistent with experimental results that showed decreased oxygen
species adsorption on oxygen vacancies on 4 Pd/CeO2 (Figure 3). As can be seen in Figure
S20, up to 4 such proximal O atoms can be removed, corresponding to two thirds of the 15
available [PdO4] active sites. This is a significant loss of active O atoms and may explain the
experimentally observed loss in specific activity (Figure 1) beyond simple Pd agglomeration.
CONCLUSIONS
Our study highlights a synergy between single Pd atoms on CeO2 and enhanced catalytic 20
activity, in contrast to the constant-activity behavior typically assumed for single atom catalysts.
By combining activity measurements, H2-TPR, Raman spectroscopy, FTIR, and DFT
calculations, we demonstrate that this improvement is due to increased activity of O atoms
proximal to Pd, with a surprisingly large area of influence (at minimum 2.0 nm2) and O activity
accumulation as surface Pd density increases. This unique behavior, characteristic of CeO2 25
but absent in Al2O3, emphasizes the importance of the support.
XANES, EXAFS, DFT and charge analysis allowed us to characterize the Pd/CeO2 active
site as an overoxidized square planar [PdO4] complex with Pd in an approximate +2.6
oxidation state and unsaturated valence O atoms in approximately -1.7 oxidation states. The
oxidative power of [PdO4] is also shown to have a large lateral range of effect on oxygen
activity that accumulates as surface density of [PdO4] increases. This stems from the ability of 5
CeO2 to shuttle charge from oxygen vacancies to the [PdO4] complex, which reduces it to a
more stable oxidation state. Both Raman spectroscopy and DFT calculations reveal the limits
of this cumulative effect at high surface Pd densities result in overactivation and permanent
removal of previously active O atoms. Overall, the most interesting feature is direct correlation
of specific activity to CeO2 reducibility rather than Pd. This work invites further investigation 10
into the origin and manifestation of nonlocal effects in single atom catalysts that have hitherto
received little attention.

METHODS
Catalysts preparation
The nanocube CeO2 support, dominated by (100) facets, was hydrothermally synthesized
in Teflon-lined stainless steel autoclaves as previous report.40 Pd/CeO2 catalysts were
prepared by incipient wetness impregnation using Pd(NH3)4(NO3)2 solution followed by 5
calcination at 400 °C for 4 h under air. Pd/Al2O3 catalysts were prepared by same method
using commercial γ-Al2O3 (PURALOX® SBa200, Sasol, SA=200m2/g). The Pd/Al2O3 catalysts
were calcined at 700 °C for 1 h using 20% O2/He (60 ml min-1) as previous report.23,53 Resulting
catalysts were designated as as X Pd/CeO2 and X Pd/Al2O3 (X = surface Pd density, Pd /nm2)
10
Catalyst characterization
1. CeO2 support
XRD pattern of the synthesized CeO2 was obtained on a D8 Advance (Bruker) using Cu Kα
radiation (λ = 1.5406 Å ) at 40 kV and 40 mA, with a step size of 0.05 in 2θ and a time per step
of 0.5 sec in the 2θ range from 10 to 110 °. BET surface area was determined via N2 adsorption 15
with a BELSORP-max system (Bel Japan) after degas at 150 °C for 4 h. Scanning electron
microscopy (SEM) was performed using an SU-8220 (Hitachi). Transmission electron
microscopy (TEM) was performed using a JEM-2100 (JEOL).
2. Pd/CeO2 and Pd/Al2O3 catalysts
AC-HAADF-STEM was performed using JEM-2100F (JEOL). XAFS at Pd K-edge (24350 20
eV) were performed in fluorescence mode at the 7D beamline of the Pohang Accelerator
Laboratory (PLS-II). The data was analyzed by the standard method using the Ab-initio Feff
program.54
H2-TPR experiments were carried out using BELCAT-II (Bel Japan). 0.05 g of Pd/CeO2
catalysts were pretreated at 400 °C for 30 min under 20% O2/He flow (60 ml min-1). 0.1 g of 25
Pd/Al2O3 catalysts were pretreated at 700 °C for 30 min under 20% O2/He flow (60 ml min-1).
After calcination, the samples were cooled to -80 °C. The thermal conductivity detector (TCD)

signal was stabilized for 2 h and reduction was carried out under a flow of 2% H2/Ar (60 ml
min-1) at a ramp rate of 10 °C min-1. The amount of H2 consumed was determined from the
TCD signal intensities calibrated using pulse of known amount of H2. 13X molecular sieve was
used to remove water produced during the catalyst reduction.
In-situ Raman analysis was performed on WITec alpha300R Micro-imaging Raman 5
Spectrometer equipped with a 532-nm (3.0 mW) Nd-YAG excitation laser and 40× Nikon
objective (NA = 0.6). A spectrometer with a grating of 600 gr/nm was used. The Pd/CeO2
catalysts was loaded into a high-temperature reaction chamber (Harrick scientific) and
pretreated at 350 °C for 0.5 h under 20% O2/He (60 ml min-1). The catalysts were cooled to
room temperature (RT) and purged with He (60 ml min-1) for 30 min. The catalysts were 10
exposed to 1% CO + 2.5% O2 /He and 2.5% O2/He (60 ml min-1) for 5 min in each condition
at selected temperatures (RT, 62 and 125 °C). The spectral acquisition was executed with 20
scans at 3 s/scan using an electrically cooled CCD detector.
In situ transmission FTIR experiments were carried out on selected Pd/CeO2 samples using
CO as a probe molecule. The home-built IR cell consists of 2 ¾” stainless steel cube equipped 15
with CaF2 windows, connected to a gas handling manifold and a pumping station. The
powder samples were pressed onto a tungsten mesh (>80 % IR transmission) and mounted
onto a copper sample holder assembly attached to the Cu heating legs of a ceramic feed
through. The sample can be heated resistively, and its temperature is monitored by a K type
thermocouple spotwelded to the top center of the W mesh. IR spectra were collected with 20
Bruker Vertex 70 spectrometer equipped with a liquid nitrogen-cooled MCT detector. All the
spectra were collected at 4 cm-1 resolution and each spectrum was the average of 256 scans.
The samples were first oxidized at 673 K in ~ 1Torr of O2 for 1 h, cooled to 295 K in O2 before
evacuating the cell. After evacuation (<5x10⁻⁸ Torr) a background spectrum was collected with
the sample in the IR beam followed by sequential CO introduction into the cell. After 25
equilibration following each CO aliquot an IR spectrum was collected. The highest equilibrium
CO pressure in the IR cell ~0.4 Torr.

Catalyst performance
CO oxidation reaction tests were performed in a quartz flow reactor using 0.02 g catalysts
supported by quartz wool. Prior to reaction test, Pd/CeO2 and Pd/Al2O3 catalysts were
pretreated under a flow of 20% O2/He (total flow rate of 60 ml min-1) for 30 min at 400 °C and
for 1 h at 700 °C, respectively. The activity was measured at 75 °C with feed gas of 1% CO 5
and 2.5% O2 in He (total flow rate of 60 ml min-1). The outlet gases were analyzed by Agilent
7820A gas chromatograph (GC) using HP-PLOT Q column and TCD. For reasonable
conversion level (<10%), the catalysts were diluted with an Al2O3 (for Pd/CeO2 catalysts) or
quartz (for Pd/Al2O3 catalysts) if needed (mcat + diluent = 0.02 g). Specific activity (TOF, s-1) was
calculated based on the total Pd loading, assuming 100% dispersion. Conversions from 110 10
to 120 minutes were averaged to calculate specific activity at steady state. For 0.1, 0.2 and
0.4 Pd/CeO2 catalysts, the specific activity at steady state was obtained at least 5 different
temperatures for linear Arrhenius plots.
DFT calculations 15
All calculated solutions to the unrestricted (spin polarized) Kohn-Sham equations on all
Pd/CeO2(100) systems were performed using the CP2K quantum chemical and molecular
dynamics simulation package (version 6.1).55 The Perdew-Burke-Ernzerhof (PBE)56,57
functional was chosen to describe exchange and correlation, while Grimme’s D3-type
parameterization58 with a 15 Å cutoff was chosen to provide dispersion corrections. In CP2K, 20
core electrons and nuclei are described using norm-conserving pseudopotentials of the
Goedecker-Tetter-Hutter (GTH) type.59 Valence electrons were described in a Gaussian –
plane wave hybrid basis set scheme60, using double- ζ Gaussian MOLOPT basis sets61 (for
all elements except Ce) along with a plane wave cutoff of 500 Ry. To properly capture the
electronics and redox properties of Ce, its recently reported LnPP1 GTH basis set and 25
pseudopotential62 were adopted. The GGA+U scheme63 was also utilized with an effective

Hubbard parameter (U-J) of 0.15 Hartrees (~4.08 eV) selected as specified by Lu et al.,62
corresponding to LnPP1. Further computational details can be found in the SI.
Data availability
The data that support the findings of this study are available from the corresponding author 5
on request.
Acknowledgements
We acknowledge the financial support from the National Research Foundation (NRF) (No.
2016R1A5A1009405, 2017R1A2B4007310). Work at the Pacific Northwest National 10
Laboratory (PNNL) was supported by the U.S. Department of Energy, Office of Science, Basic
Energy Sciences, Chemical Sciences, Geosciences, and Biosciences Division. PNNL is a
multiprogram national laboratory operated for DOE by Battelle under Contract DE-AC05-
76RL01830. Computational Resources were provided by a user proposal at the National
Energy Research Scientific Computing Center (NERSC) located at Lawrence Berkley National 15
Laboratory (LBNL).
Author contributions J.H.K. conceived and designed the project. Y.K. carried out the catalyst preparation,
characterization and reaction tests. S.J.C performed EXAFS and the data analysis. K.K. and 20
J.S. carried out IR. G.C., M.S.L, V-A.G. and R.R. designed and performed the DFT
calculations. All the authors contributed critically for understanding the reaction mechanisms
and participated in discussions and writing of the paper.
Additional Information 25
Competing interests
The authors declare no competing interests.

References 1 Yang, X.-F. et al. Single-Atom Catalysts: A New Frontier in Heterogeneous Catalysis. Acc.
Chem. Res. 46, 1740-1748 (2013).
2 Mitchell, S., Vorobyeva, E. & Pérez-Ramírez, J. The Multifaceted Reactivity of Single-Atom
Heterogeneous Catalysts. Angew. Chem. Int. Ed. 57, 15316-15329 (2018). 5 3 Li, X., Yang, X., Huang, Y., Zhang, T. & Liu, B. Supported Noble-Metal Single Atoms for
Heterogeneous Catalysis. Advan. Mater. 31, 1902031 (2019).
4 Cui, X., Li, W., Ryabchuk, P., Junge, K. & Beller, M. Bridging homogeneous and heterogeneous
catalysis by heterogeneous single-metal-site catalysts. Nat. Catal. 1, 385-397 (2018).
5 Wang, J., Li, Z., Wu, Y. & Li, Y. Fabrication of Single-Atom Catalysts with Precise Structure and 10 High Metal Loading. Advan. Mater. 30, 1801649 (2018).
6 Wu, J., Xiong, L., Zhao, B., Liu, M. & Huang, L. Densely Populated Single Atom Catalysts.
Small Methods 4, 1900540 (2020).
7 Tang, C. et al. Coordination Tunes Selectivity: Two-Electron Oxygen Reduction on High-
Loading Molybdenum Single-Atom Catalysts. Angew. Chem. Int. Ed. 59, 9171-9176 (2020). 15 8 Liu, J.-C., Xiao, H. & Li, J. Constructing High-Loading Single-Atom/Cluster Catalysts via an
Electrochemical Potential Window Strategy. J. Am. Chem. Soc. 142, 3375-3383 (2020).
9 Li, J. et al. Ultrahigh-Loading Zinc Single-Atom Catalyst for Highly Efficient Oxygen Reduction
in Both Acidic and Alkaline Media. Angew. Chem. Int. Ed. 58, 7035-7039 (2019).
10 Zhao, L. et al. Cascade anchoring strategy for general mass production of high-loading single-20 atomic metal-nitrogen catalysts. Nat. Commun. 10, 1278 (2019).
11 Kunwar, D. et al. Stabilizing High Metal Loadings of Thermally Stable Platinum Single Atoms
on an Industrial Catalyst Support. ACS Catal. 9, 3978-3990 (2019).
12 Qiao, B. et al. Ultrastable single-atom gold catalysts with strong covalent metal-support
interaction (CMSI). Nano Res. 8, 2913-2924 (2015). 25 13 Yang, M. et al. Catalytically active Au-O(OH)x-species stabilized by alkali ions on zeolites and
mesoporous oxides. Science 346, 1498-1501 (2014).
14 Qiao, B. et al. Single-atom catalysis of CO oxidation using Pt1/FeOx. Nat. Chem. 3, 634-641
(2011).
15 Yang, T. et al. A Theoretical Investigation on CO Oxidation by Single-Atom Catalysts M1/γ-Al2O3 30 (M=Pd, Fe, Co, and Ni). ChemCatChem 9, 1222-1229 (2017).
16 Wang, Y.-G. et al. CO Oxidation on Au/TiO2: Condition-Dependent Active Sites and Mechanistic
Pathways. J. Am. Chem. Soc. 138, 10467-10476 (2016).
17 Yuk, S. F. et al. Selective acetylene hydrogenation over single metal atoms supported on
Fe3O4(001): A first-principle study. J. Chem. Phys. 152, 154703 (2020). 35 18 Lou, Y. & Liu, J. CO Oxidation on Metal Oxide Supported Single Pt atoms: The Role of the
Support. Ind. Eng. Chem. Res. 56, 6916-6925 (2017).
19 Mei, D. et al. Unique Role of Anchoring Penta-Coordinated Al3+ Sites in the Sintering of γ-Al2O3-
Supported Pt Catalysts. J. Phys. Chem. Lett. 1, 2688-2691 (2010).
20 Sarma, B. B. et al. Metal-Specific Reactivity in Single-Atom Catalysts: CO Oxidation on 4d and 40 5d Transition Metals Atomically Dispersed on MgO. J. Am. Chem. Soc. 142, 14890-14902
(2020).
21 Abbet, S., Heiz, U., Häkkinen, H. & Landman, U. CO Oxidation on a Single Pd Atom Supported
on Magnesia. Phys. Rev. Lett. 86, 5950-5953 (2001).
22 Zhang, Z. et al. Thermally stable single atom Pt/m-Al2O3 for selective hydrogenation and CO 45 oxidation. Nat. Commun. 8, 16100 (2017).
23 Peterson, E. J. et al. Low-temperature carbon monoxide oxidation catalysed by regenerable
atomically dispersed palladium on alumina. Nat. Commun 5, 4885 (2014).
24 Venkataswamy, P., Jampaiah, D., Lin, F., Alxneit, I. & Reddy, B. M. Structural properties of
alumina supported Ce–Mn solid solutions and their markedly enhanced catalytic activity for CO 50 oxidation. Appl. Surf. Sci. 349, 299-309 (2015).
25 Qiao, B. et al. Highly active Au1/Co3O4 single-atom catalyst for CO oxidation at room

temperature. Chinese J. Catal. 36, 1505-1511 (2015).
26 Nie, L. et al. Activation of surface lattice oxygen in single-atom Pt/CeO2 for low-temperature CO
oxidation. Science 358, 1419-1423 (2017).
27 Zhang, X. et al. A Ti-anchored Ti2CO2 monolayer (MXene) as a single-atom catalyst for CO
oxidation. J. Mater. Chem. A 4, 4871-4876 (2016). 5 28 Therrien, A. J. et al. An atomic-scale view of single-site Pt catalysis for low-temperature CO
oxidation. Nat. Catal. 1, 192-198 (2018).
29 Spezzati, G. et al. Atomically Dispersed Pd–O Species on CeO2(111) as Highly Active Sites for
Low-Temperature CO Oxidation. ACS Catal. 7, 6887-6891 (2017).
30 Spezzati, G. et al. CO oxidation by Pd supported on CeO2(100) and CeO2(111) facets. Appl. 10 Catal. B 243, 36-46 (2018).
31 Boronin, A. et al. Investigation of palladium interaction with cerium oxide and its state in
catalysts for low-temperature CO oxidation. Catal. today 144, 201-211 (2009).
32 Dessal, C. et al. Dynamics of Single Pt Atoms on Alumina during CO Oxidation Monitored by
Operando X-ray and Infrared Spectroscopies. ACS Catal. 9, 5752-5759 (2019). 15 33 Cargnello, M. et al. Control of Metal Nanocrystal Size Reveals Metal-Support Interface Role for
Ceria Catalysts. Science 341, 771-773 (2013).
34 Jeong, H., Bae, J., Han, J. W. & Lee, H. Promoting Effects of Hydrothermal Treatment on the
Activity and Durability of Pd/CeO2 Catalysts for CO Oxidation. ACS Catal. 7, 7097-7105 (2017).
35 Hu, Z. et al. Effect of Ceria Crystal Plane on the Physicochemical and Catalytic Properties of 20 Pd/Ceria for CO and Propane Oxidation. ACS Catal. 6, 2265-2279 (2016).
36 Jeong, H. et al. Highly durable metal ensemble catalysts with full dispersion for automotive
applications beyond single-atom catalysts. Nat. Catal. 3, 368-375 (2020).
37 Liu, X. et al. Low-temperature catalytic oxidation of CO over highly active mesoporous
Pd/CeO2–ZrO2–Al2O3 catalyst. RSC Adv. 6, 41181-41188 (2016). 25 38 Slavinskaya, E. M. et al. Metal–support interaction in Pd/CeO2 model catalysts for CO oxidation:
from pulsed laser-ablated nanoparticles to highly active state of the catalyst. Catal. Sci. Technol.
6, 6650-6666 (2016).
39 Lee, A. F., Hackett, S. F. J., Hargreaves, J. S. J. & Wilson, K. On the active site in
heterogeneous palladium selox catalysts. Green Chem. 8, 549-555 (2006). 30 40 Wu, Z., Li, M. & Overbury, S. H. On the structure dependence of CO oxidation over CeO2
nanocrystals with well-defined surface planes. J. Catal. 285, 61-73 (2012).
41 Liu, J.-X., Su, Y., Filot, I. A. W. & Hensen, E. J. M. A Linear Scaling Relation for CO Oxidation
on CeO2-Supported Pd. J. Am. Chem. Soc. 140, 4580-4587 (2018).
42 Ha, H., Yoon, S., An, K. & Kim, H. Y. Catalytic CO Oxidation over Au Nanoparticles Supported 35 on CeO2 Nanocrystals: Effect of the Au–CeO2 Interface. ACS Catal. 8, 11491-11501 (2018).
43 Liu, B. et al. Interfacial effects of CeO2-supported Pd nanorod in catalytic CO oxidation: a
theoretical study. J. Phys. Chem. C 119, 12923-12934 (2015).
44 Lohrenscheit, M. & Hess, C. Direct Evidence for the Participation of Oxygen Vacancies in the
Oxidation of Carbon Monoxide over Ceria‐Supported Gold Catalysts by using Operando 40 Raman Spectroscopy. ChemCatChem 8, 523-526 (2016).
45 Kopelent, R. et al. Catalytically Active and Spectator Ce3+ in Ceria‐Supported Metal Catalysts.
Angew. Chem. Int. Ed. 54, 8728-8731 (2015).
46 Sun, X. et al. FeOx supported single-atom Pd bifunctional catalyst for water gas shift reaction.
AIChE J 63, 4022-4031 (2017). 45 47 Luo, M.-F., Hou, Z.-Y., Yuan, X.-X. & Zheng, X.-M. Characterization study of CeO2 supported
Pd catalyst for low-temperature carbon monoxide oxidation. Catal. Lett. 50, 205-209 (1998).
48 Lin, S., Yang, L., Yang, X. & Zhou, R. Redox properties and metal–support interaction of
Pd/Ce0.67Zr0.33O2–Al2O3 catalyst for CO, HC and NOx elimination. Appl. Surf. Sci. 305, 642-649
(2014). 50 49 Vedyagin, A. A. et al. Characterization of active sites of Pd/Al2O3 model catalysts with low Pd
content by luminescence, EPR and ethane hydrogenolysis. Appl. Catal. B 103, 397-403 (2011).
50 Wu, Z., Li, M., Howe, J., Meyer, H. M. & Overbury, S. H. Probing Defect Sites on CeO2
Nanocrystals with Well-Defined Surface Planes by Raman Spectroscopy and O2 Adsorption.
Langmuir 26, 16595-16606 (2010).
51 Filtschew, A., Hofmann, K. & Hess, C. Ceria and Its Defect Structure: New Insights from a
Combined Spectroscopic Approach. J. Phys. Chem. C 120, 6694-6703 (2016). 5 52 Schilling, C., Ganduglia-Pirovano, M. V. & Hess, C. Experimental and Theoretical Study on the
Nature of Adsorbed Oxygen Species on Shaped Ceria Nanoparticles. J. Phys. Chem. Lett. 9,
6593-6598 (2018).
53 Narula, C. K., Allard, L. F., Moses-DeBusk, M., Stocks, G. M. & Wu, Z. Single Pd Atoms on θ-
Al2O3 (010) Surface do not Catalyze NO Oxidation. Sci. Rep. 7, 560 (2017). 10 54 Rehr, J. J., Albers, R. C. & Zabinsky, S. I. High-order multiple-scattering calculations of x-ray-
absorption fine structure. Phys. Rev. Lett. 69, 3397-3400 (1992).
55 Hutter, J., Iannuzzi, M., Schiffmann, F. & VandeVondele, J. cp2k: atomistic simulations of
condensed matter systems. WIREs Comput. Mol. Sci. 4, 15-25 (2014).
56 Perdew, J. P., Burke, K. & Ernzerhof, M. Generalized Gradient Approximation Made Simple. 15 Phys. Rev. Lett. 77, 3865-3868 (1996).
57 Perdew, J. P., Burke, K. & Ernzerhof, M. Generalized Gradient Approximation Made Simple.
Phys. Rev. Lett. 78, 1396 (1997).
58 Grimme, S. Supramolecular Binding Thermodynamics by Dispersion-Corrected Density
Functional Theory. Chem. Eur. J. 18, 9955-9964 (2012). 20 59 Goedecker, S., Teter, M. & Hutter, J. Separable dual-space Gaussian pseudopotentials. Phys.
Rev. B 54, 1703-1710 (1996).
60 VandeVondele, J. et al. Quickstep: Fast and accurate density functional calculations using a
mixed Gaussian and plane waves approach. Comput. Phys. Commun. 167, 103-128 (2005).
61 VandeVondele, J. & Hutter, J. Gaussian basis sets for accurate calculations on molecular 25 systems in gas and condensed phases. J. Chem. Phys. 127, 114105 (2007).
62 Lu, J.-B. et al. Norm-Conserving Pseudopotentials and Basis Sets To Explore Lanthanide
Chemistry in Complex Environments. J. Chem. Theory Comput. 15, 5987-5997 (2019).
63 Dudarev, S. L., Botton, G. A., Savrasov, S. Y., Humphreys, C. J. & Sutton, A. P. Electron-energy-
loss spectra and the structural stability of nickel oxide: An LSDA+ U study. Phys. Rev. B 57, 30 1505-1509 (1998).

Supplementary Information
Are All Single Atoms Created Equal? Surface Density
Dependent Catalytic Activity of Single Pd Atoms
Supported on Ceria 5
Yongseon Kim1,||, Greg Collinge2,3,||, Mal-Soon Lee2,3, Konstantin Khivantsev3, Sung June
Cho4,*, Vassiliki-Alexandra Glezakou2,3, Roger Rousseau2,3,*, Janos Szanyi3,*, Ja Hun
Kwak1,*
1 Department of Chemical Engineering, Ulsan National Institute of Science and Technology 10
(UNIST), 50 UNIST-gil, Ulsan 44919, Republic of Korea
2 Physical and Computational Sciences Directorate and Institute for Integrated Catalysis,
Pacific Northwest National Laboratory, Richland, WA 99354, USA
3 Institute for Integrated Catalysis, Pacific Northwest National Laboratory, Richland, WA
99352 USA 15
4 Department of Chemical Engineering, Chonnam National University, 77 Yongbong-ro, Buk-
gu, Gwangju 61186, Republic of Korea
*Corresponding authors: [email protected], [email protected],
[email protected], [email protected] 20 || These authors contributed equally.

Figure S1. XRD pattern of synthesized CeO2. The CeO2 displays a fluorite cubic
structure.

Figure S2. N2 sorption isotherms for CeO2 (Closed circle: adsorption, Open circle:
desorption). Brunauer-Emmett-Teller (BET) surface area is 14 m2 g-1.
5

Figure S3. (a) SEM and (b) TEM image of CeO2. The morphology of CeO2
nanoparticles is predominantly cube shaped, exposing mostly (100) surface facets.
5
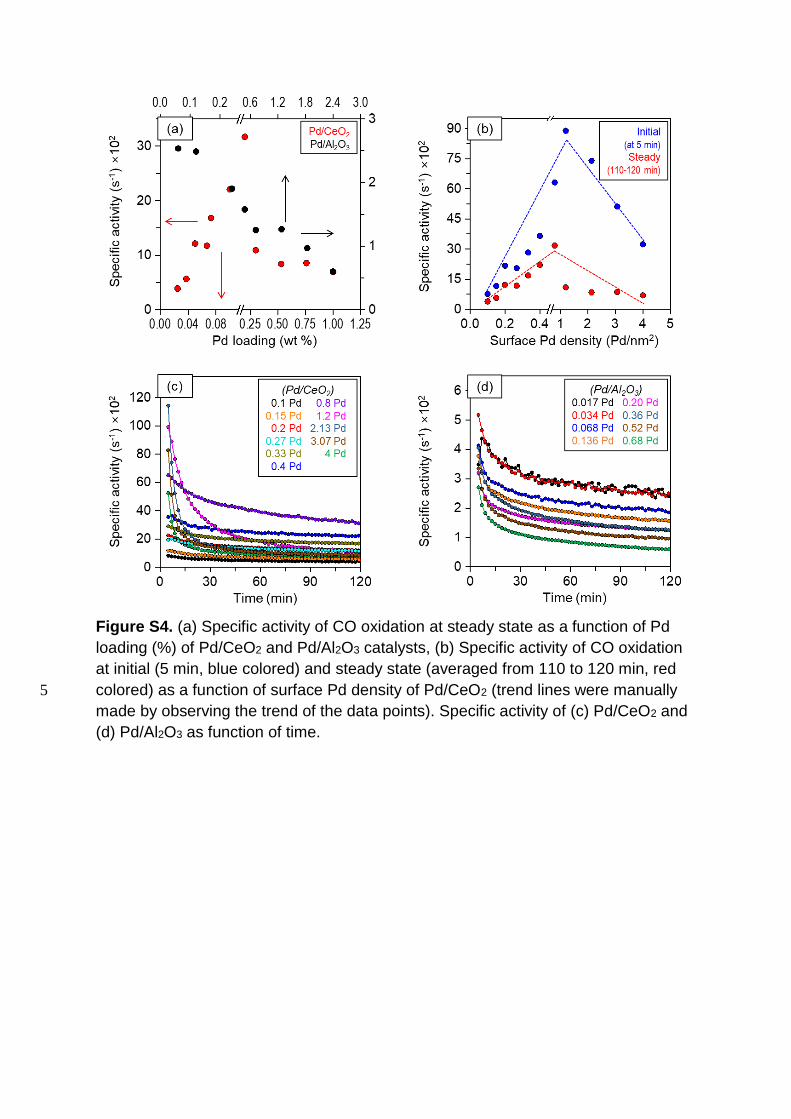
Figure S4. (a) Specific activity of CO oxidation at steady state as a function of Pd
loading (%) of Pd/CeO2 and Pd/Al2O3 catalysts, (b) Specific activity of CO oxidation
at initial (5 min, blue colored) and steady state (averaged from 110 to 120 min, red
colored) as a function of surface Pd density of Pd/CeO2 (trend lines were manually 5
made by observing the trend of the data points). Specific activity of (c) Pd/CeO2 and
(d) Pd/Al2O3 as function of time.
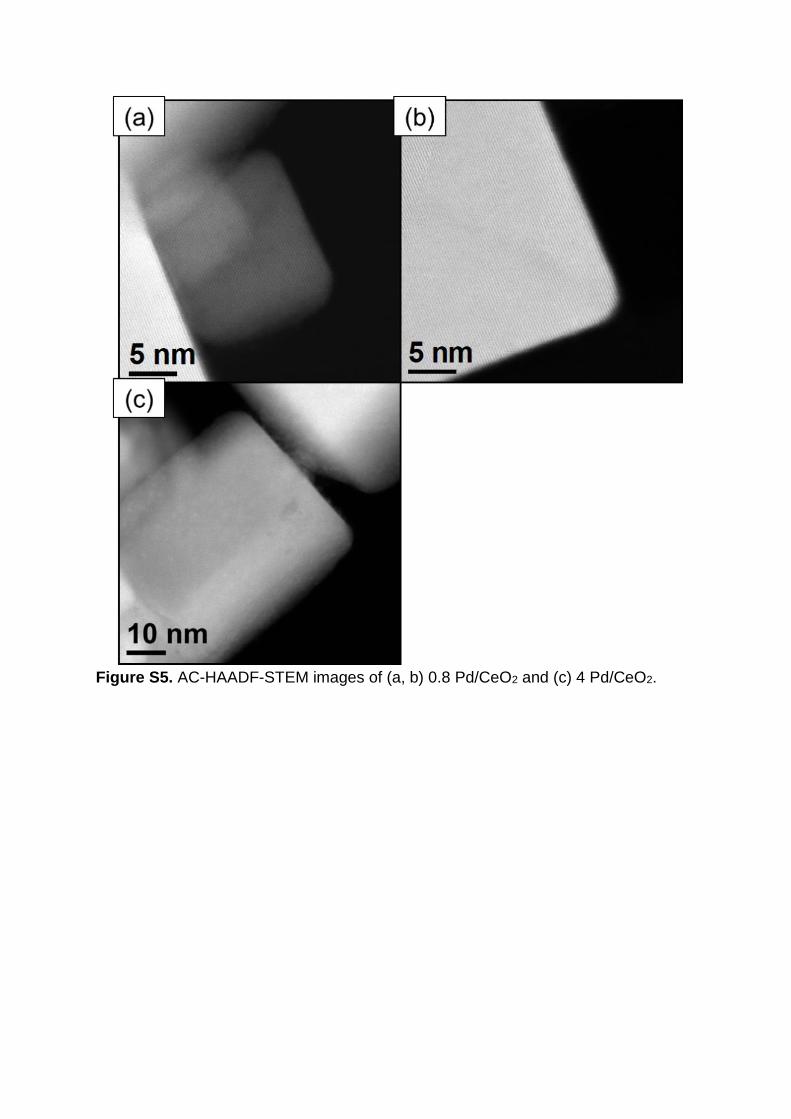
Figure S5. AC-HAADF-STEM images of (a, b) 0.8 Pd/CeO2 and (c) 4 Pd/CeO2.
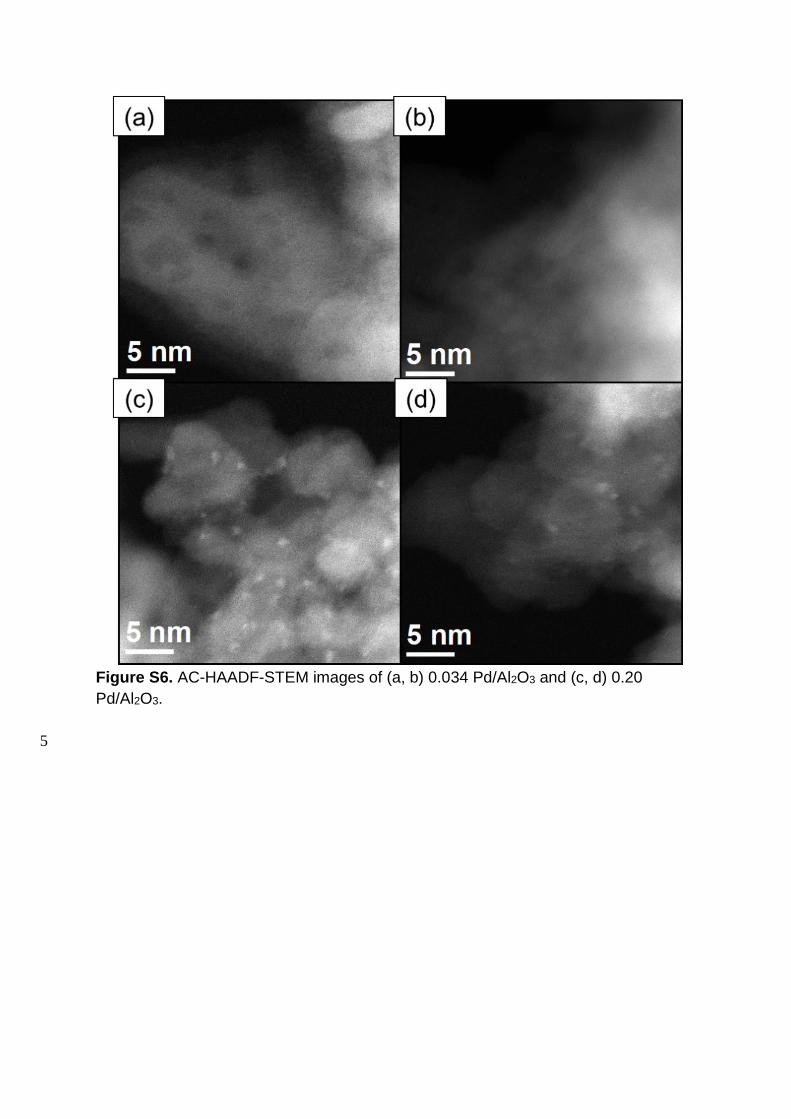
Figure S6. AC-HAADF-STEM images of (a, b) 0.034 Pd/Al2O3 and (c, d) 0.20
Pd/Al2O3.
5
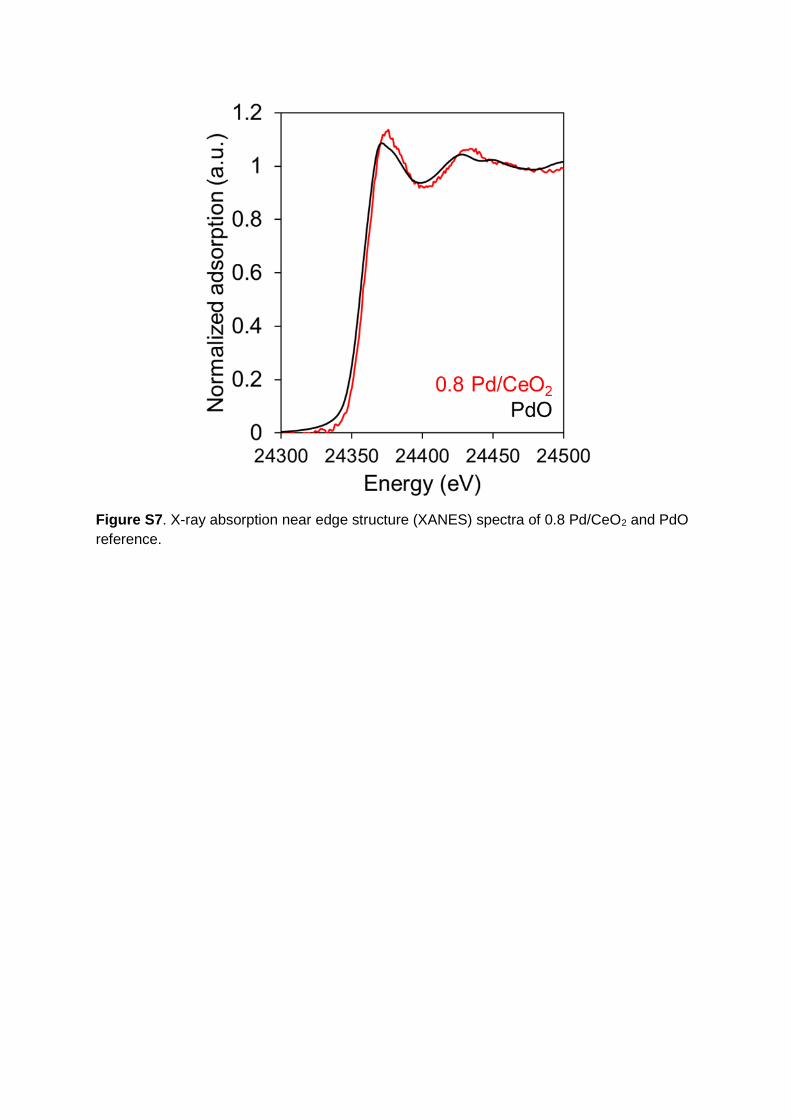
Figure S7. X-ray absorption near edge structure (XANES) spectra of 0.8 Pd/CeO2 and PdO
reference.
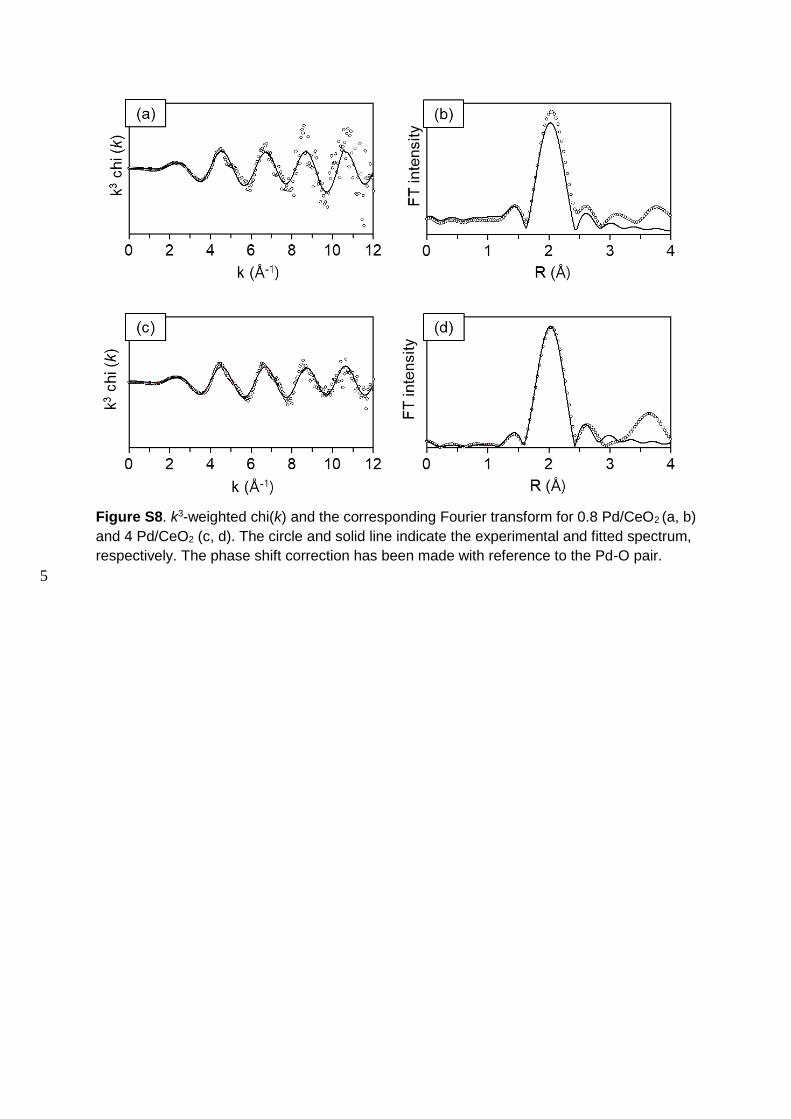
Figure S8. k3-weighted chi(k) and the corresponding Fourier transform for 0.8 Pd/CeO2 (a, b)
and 4 Pd/CeO2 (c, d). The circle and solid line indicate the experimental and fitted spectrum,
respectively. The phase shift correction has been made with reference to the Pd-O pair.
5

Figure S9. Contribution of CeO2 reduction during H2-TPR and specific activity of
Pd/CeO2 as function of surface Pd density.

Figure S10. In-situ Raman spectra of 0.2, 0.4 and 4 Pd/CeO2 after pre-treatment.
The spectra were obtained at room temperature and under He flow. Raman intensity
was normalized with intensity of F2g (450-470 cm-1) band.
5

Figure S11. In-situ IR spectra of 0.2, 0.4 and 4 Pd/CeO2. The spectra were obtained
during absorbing CO on oxidized catalysts.

Figure S12. (a) DFT surface energy of the Pd1/CeO2(100) model, seen in the first panel of
(b), as a function of the number of additional O atoms adsorbed to the surface at nearby Ce
bridge sites. (b) Minimum energy O adsorption configuration for each O atom addition.
Green and red atoms are Ce and O of CeO2, respectively; brown and magenta atoms are Pd 5
and O of (PdOx)1.
In Figure S12, we computed the 0 K DFT surface energy defined as:
Esurf[NO] = E(PdOx)/CeO2(100)[NO] − EPd CeO2(100)⁄ [0] − NO (
1
2EO2(g)) (S1)
where EPd/CeO2(100)[NO] is the total DFT energy of the (6×6) Pd/CeO2(100) supercell with
NO additional oxygen adatoms present, and EO2(g) is the DFT calculated energy of an O2 10
molecule in the gas phase. The slopes connecting the lowest Esurf[NO] to the lowest
Esurf[NO − 1] provides an estimate of the chemical potential to create the structure
corresponding to Esurf[NO]. To be stable, the states thus connected must have a positive
curvature (i.e. constantly increasing slope), which is not the case for any of the points at
Esurf[1]. This results in a very large negative (0 K) chemical potential (~ -95 kJ/mol/O) for the 15
minimum energy structure at Esurf[2] with the minimum energy structure at Esurf[3] only
accessible when the (0 K) chemical potential increases to ~ +63 kJ/mol, a greater than 150
kJ/mol/O difference. Therefore, if a relatively modest partial pressure of O2 is applied so as
to accomplish any O adsorption, which is almost certainly the case during catalyst synthesis,
only the (PdO2)1 structure (shown in the third panel of Figure S12b) will be stable. The other 20
structures at NO = 2, where the second O adsorbs in nearby Ce-Ce bridge sites, are too
high in energy compared to the minimum energy structure to be stably formed. As noted, a
large increase in the applied chemical potential is required to access the minimum energy
structure at Esurf[3]. This strongly suggests that the active sites in Pd/CeO2(100) are (PdO2)1
units, and so this structure was chosen for continued analysis. 25

Figure S13. Bader charge calibrations for (a) Pd and (b) Ce. Each data point represents a
metal-hydroxide, metal-oxo, or mixed metal oxo/hydroxide complex with a known formal
charge. Bader charges were then assessed using the computational methods employed in
the rest of the work. 5
To assess the charge state of the active site, we performed a Bader-partitioning of both
the electron and spin density of the (PdO2)1/CeO2(100) system. The electron density Bader
charges of Pd and Ce were additionally calibrated against known metal complexes’ oxidation
states (see Figure S13) to permit the assignment of formal charges. By then comparing, in
aggregate, computed formal charges with the spin density Bader charges (see Table S1), 10
we can accurately infer the charge state of each atom in our system. Using this method, we
are able to determine Pd to be in an overoxidized >+2 state. This overoxidation occurs due
to the presence of the two additional O atoms forming (PdO2)1. As shown schematically in
Figure S13, to balance a Pd2+, these two O atoms (which will become O1 and O2 in Figure
4a of the main text upon adsorption) would need to be O1- radicals, which is a very 15
unfavorable electron configuration. This unfavorability is alleviated, to a degree, by
abstracting charge from the two adjacent O atoms of the CeO2(100) surface (O3 and O4 in
Figure 4a of the main text), but this can only bring each O atom (O1 through O4) to a formal
-1.5 charge state. To further alleviate their unfavorable electron configurations, the four O
atoms, overoxidize Pd past +2—producing a computed +2.58 Pd oxidation state—to achieve 20
-1.65 O charge states in the final structure. Spin density Bader charges confirm the
undersaturation of O atoms as each O atom has a clear non-zero net unpaired electron
density (see Table S1). The spin bader charge on Pd is computed to be zero, but visual
inspection of the spin density around Pd (Figure 4b of the main text) shows two d-orbital
lobes both clearly containing net unpaired electron density but with opposite spins, leading to 5
the overall net zero unpaired charge that we have computed in Table S1. Thus, we have
confidence in the assignment of > +2 for Pd based on the Bader partitioning of electron
density and Bader calibration curve shown in Figure S13.
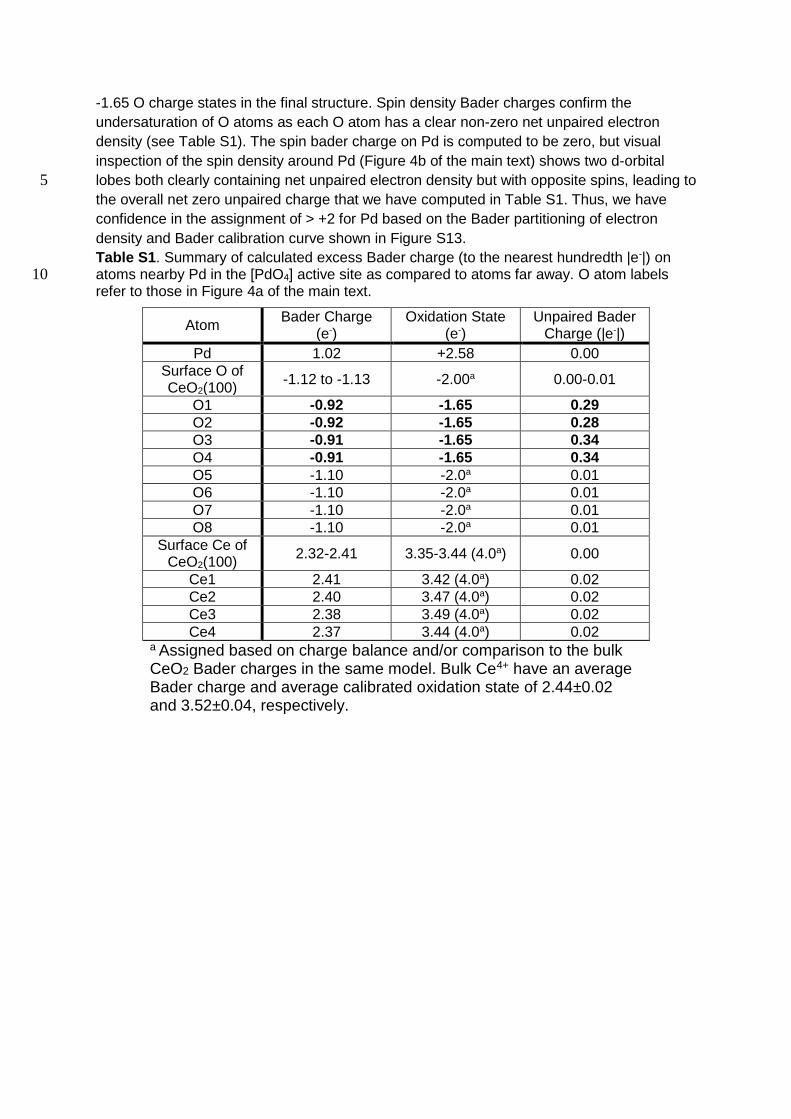
Table S1. Summary of calculated excess Bader charge (to the nearest hundredth |e-|) on atoms nearby Pd in the [PdO4] active site as compared to atoms far away. O atom labels 10 refer to those in Figure 4a of the main text.
Atom Bader Charge
(e-) Oxidation State
(e-) Unpaired Bader
Charge (|e-|)
Pd 1.02 +2.58 0.00
Surface O of CeO2(100)
-1.12 to -1.13 -2.00a 0.00-0.01
O1 -0.92 -1.65 0.29
O2 -0.92 -1.65 0.28
O3 -0.91 -1.65 0.34
O4 -0.91 -1.65 0.34
O5 -1.10 -2.0a 0.01
O6 -1.10 -2.0a 0.01
O7 -1.10 -2.0a 0.01
O8 -1.10 -2.0a 0.01
Surface Ce of CeO2(100)
2.32-2.41 3.35-3.44 (4.0a) 0.00
Ce1 2.41 3.42 (4.0a) 0.02
Ce2 2.40 3.47 (4.0a) 0.02
Ce3 2.38 3.49 (4.0a) 0.02
Ce4 2.37 3.44 (4.0a) 0.02 a Assigned based on charge balance and/or comparison to the bulk CeO2 Bader charges in the same model. Bulk Ce4+ have an average Bader charge and average calibrated oxidation state of 2.44±0.02 and 3.52±0.04, respectively.
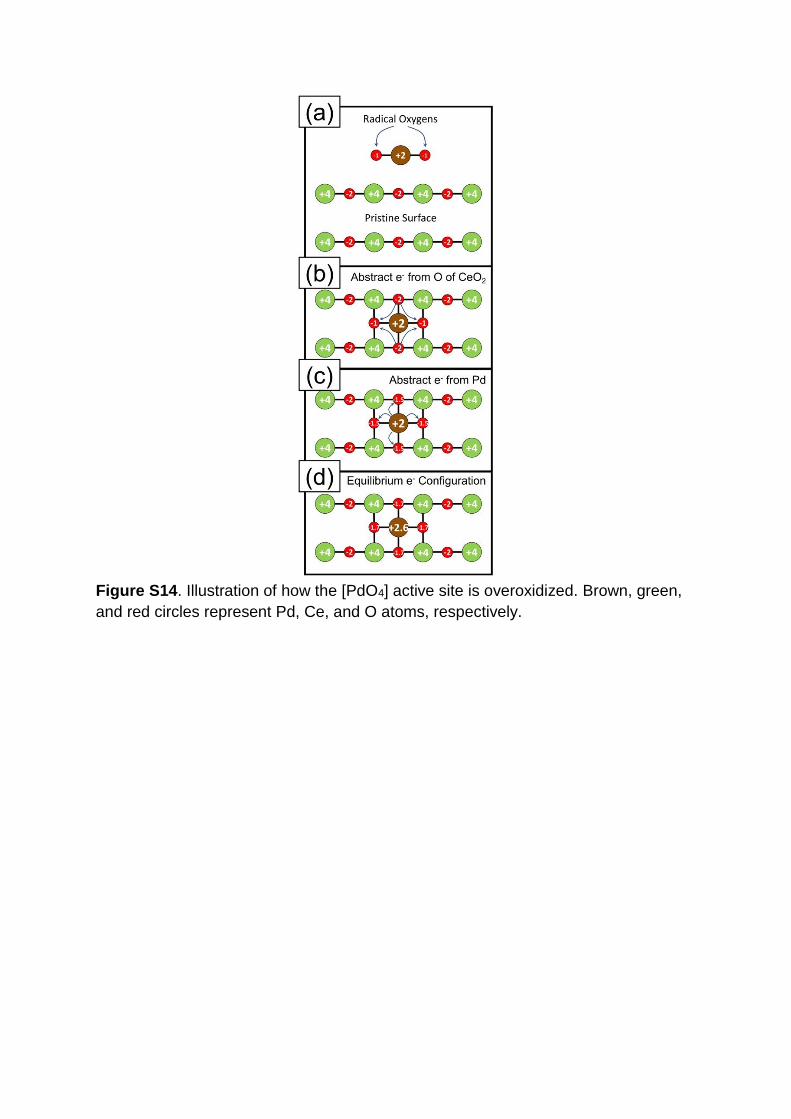
Figure S14. Illustration of how the [PdO4] active site is overoxidized. Brown, green,
and red circles represent Pd, Ce, and O atoms, respectively.

Figure S15. Spin density plots of the (PdO2)1/CeO2(100) system showing the chemical
similarity and distribution of active sites in each model constructed to produce surface Pd
densities of (a) 0.19, (b) 0.38, (c) 0.76, and (d) 1.13 Pd/nm2. Spin up and spin down density
contours are shown in purple and blue shading, respectively. The relative size of each atom 5
has been reduced to aid the eye, but the color scheme is identical to that used in Figure S12
(isosurface level = 0.04 |e-|/Bohr3, which is approximately 1/5 the maximum spin density)

Figure S16. (a) Percent distribution of excess charge left behind after reduction of
the O atom occupying O3 site. (b) – (e) A schematic showing where charge was
found to be localized (purple clouds; darker purple = more electron density) at
surface Pd densities of (b) 0.19 Pd/nm2, (c) 0.38 Pd/nm2, (d) 0.76 Pd/nm2, and (e) 5
1.13 Pd/nm2. Brown, green, and red circles represent Pd, Ce, and O atoms,
respectively.

Figure S17. (a) Percent distribution of excess charge left behind after reduction of
the O atom occupying O site 4. (b) – (e) A schematic showing where charge was
found to be localized (purple clouds; darker purple = more electron density) at
surface Pd densities of (b) 0.19 Pd/nm2, (c) 0.38 Pd/nm2, (d) 0.76 Pd/nm2, and (e) 5
1.13 Pd/nm2. Brown, green, and red circles represent Pd, Ce, and O atoms,
respectively.

Figure S18. a) Percent distribution of excess charge left behind after reduction of the
O atom occupying O site 5. (b) – (e) A schematic showing where charge was found
to be localized (purple clouds; darker purple = more electron density) at surface Pd
densities of (b) 0.19 Pd/nm2, (c) 0.38 Pd/nm2, (d) 0.76 Pd/nm2, and (e) 1.13 Pd/nm2. 5
Brown, green, and red circles represent Pd, Ce, and O atoms, respectively.

Figure S19. (a) Computed work functions () for the Pd-doped CeO2(100) surface
with (red line) and without (green line) O vacancies as a function of surface Pd
density. Here, the O atom labeled O3 in Figure 5 of the main text was removed to
form the O vacancy. (b) Work function change () as a result of forming this O 5
vacancy. (c) Work function change plotted against the corresponding OFVE,
showing excellent correlation between the two quantities. Note that the OVFE has
been plotted in units of eV/O to more closely match the units of the work function.
10

Figure S20. (a) total OVFE (extensive property) as a function of the number of O
atoms removed from the 1.13 Pd/nm2 model. (b) 1.13 Pd/nm2 model after exothermic
removal of 4 O total O atoms. Color scheme is identical to that used in Figure S12.
5
In Figure S20, we computed the total OVFE as:
EOVF,tot[NO] = Etotal[NO] − Etotal[0] + NO (1
2EO2(g)) (S2)
where Etotal[NO] is the total DFT energy of the (6×6) Pd/CeO2(100) supercell wherein NO
oxygen atoms have been removed, and EO2(g) is the DFT calculated energy of an O2
molecule in the gas phase.
10
Recommended