Arctic-HYCOS
3rd Project Steering Committee Meeting
Anchorage, Alaska, USA, May 24 – 26, 2016 U.S. Geological Survey Alaska Science Center
FINAL REPORT

i
Contents 1. Introduction and Welcome .................................................................................................................... i
2. Meeting objectives and adoption of agenda ........................................................................................ 2
3. Review of Work Plan Progress April 2015-March 2016 ........................................................................ 4
3.1. Projects 1 and 2: Network Design for “Flow to Ocean” and “Representative of Hydrological
Regime” Databases ................................................................................................................................... 4
3.1.1. Network update by country .................................................................................................. 4
3.1.2. Finalized list of flow to ocean stations (Richard Lammers) ................................................ 14
3.2. Project 3: Interim Arctic-HYCOS Database .................................................................................. 17
3.3. Update on Arctic-HYCOS website ............................................................................................... 20
3.4. Project 4: WHOS and WaterML2.0 Standard Prototype ............................................................. 21
3.5. Project 5: Under Ice Operational Practices and Procedures....................................................... 28
3.6. Project 6: Reporting of Arctic-HYCOS Activities .......................................................................... 29
3.7. Project 7: Arctic-HYPE – Application of Hydrological Modelling and Prediction ........................ 33
3.8. Project 8: Water Temperature Data ........................................................................................... 38
3.9. Project 9: River/Lake Ice ............................................................................................................. 42
4. Overview of SWOT Satellite ................................................................................................................ 43
5. Development of Annual Work Plan 2016-2017 .................................................................................. 44
6. Closing Remarks and Next Meeting .................................................................................................... 44
7. Field trip to operational streamflow station ....................................................................................... 44
Annex 1: Arctic-HYCOS Membership .......................................................................................................... 49
Annex II: Meeting Agenda ........................................................................................................................... 55
Annex III: Arctic-HYCOS Work Plan 2016 - 2017 ......................................................................................... 58
Annex IV: Documents for circulation .......................................................................................................... 65
Title page photo of the 2016 Project Steering Committee in Anchorage, Alaska, May 2016, and all photos
in this report, are provided by Gillian Walker. For more photos see: https://flic.kr/s/aHskBkdrWF
This report and related documents are available for download on the WMO website at: http://www.whycos.org/whycos/projects/under-implementation/arctic-hycos
The direct link to this report is: http://www.whycos.org/whycos/documents/Arctic-HYCOS_Meeting_May_2016_FINAL_REPORT.pdf

1
1. Introduction and Welcome
The 3rd annual meeting of the Project Steering Committee (the Committee) for the Arctic Hydrological
Cycle Observing System (Arctic-HYCOS) was held May 24 and 25, 2016 at the U.S. Geological Survey
Alaska Science Centre in Anchorage, Alaska, followed by a field trip to two United States Geological
Survey (USGS) Arctic-HYCOS hydrometric stations on May 26. The list of participants can be found in
Annex I: Arctic-HYCOS Membership.
Jeff Conaway, the American Arctic-HYCOS representative, warmly welcomed participants to Alaska and
to Anchorage to open the meeting. Jeff showed the Committee a map of the State, pointing out our
location and the terrestrial and hydrological connections between Alaska, Canada and the Arctic Ocean.
Jeff’s well-rounded knowledge of Alaskan geography and culture proved to answer many questions over
the duration of the meetings.
Al Pietroniro (representative from Canada) also welcomed the committee members to the meeting, and
provided a summary of the purpose for the following two-day meeting. He said that this particular
HYCOS project is not a traditional one, as it is not a development project. However, the past three years
of steering committee meetings have confirmed that most of the Arctic Council countries have been
operating hydrometric stations and establishing networks that fit within a HYCOS project. Al suggested
that this should be a working meeting; not just consisting of presentations by member countries. From a
WMO perspective there are a few big things coming up this year – the Executive Council meeting in
June, the Commission for Hydrology (CHy) meeting scheduled for December 7-13, 2016 in Rome, Italy
(the WMO Secretariat had recently confirmed), and also a women’s leadership workshop proceeding the
CHy-15 meeting on December 5th and 6th. Al suggested that the progress on Arctic-HYCOS could be
presented at CHy-15. The Committee’s mandate came from WMO 4 years ago and we need to decide
together how we will continue, how much more modelling we want to do, and if we want to expand to
other data (i.e. water temperature). The next step for this meeting is to look at what was done in the
past year, and what is outstanding.
Figure 1: Major Pan-Arctic Drainage Basins (Lammers, 2012).

2
2. Meeting objectives and adoption of agenda
Al Pietroniro recalled the outcomes of previous steering committee meetings. In Halifax in 2012, the
inaugural meeting, the formal Arctic-HYCOS committee was proposed, and the initial steps to setting up
a database were taken. “Stakeholder requirements” were discussed at the Halifax meeting, but the
Committee didn’t follow up on it at subsequent meetings. Al indicated that the data collection side has
advanced faster than other aspects of the project. We currently have five main projects – network
design, flow to ocean stations (established in Geneva in 2014), hydrological regime stations (a lot of this
is done), review of operational processes (to discuss at this meeting), exchange of data (also to be
discussed), and modelling (a lot was done for the meeting in Iceland in 2015).
At the Committee meeting in Iceland in 2015, a few major items were addressed:
- Deliverables and milestones: finalized station lists, moved things forward on the Global Runoff
Data Centre (GRDC) side, agreed that all data would be freely available to download by the
public, and discussed the WaterML2.0 standard.
- Operational practices were updated
- Started thinking about water temperature data, a non-standard product for most countries
currently.
Al addressed a few ideas on what is next for the Arctic-HYCOS project:
- River temperature,
- methods paper,
- HYPE and ungauged basins,
- Real-time data (in Canada the Hydrometric Program is moving everything to real time and
publishing both water level and flow),
- Should HYCOS contribute to the Surface Water Ocean Topography (SWOT) project? It could
provide water level slope which can be very useful, especially for northern remote areas in the
summer, but won’t replace hydrometric gauges as there are too many degrees of freedom.
o John Fulton: For USGS ST, collaboration with HYCOS is a priority by incorporating high-
latitude hydraulic and channel data in the HYDRoSWOT database. See:
https://www.sciencebase.gov/catalog/item/57435ae5e4b07e28b660af55.
- Precipitation analysis (real-time analysis in Canada and the US uses observations assimilated
into forecasts to create a precipitation product – especially for remote areas),
- runoff ratios for some rivers,
- One thing we could do is publish a total, official number of the total flow to Arctic Ocean.
Additionally, the Arctic Hydra initiative was suggested at the 2012 Halifax meeting, but didn’t
really go forward – maybe it is time for the Committee to revisit the idea.
Al stated that there are two things you need to know in hydrology – how much flow there is, and the
amount of precipitation. You can do a lot after you have those two things. When dealing with northern
basins, not all the regular concepts apply – for example, do runoff ratios make sense? Maybe only
annually, or for 5 year periods? In non-contributing areas (wetlands, Canadian Prairies) and glacial areas,

3
precipitation never shows up in the rivers. There are some things we just don’t understand in Northern
Basins, even for basic Q=CIA models.
In conclusion, Al’s comments were meant to stimulate the Committee’s ideas for what we need to tackle
in the work plan for next year. Al invited all participants to add their thoughts and ideas throughout the
meeting. He said our motivation here is to show the value of the HYCOS framework, and focus on the
Arctic to clear up misunderstandings of how Arctic basins operate.
Next, Paul Pilon, Chief of hydrological Forecasting and Water Resources for the WMO, addressed the
future direction of the Arctic-HYCOS. He indicated that the project is basically what we want to make it –
it could focus on flow to the ocean, it could include precipitation and temperature data, ice thickness,
whatever is important to understand hydrology. The options are totally open – it is up to this Committee
to decide. The reports from the meetings are important to reflect what is discussed, but each year we
have a chance to correct or adjust the work plan.
Paul continued that water temperature, precipitation, and ice thickness are harder to measure under
harsh environmental conditions of the Arctic region, and are a very different undertaking to warm
climate measurements. This is an opportunity to have all the developed countries in the northern
hemisphere describe how they are doing these measurements and to develop recommended practices
and procedures for use by all Members. WMO should be a communal resting place for those
procedures. There is very little literature on how programs are measuring, for example, ice thickness,
and how the programs were set up or should be established. And for modelling, how far can we go for
ungauged basins? Do we even want to get into forecasting for ungauged areas, in addition to gauged
areas? Paul would like to see the Committee build a work plan to address these key areas.
Following this there was some discussion about how ice thickness is measured in Canada and the USA,
for example. It was decided that ice thickness data and measurement, and possible new standards or
recommended practices and procedures for its measurement along with metadata, should be discussed
by the Committee. It was highlighted that this discussion should continue as part of Day 2 of the
meeting agenda.
Valery Vuglinsky, the Russian representative, also raised that metadata for flow to ocean stations needs
to be discussed. He said that there are still many questions about which kinds of metadata we need, and
indicated that it will be useful for modelling. Paul Pilon, using the example provided by Silvano Pecora
on WaterML2.0 at the last meeting of the Committee where he used pizza delivery to demonstrate
water data delivery, said that metadata is like toppings on the pizza – if a member of the public orders a
pizza, they want to decide on the type of pizza based on the toppings they will get on it. The US GAUGES
program (Geospatial attributes of Gages for Evaluating Streamflow) allows you to decide what the
characteristics of the data are, for example, if it is a pristine or regulated basin. In essence, the toppings
can be viewed as the basin characteristics you want the data to reflect, instead of having to order ALL
the pizzas (stations’ data), pay for them, and still maybe not get what you want and not be able to sort
the sites to reflect the appropriate characteristics. This applies to both the WaterML2.0 standard and
the metadata sides. This discussion was already on the agenda for Day 2, but was highlighted as an
4
important conversation. It was also suggested that someone from the USGS attend this meeting or a
future one to explain the Gauges program to the Committee.
Finally, Al Pietroniro concluded with the fact that the most important thing to get done is the work plan
for next year.
Following this, the agenda for the 2016 meeting was adopted and is contained in Annex II: Meeting
Agenda:
- The purpose of Day 1 is to assess progress on the Annual Work Plan 2015-2016 and to address
issues/questions on data acquisition and exchange.
- The purpose of Day 2 is to continue assessing progress on the Work Plan 2015-2016 and develop
the Work Plan for April 2016-March 2017.
- For the previous meeting notes and work plan, please refer to the Final Report of the Arctic-
HYCOS Project Steering Committee Meeting, held in Reykjavik, Iceland, 23-24 March 2015.
3. Review of Work Plan Progress April 2015-March 2016
3.1. Projects 1 and 2: Network Design for “Flow to Ocean” and “Representative
of Hydrological Regime” Databases
3.1.1. Network update by country
Canada (Alain Pietroniro)
Al gave a presentation on the Water Survey of Canada (WSC), which is the federal component of
Canada’s National Hydrometric Program (NHP), run by the National Hydrologic Services (NHS) division of
Environment and Climate Change Canada. The presentation included a summary of the number of staff,
the Quality Management System (QMS) process used, images of various types of hydrometric stations
installed in Canada, and an explanation of the new “Datamart” used to push real-time hydrometric data
to users in a simple, easy to download format, supported 24/7. See Figure 2 for a map of all active
hydrometric stations in Canada as of spring 2016.
Al noted that Canada has one of the world’s largest rivers – the flow in the Mackenzie River has been
measured as high as 1 million cfs (28,000 cms). This is a huge amount of flow! The Mackenzie drains an
area of 1.7 million km2 (an area bigger than most European countries), with a population of only about
200,000 people. The Canadian Arctic archipelago is a difficult place to work – a lot of need for estimates
of flow in ungauged basins.
The Water Survey of Canada is ISO 9001 and QMS certified. The Canadian QMS case study, written in
cooperation with the WMO to describe the Canadian QMS, was posted on the website in late
September 2016. It can also be found by referring to the following QMF-F page and looking for the
"Checklist for developing a QMS for a NHS". This was driven by a request from the Fourteenth Session of

5
the Commission for Hydrology (CHy-14), with the CHy member responsible for it being Jean-Francois
Cantin (Canada). The idea was to take a look at what hydrological services around the world are doing
with respect to QMS, see if we can share processes, and put together a webpage so other countries can
adopt such processes. Case studies were developed as illustrations of efforts undertaken in QMS from
countries that have successfully received ISO certification and one that had extensive QMS processes in
place but has not sought certification. The webpage would include a checklist of how to achieve a
mature QMS or, if desired, be compliant with ISO processes. Ted Yuzyk, a former Canadian director of
NHS, lead this effort. Four countries were involved: Canada, Czech Republic, New Zealand, and the
United States of America (USA). Case studies for each of these countries were developed and are
available on the website mentioned above. Canada contributed all of the Standard Operating
Procedures (SOPs) that are used as part of its ISO QMS process, with the intention that countries
embarking on QMS for their services could tailor the existing documentation to their needs.
Next Al presented an overview of the WSC workflow – how to get from water level measurements to
derived discharge.
- He said we use some assumptions but always have the ability to go back and make changes. One
area for improvement in the program is in the documentation of the revisions done to the data.
For example, if we went back and made changes to values, people with the data won’t receive a
notification or even know in the metadata that there were changes made. Having said that, we
do put a flag on these changes. Just not enough detail.
- Al highlighted that the Water Survey of Canada is moving to real-time data dissemination. The
idea is for all the technologists to have a “dashboard” in front of them every day, to flag issues
with the stations (i.e. water level jumps) – something that would help indicate when to go out
into the field.
- WSC doesn’t publish rating curve shifts. In the new real-time data environment, shifts should be
published immediately, as soon as the field measurements are taken. Then our partners, mainly
the Provinces and Territories who are using the data for flood forecasting, would have the shift
immediately. Canada is trying to move in that direction. This is not as big a deal in northern
flowing basins as there is not as much infrastructure to manage during possible floods.
- We have set up cameras on some of the Canadian hydrometric sites. Ice-on, ice-off is a problem
– things are easier if there is ice all season long. If ice is forming and melting, the stage is going
to jump up and down. Cameras are helpful for this. The resulting pictures are sent by satellite,
and also help the hydrometric technologist know if they need to take a measurement.
- Other new technologies being introduced in the Canadian program include SWOT (Surface
Water Ocean Topography – part of the “Water from Space” initiative), infrared technologies
(estimate surface velocity based on pictures), using cell phones and video to send in discharge
estimates automatically, and working on technology to measure surface velocities with surface
moving ice on rivers.
Al concluded the Canadian update by saying that there is constant pressure to keep costs down. We are
now a real-time nowcasting organization; the real time data constitute a prediction.

6
Figure 2: Active hydrometric stations in Canada, spring 2016
USA (Jeffrey Conaway)
Jeff Conaway, who oversees stream gauging for the USGS in Alaska, provided the network update for
the United States of America. He indicated that the USGS has moved away from publishing data by
water year, and have moved to providing real time data. Data within 120 days are flagged as Provisional
(P) and then corrections, such as removing false peaks (tidal backwater), are applied before the data are
flagged as Approved (A). Therefore versioning of the data is important – this system becomes a problem
when agencies pull the provisional data and then changes to them are made later. The USGS takes care
of the stations in Alaska as well as those that flow north from the continental US into Canada. Jeff has
worked with Richard Lammers to develop the map of active and historical stations – all delivered in real-
time (see Figure 3).
Jeff then spoke to the hydrology of the state of Alaska, indicating that it has more coastline than the rest
of “the lower 48” states combined, and many different streamflow regimes. Streamflow on the north
slopes of Alaska is often estimated (estimates of daily mean discharge), and on the north slopes the
USGS is doing 2-3 under-ice measurements per station per year. In Alaska you see the ice melt peak first,
then snowmelt peak, and the amount of ice-affected estimation required decreases as you go south.
Arctic hydrology is a new focus in Alaska. President Obama visited last year, and in seeing the Exit
Glacier, said it was one of his best days of his presidency! There is not a lot of new money directed
towards gauges, but there is some new funding for remote sensing for streamflow. There is a new USGS
land surface model, which can be used to determine water surface elevation from Landsat imagery. It is
built using overlapping satellite passes and a gauge nearby and can simulate discharge. This product has
an accuracy of 3.4 cm in the open ocean, so for large rivers with enough slope, this works and can
supplement the stream gauging network (see further discussion of pressure transducers and satellite
imagery below). Jeff described an example of changes in streamflow with a warming climate in Alaska:
there is only one road that leads to the north slope of Alaska (Haul road), and a river parallels it. They

7
are progressively seeing more and more flow under the ice – record for under-ice streamflows. This is
probably due to an increase in the active layer and therefore groundwater contributions. This creates an
aufice field next to the highway. In 2015, the road required $15 million in repairs, and all fuel and
machinery had to be flown into the North Slope, which created an economic impact. This has led to a lot
of attention on winter streamflow in Alaska.
A short discussion on satellite imagery and pressure transducers followed from Jeff’s presentation. Al
Pietroniro then said that Canada is also using some pressure transducers, and that maybe we need to
set up some specifications for those as well. This could be useful from a HYCOS perspective. Al
suggested the Committee ask John Fulton about specifications for Canadian pressure transducers, who
will join the meeting via teleconference on Day 2. David Gustafsson mentioned that the Sentinel 3
satellite is already flying, and providing similar type of data. No Arctic test cases have been published at
the moment. Al also noted that as we cannot afford to place pressure transducers in all the lakes in
Canada (over 5 million!), or in Alaska (probably 1 million), therefore there is value in using satellite
altimetry for long-term tracking. He also mentioned that there is a lake database hosted by Russia
(International Data Centre on the Hydrology of Lakes and Reservoirs, HYDROLARE) that has potential.
The Arctic Freshwater Synthesis published last year by Dr. Terry Prowse and colleagues was mentioned
as a good source for Arctic hydrology. In it the authors proposed to extend the arctic basin to include
more regions from which streamflow has an impact on the Arctic – 90% of Arctic region discharge is
generated by portions of the river basins located south of the Arctic region.
Figure 3: USGS HYCOS Stations, September 2016. Source: https://www.arcgis.com/home/webmap/viewer.html?webmap=bd417f142a974759b152fd1727ff8582&extent=-180,38.1346,-78.0689,71.9109

8
Iceland (Gunnar Sigurðsson)
Gunnar Sigurðsson attended this year’s Arctic-HYCOS meeting on behalf of Jórunn Harðardóttir, and
presented this update on Iceland’s hydrological monitoring system. He stated that the hydrometric
network currently has 120 active hydrometric stations, 80 with discharge, 31 water level stations in
lakes and rivers, 28 flood measurement stations, and a few groundwater stations (9). There are also 17
“zero stations”, or stations with no service, where the stations are kept running but there is no data
processing, few visits, and few or no discharge measurements taken. Data from zero stations are not
published (known elsewhere are “moth balled” stations). All stations measure water level, 46 measure
water temperature, 25 measure electrical conductivity, and some stations measure air temperature or
include pressure sensors. In addition, samples of suspended sediment are taken at about 20 stations.
For surface water temperature sites, 43 of them are on rivers, only a few on lakes, and some stations are
on the same river. There are no ice-thickness measurements being taken in Iceland.
Unchecked data from most stations are shown visually on IMO homepage whereas data-download of
raw data is not yet available. Processed data are available upon request to IMO although IMO must seek
permission from the corresponding data owner before data delivery. Some data are already in the
HYCOS database.
An extensive part of the hydrometric network is operated for hydropower utilization, some to monitor
natural hazards (glacial floods, geothermal activity and subglacial eruptions, rain and snowmelt floods),
others for basic environmental monitoring of rivers, lakes, glaciers and groundwater as well as to
provide hydrological information for projects like new infrastructure development. Iceland’s station
classification system categorizes a station as part of a larger (32) or smaller (28) catchment, as
comparative stations (35), operational stations for hydropower or flood warning (27), or as research
stations (1). Figure 4 shows the present-day hydrometric network, where the dark blue dots are water
balance stations (data series longer than 20 years and catchment area larger than 500 km²) and the
orange dots are area stations (data series longer than 20 years, unregulated, catchment area less than
500 km²).
Figure 4: Present-day hydrometric network, Iceland

9
The normal governmental funding has decreased by about 35% since 2008, which, in addition to a
decrease in external funding, has caused drastic reduction of the hydrometric system and related
measurements. The financial cutbacks are displayed in fewer stations, and increased number of “0
stations“. Revision of the hydrometric network is now in the final phase where all hydrometric stations
from IMO and others are analyzed and graded based on 1) length of time series; 2) the type of the
watershed (size, glacial, direct runoff, groundwater fed, etc.; 3) quality of the data; 4) operational costs;
5) main utilization of data (water management; flood stations, research…). The stations ranked the
highest in this exercise are candidates for the future hydrometric system although there are some
subjective decisions to be made during the last step. A summary report introducing the proposed future
hydrometric network of Iceland will be available in spring 2017.
Other recent developments for the network include:
- More GPRS-connected stations can now send data every 5 minutes.
- Recently, webcams have been installed on three Icelandic stations. Staff has tried to use them to
monitor ice conditions, but the cameras are mostly for the flood-monitoring stations. There are
plans to install more cameras.
- Using Diver water-level sensors for remote and short-term stations. The Diver water-level
sensors are simple pressure sensors, with no cables etc., and are easy and low-cost installation.
- The present Master Plan for Nature Protection and Energy Utilization classifies some watersheds
as protected areas where hydropower development is forbidden. Hence, power companies have
withdrawn funding of stations in these watersheds.
- Processed data from the National Power Company are being collected.
- New definition for the future Icelandic hydrological monitoring system.
- IMO is preparing storage of discharge timeseries for the National Energy Authority, which they
collect from hydropower companies.
- Public versus private funding is about 50/50. It used to be more publicly funded, but power
companies are now moving towards their own systems. It is essential to constantly look for new
funding sources whether it is governmental or private. Although the funding of the hydrological
system has been decreasing, new technology provides new opportunities to minimize the
running cost of the system.
The proposed Arctic-HYCOS network in Iceland includes stations on the main rivers, with fair spatial and
type distribution, although the final decision awaits conclusions from the network review. Only four
stations were in the Arctic-HYCOS database last year, but now more have been added. All active HYCOS
stations have been sent to Richard Lammers for inclusion in the database, representing data from 20
discharge gauges on 19 rivers, with the shortest time series being 33 years, the longest 83 years, and an
average length of 50 years (see Error! Reference source not found.). The list of surface water
emperature sites, and a data example, has been sent to Richard, with only one or two missing.

10
Figure 5: Iceland’s Arctic-HYCOS network, May 2016.
Gunnar also presented an overview of the last hydrological year in Iceland: 2014-15. He indicated that
2015 was the coldest year since 2000, with an abnormally warm September. Precipitation and snow
accumulation was higher than normal, and annual runoff was above normal for most non-glacial rivers.
Glacial ablation was less than for any year since 1995, and the meltwater less prominent in the total
runoff. There are very few precipitation measurements in Iceland, so researchers have to use estimates.
There is radar data in Iceland but it is not yet being used in hydrology. There was a major glacial
outburst flood (jökulhlaup) in southern Iceland in the past year. It was the largest in the Skafta river,
with a maximum discharge of 3,000-4,000 m3/s. There were no casualties, but extensive damage to
infrastructure and great land deterioration due to sediment accumulation and erosion. Following the
event, the IMO got 3-years of funding for risk assessment of the Skaftá catchment.
In addition to the network update, Gunnar presented some news from the IMO:
- Strengthened co-operation between DMI (Denmark) and IMO (Iceland): IMO now operates
DMI‘s new supercomputers (largest in Iceland) which provide weather forecasts for Denmark-
Iceland-Greenland. This has strengthened research collaboration in meteorology, oceanography,
glaciology, hydrology and more. New weather forecasts and related parameters will improve for
a large part of southern Greenland and Iceland; this includes input data for hydrological
modelling and flood forecasting.
- Harmonie model improves hydrological research: New back-calculated dataset based on
Harmonie weather prediction model is now available. The dataset provides enhanced
opportunities for hydrological modelling and related studies, e.g. hydropower potential, flood
studies.
Finland (Johanna Korhonen)
Johanna Korhonen, from the Finnish Environment Institute (SYKE), provided an update to the
Committee on hydrological monitoring in Finland. Finland doesn’t have many Arctic-HYCOS stations as
only 10% of the land area contributes to the Arctic. Hydrological monitoring in Finland is managed by

11
the Finnish Environment Institute (SYKE), which is responsible for designing and coordinating the
monitoring network, giving instructions and collecting the results into a database, and data systems
operation and development. There are then 13 regional centres responsible for field operations within
the national programme – station installation and maintenance, discharge measurements, observer
engagement, training and control. These regional centres are under a different ministry than SYKE - the
SYKE is not in charge of steering them.
Johanna informed us that there is a new government in place in Finland since last year, and they would
like to privatize many things. They have already outsourced water quality sampling to private
companies, instead of the regional centres doing it before. Laboratory analysis related to sampling,
which was previously done by SYKE, has been taken over by private operators. Outsourcing of
hydrological field work will be the next step, and the outsourcing of sampling fieldwork has already
affected Lapland and Arctic-HYCOS stations. There actually aren’t any private operators to take over, so
currently, for example, discharge measurements are not being done in Lapland. The next step is to
figure out how to operate in the future. By January 1, 2019 the regional centres will also be disbanded,
and some of their tasks will be given to counties. SYKE staff has proposed that their institute be
responsible for coordinating the tasks and tender the contracts, but plan for future organizing is still
being arranged. Financing is also an issue as funding for SYKE has been going down. The funding reform
put in place by the government means less direct budget funding for state research institutes, funding
given out based on strategic themes, and very high competition for funding. This brings great challenges
to finance the hydrological network!
Taking these changes into account, Johanna described the upcoming changes in hydrological
monitoring:
- How to outsource the field work, installation, maintenance. But if there are no competent
private operators (i.e. in Lapland), this is a problem.
- Planning on piloting the idea of purchasing data from private operators as part of outsourcing.
- National water level network planned to be automated totally during next few years (real-time
stations 86% automated, Arctic-HYCOS stations 100% automated). The tendering process of
procurement failed in 2014-2015 and has been suspended until future responsibilities of
organizing monitoring are clarified. Currently, there are several Arctic-HYCOS stations with
rather old automatic equipment.
- Optimization of network: Coherent nationwide network with the same criteria applied to all
stations across the country. Criteria are based on user data needs (flood risks, regulation, water
permits, climate research, water supply, etc.). The separate national and regional networks will
be merged into one.
The national hydrological monitoring programme in Finland currently consists mostly of stations run by
SYKE and regional centres, and some run by other organizations (hydro power companies). There are
241 water level stations run by SYKE and 78 run by others, and 171 discharge stations run by SYKE and
106 run by others. There are also ice thickness and water temperature stations, all run by SYKE. They
have done some evaluation of water temperature data provided by pressure sensors. SYKE has stations
related to hydrometeorology (snow water equivalent, evaporation), and geohydrology stations as well

12
(groundwater level and groundfrost depth). The precipitation network is run by the Finnish
Meteorological Institute (FMI). The distribution of stations across the country varies, with a lot lower
density in the north for both water level and discharge (see Figure 6).
Figure 6: Finnish hydrometric network - distribution of Water Level (W) and Discharge (Q) stations.
There are eight Arctic-HYCOS stations in Finland. They all have rating curves and are available as real-
time data. There are more stations than that, but they are on the same rivers. Most have ice cover and
need ice reduction in the winter. One is a hydropower station. The regional centres took over
measurements at these stations in 1995 – before that it was SYKE. There are under-ice measurements
for 5 of the Arctic-HYCOS stations, however since the change in organization responsible, not as many
winter measurements have been taken; winter discharge values are estimates. Some of the Finnish
stations have cameras installed; one Arctic-HYCOS station has a camera. The HYCOS stations are pretty
stable so the lack of visits isn’t as big an issue, the only concerns are in the winter due to ice cover. Ice
correction of river discharge is required at 71 gauges, and is done graphically based on discharge
observations, ice data, winter rating curve, model simulations and weather data (corrected values are
flagged in the data base).
Operational details for: - Surface water level:
o Water level: most of stations automatic (86%) ● Pressure transducers ● Control: manual gauge, limnigraphs (every month)
○ Automatic telemetry (SMS, GSM, GPRS), email, automated phone call, paper reports ● Manual measurements daily, automatic at least hourly (Daily values calculated)
○ Levelling at least every three years - River Discharge:
○ Rating curves and hydropower plants (Stable curves) ○ Ice reduction needed at some sites
○ Traditional current meters (propellers), since the 1990s acoustic current meters (ADCP)
○ No real-time devices (side-mounted ADCPs)
○ Daily values in database
○ In 2015 about 50 % of the measurements done by using ADCP

13
- Ice thickness ○ Manual gauge measurements
○ 50 sites, mainly in lakes, measured 3 times per month
○ Total ice thickness, snow ice, snow, free bound
- Water temperature: ○ 34 surface water sites (20 cm depth) measurement daily 8 am open water time
○ Almost all automated
○ Additionally pressure sensors provide continuous temperature data at sensor’s depth
Finnish data sources:
● Hydrological data in Odata format available online the late 2015:
○ http://rajapinnat.ymparisto.fi/api/Hydrologiarajapinta/1.0/ (only in Finnish)
○ Same format chosen for all environmental data of SYKE
● Provisional discharge data online (very 15 minutes):
○ http://wwwi3.ymparisto.fi/i3/RealTime/LAPQ.htm
○ No ice corrections!
● Data service for Arctic-HYPE model (SMHI) establihed this year
● Pressure transducer water temperatures online real-time:
○ http://wwwi3.ymparisto.fi/i3/RealTime/LAPWST.htm
● Web camera at Tenojoki Onnelansuvanto station:
http://wwwi3.ymparisto.fi/i3/kamera/LAP/OnnelansuvantoTenojoki/kamera.htm
Russian Federation (Valery Vuglinsky)
Valery Vuglinsky presented an update since the last meeting on the hydrological network in the Russian
Federation. He stated at the at moment there are two projects ongoing: 1) optimization and
modernization of the hydrological network in the Volga river basin, however there are no links between
this basin and Arctic Rivers, and 2) development of a water economy complex for the Russian Federation
in 2012-20 – approximately 50 stations in the Arctic territory will be modernized as part of this project.
Valery explained that the Russian network is stable, with about 3,400 hydrological stations throughout
the territory. The density of stations is not very high, less dense than in the USA and Canada, but a
selection of stations has been chosen to contribute to the Arctic-HYCOS. There are three major types of
stations in Russia:
1) Base stations with long term observations (100 stations that have more than a 50-year record)
2) Operational river gauge stations – information is used for hydrological forecasts
3) Temporary station – open for concrete reasons, can be used for 10-15 years, and then closed
Stations have two types of measurement characteristics. The main hydrological network includes
stations for measurement of river water level and discharge, as well as stations on lakes. Then there are
specialized stations for water balance, evaporation (from water bodies, soil or snow), and small-basin
stations. The size of these networks has decreased in the past 15 years – there are now only 3 water
balance stations, 100 stations for water evaporation, 50 for soil evaporation, and 15 stations for snow

14
evaporation. On rivers there is a standard program of observation: data on water level, discharge, water
temperature, ice events, ice thickness, and sediment discharge are all collected. Lake stations have
approximately the same program.
In the past 8-10 years, new devices have been installed at the main stations. This includes automated
devices for water level measurements and ADCPs for river discharge measurements, but not as many
have been installed at stations in Arctic zones.
For the Arctic-HYCOS database, the Russian Federation can contribute 17 “Flow to Ocean” stations (with
data records from 1881 to 1964 at minimum, and up to 2011 for some stations), and 44 “Hydrological
Regime” stations (data records from 1881 to 1965). This data was officially contributed by Roshydromet.
The hydrological regime stations were chosen to reflect the differences between regions, and all the
rivers discharge to the Arctic Ocean. A map of the distribution of stations across the Arctic zone is
available. There is a station (#14) on Lena River (Lena at Tabaga), however unfortunately it is too far
from the mouth, and another station further up the river only measures water level. Discharge was
collected at a station at the mouth in the past.
Sweden
The Swedish representatives, Kristina Isberg and David Gustafsson, did not present in this part of the
meeting since Sweden does not have any rivers draining to the Arctic Ocean. However, they provided
the short summary below after the meeting:
A selection of Swedish discharge stations have been submitted to the GRDC as representative of the
hydrological regimes in Sweden. It has been discussed whether a sub-set of these stations should also be
included in the Arctic-HYCOS hydrological regime network. However, for the moment this has not been
prioritized, since none of these stations are located in rivers draining into the Arctic Ocean. Sweden is
focusing on contributions using the Arctic-HYPE model.
Norway
Not present.
3.1.2. Finalized list of flow to ocean stations (Richard Lammers)
Richard Lammers gave a presentation that included maps and tables showing the finalized list of stations
for the “Flow to Ocean” Arctic-HYCOS database (see Figure 7). He described the connection between
Flow to Ocean and Hydrological Regime databases (see Figure 8), and summarized the status of data
availability and ease of access for Arctic-HYCOS data by country (Figure 9). Richard also noted that much
of the land area these stations cover is non-arctic (see Figure 10), with the majority being Boreal forest.
This project is mostly complete now that all countries have identified their flow-to-ocean stations.

15
Changes to the station count (in Figure 7) since the 2015 meeting:
- Canada added 10 stations
- Iceland added 16
- Norway added 21
- Russia removed 255
The next steps are to deliver the current list to GRDC, discuss which parameters will be included beyond
discharge and water level (operational near real-time data, river temperature data), and think about
how to flag stations with pristine versus regulated flow, and how to quantify uncertainty estimates (e.g.
error bars on stations?).
Figure 7: Number of stations in current Arctic-HYCOS database
Figure 8: Connection between Flow to Ocean and Hydrological Regime databases

16
Figure 9: Summary of data availability and ease of access per country for Arctic-HYCOS data
Figure 10: Latitudes and Land Areas of Arctic-HYCOS database stations
A discussion about how to include a measure of uncertainty in the Arctic-HYCOS database followed.
There were suggestions of ways to calculate error, indicate regulation on a river system, and how to
model streamflow for ungauged areas. Al stated that he thinks the Arctic-HYCOS group should try to
express the possible (or actual) margin of error on the measurements. See discussion below.

17
This discussion resulted in an action item to investigate what metrics can be used for each country to
rate their rating curves, as a first attempt at uncertainty estimates (see Project 11 in Annex III: Arctic-
HYCOS Work Plan 2016 - 2017: Arctic-HYCOS Work Plan 2016 - 2017).
Uncertainty:
- The WMO Commission for Hydrology (CHy)’s Project X is working on methods to quantify
uncertainty for non-ice covered stations.
- The USGS has a system to rate their rating curves.
- Canada also has a system to rate the stability of a station’s rating curve – maybe the stability of
rating curves could help determine uncertainty.
o Arctic-HYCOS could establish if any other National Hydrological Services are looking at
uncertainty, and how.
- Al suggests we could add the number of shifts or number of measurements per year for each
station to the Arctic-HYCOS database, as a measure of uncertainty. In the US there is an
automated program sending a list of stations to technologists (called “Go To”) when they need
to go take a measurement. In Canada the number and timing of station visits is subjective.
- There was a suggestion by David on the possibility of using uncertainty estimates as a criterion
for selecting the stations themselves. Paul and Richard indicated we’d rather have all the
stations in the database to maximize the drainage area the Arctic-HYCOS represents, so we’d
like to include all the high latitude flow stations, however maybe we could use uncertainty
estimates as a tie-breaker of which stations to include. Paul suggested a qualitative assessment
of uncertainty should be included in metadata, but we should still include all the stations.
Regulation:
- For regulation of rivers, a lot of information is missing, especially in the Russian database. A
system to mark which rivers are regulated or not would need to be approved by each country.
We could use some sort of rating from 1-10 on “how regulated” the river is?
Ungauged Areas:
- We’d like to know how much of the Arctic discharge is ungauged. Maybe annually we need to
look at something simpler like a geostatistical method (basin averaging?) rather than full
modelling, using classification of hydrological regimes and assume similar regimes have similar
flows.
3.2. Project 3: Interim Arctic-HYCOS Database
Arctic Runoff Database (ARDB)
Uli Looser updated the committee on the status of the “Arctic Runoff Database” (ARDB). This database
contributes to ACSYS and CliC, as well as Arctic-HYCOS, and it has data access under the conditions of
the GRDC data policy. Arctic-HYCOS is a “subset” of the ARDB – best available flow to ocean, and
hydrologically representative stations (although there are a few Arctic-HYCOS station that aren’t in the
ARDB – Alaskan panhandle, stations in northern USA). The database needs to be regularly updated by

18
each country. The data are now provisionally available on the GRDC website and anyone can download
time series data. There is an option to display the Arctic-HYCOS stations in Google Earth, but currently
this uses the old station list, not the new one that Richard Lammers has just updated.
The ARDB can be found under “Special Datasets” on the GRDC website:
http://www.bafg.de/GRDC/EN/04_spcldtbss/41_ARDB/ardb.html;jsessionid=2E8A6ED1BA2766FC7EBD8
94E98D4B895.live21303?nn=201574. On the Arctic-HYCOS page of the GRDC website there is also a link
to the draft Arctic-HYCOS website (http://arctic-hycos.net/Arctic-HYCOS/Home.html ), and another link
to a page with description of the basic country networks within the Arctic region, from which the time
series data (daily or monthly) can also be downloaded (see
http://www.bafg.de/GRDC/EN/04_spcldtbss/41_ARDB/ArcticHYCOSData.html?nn=201698).
Database Status May 2016:
• 2,446 gauging stations
• daily / monthly discharge data
• 10 countries and territories contributing to Arctic rivers: CA, DK & GL, FI, IS, KZ, MN, NO, RU, US
• last updates since Jan 2015: CA, FI, GL, IS, NO, SE, US not all of them included in database yet.

19
GRDC future activities include:
• Currently busy with acquiring new software to operate GRDC. Change to new software hopefully
completed by February 2017
• Finalise Arctic-HYCOS station list
• Include “missing” stations into GRDB and update discharge data
• Improve information on Arctic-HYCOS webpage (e.g. list of stations for easy reference)
• Provide Arctic-HYCOS data as download in .txt format
• Investigate provisioning of Arctic-HYCOS data via web services
• Register services in WIS and GEOSS / other portals
AGREEMENT: Following this presentation, the Arctic-HYCOS Project Steering Committee agreed to use
the “Arctic-HYCOS” name for the GEOSS and WMO/WIS Portals. Uli will register the HYCOS database
with those portals.
For more information, staff at the Global Runoff Data Centre (GRDC) includes:
Ulrich Looser (Head)
Irina Dornblut
Thomas de Couet
Johannes Pauler
e-mail: [email protected]
web: http://grdc.bafg.de
Open discussion on Project 3
Trend Analysis:
- Al suggested we examine the common record length in the Arctic-HYCOS database, and we
should consider doing a trend analysis, including a summary of any missing values or excluded
stations. This was added to the work plan. Don Burn will be working on re-doing the analysis of
the Reference Hydrometric Basin Network (RHBN) for Canada, we could ask him to do a similar
analysis for Arctic-HYCOS stations as well. Richard indicated there is also a reference network for
Russia created at the University of New Hampshire a number of years ago.
- Paul: The RHBN contains pristine basins or stations that reflect non-pristine conditions that have
been stable over time, or regulation that does not impact the data for trend detection purposes
(for RHBN criteria, refer to the 1999 report by Environment Canada called “Establishment of the
Reference Hydrometric Basin Network (RHBN) for Canada” – see reference in Annex IV:
Documents for Circulation). Do we need to establish the degree of regulation prior to
undertaking a trend detection exercise?
- Al: We should do an analysis and subtract the downstream flows. This group should be making
the definitive statement on freshwater flux!
- AGREEMENT: The group agreed that the two Greenland stations should also be included, even
though the time series data are not that long with records starting in 1996 and 2006.

20
Drainage Area shapefiles:
- Shapefiles of the drainage areas exist for the GRDC database, but are not included for download
online.
- David Gustafsson indicated that their team had developed the vectors themselves for their
modelling effort. Finland and Norway have sub-basin delineations available. This is also one of
the huge uncertainties. This should be part of the database.
- Richard Lammers indicated that he uses digital river networks as standard in hydrological
modelling (assuming a good DEM). There is hydro1k, hydroSHEDS, although these might not
work well beyond 60 degrees north. He also said that Bernhard Lehner, a McGill professor,
created the watersheds of the Arctic stations.
- Which Arctic countries already have basin delineations?
o Canada partial,
o USA partial
o Iceland, Finland, Sweden have them (Sweden created them for their HYPE model)
o Nothing for Russia
o There might be information available from the ISS (International space station) in high
resolution
o Gunnar Sigurðsson asked if someone was working on a new DEM for the Arctic region.
He thought that a much better product is needed than the old hydroSHEDS.
- ACTION David Gustafsson: Each country to provide vector basin delineations for all Arctic-
HYCOS stations to David Gustafsson who will lead the work plan item and check in with each
country. Sweden’s HYPE model uses an average 700 km2 resolution for each basin (see Project
7 in Annex III: Arctic-HYCOS Work Plan 2016 - 2017: Arctic-HYCOS Work Plan 2016 - 2017).
3.3. Update on Arctic-HYCOS website
The website for Arctic-HYCOS prepared by Richard Lammers is found at: http://arctic-hycos.net/.
Richard’s Arctic-HYCOS website is currently running, with the same content as shown at the Geneva
meeting. Richard set up the domain (hycos.net) and it is running on University of New Hampshire’s
server at the moment.
A link to this website is also provided on the GRDC homepage (http://arctic-hycos.net/Arctic-
HYCOS/Home.html)
There is also a WHYCOS website (WMO covers expenses), with an Arctic-HYCOS link at the moment with
some reports, but doesn’t have the data download feature that Richard’s website has. The WHYCOS
Arctic-HYCOS page is found here: http://www.whycos.org/whycos/projects/under-
implementation/arctic-hycos
ACTION: The Committee needs to decide whether to use Richard’s site, the GRDC site, or the WHYCOS
site (see Project 3b in Annex III: Arctic-HYCOS Work Plan 2016 - 2017: Arctic-HYCOS Work Plan 2016 -
2017).

21
3.4. Project 4: WHOS and WaterML2.0 Standard Prototype
WMO Hydrological Observing System (WHOS)
Silvano Pecora made a presentation to the Committee on the current work at WMO for the WMO
Hydrological Observing System (WHOS) and Arctic-HYCOS. He began by highlighting that there are a lot
of hydrological observations for the Arctic region, and went over some details about how we should
collect hydrological information and data for each area of the Arctic. Some data can already be
downloaded from GRDC – data collected according to member states, for different purposes and
intentions. He suggested we should introduce an “open data” layer – used for publication of the same
data.
Next, Silvano described the WHOS project (http://www.wmo.int/pages/prog/hwrp/chy/whos/). WHOS
is part of WIGOS (WMO Integrated Global Observing System), and is the most important program there-
within, as demonstrated since the WMO member states decided to support it. Therefore, we should
provide Arctic-HYCOS data to this program.
“A WMO Hydrological Observing System (WHOS) was proposed and agreed upon 2 years ago by the CHy
Advisory Working Group as the means to provide the most comprehensive hydrological component in
fulfillment of the WIGOS objective of an integrated, comprehensive, and coordinated system which is
comprised of the present WMO global observing systems. WHOS is conceived as a portal to facilitate
access to already available on-line real-time and historical data, drawing from the water information
systems of countries around the world that make their data freely and openly available, including HYCOS
projects.”
Figure 11: WMO Integrated Global Observing System (WIGOS)
WMO Information System (WIS)
The details of how to provide our data to WIGOS is supported from a technological point of view by the
WMO Information System (WIS). WIS ingests data from National Centres and the data are synthesized
globally through communication networks (see Figure 12). The WIS has expanded from 5 to 15 data

22
providers. The structure works well, but it has some constraints. WIS data exchange is done using the
GISC DAR service – the Global Information System Centres (GISC) Discovery, Access and Retrieval (DAR)
service. The GISC interfaces and web portals can search various sources to find anyone who is collecting
the observations that you are looking for.
Figure 12: WIS data ingestion and synthesis system
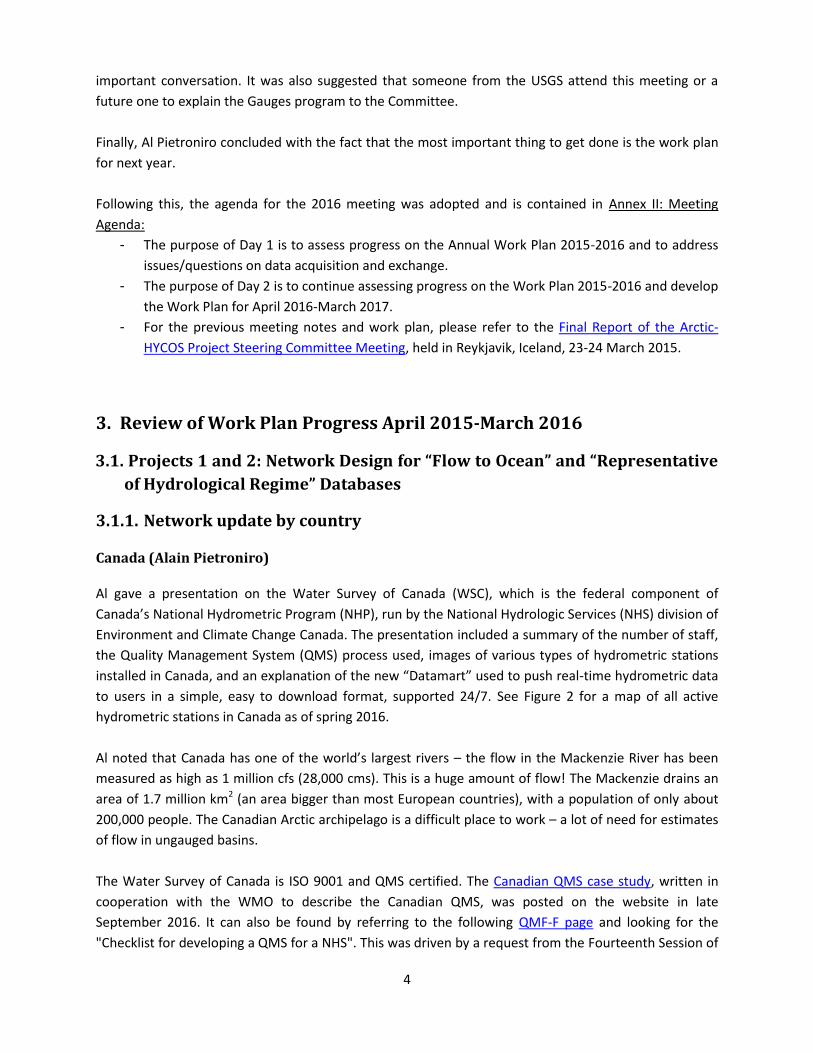
WHOS implementation is composed of two phases:
Phase 1 (see Figure 13): A map interface has been created with links to those NHSs that make their real-
time and historical stage and discharge data available online. Initial implementation was July 2015.
- ACTION: The Arctic-HYCOS committee should check over the information (see
http://www.wmo.int/pages/prog/hwrp/chy/whos/), and if there is anything to correct,
please send an email to [email protected] (see Project 4 in Annex III: Arctic-HYCOS Work Plan 2016
- 2017: Arctic-HYCOS Work Plan 2016 - 2017).
Phase 2: Phase two is a fully WIS/WIGOS compliant service-oriented framework linking hydrological data
providers and users through a hydrological information system enabling data registration, data
discovery, and data access. The beta version for CHy-15 review and endorsement will be prepared for
December 2016, and the initial implementation for WMO Executive Council (EC) approval is scheduled
for June 2018.
Phase two is similar to WIS as it is a catalog of information about data providers. Users can do DAR via
this system. It uses a virtual community approach for management, facilitates data and discovery, but
not data accessibility. This is solved by adding a mediator or broker – someone who knows the data
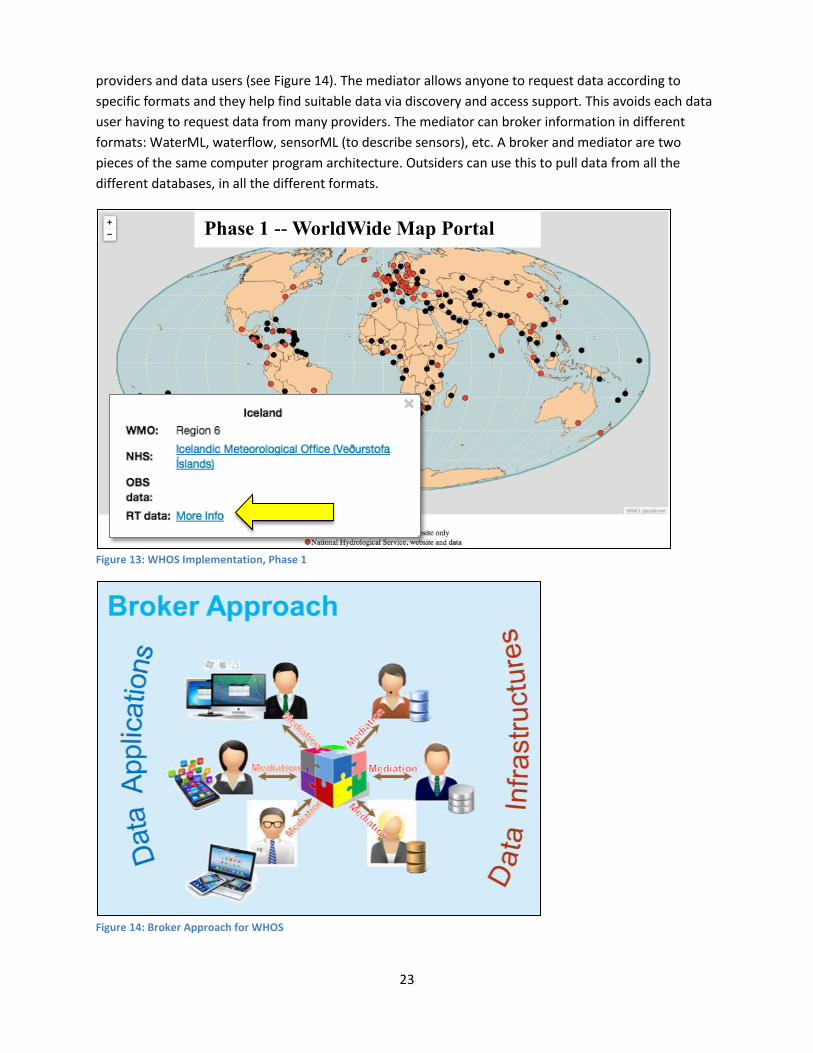
23
providers and data users (see Figure 14). The mediator allows anyone to request data according to
specific formats and they help find suitable data via discovery and access support. This avoids each data
user having to request data from many providers. The mediator can broker information in different
formats: WaterML, waterflow, sensorML (to describe sensors), etc. A broker and mediator are two
pieces of the same computer program architecture. Outsiders can use this to pull data from all the
different databases, in all the different formats.
Figure 13: WHOS Implementation, Phase 1
Figure 14: Broker Approach for WHOS
Phase 1 -- WorldWide Map Portal

24
The next step is for WMO to review and see if part 1 will be a WMO standard. At the next CHy meeting
(December 2016) the work will be done for WaterML 2.0 part 1, and CHy-15 will decide if it will adopt
the standard. Part 2 and onwards is to be presented in the next CHy session.
Other standard formats include:
• WMO: TDCF
• OGC: WaterML2
• Research: NetCDF …
• Other: XML …
Standardization in Hydrology – WIGOS Standard and WaterML 2.0
WMO has developed schemas and processes, which become part of WMO regulation. In June 2015 (at
Cg-17) the WIGOS metadata standard was approved, see:
https://www.wmo.int/pages/prog/www/wigos/documents/Cg-17/WIGOS_Metadata.pdf. An interim
version v1.01 of the WIGOS Metadata Standard (WMDS) is available (see Annex IV: Documents for
Circulation). The official version of the approved WMDS v1.0 is still to be published by WMO, in the
meantime the "near final" version of that v1.0 can be found at:
http://www.wmo.int/pages/prog/www/wigos/documents/WIGOS-RM/1160_en.pdf#page=49
The WMO is now working on the schema to provide the information about observations. The
international standardization of WaterML is one of the important pieces. The Hydrology Domain
Working Group (HDWG) is working on standards for WaterML 2.0 suite, and organizing interoperability
experiments focused on different sub-domains of water. The chairs of the HDWG are Ilya Zaslavsky
(USA), Tony Boston (Australia), and Silvano Pecora (Italy).
Further information about hydrological data sharing at WMO CHy:
- http://www.whycos.org/wordpress/?page_id=758
- Documents for discussion about hydrological activities to be developed during the next CHy-15
programme.
- A document on the WMO Hydrological Observing System (WHOS) was also published:
http://www.whycos.org/wordpress/?page_id=896
ACTION Silvano Pecora: Circulate Water ML 2.0 Part 2 of the WHOS project, for comment (see Project
4 in Annex III: Arctic-HYCOS Work Plan 2016 - 2017).
ACTION Silvano Pecora: Report back on the WHOS and WaterML2.0 Standards at the 2017 Arctic-
HYCOS meeting. Rating curve information and history may be required (see Project 4 in Annex III:
Arctic-HYCOS Work Plan 2016 - 2017).
Water Data Dissemination in the World
Silvano then presented some information and demonstrations of water data being disseminated in
other parts of the world and under other HYCOS arrangements. Examples include:

25
- ISPRA GIS Hydrological Information System Web log service:
http://www.hiscentral.isprambiente.gov.it
- International Sava River Basin Commission (the Danube)
- The Niger Hydrological Information System Central Web Service
- Hydrological Information System in the Plata basin
- See: http://www.whycos.org/whycos/projects/under-implementation
WMO Hydrological Ontology
Sometimes the same variable will have different names or languages (rainfall vs precipitation).
Hydrological Ontology is a formal naming and definition of the types, properties, and interrelationships
of entities that really or fundamentally exist in the domain of hydrology; in particular, it
compartmentalizes the variables needed in hydrology and establishes the relationships between them.
We can use a system to map the different names (official WMO ones) for the same variables. This is
improved further with a semantic service. The interconnections of interest are between all the concepts
we are studying – Hydrosphere – hydrological, biological, physical.
Hydrological Data Sharing in Arctic-HYCOS
In context of Arctic-HYCOS, we could offer this type of system, which could be used to close the
hydrological balance. A prototype of the Arctic-HYCOS Information System (HIS) web library is in
development. Figure 15 shows the page on the development server and the menu to access “brokered
observational services”.
Figure 15: Prototype of the Arctic-HYCOS Information System (HIS) web library showing the menu to access “brokered observational services”

26
Metadata
Silvano then presented on “What are metadata, and why they are essential.” Currently, essential data
are exchanged globally, but metadata are not. Metadata are needed to make adequate use of
observations globally, but they are not always easily obtained by users.
Metadata = documentation describing data, context of observations
Observed variable
Location
Environment
Intended use
Discovery and Observation Metadata: The work by WIS makes observations discoverable and accessible,
and describe the data policy (operational uses), while the work at WIGOS describes observations to
enable adequate use, supports rational evolution of observing systems, semantic standards and
developed and under review, and there will be an adoption by members in phases from 2016 to 2020.
Meaningful use of observations requires knowledge about the conditions under which the observation
was made; WIGOS metadata is what provides that supporting information. Some definitions will help
clarify what WIGOS metadata is, and what it is not.
• WIGOS metadata: supplementary information about an observation that may include its
location, the conditions under which the observation was made, the quality procedures applied
to the observation, details of the instrument used to make the observation, etc.
• WIS metadata: information about a dataset (a collection of information) that allows the
existence of the contents of the dataset to be discovered, the dataset located and methods of
accessing the dataset identified.
So, for observations, WIS metadata is what allows you to find them, and WIGOS metadata is what allows
you to use them. The mediator will offer the new WIGOS metadata.
OSCAR: Observing System Capacity Analysis and Review is a system that contains information about
monitoring networks across the world. It includes climate and meteorology networks; however,
information from hydrometric networks is missing, and should be added. OSCAR has a web facility to
map data through WMO web portal. You can search for information about stations, and information can
be uploaded by national focal points (NFPs).
The Arctic-HYCOS committee should review the information provided at the link below, which
includes a list of elements specified in the WIGOS Metadata Standard and the phases for
implementation by Members: http://www.wmo.int/pages/prog/www/wigos/documents/Cg-17/Cg-17-
d04-2-2(3)-add1-MANUAL-ON-WIGOS-approved_en.docx (also listed in the action items for Project 4 in
Annex III: Arctic-HYCOS Work Plan 2016 - 2017).

27
Geospatial attributes of streamflow gauges in Arctic-HYCOS
Silvano presented an example from the USGS document “GAGES II: Geospatial Attributes of Gages for
Evaluating Streamflow, version II”. The GAGES II dataset provides geospatial data and classifications for
9,322 stream gauges maintained by the USGS. This dataset has two purposes: (1) to provide users with a
comprehensive set of geospatial characteristics for a large number of gauged watersheds, particularly
for gauges with long flow record, and (2) to provide a determination of which of those watersheds
represent hydrological conditions which are least disturbed by human influences ("reference gauges"),
compared to other watersheds within ecoregions.
With respect to metadata, the GAGES II documents (provided at the links below) identify 27 worksheets
which represent general types of variables. In Europe there is a different type of directive for
hydrological and morphological information. Each specific variable in the variable description
spreadsheet has several pieces of information about it.
Information about Gages II can be found at:
- http://water.usgs.gov/GIS/metadata/usgswrd/XML/gagesII_Sept2011.xml
- ftp://ftpext.usgs.gov/pub/er/va/reston/NAWQA_ENS/GIS_DATA/gages/gagesii-
updates/gagesII_sept30_2011_report.docx
- Additional information about attributes can be found here: http://www.reformrivers.eu/
The Committee agreed that they should use the GAGES II document to review the metadata that
could be used in Arctic-HYCOS (details included in the action items for Project 4 in Annex III: Arctic-
HYCOS Work Plan 2016 - 2017).
FOR DECISION: what are the attributes we want to all have?
- We need the Arctic-HYCOS system to have attribute information so users can filter down the
total list of worldwide, including Arctic, stations by theme. That way you get the pizza with the
toppings you want, not all the pizzas. Then the system can be used to help decide hydrological
and Arctic suitability.
- We need a strategy to determine a list of hydrological attributes (possibly a mandatory list and a
list of extra characteristics) that should be used for the HYCOS database. This concept should
become a hydrological contribution to the WIGOS/WIS metadata requirements. This should be
raised at the WMO CHy meeting in Rome in December 2016.
- Given WMO would like each HYCOS service to start registering its service in OSCAR, additional
effort on mandatory characteristics is required.
ACTION: Members to provide Gillian Walker a list of 3-4 attributes that are most important for
selecting potential stations based on GAGES II, the existing list from the WIGOS metadata standard, or
other input, by December 15, 2016 (see Project 4 in Annex III: Arctic-HYCOS Work Plan 2016 - 2017:
Arctic-HYCOS Work Plan 2016 – 2017).
A final list of 10 potential attributes will then be developed by Gillian & Al, for the committee to
review. These will also be applied to broader information system use, such as for WIGOS/WIS
metadata for hydrological purposes.

28
Following the discussion on the utility of metadata to guide the selection of sites using
WaterML2.0, it was felt that the following metadata should be included, as a start:
o Standard station metadata: Drainage area, lat/long, station names, elevation, river name
o Draft Attributes for each data point (extended metadata): Quality of data – create a flag based on USGS standard All countries to contribute a vector shapefile of station drainage areas Regulation: Flag all Arctic-HYCOS stations as “no significant regulation” vs
“regulated” Flag significant land use changes that result in changes to the flow regime
3.5. Project 5: Under Ice Operational Practices and Procedures
Jeff Conaway gave a presentation on Under Ice Operational Practices and Procedures. He quoted Rants
et al., 1982, in saying:
“[The] most important of all are the discharge measurements made during ice-affected periods. A
discharge measurement gives a definite point on a hydrograph plot of a daily mean discharge versus
date through which the graph of estimated true daily discharge must pass.”
The USGS has a document called “Measurement and Computation of Streamflow: Volume 1 -
Measurement of Stage and Discharge”, which covers under-ice measurement. In 2015 the Water Survey
of Canada published work undertaken by Paul Campbell entitled “Standard Operating Procedures for
under ice discharge measurements using ADCPs” (see action below - both documents to be distributed
with this report). Jeff Conaway has developed a survey of all the agencies to ask what is currently being
done in their hydrometric programs with regards to under-ice measurements. This could form the basis
of a WMO publication, which would include the results of the survey, measurement techniques
(mechanical and hydroacoustic), records of processing, and additional resources (cameras, remote
sensing).
ACTION: Jeff Conaway to circulate survey to all the agencies to collect material on current operational
practices and procedures for conducting under-ice measurements and estimating discharge under ice-
affected periods (see Project 5 in Annex III: Arctic-HYCOS Work Plan 2016 - 2017: Arctic-HYCOS Work
Plan 2016 – 2017).
The committee agreed last year to update a paper published in 1990 by Pelletier et al., however Al
Pietroniro indicated that unfortunately he was not able to work on this project in the past year. He
stated that some Canadian staff have been working on Acoustic Doppler Current Profiler (ADCP) testing
and measurement, and that a section-by-section profile standard has been developed. Johanna
Korhonen noted that in Finland they also do ADCP measurements section-by-section, but there are no
standards yet.
ACTION: Gillian to circulate the Water Survey of Canada ADCP SOPs by Paul Campbell (see Annex IV:
Documents for CirculationAnnex IV: Documents for Circulation ).

29
- qSOP-NA041-03-2015 under-ice discharge measurements using ADCPs.pdf
- qSOP-NA046-01-2015 Mid-section open water measurements using ADCPs.pdf
ACTION: Al Pietroniro to set an outline for the update to the 1990 Pelletier paper – Canada and US
staff to lead, please contribute if you want. Could maybe push it to a WMO publication on measuring
discharge under ice, when complete (see Project 5 in Annex III: Arctic-HYCOS Work Plan 2016 - 2017).
3.6. Project 6: Reporting of Arctic-HYCOS Activities
Arctic-HYCOS Poster
David Gustafsson presented a poster (jpeg) that he put together to describe the Arctic-HYCOS project at
events and conferences (see Figure 16). He cited it as: Pietroniro et al (2015) EGU2015-15707, EGU
General Assembly 2015. Session HS2.3.12 Open data, Virtual laboratories and Large samples in
comparative hydrology and multi-basin modelling.
ACTION: Could put the poster image on the GRDC or Arctic-HYCOS website(s) (see Project 6 in Annex
III: Arctic-HYCOS Work Plan 2016 - 2017).
Figure 16: Poster presented by David Gustafsson on the Arctic-HYCOS project in 2015 and 2016.
30
David presented the Arctic-HYCOS project, and the hydrological modelling being done, at several
conferences in the past year:
EGU General Assembly 2015, 2016
Gustafsson et al (2015): Modelling key water storages and fluxes in the Arctic drainage
basin to explain observed trends in river flow.
Pietroniro et al (2015): Arctic-HYCOS: a Large Sample observing system for estimating
freshwater fluxes in the drainage basin of the Arctic Ocean
Northern Research Basins, Kuusamo, Finland, 2015
Gustafsson. Arctic-HYCOS: a hydrological cycle observing system for improved
monitoring of freshwater fluxes to the Arctic Ocean
ESA CCI CMUG collocation meeting, Norrköping May 2015
Melnikov Permafrost Institute, Yakutsk, Russia (2015)
Vinogradov conference, Sankt Petersburg, Russia (2015)
The Committee then asked all members to provide a list of Arctic activities for use at CHy-15 and EC-
PORS (http://www.wmo.int/pages/prog/www/Antarctica/EC-PORS_about.html) meetings in 2016-17:
- Canada: none
- US: none
- Uli: standard presentations on GRDC indicating the separate networks and activities.
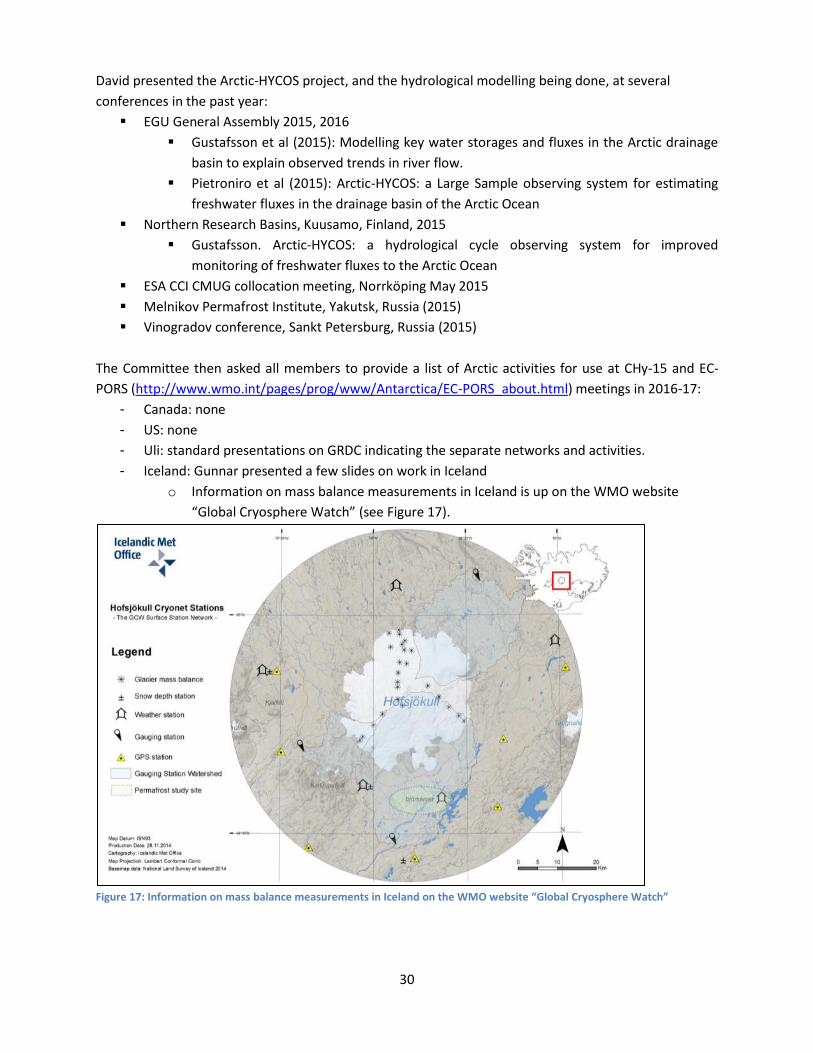
- Iceland: Gunnar presented a few slides on work in Iceland
o Information on mass balance measurements in Iceland is up on the WMO website
“Global Cryosphere Watch” (see Figure 17).
Figure 17: Information on mass balance measurements in Iceland on the WMO website “Global Cryosphere Watch”

31
Worldview Digital surface Model (DSM)
Gunnar also presented information about a new DSM of the Arctic (including Iceland) based on
WorldView satellite images. The development of the DSM involved the Icelandic Met Office and the
National Land survey of Iceland, and the DSM was produced in co-operation with the Polar Geospatial
Center in the USA.
- Authors: Ragnar Heiðar rastarson (Author, contact by @RagnarHeidar) and Bogi B. Björnsson
(Adaptation, contact by [email protected])
- Presented at the CHIN-GIS meeting, Silkeborg 2016.
- The DSM was produced privately by WorldView using:
• SETSM (Surface Extraction with Triangulated Irregular Network-based Search-space
Minimization)
• Satellite Imagery (Digital Globe)
• WorldView-1 (496 km alt. – 50 cm resolution)
• WorldView-2 (770 km alt. – 46 cm resolution)
• 3D stereo-pair analyisis
• Images from and including 2012
• From 60°N and higher latitudes
• Uses only orbital ephemeris data
• Spatial resolution of DSM 2-8m
• Calculations in supercomputers
• Blue Waters (University of Illinois)
• XSEDE (supercomputer cluster)
- What can we use the DSM for?
• Avalanche modelling and risk assessment
• Flood risk assessment
• Lava flow modelling
• Weather models and forecasting
• Elevation change detection and research
• Glacial cauldrons
• Rockslides
• Changes to glaciers (mass balance and edge mapping)
- Important Notes on the DSM:
• PGC and NSF have one condition for providing the data, it shall be distributed free of charge
• Only DSM delivered not imagery
• DSM of Iceland (and rest of Arctic will have a 2x2m resolution
• It is hoped that absolute vertical accuracy will be ~ 4 m without further corrections with
ground control data (e.g. LiDAR)
A review of new data on elevation is expected to be released soon, and EC-PORS may have compiled a
summary of that work.

32
ACTION: Al Pietroniro to try to reach out to the EC-PORS working group of the WMO Executive
Council. Co-Chairs: David Grimes and Sue Barrell (Australia). Gunnar will help get information as well
(see Project 6 in Annex III: Arctic-HYCOS Work Plan 2016 - 2017).
ACTION: Al to connect with Global Cryosphere watch (see Project 6 in Annex III: Arctic-HYCOS Work
Plan 2016 - 2017).
- http://globalcryospherewatch.org/about/gsg.html
- Árni Snorrason (IMO), Chair
- Barry Goodison (WMO, retired), Vice-Chair
WMO Commission for Hydrology (CHy-15) meeting in Rome in December 2015
- Attending from Arctic-HYCOS are: Uli, Johanna, Silvano, HA for USA (probably Robert, Barry), HA
of Sweden Christina Alionte, Russia probably Yuri Simonov.
- Have a small Arctic-HYCOS meeting in Rome?
- Dec 5-6 in Rome there is a “Women’s Leadership in Hydrology Workshop” – could Arctic-HYCOS
send someone?
o Johanna has been admitted to the workshop
o Iceland has a female representative
o Sweden has a few female delegates (Berit, Kristina, the HA)
o Canada may send (non-Arctic-HYCOS) staff
ACTION: Al Pietroniro to email this group to suggest attendance at the Women’s Leadership
conference (see Project 6 in Annex III: Arctic-HYCOS Work Plan 2016 - 2017).
ACTION: Everyone to let Al know which Hydrological Advisors (HAs) will be in Rome. It would be good
to attend with a list of ongoing actions for Arctic-HYCOS (see Project 6 in Annex III: Arctic-HYCOS Work
Plan 2016 - 2017).
Mass-balance work:
- Iceland: one slide – about mass balance measurements in Iceland. Up on WMO website “Global
Cryosphere Watch”.
- Al: mass-balance program in Canada has almost disappeared (retired), but did try to put gauges
on glaciers. Iceland does have gauges.
- Canada: gauge at Peto kept getting washed out. No longer there. Used to have one at Lilloet
too. Can check with Mike Demuth.
- USA: has two glacier projects that use streamflow stations. Will be a much better understanding
of glacial melting in a few years from now. Estimate 1% of melting could contribute to sea level
rise.
- Al: should consider promoting proper stream gauging for mass balance work.
- David: have similar modelling, but didn’t connect with discharge stations. No real connection
there. But didn’t really investigate that closely.

33
3.7. Project 7: Arctic-HYPE – Application of Hydrological Modelling and
Prediction
David Gustafsson and Kristina Isberg presented a progress report on work they have been doing along
with colleague Berit Arheimer on the Arctic-HYPE application, at the Swedish Meterological and
Hydrological Institute. See: http://hypeweb.smhi.se.
What is the role of hydrological modelling in the Arctic-HYCOS project?
- Gap-filling
o How to estimate flow in ungauged basins?
o How to estimate flow during ungauged time-periods?
- Metadata quality assurance
o How to evaluate the quality of HYCOS station metadata?
o How to identify missing information in the HYCOS station metadata?
- Evaluate usefulness of HYCOS data for Science and Forecasting
o How to explain changes in the observed flow to ocean and hydrological regime?
o How to make predictions of changes in key water flow and storages?
o How to make short-term and seasonal river flow forecasts?
o Our job is to make the data available
o Uncertainty for discharge data - difference between data not being available or it being
too much work to pull it out
Discuss role, questions & caveats of Arctic-HYPE:
- Which stations should be included in the model? HYCOS network A and B? When can we have a
current list? ARDB?
o Have been using the 631-station list provided by Richard in March 2015, this does not
include Greenland (agreement not to add Greenland yet)
- Small basins discarded (< 2000 km2). Stations where ModelArea-PublArea > +/- 10 % discarded
- Routing for each gauging station? (upstream catchment, diversions, regulation, more input data
available?)
o Yes, in dialogue with this Committee
o What is the upstream area? Modelled vs published total? GRDC data shows upstream
area, but some of those differ between total and effected area. In some cases they
differed up to 40%.
GRDC areas have been updated (but not the metadata)
Richard suggests if the differences are in the Nelson and the Ob River basins,
likely an effective area issue.
Canada: only evaluated effective areas in the Prairies, and this is no longer
updated. Look at a 1 in 2 year event, and draw by hand the contributing area.
i.e. 50% of the time this area does / does not contribute. Very subjective. Last
34
data 3-4 years ago. Have a description that uses the probability density function.
Make assumptions as to how wet things are. Quite simple.
Al suggests only looking at gross area for now.
- Re-calibration with HYCOS stations
o Agreement to focus on both ”Flow to ocean” stations and hydrology regime stations
o Agreement to use HYCOS stations for calibration and validation
o Agreement to add additional stations for evaluation of PUB
- Additional focus on lake/river ice, snow, glacier, water temperature as well as evaporation,
snow, glaciers, lakes, and permafrost
- Priorities for operational services are: real-time forcing data, setting up operational prototype
(daily hindcast and 10 day forecast with real-time forcing data)
- Gridded precipitation using reanalysis data – worldwide dataset
- All done in SMHI, data also used in other projects
ACTION David Gustafsson: Compare gridded precipitation products: Finnish gridded precipitation
using reanalysis data (worldwide dataset), Canadian “CaPa”, US products (PSIM, and a few others), for
all North America (see Project 13 in Annex III: Arctic-HYCOS Work Plan 2016 - 2017).
- Will we have gridded precipitation as an output from Arctic-HYCOS?
- For the Finnish product data used to correct is monthly, but a daily product.
- Could connect with Vincent Fortin (Canada).
- Can download Iceland’s real time data with an agreement (can view for free)
- Russia – http://GNVO.skniivh.ru - can register and log in to get historical data 2008 – 2013.
- Valery: data might come through GRDC.
- Processes and re-parameterizations – started with parameters for Sweden and Europe.
- Chinese dataset based on Landsat imagery. Compared to other datasets, plot by latitude. Big
increase in the fraction of lakes north of 60 degrees, over previous datasets.
- Al: UCLA product – global map of surface water, Landsat and automated algorithm.

35
Figure 18: Arctic-HYPE model developments – processes, calibration and evaluation
Arctic-HYPE progress since 2015-03-23 (see Figure 18):
o Model development
Process descriptions glaciers, frozen soil infiltration,(lake regions)
Updated landuse from ESA CCI project +lakes, -glaciers, (bare->low veg.)
Real-time Forcing Data ”Global Forcing Data” (to be published 2016)
Major re-parameterization and calibration v3.0.26
o Implementation and data dissemination
Operational hindcasts and 10-day forecasts pilot (almost ready)
Dissemination including realtime data at http://hypeweb.smhi.se
o Input data, Quality assurance, HYCOS data
Improved inputs in dialogue with HYCOS partners (Nov15-Jan16)
HYCOS station list and meta-data from 2015.03.27
Historical HYCOS data from GRDC (april 2016), and (on-going) real-time data from NHS
o Outreach and collaborations
Collaboration:
Matthew Macdonald, University Mannitoba, Canada is developing a special version of
Arctic-HYPE for Hudson Bay including frozen soil processes, lake processes, model
calibration. He visited SMHI for 2 months in 2015.
Lyudmila Lebedeva, Melnikov Permafrost Institute, Yakutsk , Russia
- impact of permafrost and thawing/freezing processes on Arctic hydrological system
- sensitivity of permafrost representation in models at different spatial scales
- Hydrograph and Arctic-HYPE model inter-comparison
Jenni-Marie Vesakoski, University of Turku, Finland

36
- Fluvial processes, river morphology from remote sensing combined with river flow
estimates from Arctic-HYPE
Dataprovider: JM. Vesakoski (FI)
Presentations: EGU (2015, 2016), NRB (2015), ESA CCI CMUG (on-going), MPI-Yakutsk (2015),
Vinogradov conference, (2015)
Applications; H2020 (Arctic Observation Systems)
Figure 19: Plans for operational Arctic-HYPE service 2015
Figure 20: Status of operational Arctic-HYPE service on May 24, 2016
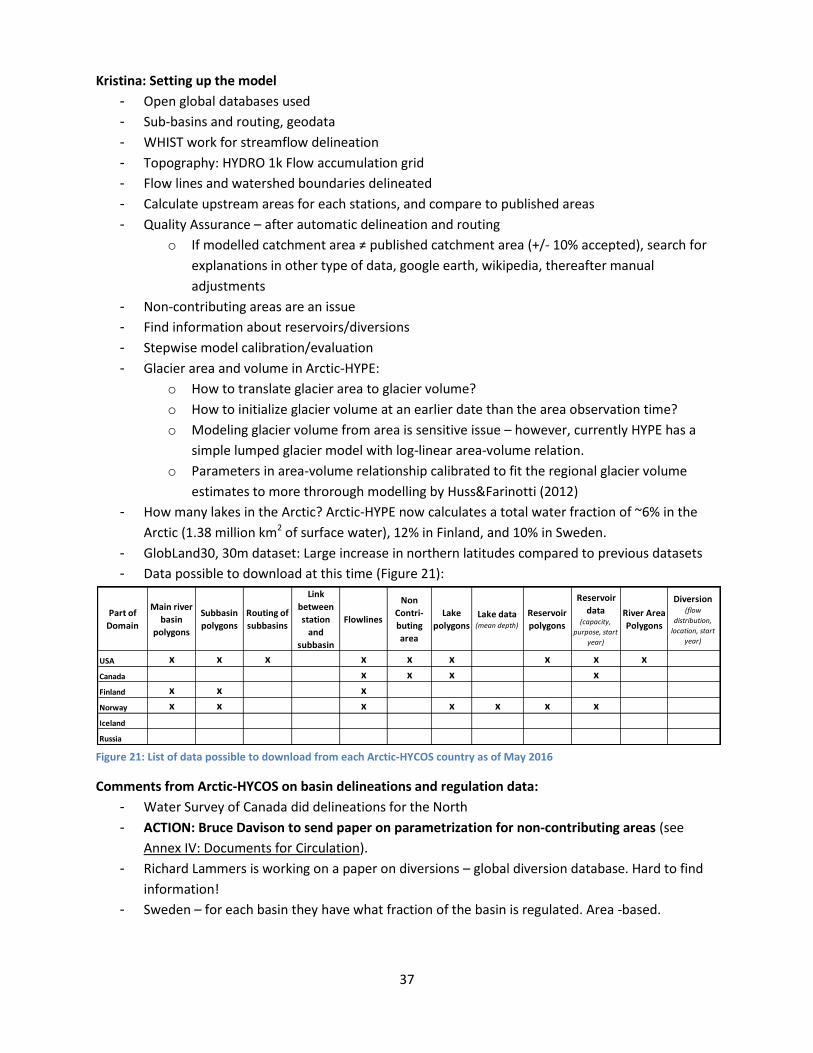
37
Kristina: Setting up the model
- Open global databases used
- Sub-basins and routing, geodata
- WHIST work for streamflow delineation
- Topography: HYDRO 1k Flow accumulation grid
- Flow lines and watershed boundaries delineated
- Calculate upstream areas for each stations, and compare to published areas
- Quality Assurance – after automatic delineation and routing
o If modelled catchment area ≠ published catchment area (+/- 10% accepted), search for
explanations in other type of data, google earth, wikipedia, thereafter manual
adjustments
- Non-contributing areas are an issue
- Find information about reservoirs/diversions
- Stepwise model calibration/evaluation
- Glacier area and volume in Arctic-HYPE:
o How to translate glacier area to glacier volume?
o How to initialize glacier volume at an earlier date than the area observation time?
o Modeling glacier volume from area is sensitive issue – however, currently HYPE has a
simple lumped glacier model with log-linear area-volume relation.
o Parameters in area-volume relationship calibrated to fit the regional glacier volume
estimates to more throrough modelling by Huss&Farinotti (2012)
- How many lakes in the Arctic? Arctic-HYPE now calculates a total water fraction of ~6% in the
Arctic (1.38 million km2 of surface water), 12% in Finland, and 10% in Sweden.
- GlobLand30, 30m dataset: Large increase in northern latitudes compared to previous datasets
- Data possible to download at this time (Figure 21):
Figure 21: List of data possible to download from each Arctic-HYCOS country as of May 2016
Comments from Arctic-HYCOS on basin delineations and regulation data:
- Water Survey of Canada did delineations for the North
- ACTION: Bruce Davison to send paper on parametrization for non-contributing areas (see
Annex IV: Documents for Circulation).
- Richard Lammers is working on a paper on diversions – global diversion database. Hard to find
information!
- Sweden – for each basin they have what fraction of the basin is regulated. Area -based.
Part of
Domain
Main river
basin
polygons
Subbasin
polygons
Routing of
subbasins
Link
between
station
and
subbasin
Flowlines
Non
Contri-
buting
area
Lake
polygonsLake data
(mean depth)
Reservoir
polygons
Reservoir
data (capacity,
purpose, start
year)
River Area
Polygons
Diversion (flow
distribution,
location, start
year)
USA x x x x x x x x x
Canada x x x x
Finland x x x
Norway x x x x x x x
Iceland
Russia

38
- Uli has a list on the website of 7 criteria for “climate sensitive” stations – daily, continuous data,
degree of basin development… use “no significant regulation”, see
http://www.bafg.de/GRDC/EN/04_spcldtbss/46_CSS/css_node.html.
- ACTION: Everyone to flag all Arctic-HYCOS stations as “no significant regulation” or
“regulated” (see Project 7 in Annex III: Arctic-HYCOS Work Plan 2016 - 2017).
o Canadian RHBN excludes any regulation
o Maybe small dams aren’t important (no significant regulation)
o Sometimes flagged only if it changes maximum flow
o Sweden has a % regulation
ACTION: Kristina or David to send everyone the table of “Data possible to download” (national
databases), and a list of metadata needed for the Arctic-HYPE model (see Project 4 in Annex III: Arctic-
HYCOS Work Plan 2016 - 2017).
Plans for 2016-17:
Evaluation of operational model service – in dialogue with this Committee?
Improved process understanding and model parameterization via on-going collaborations
Assimilation of HYCOS real-time and historical data (forecast initialization and historical re-
analyses) as well as remote sensing data
Evaluate predictions in ungauged basins
Sensitivity analysis of uncertainties in all chains of model system:
Sub-basins/routing: replace Arctic-HYPE basins with USGS data from Alaska?
Model non-contributing areas as processes or by parameterization based on metadata?
Calibration and Evaluation with data uncertainty information?
Evaluation of real time precipitation and temperature data
AGREEMENT: Move forward with the Project 7 Arctic-HYPE project plan for 2016-17.
Suggestion: Provide model results through the WHOS broker? Already some maps etc provided
through the SMHI website.
Suggestion: Pilot for Arctic-HYPE model to include in WMO standards?
3.8. Project 8: Water Temperature Data
Review of USGS procedures for river temperature
Jeff Conaway presented on USGS Water Temperature Methods (in the same PowerPoint file as the
under-ice information). Jeff notes off the top that everyone underestimates the amount of time it would
take to do water temperature measurements right. It is not considered a surface water parameter, but a
water quality parameter, and therefore is included in the USGS water quality monitoring report
(“Guidelines and standard Procedures for Continuous Water-Quality Monitors: Station Operation,
Record Computation, and Data Reporting”), as well as a second report called “Guidelines for the
39
Collection of Continuous Stream Water-Temperature Data in Alaska” (see Annex IV: Documents for
Circulation).
- Site Selection: Site selection for water temperature monitoring is important. Good mixing
locations are ideal; almost impossible to do in a braided channel, and shallow riffles (don’t want
to expose to the air). Cross sectional surveys of water temperature should be made to
determine if sensor placement is representative.
- Sensors: some stage sensors have water temperature sensors as well, but USGS uses separate
sensors, such as flow through PVC housing (+/- 0.2 degree C or less accurate). Field thermistors
are used for field checks annually, and two cross sections are done per year to ensure proper
mixing and accuracy.
- Stream temperature cross sections are done using the equal-width increment (EWI) method, at
mid-depth, 5-7 measurement points, wading with rod or attached to a weight, 60 second
minimum, don’t remove the sensor from the water!
- Sensors are often mounted to something pounded into the ground or attached to a rock.
- Record of the computation process:
o Initial data evaluation, removal of erroneous data, application of data corrections, final
data evaluation
o Use cross section data to verify that probe data represent stream, if not, then
downgrade record accuracy
o The USGS does data corrections on water temperature, and adds a quality rating after.
- Issues: exposed sensors, buried sensors (no diurnal fluctuations), frozen sensors, and more.
- Data Corrections:
o The USGS uses a maximum allowable limit of 0.2 °C as the sum of the absolute values of
all applied data corrections. If recorded values differ from the corrected values by more
than the maximum allowable limit, then those data may be deemed unsuitable for use
and are not reported or stored in the database.
o Correction of drift from sensor calibration or sensor fouling
o Corrections can be applied at a constant rate over time of the site visit interval or as
two-point corrections for non-uniform error that is prorated over time. The corrections
to the data between the start and end dates of the correction period are linearly
interpolated (Wagner and others, 2006). In some instances, a correction for calibration
drift will be held constant throughout time between site visits.
- Accuracy Rating:
o Excellent record is deemed to be accurate within 0.2 °C; good is from 0.2 to 0.5 °C; fair is
from 0.5 to 0.8 °C; and poor is more than 0.8 °C. This accuracy rating can be different for
discrete periods of record based on the combined fouling and calibration drift
corrections applied to the water-temperature record
o Rating is also based on gaps in record, number and type of corrections, professional
judgement
o Any time you work on the data, the quality rating is downgraded.
- The USGS takes daily, or down to 15-minute, observations for water temperature.
- Very expensive to do these measurements right.
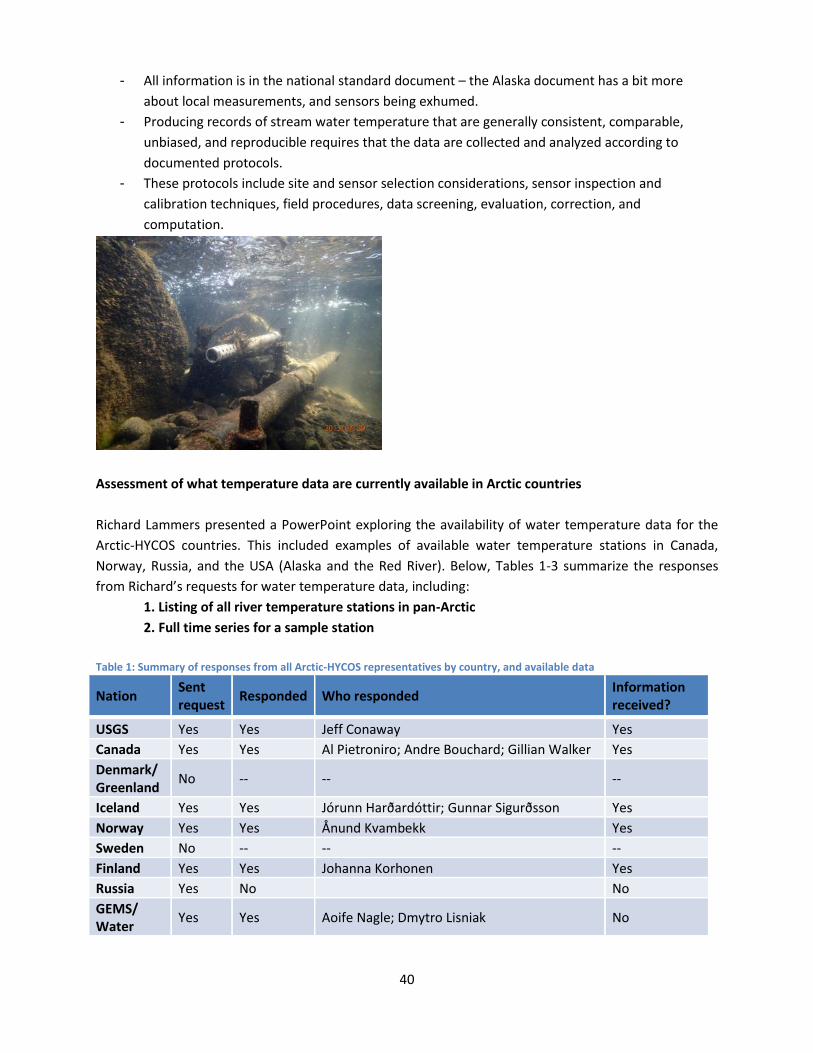
40
- All information is in the national standard document – the Alaska document has a bit more
about local measurements, and sensors being exhumed.
- Producing records of stream water temperature that are generally consistent, comparable,
unbiased, and reproducible requires that the data are collected and analyzed according to
documented protocols.
- These protocols include site and sensor selection considerations, sensor inspection and
calibration techniques, field procedures, data screening, evaluation, correction, and
computation.
Assessment of what temperature data are currently available in Arctic countries
Richard Lammers presented a PowerPoint exploring the availability of water temperature data for the
Arctic-HYCOS countries. This included examples of available water temperature stations in Canada,
Norway, Russia, and the USA (Alaska and the Red River). Below, Tables 1-3 summarize the responses
from Richard’s requests for water temperature data, including:
1. Listing of all river temperature stations in pan-Arctic
2. Full time series for a sample station
Table 1: Summary of responses from all Arctic-HYCOS representatives by country, and available data
Nation Sent request
Responded Who responded Information received?
USGS Yes Yes Jeff Conaway Yes
Canada Yes Yes Al Pietroniro; Andre Bouchard; Gillian Walker Yes
Denmark/ Greenland
No -- -- --
Iceland Yes Yes Jórunn Harðardóttir; Gunnar Sigurðsson Yes
Norway Yes Yes Ånund Kvambekk Yes
Sweden No -- -- --
Finland Yes Yes Johanna Korhonen Yes
Russia Yes No No
GEMS/ Water
Yes Yes Aoife Nagle; Dmytro Lisniak No

41
Table 2: River Temperature - Summary of station lists
Nation Number of stations Type Lat/Lon included
Real time Notes
USA 48 Rivers Yes Yes Alaska only
Canada 357 (document) or 259 (data file)
Rivers Yes Unknown
Hutchinson (2013) hourly records since late 1990s. 700,000 observations not digitally accessible. Data file has no Quebec records.
Iceland 44 Rivers and Lakes
No Yes
Norway 125 Rivers (90) Lakes (35)
Rivers and Lakes
No Yes
Finland 1 River All others are Lake
Rivers and Lakes
No Yes
Russia 20
Rivers Yes Unknown
Source: Lammers et al (2007) downstream Stations only. Underlying data is sampled 2 times per day
GEMS/ Water
32 (GEMS/Water all Russian Federation)
Rivers Yes No Station list collected in 2006. Not known if data is temperature
Table 3: River Temperature – Summary of single station data files
Nation Time step Length of record
Missing values Data range
ISO date, time
Sample station and notes
USGS Daily; Max, Min, Mean values
1971-06-24 2015-09-09
98% Mean daily values missing
Mean: 0.1 - 17.9 °C
Yes Station: 15896000 Kuparuk River near Deadhorse, AK
Canada Hourly 2012-04-25 2016-05-18
8% days missing 0.9 – 14.66 °C
Yes Station: 08ND012 Goldstream River below Old Camp Creek
Iceland Daily; All times 00:00:00
2000-11-02 2015-09-30
None; 1 value estimated
0.0 – 15.5 °C
No Station: VHM19/ V419, Dynjandisá
Norway Hourly (most on the hour, Some are off-hour)
1979-10-13 2015-11-10
Yes, sometimes for several months; Some have times with no data (46% of those at 19:00
0.97 -15.98 °C
Yes Station: 36.60.0.1003.5 Suldalslagen v/Suldalsosen
Finland Daily 1970-05-12 2015-10-28 (Lake data
37 missing values with dates, 7 data
0.0 – 23.5 °C
Yes Station: 7300100 Oulankajoki (the only Arctic river station, the

42
starts 1950)
points December to April. 50% total missing
rest are lakes)
Russia 10-day 1936-06-05 2001-10-25
Winter months 0.0 – 22.0 °C
No Station: 9803 Yenisey At Igarka
Next Steps for river temperature:
• Are we interested in river temperature or water temperature?
• Should lakes be included? Committee agrees to include them
• What time step should we aim for?
• Daily as base time step
• Consistent with river flow data
• Create a first draft pan-Arctic water temperature data set?
• Yes, where available
• All gauges rather than just one gauge for each nation
• Collect and harmonize all historical temperature data
• Identify holes in network (spatial)
• Real-time water temperature?
• Unknown
Note: The committee recognizes there is a disconnect between wanting to collect all relevant data on a
topic (i.e. water temperature), and having data that is collected to a common standard and can
therefore be brought together into a single database and therefore represents the same
conditions/state of the stream. We need to caution that within a certified Quality Management System,
we need to adhere to standards and not just publish data for the sake of publishing.
ACTION Conaway: Share water temp standards and procedures documents. Develop survey to collect
information on how water temperature is collected in each member country (metadata) i.e. daily
averaging. Include lake temperature data (see Project 8 in Annex III: Arctic-HYCOS Work Plan 2016 -
2017).
ACTION Pietroniro: Collect all water temperature data (minimum daily). Data will not be circulated at
this time (see Project 8 in Annex III: Arctic-HYCOS Work Plan 2016 - 2017: Arctic-HYCOS Work Plan 2016
- 2017).
3.9. Project 9: River/Lake Ice
A discussion on the need for recommended practices and procedures for observing river and/or lake ice
thickness was held. It was evident that not all countries have standards for collection of river and lake
temperature data. The outcome was that we could explore the possibility of adopting the USGS
approaches as recommended WMO practices and procedures for river temperature data.

43
ACTION: Committee members are to assess what river/lake ice data are available in their countries for
next meeting (see Project 9 in Annex III: Arctic-HYCOS Work Plan 2016 - 2017: Arctic-HYCOS Work Plan
2016 - 2017).
4. Overview of SWOT Satellite
John Fulton of the USGS called in via teleconference to give a PowerPoint presentation on the Surface
Water Ocean Topography (SWOT) satellite.
“The Surface Water & Ocean Topography (SWOT) mission brings together two
communities focused on a better understanding of the world's oceans and its
terrestrial surface waters. U.S. and French oceanographers and hydrologists and
international partners have joined forces to develop this new space mission to make
the first global survey of Earth's surface water, observe the fine details of the ocean's
surface topography, and measure how water bodies change over time.”
SWOT Science Goals: provide sea surface heights (SSH) and terrestrial water heights over a 120 km wide
swath and cover at least 90% of the globe.
- Over deep oceans – to provide SSH within each swath with a posting every 2 km x 2 km and a
precision not to exceed 0.8 cm when averaged over the area.
- Over land – to produce a water mask capable of resolving 100 meter wide rivers and lakes of
250 meter2 in size, wetlands, or reservoirs and associated water level elevations with an
accuracy of 10 cm and a slope accuracy of 1 cm/km.
- Launch in 2020, run time approx. 3 years. Could go longer, but that’s the target right now.
- The resulting information will be important for hydrology of ungauged regions of the planet.
- Results will help show how water storage is changing with time.
- Some variables such as baseflow cannot be estimated using SWOT. Working on some techniques
to provide information on these – using 2D perspective to generate estimates of area based on
the width and slope estimates.
Ground-based verifications: Science Orbit
- Ground-based platforms will have an important role in the validation process.
- 1-day fast orbit – intersection of orbits and USGS stream gauges will be used to calibrate.
- Some systematic errors – wind drift and wave corrections.
- John Fulton, [email protected], 303-236-6890.
Possible future ACTION: Find sites in the Arctic-HYCOS member countries to use to ground-based
SWOT? To help with the SWOT “lake issue”. Could set up a Tier 1 or 2 site in their countries. A few
more lake targets would be really helpful.
- SWOT using “tier 1” sites to provide feedback on the SWOT metrics – will have repeat passes.
Haven’t set the exact specs yet. Linked to the calibration and validation (Cal/Val) plan – not

44
ready yet. Toby Minear (University of Colorado) working on it. Canadian sites are in the Cal/Val,
but no specs yet.
- Valery (Russia): close collaboration with CNES/Legos laboratory in France for hydrological
parameters of lakes – Jean-Francois Crétaux, who is working on the SWOT mission.
ACTION: John Fulton to send .kmz or .kml file of the current e fast 1-day repeat and science orbits
- DONE. See: http://www.aviso.altimetry.fr/es/misiones/future-missions/swot/orbit.html
ACTION all: Arctic HYCOS to confirm if there are any lakes with gauges along the fast 1-day orbit path
using the kml or kmz file at the link above (see project 10 action items in Annex III: Arctic-HYCOS Work
Plan 2016 - 2017: Arctic-HYCOS Work Plan 2016 - 2017).
- Uli: Space-based technology for hydrology – a related WMO initiative that had a recent meeting
at ESA, Italy. Mainly working with France, and also Global Runoff Data Centre (GRDC).
ACTION: On Day 1, Al suggested the Committee ask John Fulton about specifications for Canadian
pressure transducers (see discussion after USA Update in section 3.1.1. of this report).
5. Development of Annual Work Plan 2016-2017
The Arctic-HYCOS committee developed a work plan for 2016-17 based on the action items and
conversations held over the two days of meetings. See the detailed plan in Annex III: Arctic-HYCOS Work
Plan 2016 - 2017.
6. Closing Remarks and Next Meeting
As the final action of the 2016 Arctic-HYCOS Project Steering Committee meeting, the Committee agreed
to adopt the Annual Work Plan for 2016-2017 (Annex III: Arctic-HYCOS Work Plan 2016 - 2017: Arctic-
HYCOS Work Plan 2016 - 2017).
The date and venue of next meeting was then discussed, with Valery Vuglinsky indicating that he will
discuss with his colleagues if they can host a 3-day meeting for Arctic-HYCOS in St. Petersburg, Russia in
early May 2017. Participants will need visas for Russia (one month in advance), so this requires some
organization. The backup suggestion is to hold the meeting in Sweden.
7. Field trip to operational streamflow station
On the third day of the Arctic-HYCOS meeting (May 26, 2016), the committee members were invited on
a tour of several operational streamflow stations run by the USGS, including some demonstrations of
USGS field techniques and streamflow monitoring activities. Jeff Conaway organized the tour, departing
at 9 am from Anchorage by bus, and returning at 2 pm.

45
The first stop on the tour was to a streamflow station on the Knik River, where the committee was able
to watch two USGS technologists operate a remote controlled boat to take ACDP (Acoustic Doppler
Current Profiler) measurements off an old bridge parallel to the current road bridge (see pictures in
Figure 22, 23 and 24).
The second stop of the day was at a streamflow station on the Matanuska River (see pictures in Figure
25 and 26). The Matanuska is a wide braided river and requires different techniques for measurements.
No technologists were on site but the Committee members got a tour of the station box, historical
analyses that Jeff had printed out about the site, and noticed the co-located climate monitoring sensors
(tipping bucket rain gauge).
For more images from the field trip, please go to the personal Flickr page: https://flic.kr/s/aHskBkdrWF
Figure 22: USGS technologists on the Knik River, May 26, 2016

46
Figure 23: USGS remote control ADCP boat and workstation on the Knik River, May 26, 2016
Figure 24: Looking at historical streamflow records on the Knik River, May 26, 2016

47
Figure 25: USGS hydrometric station on the Matanuska River, May 26, 2016
Figure 26: USGS hydrometric station on the Matanuska River, May 26, 2016

48
Meeting Adjourned!
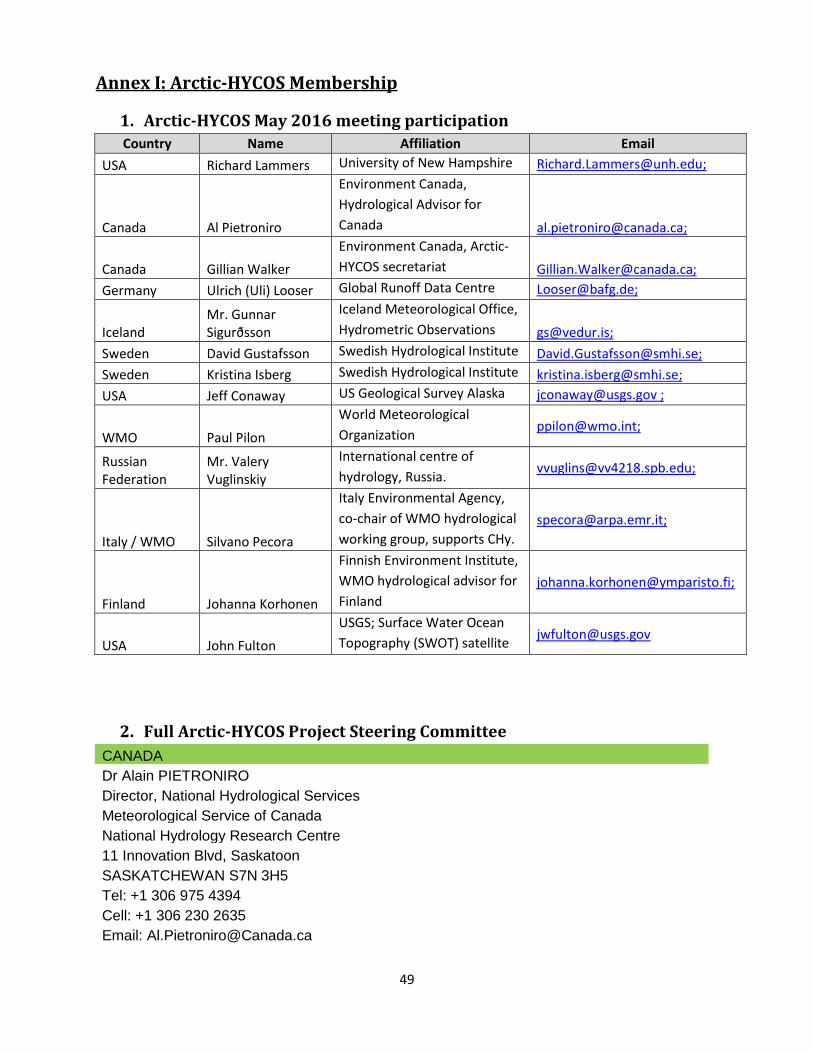
49
Annex I: Arctic-HYCOS Membership
1. Arctic-HYCOS May 2016 meeting participation
Country Name Affiliation Email
USA Richard Lammers University of New Hampshire [email protected];
Canada Al Pietroniro
Environment Canada,
Hydrological Advisor for
Canada [email protected];
Canada Gillian Walker
Environment Canada, Arctic-
HYCOS secretariat [email protected];
Germany Ulrich (Uli) Looser Global Runoff Data Centre [email protected];
Iceland Mr. Gunnar Sigurðsson
Iceland Meteorological Office,
Hydrometric Observations [email protected];
Sweden David Gustafsson Swedish Hydrological Institute [email protected];
Sweden Kristina Isberg Swedish Hydrological Institute [email protected];
USA Jeff Conaway US Geological Survey Alaska [email protected] ;
WMO Paul Pilon
World Meteorological
Organization [email protected];
Russian Federation
Mr. Valery Vuglinskiy
International centre of
hydrology, Russia. [email protected];
Italy / WMO Silvano Pecora
Italy Environmental Agency,
co-chair of WMO hydrological
working group, supports CHy.
Finland Johanna Korhonen
Finnish Environment Institute,
WMO hydrological advisor for
Finland
USA John Fulton
USGS; Surface Water Ocean
Topography (SWOT) satellite [email protected]
2. Full Arctic-HYCOS Project Steering Committee
CANADA
Dr Alain PIETRONIRO
Director, National Hydrological Services
Meteorological Service of Canada
National Hydrology Research Centre
11 Innovation Blvd, Saskatoon
SASKATCHEWAN S7N 3H5
Tel: +1 306 975 4394
Cell: +1 306 230 2635
Email: [email protected]

50
Arctic-HYCOS Secretariat
Ms Gillian WALKER
National Hydrological Services
Meteorological Service of Canada
Environment and Climate Change Canada
373 Sussex Drive, Room 124
Ottawa, ON
K1A OH3
Tel: +1 613 992-3604
Email: [email protected]
RUSSIAN FEDERATION
Prof. Valery VUGLINSKY
Deputy Director for Science
State Hydrological Institute
2nd Line 23
ST PETERSBURG 199053
Tel: +781 23233458
Fax: +781 23231028
Email: [email protected]
SWEDEN
Mr David GUSTAFSSON
SMHI / Swedish Meteorological and Hydrological Institute
SE - 601 76 NORRKÖPING
Tel : +46 (0)11 495 86 74
Email : [email protected]
Web: www.smhi.se
Ms Kristina ISBERG
SMHI - Swedish Meteorological and Hydrological Institute
S-601 76 Norrkyping
Sweden
Tel: +46 11 495 8729
Email: [email protected]
Ms Berit ARHEIMER
SMHI / Swedish Meteorological and Hydrological Institute
SE - 601 76 NORRKÖPING
Tel : +46 (0)11 495 82 60
Email : [email protected]
Web: www.smhi.se

51
FINLAND
Ms Johanna KORHONEN
Finnish Environment Institute (SYKE)
Mechelininkatu 34a
P.O. BOX 140
FI-00251 HELSINKI
Tel: + 358 295 251 302
Fax: + 358 954 902 590
Email: [email protected]
NORWAY
Mr Morten JOHNSRUD
Director, Hydrology Department
Norwegian Water Resources and Energy Directorate (NVE)
Middelthunsgate 29
P.O. Box 5091 Majorstua
N-0301 OSLO
Tel: +47 22959595 or +4722959202 (direct)
Cell: +47 93040340
Fax: +47 22959216
Email: [email protected]
UNITED STATES OF AMERICA
Dr Harry F. LINS
U.S. Geological Survey (USGS)
415 National Center
RESTON, VA 20192
Tel: +1 703 648 5712
Cell: +1 571 218 5077
Email: [email protected]
President of the Committee on Hydrology (CHy)
Mr Jeffrey S. CONAWAY
U.S. Geological Survey
4210 University Drive
Anchorage
ALASKA 99508-4626
Tel: 1-907-786-7041
Fax: 1-907-786-7150
Email: [email protected]
Dr Richard LAMMERS
Research Assistant Professor
University of New Hampshire

52
Earth Systems Research Center
Water Systems Analysis Group
Morse Hall, Room 211
8 College Road
DURHAM, NH 03824
Email : [email protected]
ICELAND
Dr Árni SNORRASON
Director General
Icelandic Meteorological Office
Bústaðavegur 9
IS-108 REYKJAVÍK
Tel: +354 522 60 00
Cell: +354 893 42 22
Fax: +354 522 60 01
Email: [email protected]
Dr Jórunn HARÐARDÓTTIR
Managing Director for Processing & Research
Icelandic Meteorological Office
Bústaðavegur 9
IS-108 REYKJAVÍK
Tel: +354 862 83 23
Fax: +354 522 60 01
Email: [email protected]
Mr Odinn THORARINSSON
Managing Director Observations
Icelandic Meteorological Office
Bústaðavegur 9
IS-108 REYKJAVÍK
Tel: +354 522 60 00
Cell: +354 861 94 91
Fax: +354 522 60 01
Email: [email protected]
Mr. Gunnar SIGURDSSON
Icelandic Meteorological Office
Vedurstofa Islands
Bustadavegur 7-9
Reykjavik
Tel: +354 8639972
Email: [email protected]
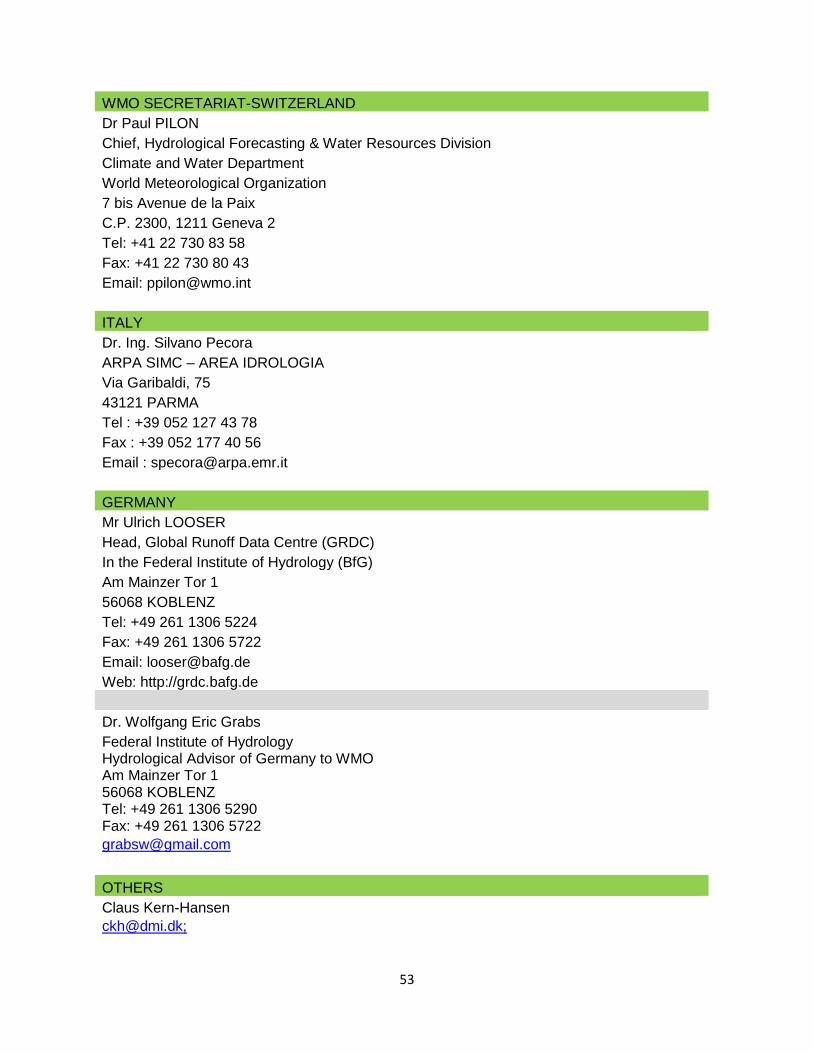
53
WMO SECRETARIAT-SWITZERLAND
Dr Paul PILON
Chief, Hydrological Forecasting & Water Resources Division
Climate and Water Department
World Meteorological Organization
7 bis Avenue de la Paix
C.P. 2300, 1211 Geneva 2
Tel: +41 22 730 83 58
Fax: +41 22 730 80 43
Email: [email protected]
ITALY
Dr. Ing. Silvano Pecora
ARPA SIMC – AREA IDROLOGIA
Via Garibaldi, 75
43121 PARMA
Tel : +39 052 127 43 78
Fax : +39 052 177 40 56
Email : [email protected]
GERMANY
Mr Ulrich LOOSER
Head, Global Runoff Data Centre (GRDC)
In the Federal Institute of Hydrology (BfG)
Am Mainzer Tor 1
56068 KOBLENZ
Tel: +49 261 1306 5224
Fax: +49 261 1306 5722
Email: [email protected]
Web: http://grdc.bafg.de
Dr. Wolfgang Eric Grabs
Federal Institute of Hydrology Hydrological Advisor of Germany to WMO Am Mainzer Tor 1 56068 KOBLENZ Tel: +49 261 1306 5290 Fax: +49 261 1306 5722
OTHERS
Claus Kern-Hansen

54
Tommaso Abrate
World Meteorological Organization
Germany

55
Annex II: Meeting Agenda
DRAFT AGENDA
ARCTIC-HYCOS 3rd Project Steering Committee Meeting Anchorage, Alaska, USA, May 24 – 26, 2016
U.S. Geological Survey Alaska Science Center, 4210 University Dr. Anchorage, Alaska 99508
24th May 2016 Purpose of the session on Day 1 is to assess progress on the Annual Work Plan 2015-2016 and to address issues/questions on data acquisition and exchange. 09:00 – 09:30 Coffee, Fruit/biscuits provided 09:30 – 10:00 Introduction and Welcome (Jeff Conaway & Alain Pietroniro) 10:00 – 10:15 Meeting objectives and adoption of the agenda (Alain Pietroniro) Review of Work Plan1 Progress April 2015-March 2016 10:15 – 12:00 Projects 1 and 2: Network Design for “Flow to Ocean” Stations and
Network Design for Stations “Representative of Hydrological Regime” – Finalize Lists of Active and Discontinued Stations - update (Alain Pietroniro & Richard Lammers) – Roundtable: Network update (by country- maximum 10 minutes
each) o Canada: update (Alain Pietroniro) o USA: update (Jeffrey Conaway) o Iceland: update (Jórunn Harðardóttir) o Finland: update (Johanna Korhonen) o Norway: update (Morten Johnsrud) o Russian Federation: update (Valery Vuglinsky)
– Open discussion (all)
12:00 – 13:00 Lunch Provided
13:00 – 13:45 Project 3: Interim Arctic-HYCOS Database – 3.1 GRDC to create Arctic-HYCOS subset database (Ulrich Looser &
Richard Lammers)
1 Please refer to the Final Report of the Arctic-HYCOS Project Steering Committee Meeting, Annex III, held in
Reykjavik, Iceland, 23-24 March 2015.

56
– 3.2 Potential for web service under GRDC as Arctic Pilot (Ulrich Looser & Richard Lammers)
– Potential to add “real time” (continuous) data to the database (Pietroniro)
13:45 – 14:30 Open discussion on 3.1 and 3.2 (Alain Pietroniro) – all 14:30 – 14:45 Update on Arctic-HYCOS website (contents, updates, links etc.)
prepared by Richard Lammers: http://arctic-hycos.net 14:45 – 15:15 Health Break (Coffee, fruit/biscuits provided) 15:15 – 17:00 Project 4: WHOS and WaterML2.0 Standard Prototype (Harry Lins &
Silvano Pecora) – Determine basic mediator/attribute questions – NHSs to provide such metadata – Each NHS reviews GAGES approach of 27 attributes – Investigate and report on any WHOS/WIS solution for Arctic-HYCOS – Develop pilot application to demonstrate solution for Arctic-HYCOS – Note 4.1 to 4.4 by end of March 2016; Deadline for 4.5 TBD
17:00 Wrap up
25th May 2016 Purpose of the session on Day 2 is to continue assessing progress on the Work Plan 2015-2016 and develop the Work Plan for April 2016-March 2017. 08:30 – 09:00 Coffee, fruit/biscuits provided 09:00 – 09:15 Review of Day 1 (Alain Pietroniro) Review of Work Plan Progress April 2015-March 2016 (continued) 09:15 – 9:45 Project 5: Under Ice Operational Practices and Procedures (Alain
Pietroniro & All) – Share and develop under ice standards/methods – Update of Pelletier et al 1990 article (Alain Pietroniro) – Prepare outline of WMO document for measuring discharge under
ice (Jeff Conaway) – Open discussion (all)
9:45 – 10:15 Project 6: Reporting of Arctic-HYCOS Activities
– 6.1 Prepare poster for use at events/slides (Alain Pietroniro – slides; David Gustafsson & Berit Arheimer - poster)
– 6.2 All members provide list of Arctic activities for use at Cg-15 and EC-PORS (All)

57
10:15 –11:45 Project 7: Application of Hydrological Modelling and Prediction - Arctic-HYPE application (David Gustafsson) – progress report – Group discussions: split into two groups to review the current
Arctic-HYPE model setup, results and inputs. – Summary discussion and path forward.
11:45 – 12:00 Overview of SWOT (Surface Water Ocean Topography) satellite (John
Fulton, USGS) 12:00 – 13:00 Lunch Provided Development of Annual Work Plan April 2015-March 2016 12:30 –13:00 Project 8: Water Temperature Data
– 8.1 All members to review USGS procedures for river temperature – discussion (Jeff & All)
– 8.2 Assess what temperature data are available in Arctic countries (Richard Lammers)
– Open Discussion on need for recommended practices and procedures for observing river temperature (All)
13:00 –13:15 Project 9: River/Lake Ice
– Members to assess what river/lake ice data are available in their countries for next meeting (All)
– Open Discussion on need for recommended practices and procedures for observing river/lake ice thickness (All)
13:15 – 15:30 Development of Annual Work Plan 2016-2017
– Project priorities and leads o Deliverables, milestones and their status o Formation of working groups (if needed)
15:30 – 16:00 Health Break (coffee, fruit/biscuits provided) 16:00 – 16:15 Adoption of Annual Work Plan 2016-2017 16:15 – 16:30 Date and venue of next meeting 16:30 – 17:00 Summary, meeting report and closing remarks 26th May 2016 Field trip to operational streamflow station. Transportation provided. 09:00 Depart for field trip from hotel Travel 1-hour to Knik and Matanuska Rivers. Demonstration of USGS field techniques and streamflow monitoring activities. 14:00 Arrival back in Anchorage

58
Annex III: Arctic-HYCOS Work Plan 2016 - 2017
# Project Name Objective Project Lead Deliverable and milestones
2016-17
1 Network Design for “Flow to Ocean” Stations
Compile and finalize list of Active Flow-to-Ocean Gauges
Al/Richard Complete.
A) Missing data or metadata: Lat/long and drainage
areas have been gathered; work is mostly
complete. See Project 4, below, for required
extended metadata.
2 Network Design for Stations “Representative of Hydrological Regime”
Compile and finalize list of Active and Discontinued gauges for hydrology network
Al/Richard Complete. Same action as for Project #1.
3a Arctic-HYCOS database
Creation of database and making data freely available
GRDC with assistance of Richard
A) ACTION Looser: GRDC to finalize database based
on station lists (flags for network 1 and 2) and
update on an ongoing basis. GRDC to collect
directly from each country, including lat/long,
basin size, altitude, station name.
B) ACTION Looser: Register the new Arctic-HYCOS
station list with the GEOSS and WIS portals.
C) DECISION to include both water level and
discharge time series data in database.
D) DECISION to include Greenland stations in Arctic-
HYCOS. Note: time series length is not that long,
starting in 2006 and 1996 (to spring 2015,
currently).
3b Arctic-HYCOS website
- Use WMO WHYCOS domain (reports already there)
- Link to GRDC for data
Pilon / Pietroniro / Lammers
A) ACTION Pilon and Pietroniro: check with WMO
on how best to set up Arctic-HYCOS website.

59
# Project Name Objective Project Lead Deliverable and milestones
2016-17
- Link to Arctic-HYPE model, results etc.
- Links to NHSs and/or WHOS
Look into the suitability/capability of the WHCOS
site to host the full feature Arctic-HYCOS
website.
B) ACTION Lammers: keep domain name but have it
link directly to WHYCOS site.
4 Metadata / attributes
- Creation of database and making data freely available
- Develop WHOS WaterML2.0 standard prototype application
- Develop list of attributes as metadata to enable intelligent searching of Arctic-HYCOS basins
- Standard station metadata to
consider: Drainage area, lat/long, station names, elevation, river name
- Draft Attributes for each data point (extended metadata): o Quality – create a flag
based on USGS standard o All countries to contribute
a vector shapefile of station drainage areas
o Regulation: Flag all Arctic-HYCOS stations as “no significant regulation” vs “regulated”.
o Flag significant land use changes
All / Pecora / Gustaffson / Isberg / Pietroniro
A) ACTION Pecora: mediator to hold the attribute
data once we define a list.
B) ACTION All: Review reference documents -
o Documents on WIGOS metadata standard:
http://www.wmo.int/pages/prog/www/wigos
/documents/Cg-17/Cg-17-d04-2-2(3)-add1-
MANUAL-ON-WIGOS-approved_en.docx
o USGS “GAGES II: Geospatial attributes of Gages for Evaluating Streamflow”
http://water.usgs.gov/GIS/metadata/usgswrd/XML/gagesII_Sept2011.xml
ftp://ftpext.usgs.gov/pub/er/va/reston/NAWQA_ENS/GIS_DATA/gages/gagesii-updates/gagesII_sept30_2011_report.docx
o Additional information about attributes: http://www.reformrivers.eu/
C) ACTION: Members to provide Gillian Walker a list
of 3-4 attributes that are most important for
selecting potential stations based on: GAGES II,
the existing list from the WIGOS metadata
standard, or other input.
DEADLINE: December 15, 2016.
D) ACTION Pietroniro: send email to all members to
confirm attributes list & review metadata.

60
# Project Name Objective Project Lead Deliverable and milestones
2016-17
E) ACTION Isberg / Gustafsson: Send the table of
“Data possible to download” (national
databases), and a list of metadata needed for the
Arctic-HYPE model.
o Need a clear definition of what the
drainage area refers to.
o Reference height of the stations,
ellipsoid used (depth of the water
column / water surface height tied to a
known datum).
F) ACTION All: All members to check the WHOS
map, and send email to [email protected] if any
corrections are required
(http://www.wmo.int/pages/prog/hwrp/chy/wh
os/).
G) ACTION Pecora: Circulate Water ML 2.0 Part 2 of
the WHOS project to the members, for review
and comment. Report back at the 2017 Arctic-
HYCOS meeting.
H) ACTION Pecora: Ensure pilot application to
demonstrate solution for Arctic-HYCOS including
selection via attributes
Deadline items A-F end of April 2017; Deadline for item “G” to be determined
5 Under Ice Operational Practices and Procedures
Share and develop under ice standards/methods - all members
Pietroniro / Conaway
A) ACTION Walker: circulate Canadian SOP by Paul Campbell. (DONE - included with report from 2016 meeting, see Annex IV.)
B) ACTION Conaway: circulate survey to all members
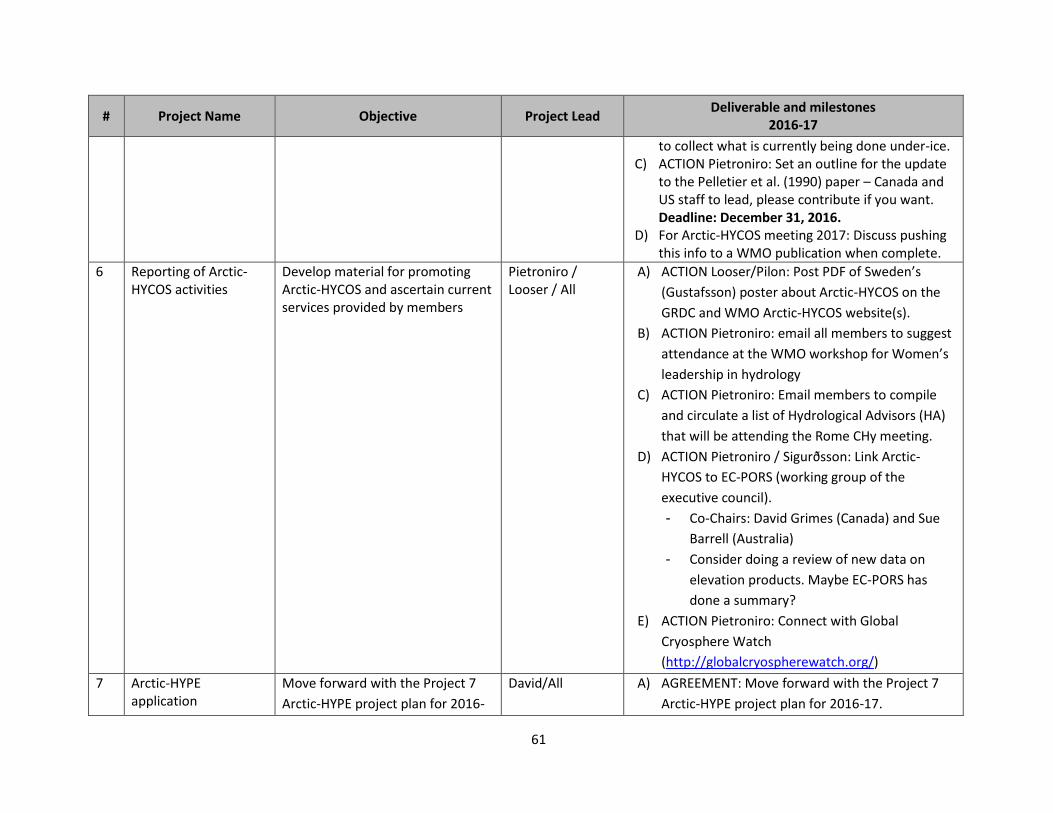
61
# Project Name Objective Project Lead Deliverable and milestones
2016-17
to collect what is currently being done under-ice. C) ACTION Pietroniro: Set an outline for the update
to the Pelletier et al. (1990) paper – Canada and US staff to lead, please contribute if you want. Deadline: December 31, 2016.
D) For Arctic-HYCOS meeting 2017: Discuss pushing this info to a WMO publication when complete.
6 Reporting of Arctic-HYCOS activities
Develop material for promoting Arctic-HYCOS and ascertain current services provided by members
Pietroniro / Looser / All
A) ACTION Looser/Pilon: Post PDF of Sweden’s
(Gustafsson) poster about Arctic-HYCOS on the
GRDC and WMO Arctic-HYCOS website(s).
B) ACTION Pietroniro: email all members to suggest
attendance at the WMO workshop for Women’s
leadership in hydrology
C) ACTION Pietroniro: Email members to compile
and circulate a list of Hydrological Advisors (HA)
that will be attending the Rome CHy meeting.
D) ACTION Pietroniro / Sigurðsson: Link Arctic-
HYCOS to EC-PORS (working group of the
executive council).
- Co-Chairs: David Grimes (Canada) and Sue
Barrell (Australia)
- Consider doing a review of new data on
elevation products. Maybe EC-PORS has
done a summary?
E) ACTION Pietroniro: Connect with Global
Cryosphere Watch
(http://globalcryospherewatch.org/)
7 Arctic-HYPE application
Move forward with the Project 7
Arctic-HYPE project plan for 2016-
David/All A) AGREEMENT: Move forward with the Project 7
Arctic-HYPE project plan for 2016-17.

62
# Project Name Objective Project Lead Deliverable and milestones
2016-17
17 (see Gustafsson powerpoint).
B) ACTION Gustafsson: Request digital drainage
area files / vectors from member countries for
the 427 Arctic-HYCOS stations.
Deadline to return files: May 2017.
C) ACTION Gustafsson / Pecora: Evaluate role of the
Arctic-HYPE model (hindcast vs forecasts, gauged
vs ungauged…). What is the most appropriate
portal (WHOS broker, WMO CHy, only Arctic-
HYCOS)? Deadline: to be determined, report
back at the next annual meeting (May 2017).
D) ACTION Walker: Circulate Bruce Davison’s paper
on parametrization for non-contributing areas.
(DONE - included with report from 2016 meeting,
see Annex IV.)
E) ACTION Lammers and Pietroniro: Assess
feasibility of other possibilities for estimating
ungauged flow.
Deadline: May 2017.
F) ACTION All: Flag all Arctic-HYCOS stations as “no
significant regulation” or “regulated”.
G) See project 4 for action for Gustafsson to
circulate list of metadata needed for Arctic-HYPE
8 Water Temperature Data
Create database of water temperature data for all Arctic-HYCOS “flow to ocean” stations (or as many stations as each country would like to contribute). Consider possible lake temperature data as well.
Conaway / Pietroniro
A) ACTION Conaway: Share water temp standards
and procedures documents. Develop survey to
collect information on how water temperature is
collected in each member country (metadata) i.e.
daily averaging. Include lake temperature data.
Deadline: May 2017.

63
# Project Name Objective Project Lead Deliverable and milestones
2016-17
B) ACTION Pietroniro: Collect all water temperature
data (minimum daily). Data will not be circulated
at this time.
Deadline: TBD
9 River/Lake Ice Create database of available river and lake ice – ice on/off dates and eventually ice thickness.
All / Pietroniro / Conaway
A) ACTION All: report back at next meeting on
possible Ice-On/Ice-Off Dates database (rivers
only for the Arctic-HYCOS stations).
B) ACTION Pietroniro: Email member countries for
the data.
C) ACTION Conaway: Bring together procedures
from all member countries for ice thickness.
10 *new* Support the SWOT Mission
http://swot.jpl.nasa.gov/mission/
Provide lake level and stream level
data to SWOT mission and derive
discharge data from mission data
to assess performance of
approaches.
Gustafsson A) ACTION All: Review SWOT details.
B) ACTION Pietroniro to contact John Fulton for the
SWOT .kmz file and circulate to the committee.
DONE, see:
http://www.aviso.altimetry.fr/es/misiones/futur
e-missions/swot/orbit.html
C) ACTION All: Arctic-HYCOS members to consider if
there are any lakes with gauges along the fast 1-
day orbit path using the kmz file at the link
above.
Deadline: May 2017 meeting
Agenda item for 2017 meeting: Water Surface
Elevation pilot for SWOT satellite. Al may contact
Valery and Johanna for lake data.
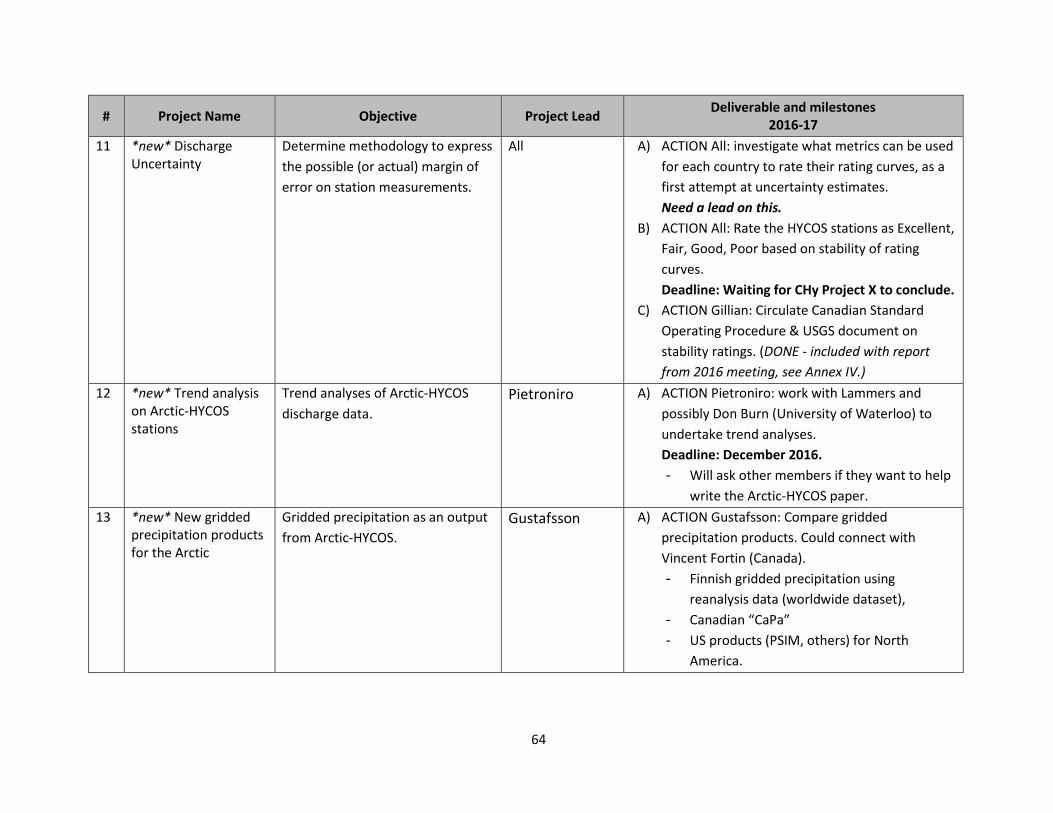
64
# Project Name Objective Project Lead Deliverable and milestones
2016-17
11 *new* Discharge Uncertainty
Determine methodology to express
the possible (or actual) margin of
error on station measurements.
All A) ACTION All: investigate what metrics can be used
for each country to rate their rating curves, as a
first attempt at uncertainty estimates.
Need a lead on this.
B) ACTION All: Rate the HYCOS stations as Excellent,
Fair, Good, Poor based on stability of rating
curves.
Deadline: Waiting for CHy Project X to conclude.
C) ACTION Gillian: Circulate Canadian Standard
Operating Procedure & USGS document on
stability ratings. (DONE - included with report
from 2016 meeting, see Annex IV.)
12 *new* Trend analysis on Arctic-HYCOS stations
Trend analyses of Arctic-HYCOS
discharge data.
Pietroniro A) ACTION Pietroniro: work with Lammers and
possibly Don Burn (University of Waterloo) to
undertake trend analyses.
Deadline: December 2016.
- Will ask other members if they want to help
write the Arctic-HYCOS paper.
13 *new* New gridded precipitation products for the Arctic
Gridded precipitation as an output
from Arctic-HYCOS.
Gustafsson A) ACTION Gustafsson: Compare gridded
precipitation products. Could connect with
Vincent Fortin (Canada).
- Finnish gridded precipitation using
reanalysis data (worldwide dataset),
- Canadian “CaPa”
- US products (PSIM, others) for North
America.

65
Annex IV: Documents for Circulation
Meeting Presentations:
All presentations from the May 2016 meeting, as well as this report, are available for download on the WMO website at: http://www.whycos.org/whycos/projects/under-implementation/arctic-hycos
Report (direct link): http://www.whycos.org/whycos/documents/Arctic-HYCOS_Meeting_May_2016_FINAL_REPORT.pdf
Day 1:
Day 1_1_Pietroniro_Hycos Overview
Day 1_3.1.1_Canada_Wsc_north
Day 1_3.1.1_Finland_ArcticHYCOS_Finland_24052016_short
Day 1_3.1.1_Iceland_arctic_hycos_2016_iceland
Day 1_3.1.1_USA_USGS-Arctic-HYCOS_Anchorage-Overview
Day 1_3.1.2_Lammers-HYCOS4Presentation-NetworkDesign-2016-05-Final
Day 1_3.2_Looser_2016-05_GRDC_Arctic-HYCOS
Day 1_3.4_Pecora_WMO_Arctic_WHOS
Day 2:
Day 2_3.5_Conaway_ICE and Water Temp
Day 2_3.6_reporting - arctic_hycos_2016_iceland
Day 2_3.6_Reporting of Arctic-HYCOS Activities
Day 2_3.7_ArcticHYPEpres_20160525_ArcticHYCOS_Anchorage_D_K_Final
Day 2_3.8_Lammers-HYCOS4Presentation-RiverTemperatureSurvey-2016-05-Final
Day 2_4_John Fulton SWOT presentation to ArcticHYCOSMtg_25May2016
Note: numbering system refers to sections in this report, not project numbers.
Documents circulated to Steering Committee members:
1) Interim version v1.01 of the WIGOS Metadata Standard (WMDS):
“WMDS_1.01_Interim_Version_03052016.docx”
The official version of the approved WMDS v1.0 (Congress-17, 2015) is still to be published by WMO, meanwhile the "near final" version of that v1.0 can be found at: http://www.wmo.int/pages/prog/www/wigos/documents/WIGOS-RM/1160_en.pdf#page=49
2) qSOP-NA041-03-2015 under-ice discharge measurements using ADCPs.pdf
3) qSOP-NA046-01-2015 Mid-section open water measurements using ADCPs.pdf
4) Paper from Bruce Davison on non-contributing areas: Mekonnen et al., 2014. Towards and
improved land surface scheme for prairie landscapes. Journal of Hydrology, 511, 16, pp. 105-
116. http://www.sciencedirect.com/science/article/pii/S0022169414000262
5) Paper from Richard Lammers on Arctic drainage – not yet published, not circulated at this time.
6) Copy of Data Request acc to HYCOS steering committee meeting 20160524-26.xls

66
7) Discharge Uncertainty (various documents via WSC):
Kiang et al 2016 RiverFlow uncertainty survey of USGS stations.pdf
Mason et al 2016 RiverFlow Rating curve uncertainty.pdf
Moore et al 2016 - (ASCE)HY.1943-7900 - Monte Carlo Approach for Uncertainty
Analysis of ADCP Measurement by Moving Boat.pdf
TABLE 1 Experimental Plan_2016-07-08.docx (A table Elizabeth Jamieson worked on as
part of her CHy Project X involvement, which articulates the hard to measure pieces in a
discharge measurement, and then indicates how uncertainty could be determined in
these situations. It is sort of an itemized literature review in this respect, and is provided
mostly for the compilation of references that it contains on the topic of uncertainty.)
CHy Workplan_Jul_8_2016.doc
8) WSC Rating Complexity Study:
qREC-NA060-01-2015 WSC Rating Complexity Study.pdf (Phase 1)
WSC Rating Complexity Study - Phase 2, CWRA slides ECJ2.pptx (Phase 2)
9) Environment Canada, 1999. Establishment of the Reference Hydrometric Basin Network (RHBN)
for Canada. Ottawa, ON.
Relevant hyperlinks:
10) Guidelines and standard Procedures for Continuous Water-Quality Monitors: Station Operation,
Record Computation, and Data Reporting
11) Guidelines for the Collection of Continuous Stream Water-Temperature Data in Alaska
12) USGS “Measurement and Computation of Streamflow: Volume 1. Measurement of Stage and Discharge”: https://pubs.usgs.gov/wsp/wsp2175/pdf/WSP2175_vol1a.pdf
13) Information about the USGS GAGES II program:
http://water.usgs.gov/GIS/metadata/usgswrd/XML/gagesII_Sept2011.xml
ftp://ftpext.usgs.gov/pub/er/va/reston/NAWQA_ENS/GIS_DATA/gages/gagesii-updates/gagesII_sept30_2011_report.docx
14) Link to the .kmz and .kml files of the current Surface Water Ocean Topography (SWOT) satellite fast 1-day repeat and science orbits: http://www.aviso.altimetry.fr/es/misiones/future-missions/swot/orbit.html
Recommended