APX Group Holdings, Inc. Financial and Operating Highlights
Fourth Quarter and Full Year 2013
2
Forward-Looking Statements This presentation contains “forward looking statements”, including but not limited to, statements related to the performance of our business, our financial results, our liquidity and capital resources, our plans, strategies and prospects, both business and financial and other non-historical statements. These statements are based on the beliefs and assumptions of our management. Although we believe that our plans, intentions and expectations reflected in or suggested by these forward-looking statements are reasonable, we cannot assure you that we will achieve or realize these plans, intentions or expectations. Forward-looking statements are inherently subject to risks, uncertainties and assumptions. Generally, statements that are not historical facts, including statements concerning our possible or assumed future actions, business strategies, events or results of operations, are forward-looking statements. These statements may be preceded by, followed by or include the words “believes,” “estimates,” “expects,” “projects,” “forecasts,” “may,” “will,” “should,” “seeks,” “plans,” “scheduled,” “anticipates” or “intends” or similar expressions.
Forward-looking statements are not guarantees of performance. You should not put undue reliance on these statements which speak only as of this date hereof. You should understand that the following important factors, in addition to those discussed in “Risk Factors” in the Company’s prospectus dated February 4, 2014, filed with the Securities Exchange Commission in accordance with Rule 424(b) of the Securities Act, as such factors may be updated from time to time in our periodic filings with the SEC, which are available on the SEC’s website at www.sec.gov, could affect our future results and could cause those results or other outcomes to differ materially from those expressed or implied in our forward-looking statements:
• risks of the security and home automation industry, including risks of and publicity surrounding the sales, subscriber origination and retention process;
• the highly competitive nature of the security and home automation industry and product introductions and promotional activity by our competitors;
• litigation, complaints or adverse publicity;
• the impact of changes in consumer spending patterns, consumer preferences, local, regional, and national economic conditions, crime, weather, demographic trends and employee availability;
• adverse publicity and product liability claims;
• increases and/or decreases in utility and other energy costs, increased costs related to utility or governmental requirements; and
• cost increases or shortages in security and home automation technology products or components.
In addition, the origination and retention of new subscribers will depend on various factors, including, but not limited to, market availability, subscriber interest, the availability of suitable components, the negotiation of acceptable contract terms with subscribers, local permitting, licensing and regulatory compliance, and our ability to manage anticipated expansion and to hire, train and retain personnel, the financial viability of subscribers and general economic conditions. All forward-looking statements attributable to us or persons acting on our behalf are expressly qualified in their entirety by the foregoing cautionary statements. We undertake no obligations to update or revise publicly any forward-looking statements, whether as a result of new information, future events or otherwise.
These and other factors that could cause actual results to differ from those implied by the forward-looking statements in this press release are more fully described in the “Risk Factors” section of our prospectus dated February 4, 2014. The risks described in “Risk Factors” are not exhaustive. New risk factors emerge from time to time and it is not possible for us to predict all such risk factors, nor can we assess the impact of all such risk factors on our business or the extent to which any factor or combination of factors may cause actual results to differ materially from those contained in any forward-looking statements. All forward-looking statements attributable to us or persons acting on our behalf are expressly qualified in their entirety by the foregoing cautionary statements. We undertake no obligations to update or revise publicly any forward-looking statements, whether as a result of new information, future events or otherwise.
3
Non-GAAP Financial Measures This presentation includes Adjusted EBITDA and Steady-State Free Cash Flow (“SSFCF”), which are supplemental measures that are not required by, or presented in accordance with, accounting principles generally accepted in the United States (“GAAP”). Adjusted EBITDA and SSFCF are not measurements of our financial performance under GAAP and should not be considered as an alternative to net income or any other measure derived in accordance with GAAP or as alternatives to cash flows from operating activities as a measure of our liquidity. We believe that Adjusted EBITDA provides useful information about flexibility under our covenants to investors, lenders, financial analysts and rating agencies since these groups have historically used EBITDA-related measures in our industry, along with other measures, to estimate the value of a company, to make informed investment decisions, and to evaluate a company’s ability to meet its debt service requirements. Adjusted EBITDA eliminates the effect of non-cash depreciation of tangible assets and amortization of intangible assets, much of which results from acquisitions accounted for under the purchase method of accounting. Adjusted EBITDA also eliminates the effects of interest rates and changes in capitalization which management believes may not necessarily be indicative of a company’s underlying operating performance. Adjusted EBITDA is also used by us to measure covenant compliance under the indenture governing our senior secured notes, the indenture governing our senior unsecured notes and the credit agreement governing our revolving credit facility.
We believe that SSFCF is a useful measure of pre-levered cash that is generated by the business after the cost of replacing recurring revenue lost to attrition, but before the cost of new subscribers driving recurring revenue growth. The use of SSFCF is subject to certain limitations. For example, SSFCF adjusts for cash items that are ultimately within management’s discretion to direct and therefore the measure may imply that there is less or more cash that is available for the Company’s operations than the most comparable GAAP measure.
We caution investors that amounts presented in accordance with our definition of Adjusted EBITDA and SSFCF may not be comparable to similar measures disclosed by other issuers, because not all issuers and analysts calculate Adjusted EBITDA and SSFCF in the same manner.
See Annex A of this presentation for a reconciliation of Adjusted EBITDA and SSFCF to net loss before non-controlling interest for the Company, and to income (loss) from operations for Vivint. Adjusted EBITDA should be considered in addition to and not as a substitute for, or superior to, financial measures presented in accordance with GAAP.

4
Participants
• Todd Pedersen CEO
• Alex Dunn President
• Mark Davies CFO
• Dale R. Gerard VP, Finance & Treasurer
5
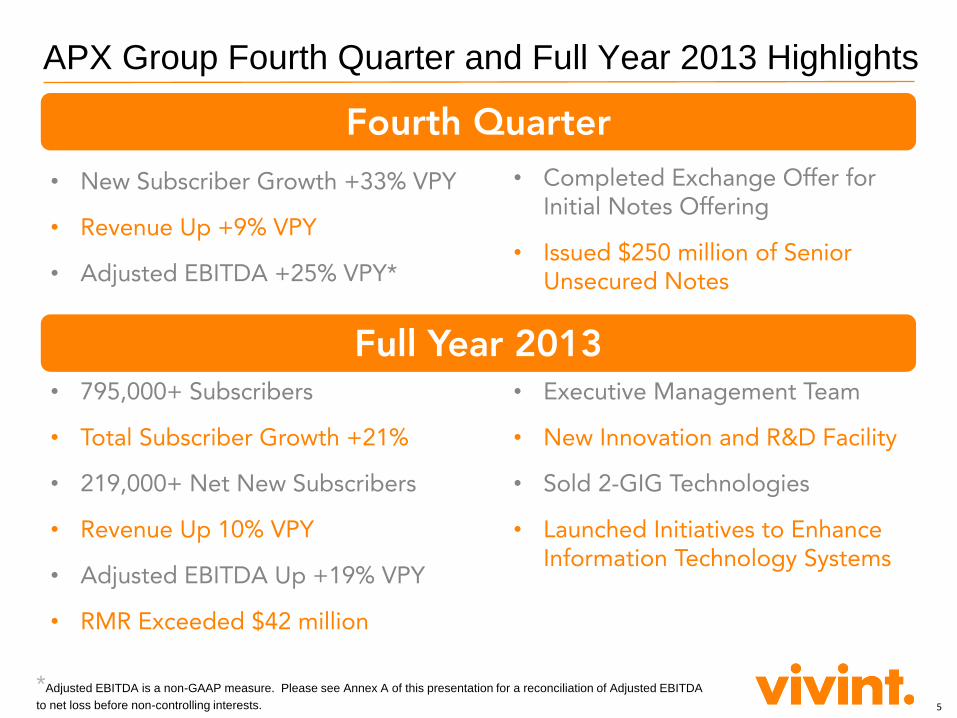
APX Group Fourth Quarter and Full Year 2013 Highlights
Fourth Quarter
• Completed Exchange Offer for Initial Notes Offering
• Issued $250 million of Senior Unsecured Notes
Full Year 2013 • 795,000+ Subscribers
• Total Subscriber Growth +21%
• 219,000+ Net New Subscribers
• Revenue Up 10% VPY
• Adjusted EBITDA Up +19% VPY
• RMR Exceeded $42 million
• New Subscriber Growth +33% VPY
• Revenue Up +9% VPY
• Adjusted EBITDA +25% VPY*
• Executive Management Team
• New Innovation and R&D Facility
• Sold 2-GIG Technologies
• Launched Initiatives to Enhance Information Technology Systems
*Adjusted EBITDA is a non-GAAP measure. Please see Annex A of this presentation for a reconciliation of Adjusted EBITDA
to net loss before non-controlling interests.
6
2012 20132012 20132012 20132012 2013
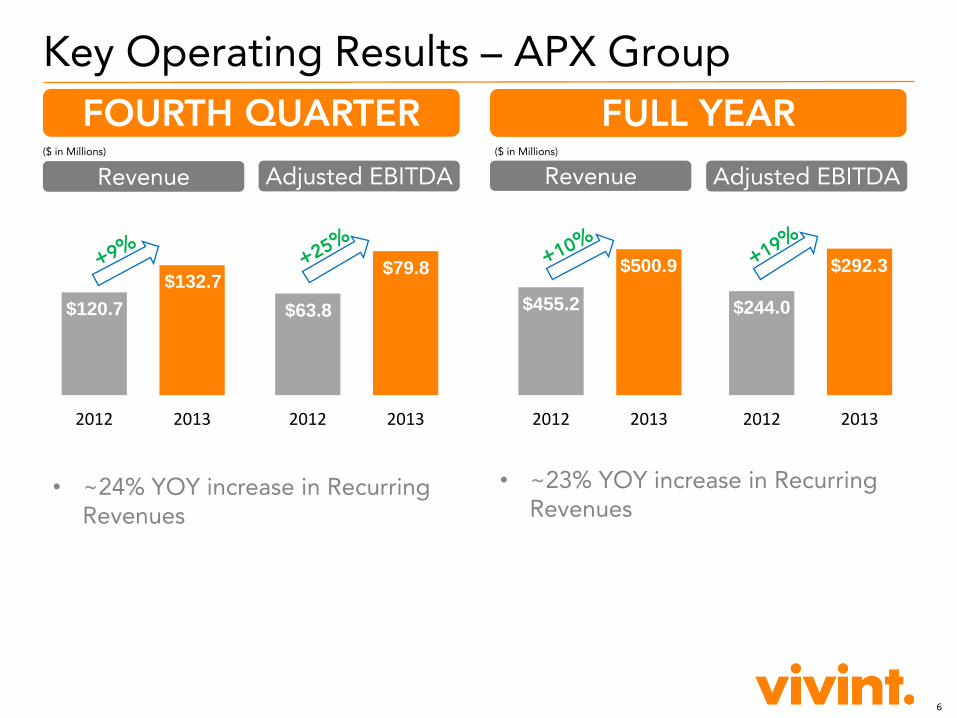
Key Operating Results – APX Group
FOURTH QUARTER
Revenue Adjusted EBITDA
FULL YEAR
Revenue Adjusted EBITDA ($ in Millions) ($ in Millions)
$455.2
$500.9
$244.0
$292.3 $132.7
$120.7 $63.8
$79.8
• ~24% YOY increase in Recurring Revenues
• ~23% YOY increase in Recurring Revenues
7
2012 2013
2012 2013
2012 2013
2012 2013
2012 20132012 2013
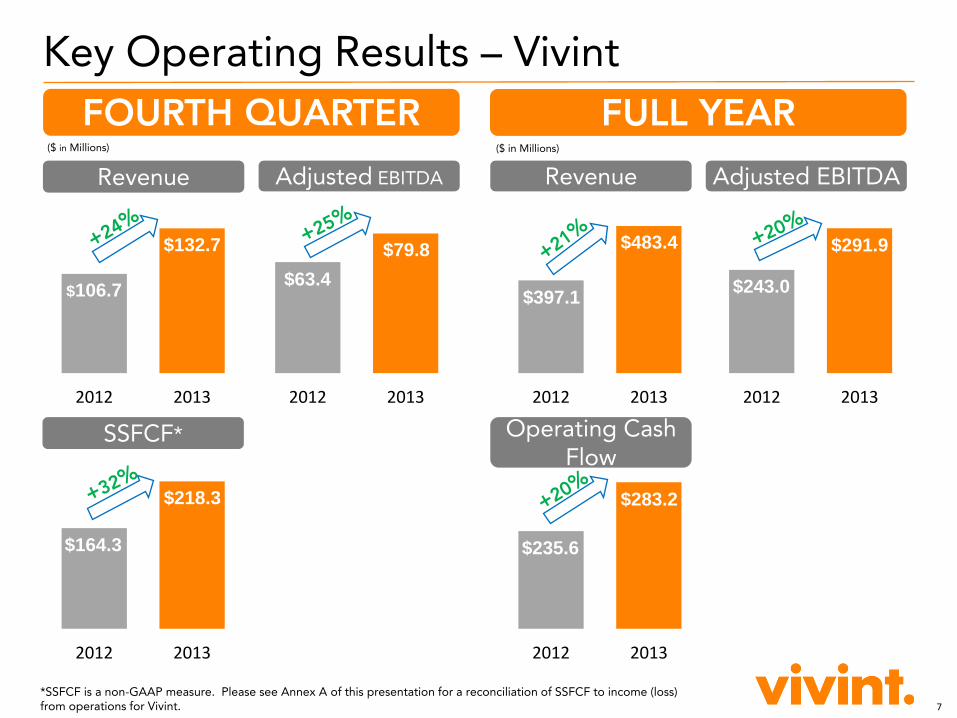
Key Operating Results – Vivint
FOURTH QUARTER
Revenue Adjusted EBITDA
*SSFCF is a non-GAAP measure. Please see Annex A of this presentation for a reconciliation of SSFCF to income (loss) from operations for Vivint.
FULL YEAR
Revenue Adjusted EBITDA
($ in Millions) ($ in Millions)
SSFCF*
$106.7
$132.7
$63.4
$79.8
$397.1
$483.4
$243.0
$291.9
Operating Cash Flow
$164.3
$218.3
$235.6
$283.2
8
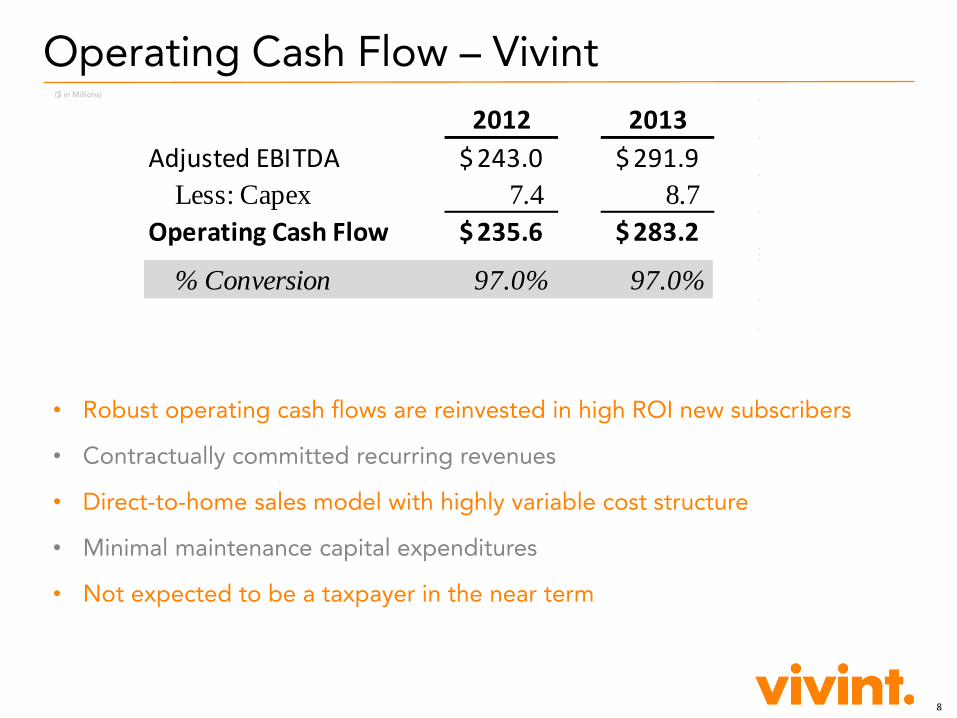
Operating Cash Flow – Vivint
• Robust operating cash flows are reinvested in high ROI new subscribers
• Contractually committed recurring revenues
• Direct-to-home sales model with highly variable cost structure
• Minimal maintenance capital expenditures
• Not expected to be a taxpayer in the near term
2012 2013
Adjusted EBITDA 243.0$ 291.9$
Less: Capex 7.4 8.7
Operating Cash Flow 235.6$ 283.2$
% Conversion 97.0% 97.0%
($ in Millions)
9
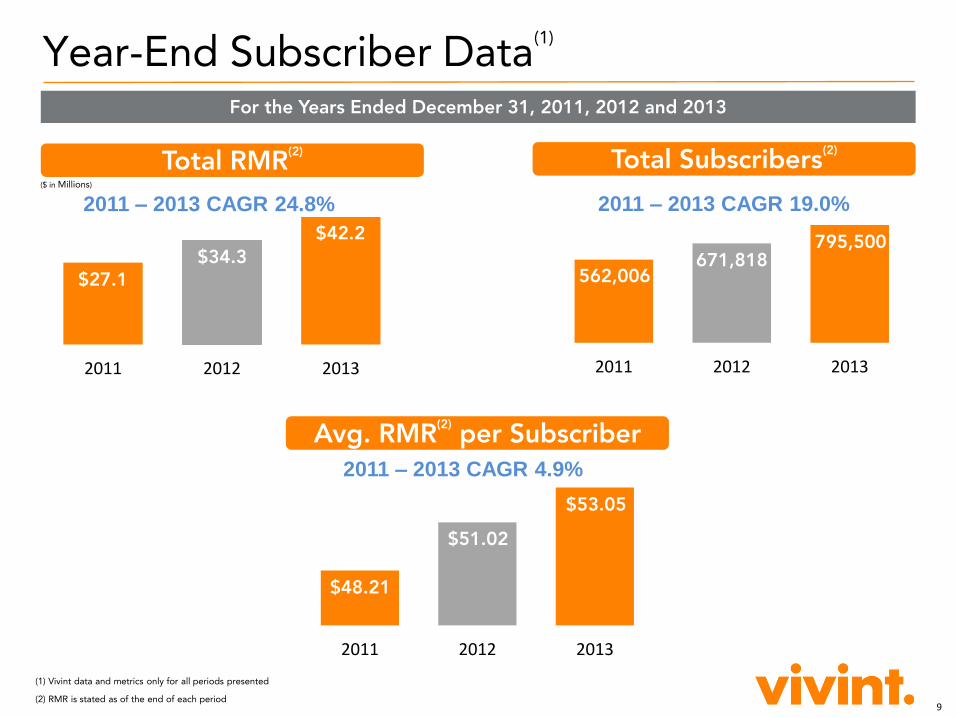
Year-End Subscriber Data(1)
For the Years Ended December 31, 2011, 2012 and 2013
(1) Vivint data and metrics only for all periods presented
(2) RMR is stated as of the end of each period
Total RMR(2)
2011 2012 2013
$27.1 $34.3
$42.2
Total Subscribers(2)
2011 2012 2013
562,006 671,818
795,500
Avg. RMR(2) per Subscriber
2011 2012 2013
$48.21
$51.02
$53.05
($ in Millions)
2011 – 2013 CAGR 24.8% 2011 – 2013 CAGR 19.0%
2011 – 2013 CAGR 4.9%
10
2011 2012 20132011 2012 2013
Direct To Home Inside Sales
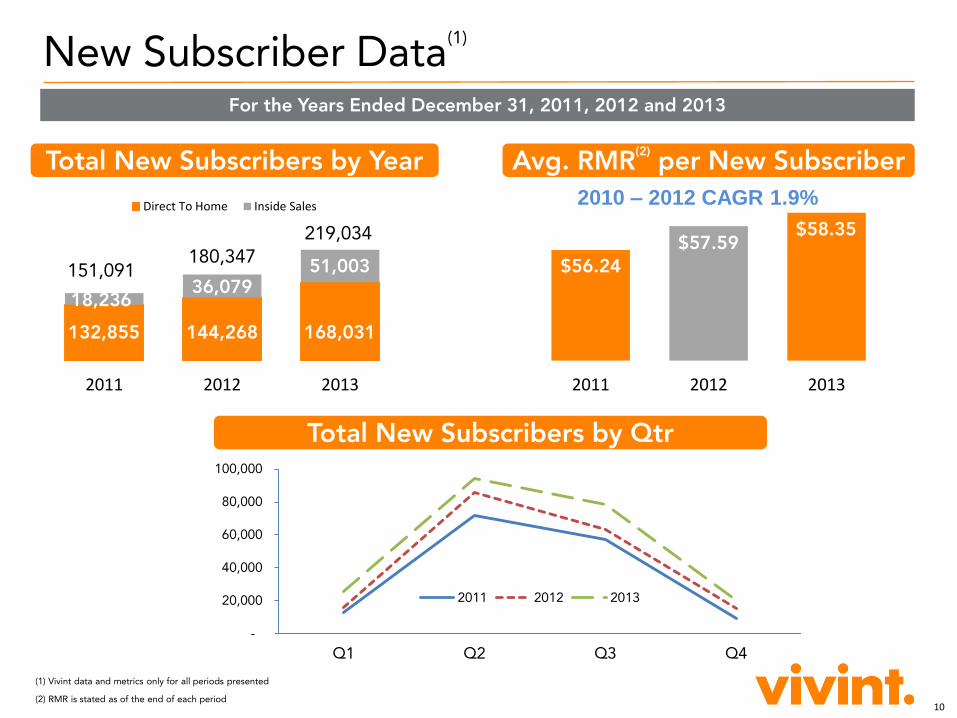
New Subscriber Data(1)
Total New Subscribers by Qtr
Avg. RMR(2) per New Subscriber Total New Subscribers by Year
For the Years Ended December 31, 2011, 2012 and 2013
132,855 144,268 168,031
18,236 36,079
51,003 151,091 180,347
219,034
(1) Vivint data and metrics only for all periods presented
(2) RMR is stated as of the end of each period
2010 – 2012 CAGR 1.9%
$56.24
$57.59 $58.35
-
20,000
40,000
60,000
80,000
100,000
Q1 Q2 Q3 Q4
2011 2012 2013
11
12/31/2
010
New
Additi
ons
Contr
act S
ales
Attr
ition
12/31/2
011
New
Additi
ons
Attr
ition
12/31/2
012
New
Additi
ons
Attr
itions
12/31/2
013
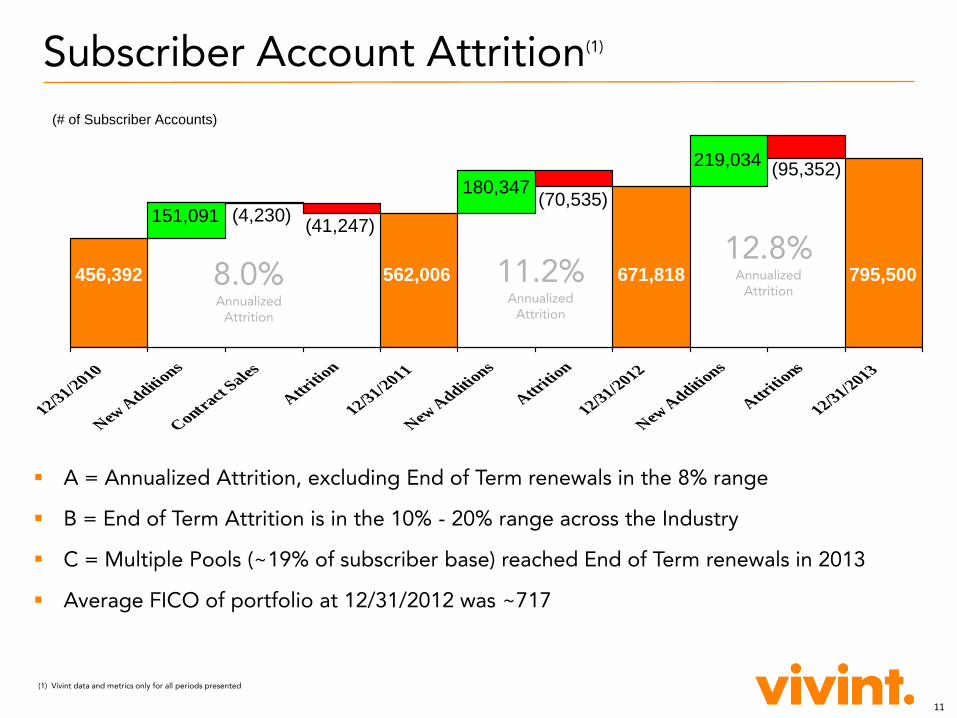
Subscriber Account Attrition(1)
12.8% Annualized
Attrition 11.2%
Annualized Attrition
8.0% Annualized
Attrition
A = Annualized Attrition, excluding End of Term renewals in the 8% range
B = End of Term Attrition is in the 10% - 20% range across the Industry
C = Multiple Pools (~19% of subscriber base) reached End of Term renewals in 2013
Average FICO of portfolio at 12/31/2012 was ~717
456,392 562,006 671,818 795,500
151,091
180,347
219,034 (95,352)
(70,535)
(41,247) (4,230)
(# of Subscriber Accounts)
(1) Vivint data and metrics only for all periods presented
12
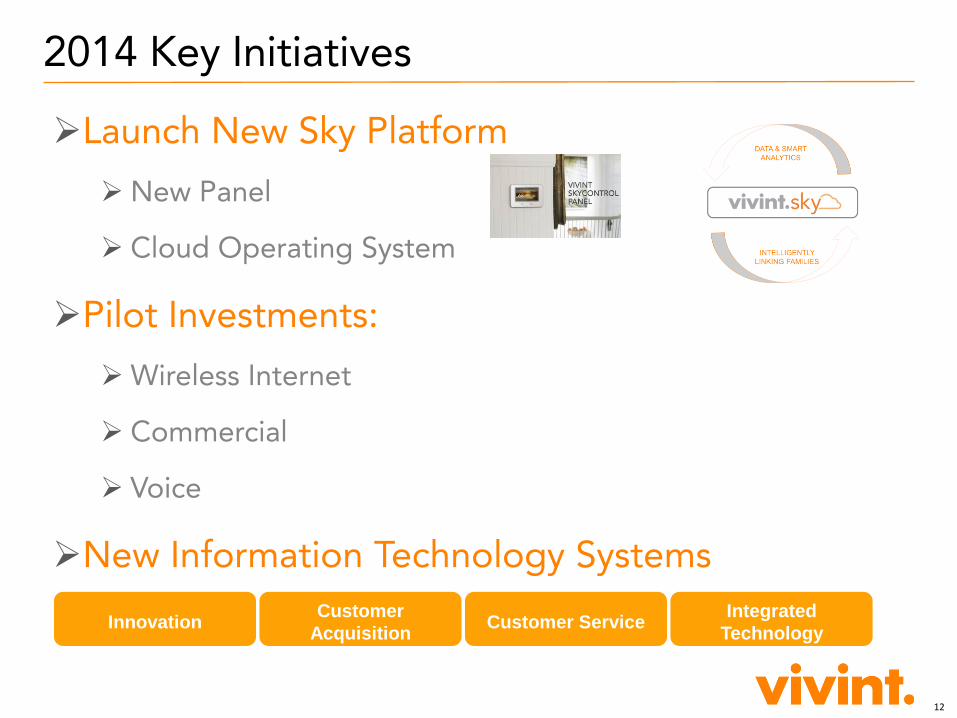
2014 Key Initiatives
Launch New Sky Platform
New Panel
Cloud Operating System
Pilot Investments:
Wireless Internet
Commercial
Voice
New Information Technology Systems
Customer Service Integrated
Technology
Customer
Acquisition Innovation

APX Group Holdings, Inc. Consolidated Financial Statements December 31, 2013, 2012 and 2011
14
Basis of Presentation On November 16, 2012, APX Group, Inc. and two of its historical affiliates, V Solar Holdings, Inc. (“Solar”) and 2GIG Technologies,
Inc. (“2GIG”), were acquired by an investor group (the “Investors”) comprised of certain investment funds affiliated with Blackstone
Capital Partners VI L.P. (“Blackstone” or the “Sponsor”), and certain co-investors and management investors. This acquisition was
accomplished through certain mergers and related reorganization transactions (collectively, the “Merger”) pursuant to which each of
APX Group, Inc., Solar and 2GIG became indirect wholly-owned subsidiaries of 313 Acquisition, LLC (“Acquisition LLC”), an entity
wholly-owned by the Investors. Upon the consummation of the Merger, APX Group, Inc. and 2GIG became consolidated
subsidiaries of APX Group, which in turn is wholly-owned by APX Parent Holdco, Inc., which in turn is wholly-owned by Acquisition
LLC, and Solar became a direct wholly-owned subsidiary of Acquisition LLC. Acquisition, LLC, APX Parent Holdco, Inc. and APX
Group have no operations and were formed for the purpose of facilitating the Merger. The unaudited consolidated statements of
operations of the Company presented below for periods subsequent to the Merger on November 16, 2012 are labeled “Successor.”
The consolidated statements of operations of APX Group, Inc. presented below for periods preceding the Merger on November 16,
2012 are labeled “Predecessor.” The unaudited consolidated statements of operations for the Successor period reflect the Merger,
presenting the results of operations of the Company and its wholly-owned subsidiaries. On April 1, 2013, the Company completed
the sale of 2GIG and its subsidiaries to Nortek, Inc. Historical results of operations include the results of 2GIG through March 31,
2013 and Solar through November 16, 2012. Prior to the sale of 2GIG and its subsidiaries to Nortek, Inc., the Company conducted
business through two segments, Vivint and 2GIG. These segments were managed and evaluated separately by management due
to the differences in their products and services. The Vivint, Inc. sections for fourth quarter and full year 2013 excludes results for
2GIG.
15
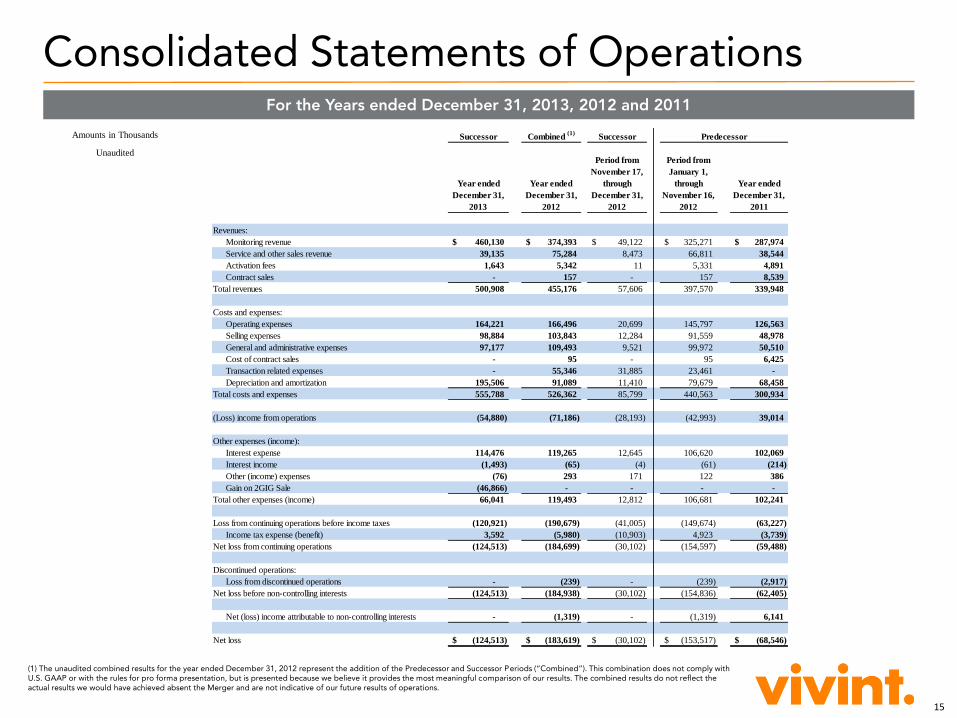
Consolidated Statements of Operations For the Years ended December 31, 2013, 2012 and 2011
Amounts in Thousands
Unaudited
(1) The unaudited combined results for the year ended December 31, 2012 represent the addition of the Predecessor and Successor Periods (“Combined”). This combination does not comply with U.S. GAAP or with the rules for pro forma presentation, but is presented because we believe it provides the most meaningful comparison of our results. The combined results do not reflect the actual results we would have achieved absent the Merger and are not indicative of our future results of operations.
Successor Combined (1)
Successor
Period from Period from
November 17, January 1,
Year ended Year ended through through Year ended
December 31, December 31, December 31, November 16, December 31,
2013 2012 2012 2012 2011
Revenues:
Monitoring revenue 460,130$ 374,393$ 49,122$ 325,271$ 287,974$
Service and other sales revenue 39,135 75,284 8,473 66,811 38,544
Activation fees 1,643 5,342 11 5,331 4,891
Contract sales - 157 - 157 8,539
Total revenues 500,908 455,176 57,606 397,570 339,948
Costs and expenses:
Operating expenses 164,221 166,496 20,699 145,797 126,563
Selling expenses 98,884 103,843 12,284 91,559 48,978
General and administrative expenses 97,177 109,493 9,521 99,972 50,510
Cost of contract sales - 95 - 95 6,425
Transaction related expenses - 55,346 31,885 23,461 -
Depreciation and amortization 195,506 91,089 11,410 79,679 68,458
Total costs and expenses 555,788 526,362 85,799 440,563 300,934
(Loss) income from operations (54,880) (71,186) (28,193) (42,993) 39,014
Other expenses (income):
Interest expense 114,476 119,265 12,645 106,620 102,069
Interest income (1,493) (65) (4) (61) (214)
Other (income) expenses (76) 293 171 122 386
Gain on 2GIG Sale (46,866) - - - -
Total other expenses (income) 66,041 119,493 12,812 106,681 102,241
Loss from continuing operations before income taxes (120,921) (190,679) (41,005) (149,674) (63,227)
Income tax expense (benefit) 3,592 (5,980) (10,903) 4,923 (3,739)
Net loss from continuing operations (124,513) (184,699) (30,102) (154,597) (59,488)
Discontinued operations:
Loss from discontinued operations - (239) - (239) (2,917)
Net loss before non-controlling interests (124,513) (184,938) (30,102) (154,836) (62,405)
Net (loss) income attributable to non-controlling interests - (1,319) - (1,319) 6,141
Net loss (124,513)$ (183,619)$ (30,102)$ (153,517)$ (68,546)$
Predecessor
16
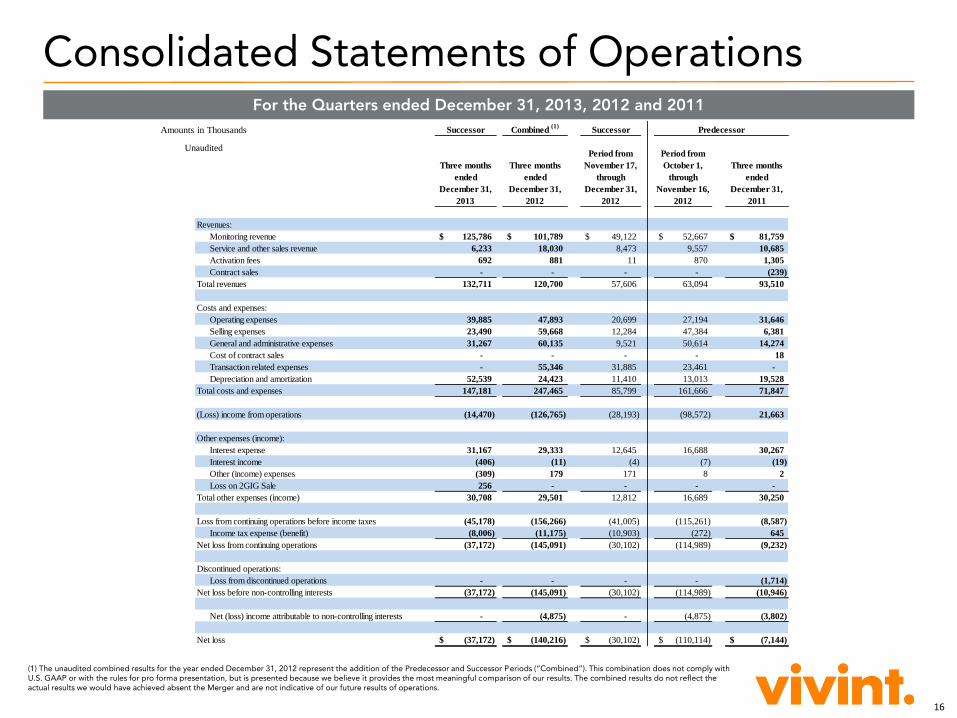
Consolidated Statements of Operations For the Quarters ended December 31, 2013, 2012 and 2011
(1) The unaudited combined results for the year ended December 31, 2012 represent the addition of the Predecessor and Successor Periods (“Combined”). This combination does not comply with U.S. GAAP or with the rules for pro forma presentation, but is presented because we believe it provides the most meaningful comparison of our results. The combined results do not reflect the actual results we would have achieved absent the Merger and are not indicative of our future results of operations.
Amounts in Thousands
Unaudited
Successor Combined (1)
Successor
Period from Period from
Three months Three months November 17, October 1, Three months
ended ended through through ended
December 31, December 31, December 31, November 16, December 31,
2013 2012 2012 2012 2011
Revenues:
Monitoring revenue 125,786$ 101,789$ 49,122$ 52,667$ 81,759$
Service and other sales revenue 6,233 18,030 8,473 9,557 10,685
Activation fees 692 881 11 870 1,305
Contract sales - - - - (239)
Total revenues 132,711 120,700 57,606 63,094 93,510
Costs and expenses:
Operating expenses 39,885 47,893 20,699 27,194 31,646
Selling expenses 23,490 59,668 12,284 47,384 6,381
General and administrative expenses 31,267 60,135 9,521 50,614 14,274
Cost of contract sales - - - - 18
Transaction related expenses - 55,346 31,885 23,461 -
Depreciation and amortization 52,539 24,423 11,410 13,013 19,528
Total costs and expenses 147,181 247,465 85,799 161,666 71,847
(Loss) income from operations (14,470) (126,765) (28,193) (98,572) 21,663
Other expenses (income):
Interest expense 31,167 29,333 12,645 16,688 30,267
Interest income (406) (11) (4) (7) (19)
Other (income) expenses (309) 179 171 8 2
Loss on 2GIG Sale 256 - - - -
Total other expenses (income) 30,708 29,501 12,812 16,689 30,250
Loss from continuing operations before income taxes (45,178) (156,266) (41,005) (115,261) (8,587)
Income tax expense (benefit) (8,006) (11,175) (10,903) (272) 645
Net loss from continuing operations (37,172) (145,091) (30,102) (114,989) (9,232)
Discontinued operations:
Loss from discontinued operations - - - - (1,714)
Net loss before non-controlling interests (37,172) (145,091) (30,102) (114,989) (10,946)
Net (loss) income attributable to non-controlling interests - (4,875) - (4,875) (3,802)
Net loss (37,172)$ (140,216)$ (30,102)$ (110,114)$ (7,144)$
Predecessor
17
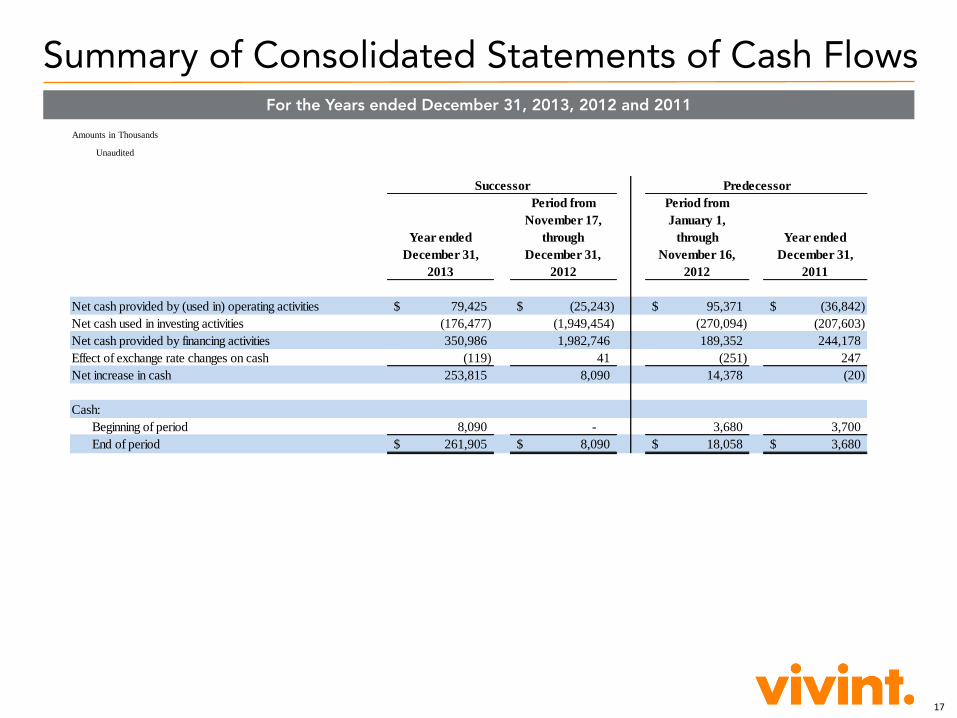
Summary of Consolidated Statements of Cash Flows For the Years ended December 31, 2013, 2012 and 2011
Amounts in Thousands
Unaudited
Period from Period from
November 17, January 1,
Year ended through through Year ended
December 31, December 31, November 16, December 31,
2013 2012 2012 2011
Net cash provided by (used in) operating activities 79,425$ (25,243)$ 95,371$ (36,842)$
Net cash used in investing activities (176,477) (1,949,454) (270,094) (207,603)
Net cash provided by financing activities 350,986 1,982,746 189,352 244,178
Effect of exchange rate changes on cash (119) 41 (251) 247
Net increase in cash 253,815 8,090 14,378 (20)
Cash:
Beginning of period 8,090 - 3,680 3,700
End of period 261,905$ 8,090$ 18,058$ 3,680$
Successor Predecessor
18
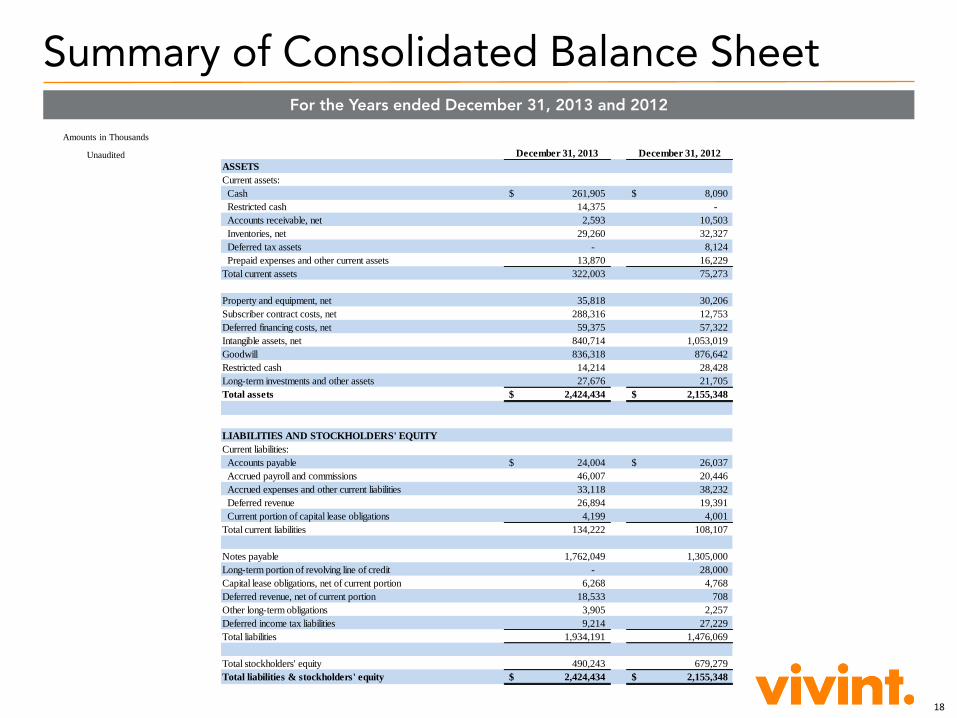
Summary of Consolidated Balance Sheet For the Years ended December 31, 2013 and 2012
Amounts in Thousands
Unaudited December 31, 2013 December 31, 2012
ASSETS
Current assets:
Cash 261,905$ 8,090$
Restricted cash 14,375 -
Accounts receivable, net 2,593 10,503
Inventories, net 29,260 32,327
Deferred tax assets - 8,124
Prepaid expenses and other current assets 13,870 16,229
Total current assets 322,003 75,273
Property and equipment, net 35,818 30,206
Subscriber contract costs, net 288,316 12,753
Deferred financing costs, net 59,375 57,322
Intangible assets, net 840,714 1,053,019
Goodwill 836,318 876,642
Restricted cash 14,214 28,428
Long-term investments and other assets 27,676 21,705
Total assets 2,424,434$ 2,155,348$
LIABILITIES AND STOCKHOLDERS' EQUITY
Current liabilities:
Accounts payable 24,004$ 26,037$
Accrued payroll and commissions 46,007 20,446
Accrued expenses and other current liabilities 33,118 38,232
Deferred revenue 26,894 19,391
Current portion of capital lease obligations 4,199 4,001
Total current liabilities 134,222 108,107
Notes payable 1,762,049 1,305,000
Long-term portion of revolving line of credit - 28,000
Capital lease obligations, net of current portion 6,268 4,768
Deferred revenue, net of current portion 18,533 708
Other long-term obligations 3,905 2,257
Deferred income tax liabilities 9,214 27,229
Total liabilities 1,934,191 1,476,069
Total stockholders' equity 490,243 679,279
Total liabilities & stockholders' equity 2,424,434$ 2,155,348$

APX Group Holdings, Inc. Annex A
20
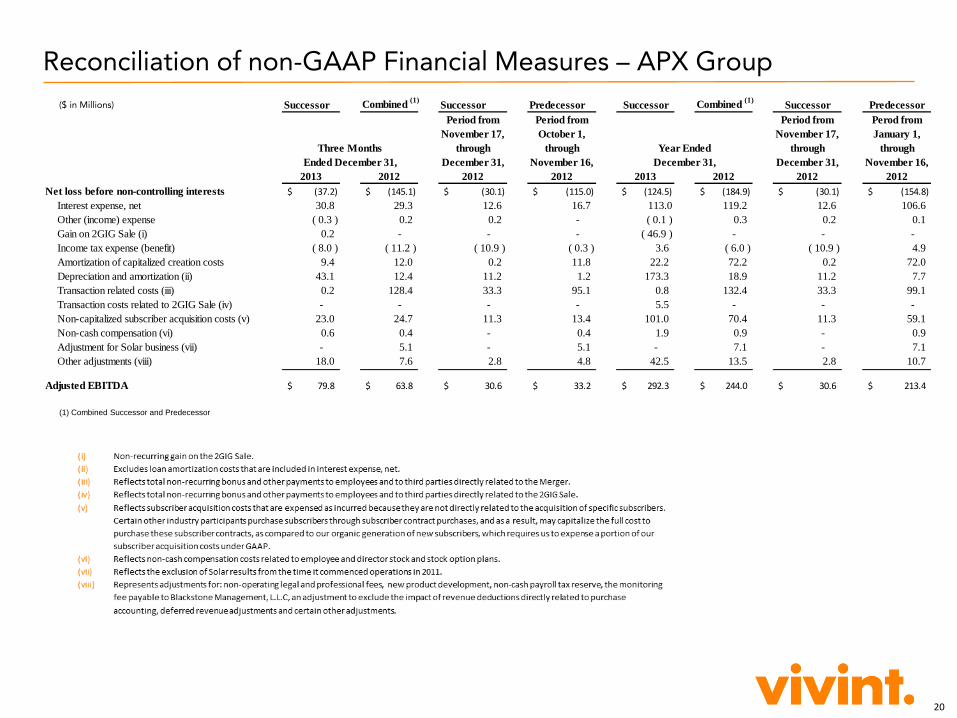
Reconciliation of non-GAAP Financial Measures – APX Group
($ in Millions)
(1) Combined Successor and Predecessor
Successor Combined (1)
Successor Predecessor Successor Combined (1)
Successor Predecessor
Period from Period from Period from Perod from
November 17, October 1, November 17, January 1,
through through through through
December 31, November 16, December 31, November 16,
2013 2012 2012 2012 2013 2012 2012 2012
Net loss before non-controlling interests (37.2)$ (145.1)$ (30.1)$ (115.0)$ (124.5)$ (184.9)$ (30.1)$ (154.8)$
Interest expense, net 30.8 29.3 12.6 16.7 113.0 119.2 12.6 106.6
Other (income) expense ( 0.3 ) 0.2 0.2 - ( 0.1 ) 0.3 0.2 0.1
Gain on 2GIG Sale (i) 0.2 - - - ( 46.9 ) - - -
Income tax expense (benefit) ( 8.0 ) ( 11.2 ) ( 10.9 ) ( 0.3 ) 3.6 ( 6.0 ) ( 10.9 ) 4.9
Amortization of capitalized creation costs 9.4 12.0 0.2 11.8 22.2 72.2 0.2 72.0
Depreciation and amortization (ii) 43.1 12.4 11.2 1.2 173.3 18.9 11.2 7.7
Transaction related costs (iii) 0.2 128.4 33.3 95.1 0.8 132.4 33.3 99.1
Transaction costs related to 2GIG Sale (iv) - - - - 5.5 - - -
Non-capitalized subscriber acquisition costs (v) 23.0 24.7 11.3 13.4 101.0 70.4 11.3 59.1
Non-cash compensation (vi) 0.6 0.4 - 0.4 1.9 0.9 - 0.9
Adjustment for Solar business (vii) - 5.1 - 5.1 - 7.1 - 7.1
Other adjustments (viii) 18.0 7.6 2.8 4.8 42.5 13.5 2.8 10.7
Adjusted EBITDA 79.8$ 63.8$ 30.6$ 33.2$ 292.3$ 244.0$ 30.6$ 213.4$
Three Months Year Ended
Ended December 31, December 31,
21
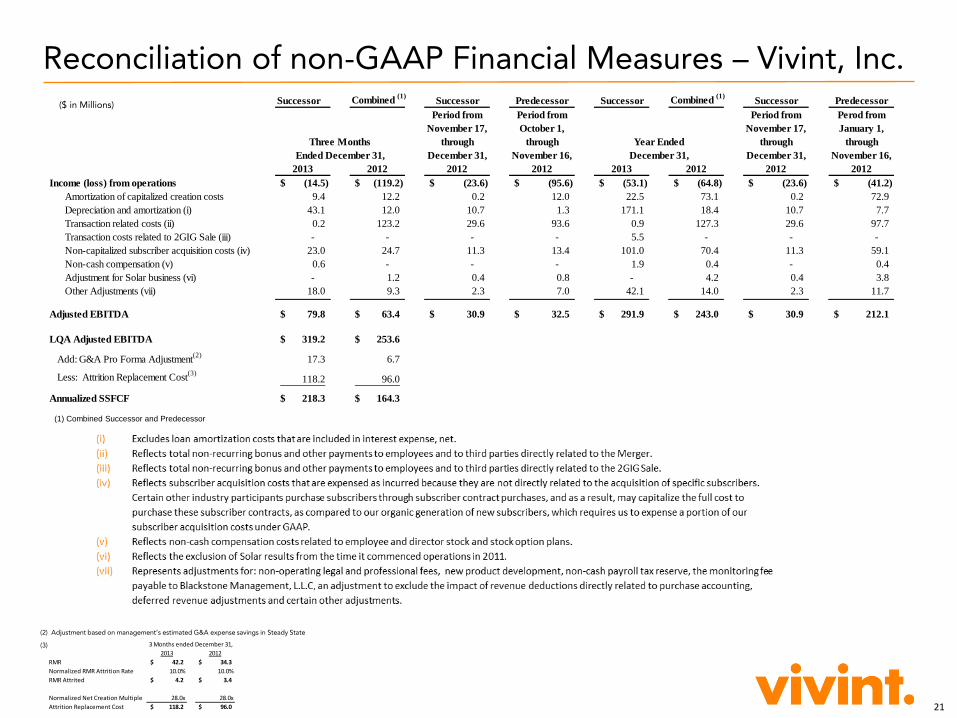
Reconciliation of non-GAAP Financial Measures – Vivint, Inc.
(2) Adjustment based on management’s estimated G&A expense savings in Steady State
(3)
($ in Millions)
2013 2012
RMR 42.2$ 34.3$
Normalized RMR Attrition Rate 10.0% 10.0%
RMR Attrited 4.2$ 3.4$
Normalized Net Creation Multiple 28.0x 28.0x
Attrition Replacement Cost 118.2$ 96.0$
3 Months ended December 31,
(1) Combined Successor and Predecessor
Successor Combined (1)
Successor Predecessor Successor Combined (1)
Successor Predecessor
Period from Period from Period from Perod from
November 17, October 1, November 17, January 1,
through through through through
December 31, November 16, December 31, November 16,
2013 2012 2012 2012 2013 2012 2012 2012
Income (loss) from operations (14.5)$ (119.2)$ (23.6)$ (95.6)$ (53.1)$ (64.8)$ (23.6)$ (41.2)$
Amortization of capitalized creation costs 9.4 12.2 0.2 12.0 22.5 73.1 0.2 72.9
Depreciation and amortization (i) 43.1 12.0 10.7 1.3 171.1 18.4 10.7 7.7
Transaction related costs (ii) 0.2 123.2 29.6 93.6 0.9 127.3 29.6 97.7
Transaction costs related to 2GIG Sale (iii) - - - - 5.5 - - -
Non-capitalized subscriber acquisition costs (iv) 23.0 24.7 11.3 13.4 101.0 70.4 11.3 59.1
Non-cash compensation (v) 0.6 - - - 1.9 0.4 - 0.4
Adjustment for Solar business (vi) - 1.2 0.4 0.8 - 4.2 0.4 3.8
Other Adjustments (vii) 18.0 9.3 2.3 7.0 42.1 14.0 2.3 11.7
Adjusted EBITDA 79.8$ 63.4$ 30.9$ 32.5$ 291.9$ 243.0$ 30.9$ 212.1$
LQA Adjusted EBITDA 319.2$ 253.6$
Add: G&A Pro Forma Adjustment(2)
17.3 6.7
Less: Attrition Replacement Cost(3)
118.2 96.0
Annualized SSFCF 218.3$ 164.3$
Three Months Year Ended
Ended December 31, December 31,
22
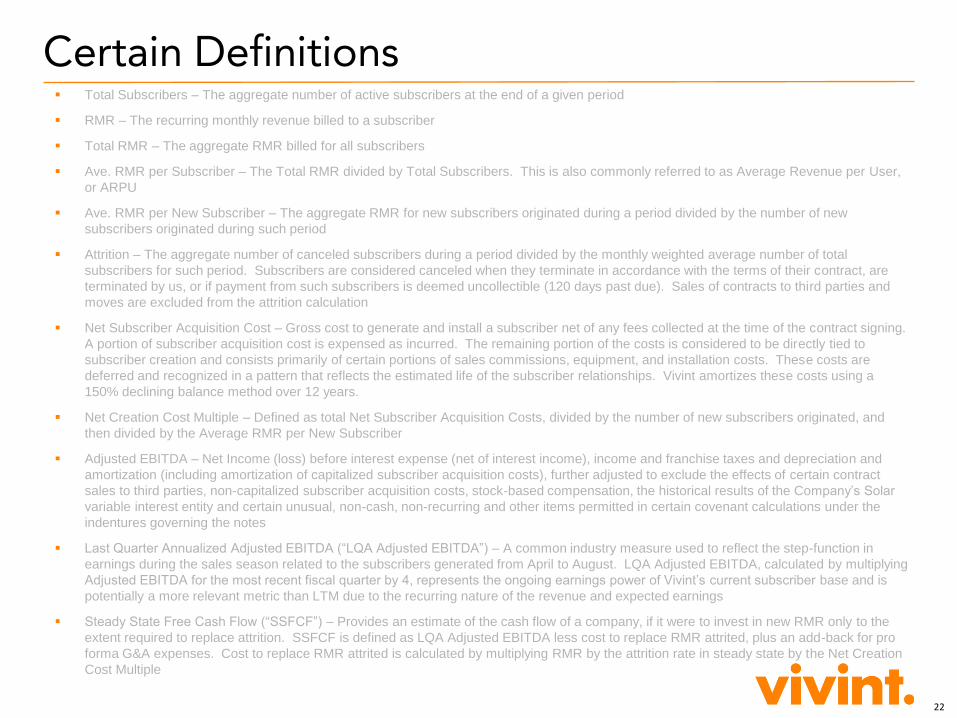
Certain Definitions Total Subscribers – The aggregate number of active subscribers at the end of a given period
RMR – The recurring monthly revenue billed to a subscriber
Total RMR – The aggregate RMR billed for all subscribers
Ave. RMR per Subscriber – The Total RMR divided by Total Subscribers. This is also commonly referred to as Average Revenue per User,
or ARPU
Ave. RMR per New Subscriber – The aggregate RMR for new subscribers originated during a period divided by the number of new
subscribers originated during such period
Attrition – The aggregate number of canceled subscribers during a period divided by the monthly weighted average number of total
subscribers for such period. Subscribers are considered canceled when they terminate in accordance with the terms of their contract, are
terminated by us, or if payment from such subscribers is deemed uncollectible (120 days past due). Sales of contracts to third parties and
moves are excluded from the attrition calculation
Net Subscriber Acquisition Cost – Gross cost to generate and install a subscriber net of any fees collected at the time of the contract signing.
A portion of subscriber acquisition cost is expensed as incurred. The remaining portion of the costs is considered to be directly tied to
subscriber creation and consists primarily of certain portions of sales commissions, equipment, and installation costs. These costs are
deferred and recognized in a pattern that reflects the estimated life of the subscriber relationships. Vivint amortizes these costs using a
150% declining balance method over 12 years.
Net Creation Cost Multiple – Defined as total Net Subscriber Acquisition Costs, divided by the number of new subscribers originated, and
then divided by the Average RMR per New Subscriber
Adjusted EBITDA – Net Income (loss) before interest expense (net of interest income), income and franchise taxes and depreciation and
amortization (including amortization of capitalized subscriber acquisition costs), further adjusted to exclude the effects of certain contract
sales to third parties, non-capitalized subscriber acquisition costs, stock-based compensation, the historical results of the Company’s Solar
variable interest entity and certain unusual, non-cash, non-recurring and other items permitted in certain covenant calculations under the
indentures governing the notes
Last Quarter Annualized Adjusted EBITDA (“LQA Adjusted EBITDA”) – A common industry measure used to reflect the step-function in
earnings during the sales season related to the subscribers generated from April to August. LQA Adjusted EBITDA, calculated by multiplying
Adjusted EBITDA for the most recent fiscal quarter by 4, represents the ongoing earnings power of Vivint’s current subscriber base and is
potentially a more relevant metric than LTM due to the recurring nature of the revenue and expected earnings
Steady State Free Cash Flow (“SSFCF”) – Provides an estimate of the cash flow of a company, if it were to invest in new RMR only to the
extent required to replace attrition. SSFCF is defined as LQA Adjusted EBITDA less cost to replace RMR attrited, plus an add-back for pro
forma G&A expenses. Cost to replace RMR attrited is calculated by multiplying RMR by the attrition rate in steady state by the Net Creation
Cost Multiple
Recommended