Bangladesh
Development
Update
Towards regulatory
predictability
April 2019
Pub
lic D
iscl
osur
e A
utho
rized
Pub
lic D
iscl
osur
e A
utho
rized
Pub
lic D
iscl
osur
e A
utho
rized
Pub
lic D
iscl
osur
e A
utho
rized

BANGLADESH DEVELOPMENT UPDATE
Towards Regulatory Predictability
April 2019

The World Bank Office, Dhaka
Plot E-32, Agargaon
Sher-e-Bangla Nagar
Dhaka – 1207, Bangladesh
Tel.: (880-2) 5566-7777
Fax: (880-2) 5566-7778
www.worldbank.org/bd
Standard Disclaimer:
This volume is a product of the staff of the International Bank for Reconstruction and
Development/ The World Bank. The findings, interpretations, and conclusions expressed in this
paper do not necessarily reflect the views of the Executive Directors of The World Bank or the
governments they represent. The World Bank does not guarantee the accuracy of the data
included in this work. The boundaries, colors, denominations, and other information shown on
any map in this work do not imply any judgment on the part of The World Bank concerning the
legal status of any territory or the endorsement or acceptance of such boundaries.
Copyright Statement:
The material in this publication is copyrighted. Copying and/or transmitting ions or all of this
work without permission may be a violation of applicable law. The International Bank for
Reconstruction and Development/The World Bank encourages dissemination of its work and will
normally grant permission to reproduce portions of the work promptly.
For permission to photocopy or reprint any part of this work, please send a request with
complete information to the Copyright Clearance Center, Inc., 222 Rosewood Drive, Danvers,
MA 01923, USA, telephone 978-750-8400, fax 978-750-4470, http://www.copyright.com/.
All other queries on rights and licenses, including subsidiary rights, should be addressed to the
Office of the Publisher, The World Bank, 1818 H Street NW, Washington, DC 20433, USA, fax
202-522-2422, e-mail [email protected].
Photo Credits:
Cover: ©The World Bank, 2019
Printed in Bangladesh

Executive Summary ................................................................................................................................... i
Recent Economic Developments ............................................................................................................ 1
Strong and steady economic growth .............................................................................................. 1
Headline inflation has moderated .................................................................................................. 4
Financial sector yet to turnaround ................................................................................................... 6
BOP deficit and pressure on the exchange rate ............................................................................. 8
Fiscal stance broadly consistent with macroeconomic stability ................................................ 10
Outlook and Risks .................................................................................................................................. 15
The Reform Challenges ......................................................................................................................... 19
Reducing financial sector fragilities .............................................................................................. 19
Fiscal reforms ................................................................................................................................... 20
Meeting the infrastructure gap ....................................................................................................... 22
Enhancing human capital to boost productivity ........................................................................ 24
Business Regulation ......................................................................................................................... 25
Regulatory Unpredictability: Causes, Consequences and Remedies ........................................... 28
Why does it matter? ......................................................................................................................... 28
Who faces regulatory unpredictability most? ............................................................................. 29
What causes regulatory unpredictability? ................................................................................... 30
Addressing regulatory unpredictability ...................................................................................... 35
Annex I: Profile of surveyed enterprises ............................................................................................ 39
Annex II: Deeper correlates of regulatory unpredictability .......................................................... 40
Annex III: Macroeconomic Indicator .................................................................................................. 42
References................................................................................................................................................. 43
Box 1: NSD Saving instruments ........................................................................................................... 14
Box 2: The drivers of regulatory unpredictability ............................................................................ 31
Box 3: Lack of proper definition of sample items lead to discretionary behavior by customs
officials ...................................................................................................................................................... 33

Figure 1: Per capita electricity generation and consumption (kWh) ............................................... 2
Figure 2: Exports, RMG, and Non RMG Growth (Twelve Months Moving Average, percent) 2
Figure 3: Remittance growth (Twelve Months Moving Average, percent) .................................... 3
Figure 4: Inflation (Base: 2005-06, y-o-y, percent) ............................................................................... 5
Figure 5: Private and Domestic Credit Growth (percent, y-o-y) ....................................................... 5
Figure 6: NPL as percent of Outstanding Loan ................................................................................... 6
Figure 7: Lending & Deposit Rate (percent) ........................................................................................ 7
Figure 8: DSE Index .................................................................................................................................. 7
Figure 9: Inter-Bank and Informal Exchange Rate .............................................................................. 9
Figure 10: Foreign Exchange Reserves .................................................................................................. 9
Figure 11: Bangladesh Bank’s Foreign Currency Transaction ........................................................ 10
Figure 12: Real Effective Exchange Rate ............................................................................................. 10
Figure 13: ADP Utilization (percent of Total Allocation) ................................................................ 12
Figure 14: Selling of National Saving Certificate ............................................................................. 13
Figure 15: Bangladesh’s Position compared to Regions and Income Groups ............................. 25
Figure 16: Regulatory unpredictability as experienced by different firm size groups .............. 30
Figure 17: Business views on different aspects of regulatory unpredictability in Bangladesh
................................................................................................................................................................... .32
Figure 18: Business views on discretionary behavior by officials in Bangladesh ...................... 32
Figure 19: Business views on causes of discretionary behavior by officials in Bangladesh .... 33
Figure 20: Business views on what can improve transparency and accountability .................... 33
Figure I.1: Enterprise Profile ................................................................................................................. 39
Figure I.2: Sectoral Distribution of Respondents ............................................................................. 39
Figure II.1: Relationship between discretionary behavior and legal inconsistency .................. 40
Figure II.2: Relationship between discretionary behavior and access to information .............. 41
Figure II.3: Relationship between discretionary behavior and insecurity of property rights . 41
Table 1: Balance of Payments ................................................................................................................. 8
Table 2: Fiscal Outcomes ....................................................................................................................... 11
Table 3: Macro Indicators ...................................................................................................................... 17
Table 4: Percentage of Total NBR Tax Collection ............................................................................. 21
Table 5: Comparison of Infrastructure Quality 2018 ........................................................................ 23
Table 6: HCI by Gender ......................................................................................................................... 25
Table 7: Bangladesh’s Ranking on the Ease of Doing Business .................................................... 26

Preface
This report provides an assessment of the state of the Bangladesh economy, outlook, risks, and
the key reform challenges the economy is currently facing. The coverage includes
developments in the real sector focusing on growth and its components; inflation; monetary
and financial sector developments; external sector developments focusing on the balance of
payments, foreign exchange reserves and the exchange rate; and fiscal developments focusing
on revenue mobilization, public expenditures, and deficit financing. The special focus in this
update is on regulatory predictability based on an analysis of firm level survey data.
Acknowledgements
This report was prepared by a team comprising of Zahid Hussain (Lead Economist), Syed
Akhtar Mahmood (Lead Private Sector Specialist), Nazmus Sadat Khan (Economist), Afroza
Alam (Research Analyst) and Shegufta Shahriar (Team Associate). A. K. M. Abdullah (Senior
Financial Sector Specialist) made valuable contribution on Financial Sector. Miah Rahmat Ali
and Stephen Rimmer provided inputs to the section on regulatory predictability. Mona Prasad
(Lead Economist) and Christian Eigen-Zucchi (Program Leader) provided extremely valuable
comments on the full report. Catherine Masinde, Practice Manager, Global Business
Regulations Unit (GMTBR) provided guidance on the section on regulatory predictability.
Manuela Francisco (Practice Manager) provided overall guidance in the preparation of the
report.

ADP Annual Development Program
ADR Advance-Deposit Ratio
ALM Asset Liability Management
AML/CFT Anti-Money Laundering and Countering Financing of Terrorism
B2G Business-to-Government
BAB Bangladesh Association of Bankers
BB Bangladesh Bank
BBS Bangladesh Bureau of Statistics
BDT Bangladeshi Taka
BIDA Bangladesh Investment Development Authority
BOP Balance of Payment
BPC Bangladesh Petroleum Corporation
BSC Bangladesh Shipping Corporation
BUILD Business Initiative Leading Development
CCI&E Chief Controller of Imports and Exports
CEO Chief Executive Officers
CETP Central Effluent Treatment Plant
CIB Credit Information Bureau
CPD Centre for Policy Dialogue
CRAR Capital to Risk Weighted Asset Ratio
CRMG Comprehensive Risk Management Guideline
CRR Cash Reserve Ratio
DAE Department of Agricultural Extension
DB Doing Business
DNS Directorate of National Savings
DPP Development Project Proposal
DSEX Dhaka Stock Exchange
DTF Distance to Frontier
ECNEC Executive Committee of the National Economic Council
EMDE Emerging Market and Developing Economies
EPZ Export Processing Zone
EU European Union
FAO Food and Agricultural Organization
FDI Foreign Direct Investment
FY Fiscal Year
GBD Global Burden of Disease
GCC Gulf Cooperation Council
GDP Gross Domestic Product
GNFS Goods and Non-Factor Services
GW Gigawatt
HCI Human Capital Index
HIC Higher Income Country
ICT Information and Communications Technology
IMED Implementation Monitoring and Evaluation Division

IMF International Monetary Fund
IPOs Initial Public Offerings
IT Information Technology
kWh Kilowatt Hour
LC Letter of Credit
LNG Liquefied Natural Gas
LPI Logistics Performance Index
LTU Large Taxpayers Unit
M&E Monitoring & Evaluation
MLT Medium and Long Term
MPS Monitory Policy Statement
MT Metric Ton
MW Megawatts
NBR National Board of Revenue
NEET Not in Employment, Education or Training
NGOs Non-Governmental Organizations
NPL Non-Performing Loan
NSC National Savings Certificate
NSD National Savings Directorate
NSW National Single Window
OECD Organization for Economic Co-operation and Development
OSS One Stop Shop
PCB Private Commercial Banks
PFM Public Financial Management
PIM Public Investment Management
PMO Prime Minister’s Office
QIIP Quantum Index of Industrial Production
REER Real Effective Exchange Rate
RIA Regulatory Impact Assessments
RMG Ready-made garments
SBW Special Bonded Warehouse
SCB State-owned Commercial Bank
SD Supplementary Duty
SDBs Specialized Development Banks
SDGs Sustainable Development Goals
SLR Statutory Liquidity Ratio
SOE State Owned Enterprise
SRO Statutory Regulatory Order
T&D Transmission and Distribution
T-bills Treasury Bills
TVET Technical and Vocational Education and Training
UMIC Upper Middle-Income Country
VAT Value Added Tax
WBG World Bank Group
WEF World Economic Forum
WHO World Health Organization

i
Bangladesh has maintained its robust growth performance. Exports and remittances have been buoyant.
Agriculture had bumper harvests. Overall inflation has slowed as decelerating food inflation offset a pickup
in non-food inflation. Monetary expansion has been short of target as private sector credit growth slowed
and the Bangladesh Bank siphoned off banking liquidity by selling dollars to defend the taka. Vulnerabilities
in the banking system and capital market persisted. Higher export and lower import growth reduced the
current account deficit, but a decline in the financial account surplus diluted the impact of the current
account deficit decline on the overall balance of payments deficit. The budget deficit increased in FY18 but
remained below the 5 percent of GDP target. Low revenue collection continues to be a major challenge as
policy and administrative reforms have stalled and, in some instances, reversed. Key structural reform
challenges are to mitigate the financial sector vulnerabilities, strengthen revenue mobilization, manage
public investments better, meet the infrastructure gap, enhance human capital and streamline business
regulation. Addressing these reform challenges will be critical for reinforcing future productivity growth.
The Bangladesh economy continues to grow at an impressive rate. On the supply side, the
growth is being driven by manufacturing and construction. Rapid growth of electricity
generation appears to have energized the urban formal and rural non-farm economy. Bumper
crop harvests helped further. On the demand side, private consumption has remained strong,
underpinned by strong remittance and rural income growth. In addition, exports growth has
accelerated, benefiting from the US-China trade dispute while import growth has decelerated.
Slowing food inflation has reduced headline inflation. Core inflation has been trending
upwards, driven by aggregate demand expansion and high inflationary expectations,
notwithstanding contractionary monetary outcomes. Domestic monetary management has been
constrained by dollar liquidity support provided by the Bangladesh Bank (BB) in the foreign
exchange market. BB did well in keeping the key monetary and credit aggregates in line with the
path indicated in their Monetary Policy Statement for the first half of FY19.
The growth of bank credit to the private sector has slowed in line with slower growth in
deposits. Banking regulation and supervision have been ineffective due to lack of enforcement
and regulatory independence. High nonperforming loans (NPLs) compounded by an eroding
capital base continue to pose financial stability risks. Interest rates have tended upwards with the
tightening of availability of loanable funds. Corporate governance weaknesses, especially at state-
owned banks, and legal complexities in contract enforcement are adversely affecting the ability
of banks to improve risk management and loan recovery. This is limiting the expansion of access
to and usage of financial services.
Pressure on the exchange rate induced sustained BB intervention. A significant reduction in
trade deficit due to an acceleration in export and easing of import growth, together with strong
remittances, have narrowed the current account deficit. However, a decline in the financial
account surplus because of increased trade credit and outflows due to banking transactions
diluted the impact of lower current account deficit on the deficit in the balance of payments before
reserve changes. This led to continued pressure on the official foreign exchange reserves as the
BB intervened in the foreign exchange market by selling over $1.8 billion in the first nine months
ii
of FY19 to moderate the depreciation of the taka against the US dollars. With the US dollar
gaining strength in international markets, there was a nominal appreciation of the taka against
the euro and the pound-sterling in FY19. Real effective exchange rate has appreciated further both
because of nominal exchange rate appreciation against other trading partners as well as higher
domestic inflation relative to the trading partners.
The fiscal deficit has increased but remains well within sustainable thresholds. Domestic
financing of the deficit has begun to shift towards less expensive sources with restraints on sales
of National Saving Certificates (NSCs). Maintenance of a prudent cap on budget deficits have
helped management of inflation and avoid crowding out of credit to the private sector. Tax
revenue mobilization has slipped, reflecting the impact of several ad hoc tax cuts and exemptions
as well as slow progress in the automation of administrative processes. Increased subsidies to
exports and energy have increased recurrent spending and a rush of new development projects
in the Annual Development Program (ADP) added more pressure. Low revenues have shrunk
the fiscal space for meeting the spending gaps in infrastructure, health, education and social
protection.
Bangladesh is poised to maintain 7 percent plus growth in the medium-term. Domestic
demand growth is strong with private investments set to gain some momentum from dissipation
of political uncertainties and the implementation of reforms aimed at lowering the cost of doing
business. With actual output exceeding the potential in the short-term, macroeconomic stability
may be tested. Coupled with elevated global risks, this reinforces the need for accelerated
structural reforms to increase potential output and build fiscal and external buffers.
The new cabinet faces several short and long-term development challenges. An immediate
challenge is to address the banking sector vulnerabilities, revenue shortfall and pressure on
foreign exchange reserves. At the same time, there is the need to prepare for tighter external
financing conditions in the near and medium-term. These will have to be complemented with
reforms to improve infrastructure, boost human capital and make business regulation less
onerous and more predictable.
• The banking sector governance reforms require (i) ensuring true autonomy of BB, including
full oversight and enforcement powers on the state-owned banks; (ii) more clarity on the
government’s long-term goals, the mandates and objectives of the state-owned banks to
improve corporate governance arrangements and strengthen the capacity of the Financial
Institutions Division (FID) to act as owner; (iii) decrease reliance and restructure the National
Savings Certificates (NSCs) to allow capital markets development.
• Key fiscal issues include low revenue mobilization and a taxation structure still too dependent
on indirect taxes, especially trade taxation. Equally important will be addressing the
bottlenecks in public financial management as envisaged in the government’s Public Financial
Management Action Plan 2016-21. Better use of assets invested in SOEs and SCBs promises
large gains.
• Narrowing the infrastructure gap requires not only more spending, but also improving the
maintenance of existing assets. The infrastructure challenge, in key sectors such as transport

iii
and energy, can be addressed by adopting a comprehensive infrastructure financing strategy
based on a combination of tax funding, partnership with the private sector and cost recovery.
Structural issues around bankability, coupled with near-term challenges, may hold back
private sector participation.
• A growing and youthful workforce in Bangladesh provides a time-bound window of
opportunity to improve productivity and accelerate economic growth. Weak learning
outcomes across the education system translate into a failure to realize fully the potential of
human capital. Equipping the young generation with the skills needed for productive jobs
remains crucial. To expand individuals’ potential, a coherent skills development strategy
across the different learning environments and schooling stages is imperative.
• Improving the ease of doing business could reduce informality by reducing the cost of entry
and operating in the formal sector. Measures to reduce the time, cost, and complexity of
registration, coupled with high quality public services as well as enhanced monitoring and
enforcement, would improve the business climate and foster growth. These require designing
comprehensive policies, including streamlining tax codes, easing firm and labor regulations
to create a level playing field for both formal and informal participants, and expanding access
to finance and public services to help increase productivity in the informal sector.
• Businesses face regulatory uncertainty on many fronts. A multi-pronged approach is needed
to reduce regulatory uncertainty including high-level actions on systemic reforms
accompanied by additional, more specific reforms. Bangladesh’s regulatory system needs the
establishment of a technical regulatory oversight body at the center of government to oversee,
lead and report on regulatory reforms. Specific actions include introducing regulatory impact
assessments, holding structured and inclusive consultations on draft laws and regulations,
reviewing existing laws and regulations to identify gaps, inconsistencies and redundancies,
publishing immediately all Statutory Regulatory Orders (SROs) through widely-accessible
means, and introduction of business-to-government feedback loops on regulatory service
quality.
This report focuses especially on the issue of regulatory predictability based on a survey of
sample of businesses operating in Bangladesh.

1
The economy continues to grow at an impressive 7 plus percent rate. On the supply side, the growth is
driven by manufacturing and construction. Bumper crop harvests helped further. On the demand side,
private consumption has remained strong, underpinned by strong remittance and rural income growth,
while exports growth has accelerated and import growth weakened. Private investments have remained
subdued.
Agriculture is performing well helped by benign weather conditions. Aman, the second biggest
crop out of the three rice crops produced in a year, had a bumper harvest in 2018. Aman output,
which typically accounts for 40 percent of annual rice production, is estimated to rise to 14.1
million metric tons (MT) in FY19, compared with 13.5 million MT last season, according to the
Bangladesh Bureau of Statistics (BBS). More than 5.65 million hectares of land were brought
under aman cultivation, which is 3.5 percent higher than last year, induced by remunerative
producer prices at planting time. The Department of Agricultural Extension (DAE) estimated that
aus production (the smallest of the three rice crops) increased 7 percent in 2018 from that a year
ago. The Food and Agricultural Organization (FAO) has projected paddy output to rise to 53.6
million MT in 2018, higher than the five-year average of 51.7 million MT, because of higher
plantings by growers and favorable weather. Maize production is also estimated to have
increased 6 percent to 3.7 million MT in 2018. In contrast, wheat production is likely to have
dropped to 1.3 million MT, slightly below the 5-year average due to contraction in acreage. In
FY18, the agriculture sector grew at a solid rate of 4.2 percent, an improvement from 3 percent
growth in FY17.
Rice import data corroborate bumper harvests. Imports of rice and wheat were 24.87 lakh metric
tons during July-November 2018, a reduction of 42 percent from the same period of the previous
year. Procurement of rice during this period was 8.46 lakh metric ton, significantly higher than
the 3,10,000 metric ton recorded in the previous year for the same period. The government-re-
imposed 28 percent import duty in July 2018 (25 percent customs duty and 3 percent regulatory
duty) to support local farmers after it had been slashed earlier in 2017.
Industrial growth remained buoyant. The Quantum Index of Industrial Production (QIIP)
increased by 18.5 percent in July-October 2018 relative to the same period the previous year,
driven by 24.5 percent in growth of textiles which carries a 34.8 percent weight in the composite
QIP. Pharmaceuticals, non-metallic minerals, leather and chemical products, which together
account for 24 percent of the QIP, also had decent double-digit growth in July-October 2018. This
performance follows the 12.1 percent industrial growth achieved in FY18, led by growth in the
large and medium scale manufacturing. Growth in the small-scale manufacturing, however, has
been subdued. Constructions appears to be growing strongly in FY19, as indicated by the rise in
imports of iron, steel, base metal and capital machinery increasing by more than 13 percent
during the first half of FY19. The construction sector is playing an increasingly strong role in the

2
economy amid continued urbanization and an array of large infrastructure projects undertaken
by the government.
A further easing of electricity constraint
has stimulated manufacturing. Growth in
electricity generation appears to have been
a critical factor in sustaining the industrial
expansion. Installed capacity was 18,275
megawatts (MW) in November 2018, with
peak production for the year at 11,623 MW.
Within eight years, the real capacity
increased by a factor of 3.3, and energy
served, or actual energy generation more
than doubled over the past decade. 1Another significant achievement has been
the successful cross border electricity trade
with India.
Export growth has picked up. After a modest 5.3 percent expansion in FY18, cumulative export
earnings in the first seven months of FY19 surged to $24.2 billion, an impressive 13.4 percent
increase from the same period of the previous year. This reflects 14.5 percent growth in ready-
made garments (RMG) and 8 percent growth in non-RMG exports, rebounding from a 9.5 percent
decline in FY18. Strong US economic growth and the US-China trade dispute have played a role
in this growth. Export to US markets rose by 17.4 percent, compared with only 1.4 percent growth
during the same period last fiscal year. Exports to China grew by 30.3 percent, compared 27.2
percent decline during the same period last year. Growth was led by exports of agricultural
products, pharmaceuticals, plastic products and home textile. However, leather and leather
goods, the second largest source of export earnings, declined 5.4 percent.
1 During the same period the per capita electricity consumption almost doubled, from 165 kWh to 308 kWh in FY17 (Figure-1). Electricity access also increased considerably - from 54 percent of the population benefiting from electricity coverage in 2009 to 90 percent currently. Good progress was also made in reducing system losses (transmission and distribution (T&D)), from 17 percent to 12 percent.
0.0
50.0
100.0
150.0
200.0
250.0
300.0
350.0
400.0
FY01
FY02
FY03
FY04
FY05
FY06
FY07
FY08
FY09
FY10
FY11
FY12
FY13
FY14
FY15
FY16
FY17
FY18
(kW
h)
Figure 1:Per Capita Electricity Generation and
Consumption (kWh)
Per Capita Generation Per Capita Consumption
Source: Bangladesh Power Development Board (Annual Report 2017-2018)

3
Export product diversification remains a
challenge, notwithstanding improved
outcomes so far this year. The RMG sector
currently accounts for 83.5 percent of total
exports. Exports of leather and leather goods
have been above the $1 billion mark for the
past five years but stagnated. The shifting of
tanneries from Hazaribagh in Dhaka to Savar
on the outskirts, the delay in the construction
of the Central Effluent Treatment Plant (CETP)
and other administrative complications have
hampered competitiveness of the sector. Given
the availability of raw leather in Bangladesh,
however, the potential in this sector remains
substantial. Currently, more than half of the finished leather produced locally is exported instead
of used in the production of higher value-added leather goods. Raw jute and jute goods, another
major contributor to non-RMG export earnings, also failed to perform well recently, declining by
double digits in the first five months of FY19. Decline in demand for jute and jute goods from
Turkey, USA, China, India and some African countries due to increased tariffs and the real
appreciation of the taka contributed to decline in jute exports. 2
Aggregate demand was stimulated by strong
remittances and gains in net exports.
Officially recorded remittances in the first
eight months of this fiscal year reached $10.4
billion, an increase of 10 percent from the same
period of the previous year. Remittance from
Gulf Cooperation Council (GCC) countries
during this period rose 15.1 percent.
Remittances from Saudi Arabia, the main
source for Bangladesh, increased by 20.9
percent and accounted for over a third of the
total increase in remittances during the first
eight months of FY19. Remittance from the
USA, however, declined by 8.1 percent. The
larger stock of Bangladeshis working abroad, the national election, strengthened surveillance
against hundi informal channels and a depreciating currency against the US dollar are likely to
have contributed to the increase in officially recorded remittances. Even if remittances in the
remaining four months of FY19 are only 90 percent of the remittances received in the last four
2 The reason jute exports may have been adversely affected by real appreciation has to do with higher price elasticities which for jute are higher.
-13.0
-8.0
-3.0
2.0
7.0
12.0
Figure 2: Exports, RMG, and Non RMG Growth
(Twelve Months Moving Average, percent)
Total Export RMG NoN-RMG
Source: Export Promotion Bureau
-20.0
-15.0
-10.0
-5.0
0.0
5.0
10.0
15.0
20.0
25.0
Figure 3: Remittance Growth (Twelve Months
Moving Average, percent)
Source: Bangladesh Bank

4
months of FY18, Bangladesh will have achieved an historic high on the size of annual
remittances.3
Net exports have been negative in the national income accounts but narrowed by $1.7 billion in
the first half of FY19. This reflects the combined effect of accelerated export growth, mentioned
above, and slower import growth. Following a staggering 25.2 percent increase in FY18, total
merchandise import in the seven months of FY19 stood at $33.5 billion, only a 7.4 percent higher
than the same period of the previous year. This is mostly driven by a 14.1 percent rise in iron,
steel and other base metals imports. Implementation of several mega projects including the
Padma Bridge led to the rise in imports of these goods.
Private investment remains subdued. Foreign Direct Investment (FDI) remains low at less than
1 percent of GDP. Net FDI inflow amounted to $910 million in the first half of FY19, compared
with $823 million in the first half of FY18. The rise in production costs in China and other
emerging economies could induce some industrial relocation if the domestic investment
environment is hospitable enough For Bangladesh to be an attractive destination for these
industries, it is imperative that land, electricity and gas and skilled human resource be available.
In addition, it will be important to simplify the tax structure and the process for starting a business
and repatriating profits. Foreign firms also consider changes in energy prices, limitations in the
governance framework, risks of cyber-attacks, skills shortages as the key impediments to
investment in Bangladesh (WEF 2018). Domestic private investors also appear to be shying away
as indicated by the 5 percent decline in Letters of Credit (LC) settlement and 27.6 percent decline
in LC opening for the import of capital machinery in the first half of FY19. Also, the share of
machinery in total imports for leading industries such as textiles, garments, pharmaceuticals,
packing and leather has been declining, reaching 31.8 percent in July-November 2018 from 55.6
percent in FY09.
Despite robust growth, the labor market situation remains largely unchanged. According to
the latest ‘Asia-Pacific Employment and Social Outlook’ report, the labor force participation rate and
employment to population ratio, have both declined during the period 2010-2017. Bangladesh
has one of the highest youth unemployment rates, which increased by 6.4 percentage point
during the same period. The difference between male and female is large. Female youth not in
employment, education or training (NEET) as a percentage of the youth population is more than
four times that of the male youth population. According to the report, 35 percent of women and
57 percent of men consider it unacceptable for women to have paid work outside of home. Those
with higher education are not much better off. The unemployment rate among youth with a
tertiary level degree is 10.7 percent, second highest among all the 27 countries in the sample.4
Finally, the quality of jobs is also low. According to the report, the share of vulnerable
employment and informal employment in total employment is above 55 percent and 80 percent
respectively, again one of the highest in the sample.
3 The highest ever received annually was in FY15 when total remittances received exceeded $15.3 billion. 4 For further analysis on unemployment based on gender, age and level of education, see ILO (2018).

5
Slowing food inflation has reduced headline inflation, but core inflation has been trending upwards, driven
by aggregate demand expansion and high inflationary expectations, notwithstanding contractionary
monetary outcomes. Domestic monetary management has been constrained by the Central Bank of
Bangladesh efforts to support dollar liquidity in the foreign exchange market.
Headline inflation abated in the first half of FY19. Inflation peaked in September 2017 when
food inflation reached 7.9 percent, a level not seen since July 2014 (Figure-4). Since then the
general index for inflation has been on a decelerating trend mostly due to slowing of food price
increases. From 6.1 percent in September 2017, overall inflation eased to 5.5 percent in February
2019, declining almost every month subsequently, except in January-February 2019. The
deceleration was driven by food inflation which slowed to 5.4 percent.
Non-food inflation has picked up. It gained every month for the first ten months of 2018 and
stood at 5.5 percent in February 2019. Increasing transport costs and buoyant domestic demand
played an important role in the price rises.5
Among the non-food items, price hikes for
clothing and footwear are noteworthy. From
as low as 2.2 percent at the beginning of FY18,
the inflation rate in this category jumped to 6.9
percent in January 2019. This is the only
category which is currently experiencing a
double-digit inflation rate. Medical and health
care costs are also currently on an accelerating
trend. On the other hand, inflation related to
recreation, entertainment, education and
cultural services slowed sharply in 2018 (from
6.2 percent in December 2017 to 0.9 percent in
December 2018).
The gap between rural and urban inflation has been narrowing in the last three years. Overall
rural and urban inflation currently stands at 5.1 percent and 5.8 percent respectively. In FY16,
they were 5.3 percent and 7.1 percent. The difference in inflation between rural and urban areas
has been most prominent in non-food items. In the first eight months of FY19, non-food inflation
(y-o-y) moved up by 0.1 percentage points in rural areas whereas in urban areas the increase was
1.4 percentage point.6
5 Inflation in the transport and communication category rose to 7.7 percent (y-o-y) in February 2019, compared with 3.3 percent in February 2018. 6 The concentration of wealth creation has been in the urban areas mostly. With the rise of the rich, consumption pattern shifted
more towards non-food items, causing the demands for these goods to rise. This can be one explanation of the divergence.
2.0
3.0
4.0
5.0
6.0
7.0
8.0
9.0
Figure 4: Inflation (Base:2005-06, y-o-y, percent)
General Food Non-food
Source: Bangladesh Bureau of Statistics

6
Monetary outcomes have been contractionary. Broad money has been on a low growth trajectory
of late, increasing by 10.2 percent year-on-year in January 2019, lower than the BB’s target of 12
percent for FY19. Growth of credit to the private sector slowed to 13.2 percent (below the growth
ceiling of 16.8 percent initially set by the BB for FY19) at the end of January 2019. Domestic credit
growth stood at 14.3 percent (Figure-5), lower than the FY18 growth rate of 14.7 percent and the
BB’s FY19 target of 15.9 percent. Due to the increased sale of USD to keep the exchange rate stable,
net foreign assets declined by 1.4 percent
through January from a double-digit growth
rate just two years ago. The liquidity released
when the BB in April 2018 reduced the Cash
Reserve Ratio (CRR) by 100 basis points to 5.5
percent and repo rates by 75 basis points to 6
percent have been siphoned off by the BB’s
foreign exchange market interventions.
Moreover, to ease tightening liquidity
conditions, the BB increased available repo
tenors to 7, 14 and 28 days. Under the term
repos, banks can now borrow from the BB for
a longer period through an auction process by
bidding at rates higher than 6 percent.
Growth in bank credit has moderated. Banking regulation and supervision have not been effective due to
lack of enforcement and limited BB independence. High nonperforming loans (NPLs) compounded by an
eroding capital base pose financial stability risks. Corporate governance weaknesses, especially at state-
owned banks, and legal complexities in contract enforcement are adversely affecting the banking sector.
This is limiting the expansion of access to and usage of financial services.
Credit growth has moderated and non-performing loans (NPLs) continue to rise. The asset size
of the scheduled banks increased to BDT 14,004 billion at the end of FY18 from BDT 13,326 billion
at the end of March 2018, with private
commercial banks (PCB) holding over 65
percent of assets. However, total assets
declined as a percentage of GDP from 67.4
percent in FY17 to 62.2 percent in FY18. The
Advance-Deposit Ratio (ADR) increased from
73.9 percent in June 2017 to 76.7 percent in
June 2018, remaining well below the macro-
10.0
11.0
12.0
13.0
14.0
15.0
16.0
17.0
18.0
19.0
20.0
Figure 5: Private and Domestic Credit Growth (
percent, y-o-y)
Private Sector Credit Growth Domestic Credit Growth
Source: Bangladesh Bank
0.0
5.0
10.0
15.0
20.0
25.0
30.0
35.0
Dec-
13
Mar-
14
Jun-1
4
Sep-1
4
Dec-
14
Mar-
15
Jun-1
5
Sep-1
5
Dec-
15
Mar-
16
Jun-1
6
Sep-1
6
Dec-
16
Mar-
17
Jun-1
7
Sep-1
7
Dec-
17
Mar-
18
Jun-1
8
Sep-1
8
Figure 6: NPL as percent of Outstanding Loan
Total SCBs PCBs
Source: Bangladesh Bank

7
prudential limit of 83.5 percent.7 The NPLs at the end of FY17 was BDT 743 billion. It reached
BDT 939.1 billion by the end of 2018 (Figure 6). The gross NPLs accounted for 10.4 percent of the
outstanding loans from the banking sector at the end of FY18 and increased to 10.3 percent in
December 2018 from 9.3 percent in December 2017. The 26.4 percent growth in NPLs in 2018 has
been the highest increase in the last five years. NPL’s are not evenly distributed among banks.
Five banks are responsible for almost half of the total NPLs. NPLs of State-owned Commercial
Banks (SCBs) is 31 percent and State-owned Development Banks (SDBs) 22 percent. Directed
lending, poor risk management, and weak corporate governance lead to the rise in NPL. The
practice of loan rescheduling and write-offs also increased, creating further stress on banks. BB
approved loan rescheduling of BDT 191 billion in 2017 and BDT 200 billion in 2018. Notably, the
NPLs are increasing despite these wholesale approvals of loan rescheduling.
Meanwhile, in a bid to address write-off and NPL issues the BB issued a circular on February 6,
2019 allowing banks to (i) write-off loans that remain classified as bad debt for three years instead
of the previous five years, subject to full provisioning; (ii) write-off bad loans up to BDT 200,000
without filing any law-suit instead of the previous threshold of Tk 50,000; and (iii) write-off loans
without keeping 100 percent provisions. This is expected to clean balance sheets but may send
the wrong signals to the defaulting borrowers and could result in weaker NPL collection efforts
post-writeoff. BB has approved three new private commercial banks (Bengal Commercial Bank
Limited, Peoples Bank Limited and Citizen Bank Limited), increasing the number of banks to 62.
BB raised the minimum paid up capital requirement from Tk 4 billion to Tk 5 billion for the new
banks.
Lending rates remain downwardly rigid. In
June 2018, the Bangladesh Association of
Bankers (BAB), a forum of the owners of
private commercial banks, suggested to fix
the lending rate and deposit rate at 9 percent
and 6 percent respectively. It was expected
that the new rates would go into effect from
May 2018. However, the banks have
struggled to keep the lending rate at such a
low level (Figure 7). The large difference in
interest rates between the National Savings
Directorate (NSD) certificates (which
currently offers double digit interest rate) and the rate fixed by BAB disincentivizes for individual
households from bank savings instruments. Deposit growth in 2018 slowed to 9.4 percent from
10.2 percent growth in 2017. Lower growth of bank deposits coupled with higher NPL has
reduced the availability of loanable funds in the banking system. Moody’s has put Bangladesh’s
banking system on ‘negative watch’ in their recent report primarily due to worsening asset
quality arising from weak corporate governance within the banking sector. Two other global
7 Thanks to mandatory requirements to keep 50 percent of government deposits in SCBs, their ADR in June 2018 was only 54.8 percent whereas the ADR of domestic Private Commercial Banks was 85.6 percent which was still higher than the prudential limit.
4.0
5.0
6.0
7.0
8.0
9.0
10.0
11.0
12.0
Source: Bangladesh Bank
Figure 7: Lending & Deposit Rate ( percent)
Lending Rate Deposit Rate

8
rating agencies – Standard & Poor’s and Fitch – also expressed concerns over the health of the
banking sector.
A post-election stock market boom is losing
steam. The DSEX, the benchmark index of the
main bourse Dhaka Stock Exchange had been
on a downward trend since the beginning of
2018 but turned around rapidly after elections.
The DSEX reached as high as 6318 in January
2018 and then fell by more than a thousand
points to 5262 at the end of July 2018 (Figure 8).
The index maintained a stable position in the
last half of the year until closing for the year at
5,385.64, a 13.75 percent drop year-on-year. The
fall of the index during January 2018 to July 2018 was due to the poor performance of the financial
sector as well as the shrinking liquidity in the banking sector. Political and exchange rate
uncertainty also had a role, as most foreign investors opted to realize profits and reduce risk.
Investors appear to have been on a ‘wait and see’ mode before the national elections. The number
of Initial Public Offerings (IPOs) slowed down and the market capitalization as a percentage of
GDP has been on a downward trend. There has been a rise in the volatility of the capital market
in the last couple of years mostly due to the role played by the institutional investors including
merchant banks and brokerage firms.
A significant reduction in the trade deficit due to an acceleration in export and deceleration of import
growth, together with strong remittances, have significantly reduced the current account deficit. However,
a reduction in the financial account surplus diluted the impact of this reduction on the overall balance of
payment deficit, leading to sustained pressure on official foreign exchange reserves as the BB intervened to
moderate the depreciation of the taka against the US dollar. With the US dollar gaining strength in
international markets, this has resulted in nominal appreciation of the taka against the euro and the pound-
sterling so far in FY19, and the real effective exchange rate has appreciated further.
Although the current account deficit declined, the overall balance of payments deficit
remained large. The current account deficit stood at $4.3 billion in the first seven months of FY19,
compared with $5.4 billion in the corresponding period of FY18. This reflects a reduction in trade
and services accounts deficit driven by a drastic fall in merchandize import growth and
significant increase in exports of merchandize and services as well as increased remittances (as
discussed above). However, a reduction in the financial account surplus moderated the impact
of the reduced current account deficit on the overall balance of payments deficit, which declined
to $975 million
Table 1: Balance of Payments
US$ million
5000
5200
5400
5600
5800
6000
6200
6400
6600
1-J
an-1
71-F
eb-1
71-M
ar-
17
1-A
pr-
17
1-M
ay-1
71-J
un-1
71-J
ul-17
1-A
ug-1
71-S
ep-1
71-O
ct-1
71-N
ov-1
71-D
ec-
17
1-J
an-1
81-F
eb-1
81-M
ar-
18
1-A
pr-
18
1-M
ay-1
81-J
un-1
81-J
ul-18
1-A
ug-1
81-S
ep-1
81-O
ct-1
81-N
ov-1
81-D
ec-
18
1-J
an-1
91-F
eb-1
9
Figure 8: DSE Index
Source: Dhaka Stock Exchange Ltd.

9
Items FY15 FY16 FY17 FY18 FY18
(Jul-Jan)
FY19
(Jul-Jan)
Trade balance -6,965 -6,460 -9,472 -18,258 -10,077 -9,684
Merchandise export f.o.b. (inc. EPZ) 30,697 33,441 34,019 36,205 21,099 23,802
Growth (percent) 3.1 8.9 1.7 6.4 7.5 12.8
Merchandise import f.o.b. (inc. EPZ) -37,662 -39,901 -43,491 -54,463 -31,176 -33,486
Growth (percent) 3.0 5.9 9.0 25.2 25.2 7.4
Services (net) -3,186 -2,708 -3,288 -4,574 -2,017 -1,944
Income (net) -2,869 -1,915 -1,870 -2,392 -1,834 -2,071
Workers' remittance 15,170 14,717 12,769 14,982 8,312 9,086
Growth (percent) 7.5 -3.0 -13.2 17.3 17.6 9.3
Current Account Balance 2,875 4,262 -1,331 -9,780 -5,402 -4,337
Capital account (net) 496 478 400 292 163 156
Financial account 1,925 944 4,247 9,076 4,282 3,522
o/w Foreign direct investment (net) 1,830 1,285 1,653 1,583 960 1,065
MLT loans (excludes suppliers’
credit) 2,472 3,033 3,218 5,785 2,893 3,116
Growth 8.6 22.7 6.1 79.8 132.4 7.7
Other short-term loans (net) -105 -435 1,030 1,947 -39 965
Trade Credit (net) -2,508 -2,101 -1,185 -1,270 -644 -2,165
Errors and omissions -923 -634 -147 -473 -77 -316
Overall Balance 4,373 5,050 3,169 -885 -1,034 -975
Source: Bangladesh Bank
in the first seven months of F19, from slightly over $1 billion in the first seven months of FY18.
The reduction in the financial account surplus from $4.3 billion in the first seven months of FY18
to $3.5 billion in the corresponding period of FY19 is attributable largely to a $1.5 billion increase
in trade credit outflows and $1.2 billion decrease in inflows from international financial
transactions by the banks and non-bank financial institutions over the same period. A net $1.8
billion inflow on account of “other” short and long-term credit cushioned the impact of expanded
trade credit and reduced inflows from banking transactions on the financial account surplus.
The BB’s foreign exchange market intervention has continued. After the Bangladesh taka
depreciated by 4 percent against the US dollar in FY18, the inter-bank exchange rate depreciated
further to Tk 84 per US dollar in February 2019, while the unofficial market exchange rate stood
at 83.8 (Figure 9). The BB intervened frequently to moderate the depreciation of the taka by selling
USD. By early March 2019, it had sold a cumulative $1.7 billion in FY19, following sales of $2.3
billion in FY18. Persistent BB intervention on the supply side in the interbank market reduced
demand in the informal market, leading to near elimination of the difference between the
informal market and the interbank average exchange rates. Against the Euro and pound-sterling,
however, the taka has appreciated so far in FY19 from Tk 97.40 per euro and Tk 110.96 per pound-
sterling in June 2018, to Tk 94.20 and Tk 107.76, respectively, in February 2019. Despite the
decline, foreign exchange reserves have remained adequate at nearly 5.9 months of prospective
GNFS imports in FY19 (Figure 10).

10
While helping maintain exchange rate
stability, BB interventions in the foreign
exchange market are contributing to a loss of
price competitiveness (Figure 11). The Real
Effective Exchange Rate (REER)8 appreciated by
4.1 percent in the second half of 2018 relative to
its level in June 2018 (Figure 12). This more than
reversed the 2.5 percent depreciation in the
REER in FY18. Consequently, the taka in real
effective terms was 33 percent higher in
December 2018 relative to its level in June 2013,
despite depreciating by 8.7 percent in nominal
terms against the US dollar during the same
period. The real appreciation of the taka is
attributable to faster domestic inflation relative
to inflation in Bangladesh’s key trading
partners, as well as the nominal appreciation
of the taka against other major trading
partners’ currencies. The taka appreciated by
11.1 percent and 6.8 percent in nominal terms
against the pound-sterling and the euro,
respectively, between June 2013 and December
2018.
8 This the IMF’s REER index that includes a total of 35 countries comprising China, United States, Germany, India, Japan, UK, France, Italy, Spain, South Korea, Singapore, Netherlands, Taiwan, Turkey, Canada, Belgium, Thailand, Poland, Russian, Malaysia, Australia, Vietnam, Indonesia, Switzerland, Pakistan, Sweden, Mexico, Saudi Arabia, Brazil, Austria, Denmark, United Arab Emirates, Czech Republic and Ireland.
78.0
79.0
80.0
81.0
82.0
83.0
84.0
85.0
86.0
87.010-J
ul-16
10-A
ug-1
610-S
ep-1
610-O
ct-1
610-N
ov-1
610-D
ec-
16
10-J
an-1
710-F
eb-1
710-M
ar-
17
10-A
pr-
17
10-M
ay-1
710-J
un-1
710-J
ul-17
10-A
ug-1
710-S
ep-1
710-O
ct-1
710-N
ov-1
710-D
ec-
17
10-J
an-1
810-F
eb-1
810-M
ar-
18
10-A
pr-
18
10-M
ay-1
810-J
un-1
810-J
ul-18
10-A
ug-1
810-S
ep-1
810-O
ct-1
810-N
ov-1
810-D
ec-
18
10-J
an-1
910-F
eb-1
9
Figure 9: Inter-bank and Informal Exchange rate
Inter-bank transaction Unofficial market rate
Monetary
Tightening (Reduce
ADR)
Monetary
Easing(CRR
reduction)
Source: Bangladesh Bank
30.5
31.0
31.5
32.0
32.5
33.0
33.5
34.0
US
$ b
illi
on
Figure 10: Foreign Exchange Reserves (end of Period)
Source: Bangladesh Bank
0.0
0.5
1.0
1.5
2.0
2.5
3.0
3.5
4.0
4.5
5.0
FY11 FY12 FY13 FY14 FY15 FY16 FY17 FY18 FY19*
(USD
bill
ion)
Figure 11: Bangladesh Bank's Foreign currency
transaction
Selling (USD) Buying (USD)
Source: Bangladesh Bank*Until Jul-feb
75.0
90.0
105.0
120.0
135.0
150.0
Jun-1
3
Sep-1
3
Dec-
13
Mar-
14
Jun-1
4
Sep-1
4
Dec-
14
Mar-
15
Jun-1
5
Sep-1
5
Dec-
15
Mar-
16
Jun-1
6
Sep-1
6
Dec-
16
Mar-
17
Jun-1
7
Sep-1
7
Dec-
17
Mar-
18
Jun-1
8
Sep-1
8
Dec-
18
Figure 12: Real Effective Exchange Rate (Index)
Source: IMF
11
The fiscal deficit widened but remains well within sustainable thresholds. Domestic financing of the deficit
has begun to shift towards less expensive sources, and the GoB has restrained somewhat the sale of NSCs.
The maintenance of a prudent cap on the budget deficit has helped mitigate inflationary pressure and avoid
crowding out credit to the private sector. Tax revenue mobilization has slipped further, reflecting the impact
of several recent ad hoc tax cuts and exemptions, as well as slow progress in the automation of
administrative processes. Subsidies to exports and energy increased, and there was a rush of new
development projects in the Annual Development Program but no concomitant increase or focus on
improving the quality of expenditure. Low revenues have shrunk the fiscal space for meeting spending gaps
in infrastructure, health, education and social protection.
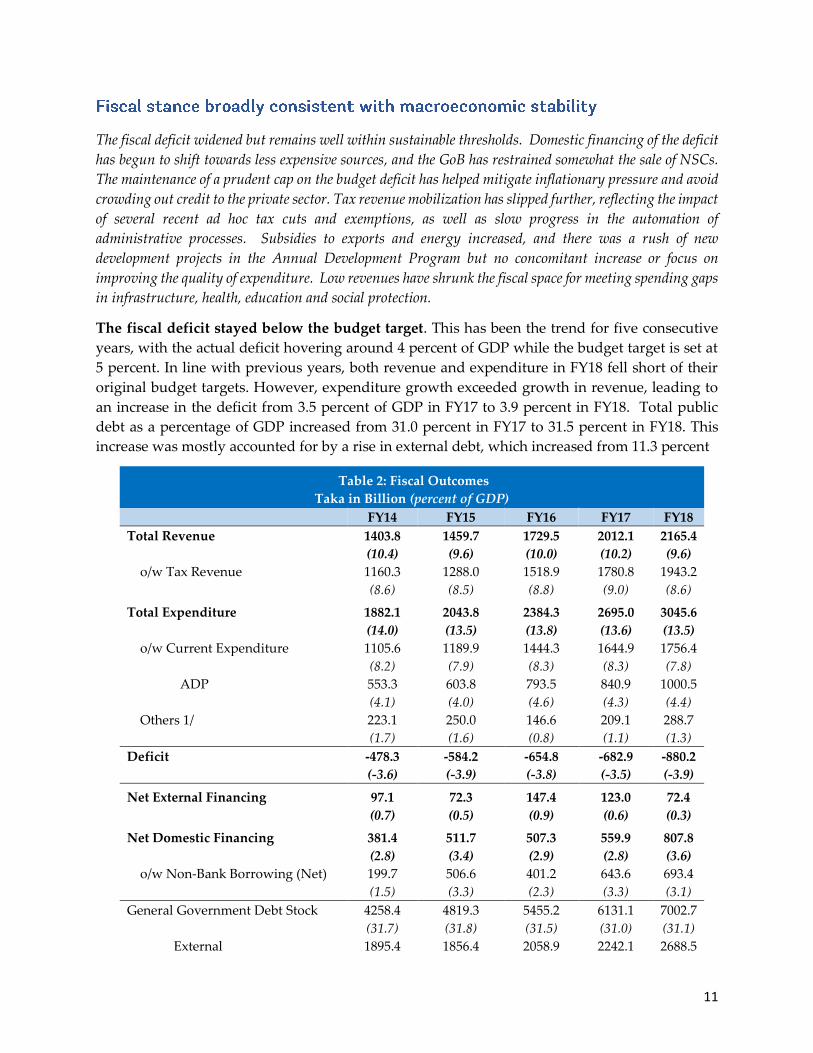
The fiscal deficit stayed below the budget target. This has been the trend for five consecutive
years, with the actual deficit hovering around 4 percent of GDP while the budget target is set at
5 percent. In line with previous years, both revenue and expenditure in FY18 fell short of their
original budget targets. However, expenditure growth exceeded growth in revenue, leading to
an increase in the deficit from 3.5 percent of GDP in FY17 to 3.9 percent in FY18. Total public
debt as a percentage of GDP increased from 31.0 percent in FY17 to 31.5 percent in FY18. This
increase was mostly accounted for by a rise in external debt, which increased from 11.3 percent
Table 2: Fiscal Outcomes
Taka in Billion (percent of GDP)
FY14 FY15 FY16 FY17 FY18
Total Revenue 1403.8 1459.7 1729.5 2012.1 2165.4
(10.4) (9.6) (10.0) (10.2) (9.6)
o/w Tax Revenue 1160.3 1288.0 1518.9 1780.8 1943.2
(8.6) (8.5) (8.8) (9.0) (8.6)
Total Expenditure 1882.1 2043.8 2384.3 2695.0 3045.6
(14.0) (13.5) (13.8) (13.6) (13.5)
o/w Current Expenditure 1105.6 1189.9 1444.3 1644.9 1756.4
(8.2) (7.9) (8.3) (8.3) (7.8)
ADP 553.3 603.8 793.5 840.9 1000.5
(4.1) (4.0) (4.6) (4.3) (4.4)
Others 1/ 223.1 250.0 146.6 209.1 288.7
(1.7) (1.6) (0.8) (1.1) (1.3)
Deficit -478.3 -584.2 -654.8 -682.9 -880.2
(-3.6) (-3.9) (-3.8) (-3.5) (-3.9)
Net External Financing 97.1 72.3 147.4 123.0 72.4
(0.7) (0.5) (0.9) (0.6) (0.3)
Net Domestic Financing 381.4 511.7 507.3 559.9 807.8
(2.8) (3.4) (2.9) (2.8) (3.6)
o/w Non-Bank Borrowing (Net) 199.7 506.6 401.2 643.6 693.4
(1.5) (3.3) (2.3) (3.3) (3.1)
General Government Debt Stock 4258.4 4819.3 5455.2 6131.1 7002.7
(31.7) (31.8) (31.5) (31.0) (31.1)
External 1895.4 1856.4 2058.9 2242.1 2688.5

12
(14.1) (12.2) (11.9) (11.3) (11.9)
Domestic 2363.0 2962.9 3396.3 3889.0 4314.1
(17.6) (19.5) (19.6) (19.7) (19.2)
Source: Ministry of Finance
1/ others include food account, and non-ADP capital and net lending
of GDP in FY17 to 11.9 percent in FY18. In contrast, the share of total domestic debt in GDP
decreased from 19.7 percent to 19.2 percent in the previous fiscal year (Table 2).
Revenue growth weakened further. Total revenue collection in the first six months of FY19 stood
at BDT 980.2 billion, which is only 6.4 percent higher than the same period of the previous year,
the smallest in recent memory and 77.8 percent of the target for this period. The increase in
revenue collection came from an 11.1 percent increase in income taxes, an 11.4 percent increase
in VAT from imports and a 10.5 percent increase in domestic VAT revenues. The tax to GDP ratio
in FY18 was 8.6 percent, which remains very low even by developing country standards. A recent
study9 shows that 68 percent of the eligible taxpayers and more than one-third of the top earners
did not pay income tax in 2017.
Significant tax cuts were allowed after the approval of the FY19 budget. Several tax concessions
made in the run up to the elections in December 2018 have made achieving an already
overambitious 34 percent revenue growth target for FY19 even more difficult. The reduced 15
percent income tax benefit for the Asset Management Companies on their income from the
management of mutual funds was extended until 2023. Bangladesh Shipping Corporation (BSC)
was allowed a 15 percent VAT exemption to import six cargo vessels. Travel agents have also got
15 percent VAT exemption on their commission earnings from the sales of air tickets. RMG
exporters will enjoy a full waiver of 5 to 15 percent VAT on expenditure on workers’ welfare and
entertainment, laboratory test fees, IT-enabled services, and a rent-a-car facility. Moreover, the
advance income tax on garment exports has been lowered from 0.6 percent of the shipment value
of exports to 0.25 percent. The tax exemption has been extended from 3 years to 7 years for firms
operating in hi-tech parks. Here, the rate of tax waiver will be 70 percent from the 8th to the 10th
year, after which it will be completely phased out. Furthermore, NBR has issued a Statutory
Regulatory Order (SRO) waiving 5 percent custom duty on import of Liquefied Natural Gas
(LNG). Along with tax exemptions, NBR has also reduced the withholding tax on the total
proceeds from exports for all items, except for jute goods to 0.25 percent. Previously, the source
tax was increased to 1 percent in the FY19 budget for cloth and other manufactures with the aim
of increasing revenue. According to NBR, these tax concessions together could result in revenue
losses of about Tk 150 billion in FY19. The impact of the tax cut on the fiscal balances are likely to
be exacerbated by the extension of export subsidies to eight new products and increased the size
of existing subsidies.10
9 See CPD (2018) 10 Before the expansion, cash incentives ranging from 2 to 20 percent were in place for 26 product categories. The new products will get subsidy of 5 to 10 percent. Note that industries set up in the export processing and economic zones are not entitled to cash export subsidy as they enjoy various tax benefits.

13
Annual Development Program (ADP)
implementation continues to be a challenge.
Implementation Monitoring and Evaluation
Division (IMED) data show that 34.2 percent of
FY19 ADP allocation was utilized during the
first seven months of FY19. The total released is
13.7 percent more than during the same period
of the previous year. Project aid utilization was
38.1 percent, while 32.4 percent of allocated
local resources were spent (Figure 13).
Concerns about the quality of expenditures
remain. According to a recent study, during
FY08-17, among all the projects that were stated completed, about 66.6 percent (on average) were
without 100 percent physical completion (see CPD 2018). In order to improve the quantity and
quality of ADP implementation, IMED suggested adding several features in the ‘Development
Project Proposal (DPP), including a compulsory feasibility study report, annual maintenance
chart, analysis of stakeholders, and responsibilities of project directors and executing agencies.
There was a pre-election boom in development project approvals. The Government of
Bangladesh’s Executive Committee of the National Economic Council (ECNEC) set a new
historical record by clearing 85 projects for Tk 568.2 billion in six meetings between July and
September, and another 82 projects for Tk 887.8 billion in four meetings held alone in October. In
November, it approved 28 projects costed at Tk 302.3 billion. While some of these are
projects funded by the World Bank and the ADB, most of the approved projects lack
identified sources of financing. These projects aim at enhancing rural and district roads,
improving the electricity distribution system, boosting city corporation development, building
schools and colleges in the rural areas, and constructing residential facilities for public officials.
Overall government borrowing
increased. The government continued to
rely heavily on domestic borrowing to
finance the fiscal deficit. On average
domestic borrowing consisted of about 80
percent of total borrowing in the last few
years. This includes both bank and non-
bank borrowing. Net government
domestic borrowing stood at Tk 254.2
billion during the first five months of
FY19, which is 35 percent higher than
during the same period the previous year.
Borrowing from the banking system
increased during this period. The government borrowed Tk 24.2 billion through T-bills and
bonds. In the FY19 budget, the government fixed the target for borrowing from domestic sources
50.0
55.0
60.0
65.0
70.0
75.0
80.0
85.0
Ta
ka
in
bil
lio
n
Figure 14: Selling of National Saving Certificate
Source: Bangladesh Bank
0.0
15.0
30.0
45.0
60.0
75.0
90.0
Figure 13: ADP Utilization ( percent of Total
Allocation)
FY 16 FY 17 FY 18 FY19
Source: IMED- ERD

14
at Tk 712.2 billion, of which Tk 420.3 billion is targeted from the banking sector and the rest from
the non-banking sector.
NSD certificates dominate domestic borrowing. Non-bank government borrowing during the
first five months of FY19 stood at Tk 230 billion, about 98 percent of which came from the sale of
NSD certificates (Figure 14). In the revised budget of FY18, Tk 440 billion was to be borrowed
from NSD certificates. However, the actual borrowing amounted to Tk 465 billion. During FY14-
18, the share of outstanding public debt from the banking sector decreased gradually, whereas
the debt liabilities from the more expensive NSD certificates increased significantly.
The rise in total public debt is well within sustainability thresholds. According to the latest
IMF-WB Debt Sustainability Analysis, the risk of external debt distress and overall debt distress
continue to be low. All debt indicators under the baseline remained within respective policy
dependent thresholds. Only the threshold for the external debt service to revenue was breached
temporarily under the most extreme stress test scenario, but the breach is small.
State-owned enterprises (SOEs) remain a fiscal burden. Financial losses of SOEs, especially
those in the energy and financial sectors, continue to draw upon the government budget. The
losses of the power sector SOEs for FY17 are estimated at about Tk 51.4 billion (US$620 million),
or 0.3 percent of GDP, compared with Tk 38.6 billion (0.22 percent of GDP) in FY16. The increase
in losses was mainly due to underpricing of energy products in domestic markets. Biman (the
national airline) and Bangladesh Chemical Industries Corporation were the other main loss-
makers. The losses of the SOEs have exacerbated weaknesses at the Nationalized Commercial
Banks. These raise some fiscal risks and will make any future divestment of these banks more
expensive.
The GoB recapitalized the state-owned banks by injecting over Tk 145 billion since 2009, yet the
shortfalls have persisted due to lingering weaknesses in their corporate governance. Government
loan guarantees continued to rise, reaching 3.2 percent of GDP in FY18. Financial losses of the
SOE’s and the consequent pressures for financing either through the state-owned banks or the
central government budget, remains a concern. Subsidies to Bangladesh Petroleum Corporation
(BPC) are likely to come back if oil prices keep increasing.
Box 1: NSD Saving instruments
National Savings are issued at an average interest rate of 11.76 percent, serving about 20 million
investors. The main aim of these savings certificates is to protect women, retired government employees,
senior citizens, non-resident Bangladeshis and disadvantaged marginalized citizens. In the absence of a
well-functioning pension and social security system, these savings certificates have been working as a
social safety net for many people. Therefore, it has become very difficult for the government to
discontinue the high yielding assets, as it will reduce lucrative investment options for many people who
depend on these for old age insurance. However, the government can take steps to remove the loopholes
so that these certificates only serve the intended section of the population who really need financial
assistance, rather than using it as a major source of deficit financing. For example, some of the saving
certificates (such as ‘Family Savings Certificates’) have limits on how much one individual can buy.
However, there is no effective mechanism to keep individual records. As a result, it becomes impossible
to trace whether one is crossing the limit or buying them under a different identity. If the aim is to limit

15
these bonds to marginalized women and retirees, then a mechanism should be in place to check the
income level and the wealth of the people who are buying these instruments.
For some bonds, there are no limits on how much an individual or family can buy, and even where there
are limits, they are too high, allowing relatively wealthy individuals to invest. For ‘Wage Earners Bonds’,
a system should be in place to confirm that the foreign currencies that are being used to buy the bonds
are earned as wages in a foreign country and are not re-entering the country after being illegally taken
out. In addition to imposing much stringent eligibility criteria and reducing the interest rate, the
government should also reduce the amount they seek to collect from the sale of these NSD certificates.
With banks paying interest rates on deposits not much higher than the rate of inflation, individual
households will not be inclined put their money into bank deposits when they are getting a guaranteed
double-digit interest rate on NSD certificates whenever they can buy them.

16
Bangladesh is poised to maintain 7 percent plus growth over the medium-term. Domestic demand growth
is strong, with private investment likely to gain momentum from the dissipation of political uncertainties
and implementation of ease of doing business reforms. With actual output exceeding potential in the short
term, price stability may be tested. Coupled with elevated global risks, this reinforces the need for accelerated
structural reforms to increase potential output and build fiscal and external buffers.
Global growth is projected to moderate.11 Activity in advanced economies is expected to slow,
as capacity constraints become more binding and accommodative policy is phased out. The
recovery in trade and manufacturing activity is losing steam. The recovery in emerging market
and developing economies (EMDEs) is projected to be weaker than previously anticipated, with
some large economies losing momentum due to financial stress. Global growth is expected to
moderate from 3 percent in 2018 to 2.9 percent in 2019, and to level off at 2.8 percent in 2020-21.
Economic activity in advanced economies has been diverging of late. Growth in the United
States is expected to slow to 2.5 percent in 2019 and soften further to 1.8 percent in 2020 with the
unwinding of the fiscal stimulus and the rise in policy interest rates. The projected pace of
expansion is above the estimated potential growth rate of US economy in both years. Growth in
the euro area is set to moderate from 1.8 percent in 2018 to 1.6 percent in 2019 and increase to 1.7
percent in 2020. Growth rates are projected to weaken for many economies, notably Germany,
Italy and France. There is substantial uncertainty around the baseline projection of about 1.5
percent growth in the United Kingdom in 2019-20. These four accounts for nearly 50 percent of
Bangladesh’s total merchandize export destination countries. With stalled recovery in EMDEs,
growth in this group of countries is predicted to remain at 4.2 percent in 2019, with a markedly
weaker-than-expected pickup in commodity exporters accompanied by a sharper-than-expected
deceleration in commodity importers. In China, activity remains robust but is decelerating, with
the negative impact of trade tensions buffered by calibrated policy interventions.
Global inflation is likely to be stable. Crude oil prices have been volatile since August,
reflecting US policy on Iranian oil exports and, more recently, fears of softening global demand.
As of early January, crude oil prices stood at around $55 a barrel, and average oil prices are
projected at around $67 per barrel in 2019 and 2020. Metals prices are expected to decrease 7.4
percent (y-o-y) in 2019 and to remain roughly unchanged in 2020. Prices of metals and
agricultural commodities have softened slightly since August, in part due to subdued demand
from China. Consumer price inflation has generally remained contained in recent months in
advanced economies, but has inched up in the United States, where above-trend growth
continues. Among emerging market economies, inflationary pressures are easing with the drop
in oil prices. For some, this easing has been partially offset by the passthrough of currency
depreciations to domestic prices.
Downside global risks are elevated. Key sources of risk to the global outlook are the outcome of
trade negotiations and the direction financial conditions will take in near-term. If countries
11 Based on the World Bank, Global Economic Prospects 2019.

17
resolve their differences without raising distortive trade barriers further, and market sentiment
recovers, then improved confidence and easier financial conditions could reinforce each other to
lift growth. However, the balance of risks remains skewed to the downside. Global trade,
investment, and output remain under threat from policy uncertainty, as well as from other
ongoing trade tensions. Failure to resolve differences and a resulting increase in tariff barriers
would lead to higher costs of imported intermediate and capital goods and higher final goods
prices for consumers. Beyond these direct impacts, higher trade policy uncertainty and concerns
over escalation and retaliation would lower business investment, disrupt supply chains, and slow
productivity growth. A range of catalyzing events in key systemic economies could spark a
broader deterioration in investor sentiment and a sudden, sharp repricing of assets amid elevated
debt burdens. Global growth would likely fall short of the baseline projection if any of these
events were to materialize. The rising possibility of a disruptive, no-deal Brexit with negative
cross-border spillovers adds to the downside risks, particularly if it leads to significant weakening
of the pound against the US dollar, which will cause appreciation of the taka against the pound.
Another source of systemic financial stability risk is a deeper-than-envisaged slowdown in China,
with negative implications for trading partners and global commodity prices. Beyond the
possibility of escalating trade tensions and a broader turn in financial market sentiment, other
factors adding to increased risk to global investment and growth include uncertainty about the
policy agenda of new administrations, as well as geopolitical tensions in the Middle East and East
Asia.
Bangladesh’s growth outlook remains strong and stable due to sound macroeconomic
fundamentals and resilient domestic demand over the near-term. Output growth in FY19 is
projected at 7.3 percent, driven by industry and services on the supply side and private
consumption and exports on the demand side. Strong growth in garment exports and remittances
and bumper agricultural harvests are driving private consumption growth, while deceleration in
import growth is projected to narrow the size of negative net exports in FY19. The dissipation of
political uncertainties and ongoing doing business reforms will unlock private investment, while
accelerated implementation of mega public projects will boost public investment in FY20-21.
Doing business reforms to attract private investment include instituting a more streamlined
environment for investment facilitation, establishing a One-Stop-Shop (OSS), and easing
company regulation; modernizing customs; and increasing access and improving efficiency of
the bonded warehouse regime. Expected to be completed by the end of 2020, these reforms will
reduce the cost and time to set up and operationalize a business, increase the speed and
predictability of processing times for importing and exporting, thereby enhancing the
competitiveness of exporters as well as firms using imported inputs to sell into the domestic
market. Increased transparency and efficiency of the Special Bonded Warehouses (SBW) program
will enable more firms, particularly from sectors outside RMG, to benefit from the SBW regime,
supporting expansion in labor intensive, export-oriented manufacturing sectors. Together, these
will contribute to increased investment and jobs growth through a significant increase in new
business registrations as well as firm expansions, underpinning sustained growth above 7 percent
in the medium term.

18
Macroeconomic stability likely to continue, notwithstanding some pressures. Inflation is
projected to remain high at around 6 percent, induced by actual output over potential and
expansionary fiscal policy. The current account deficit is projected to narrow moderately as
import growth slows reflecting a significant reduction in food and capital machinery imports. A
large shortfall in government revenue is expected due to a reduction in taxes on garments, LNG,
travel agencies and banks, as well as a lack of revenue enhancing administrative measures. Also,
additional pressures on expenditures are likely due to expanded export subsidies, the need for
bank recapitalizations, and spending associated with the Rohingyas. These together may widen
the budget deficit and increase the Debt-GDP ratio.
Monetary policy vigilance is needed. The BB released the Monetary Policy Statement (MPS) for
the second half of FY19, keeping the repo and reverse repo rates at current levels of 6 and 4.75
percent, respectively. Monetary policy seeks to maintain the growth momentum while keeping
inflationary pressure at a reasonable level. The broad money (M2) and domestic credit growth
ceiling were kept unchanged from the last MPS at 12 percent and 15.9 percent, respectively.
However, the private sector credit growth ceiling was revised down by 0.3 percentage point to
16.5 percent, given the decline in recent months. The BB recognizes the constraints on the two-
way flexibility of interest rates and the monetary policy transmission channels arising from the
heavy reliance on non-market instruments like NSCs. Monetary policy implementation can be
made more effective through market based NSC pricing.
Table 3: Macro Indicators
(annual percent change, unless indicated otherwise)
2015 2016 2017 2018 2019p 2020p 2021p
Real GDP growth, at constant market prices 6.6 7.1 7.3 7.9 7.3 7.4 7.3
Private Consumption 5.8 3.0 7.4 11.0 6.8 6.9 6.9
Government Consumption 8.8 8.4 7.8 15.4 8.0 9.5 10.7
Gross Fixed Capital Investment 7.1 8.9 10.1 10.5 11.2 11.2 10.3
Exports, Goods and Services -2.8 2.2 -2.3 8.1 5.2 5.4 4.8
Imports, Goods and Services 3.2 -7.1 2.9 27.0 10.5 11.1 10.4
Real GDP growth, at constant factor prices 6.5 7.2 7.2 7.9 7.3 7.4 7.3
Agriculture 3.3 2.8 3.0 4.2 4.1 3.5 3.1
Industry 9.7 11.1 10.2 12.1 9.9 10.0 9.9
Services 5.8 6.2 6.7 6.4 6.6 6.7 6.5
Inflation (Consumer Price Index) 6.4 5.9 5.4 5.8 6.0 6.3 6.1
Current Account Balance (percent of GDP) 1.5 1.9 -0.5 -3.5 -3.2 -2.8 -2.9
Net Foreign Direct Investment (percent of GDP) 0.9 0.6 0.7 0.6 0.6 0.5 0.5
Fiscal Balance (percent of GDP) 1/ -3.7 -3.7 -3.4 -3.9 -4.2 -4.4 -4.6
Debt (percent of GDP) 31.8 31.5 31.0 31.1 32.8 34.7 35.1
Primary Balance (percent of GDP) 1/ -1.7 -1.8 -1.6 -2.1 -2.2 -2.2 -2.3
Source: WB staff estimation; Bangladesh Bureau of Statistics; Bangladesh Bank, Ministry of Finance
1/Including grants
P=projection

19
With growth projected to remain strong and expectations of one year ahead average inflation
in the 6-7 percent range,12 the BB needs to remain prudent in the execution of the announced
monetary program. The BB operates a quantity-based policy regime to keep broad money growth
in line with its inflation objective. Steps are being taken over the medium term to strengthen the
monetary policy transmission mechanism by moving towards interest rate targeting,
emphasizing the importance of price stability as the primary objective, greater exchange rate
flexibility, further development of financial markets, and improved forecasting of banking and
government liquidity. Despite some nominal depreciation against the US dollar, the real effective
exchange rate has continued to appreciate. While intervention in the foreign exchange market is
warranted to avoid excessive volatility, enhanced flexibility would help buffer the economy
against external shocks, preserve the level of reserves, and increase monetary policy autonomy.
Overall fiscal prudence needs to continue. Fiscal policy is expected to keep the public debt ratio
within sustainable thresholds over the medium term. As in previous years, the FY19 budget is
based on ambitious projections for revenue growth and correspondingly ambitious capital
spending targets. Current spending is rising due to expanding subsidies on energy and exports,
as well as expenditure on public pensions and interest payments. The medium-term fiscal deficit
target of less than 5 percent of GDP is appropriate. Revenue mobilization is expected to be
strengthened by the planned implementation of the VAT in July 2019, and subsequently by the
implementation of the new Customs Law. At the same time, efforts are underway to expand the
tax base by improving tax administration. In parallel, the government is implementing the Public
Financial Management Action Plan 2018-2023, along with further reforms to improve financial
control of budget allocations, real-time monitoring of budget execution, and integration of
recurrent and capital spending.
Downside external risks have deepened while domestic risks are balanced. Expansion in major
advanced economies, Bangladesh’s largest export markets, may slow. Key uncertainties are the
trajectory for monetary tightening and its impact on emerging markets, the intensity and
economic fallout from U.S.-China trade frictions, the adverse impact of Brexit on the UK and EU
economies and tighter financial conditions in the euro zone. These could dent growth of demand
for Bangladesh’s exports and slow remittance inflows. The peaceful conclusion of national
elections in December 2018 has significantly improved prospects of continued political stability.
Increases in NPLs and weak corporate governance in the banking sector could limit its ability to
finance growth and lead to continuing a fiscal burden. To mitigate these risks, the government
will need to continue implementing macroprudential measures, including strictly enforcing the
new ADR limits on commercial banks, and avoiding relaxing existing caps on credit growth in
the state-owned banks. Contingent liabilities from high non-performing loans in state owned
commercial banks and SOE losses could result in higher domestic debt.
12 Bangladesh Bank, Monetary Policy Statement, January-June 2019, page-7

20
The new cabinet faces several short and long-term development challenges. An immediate challenge is to
address the macroeconomic stability concerns rooted in banking sector ailments, revenue shortfalls, and
pressure on foreign exchange reserves. At the same time, there is an urgent need to bolster the capacity to
cope with tighter external financing conditions. Ensuring financial stability, strengthening revenue
mobilization, improving infrastructure, enhancing human capital and streamlining business regulation
would also help address the challenges associated with informality, thus reinforcing the basis for future
productivity growth.
The government’s Vision 2041 seeks to eliminate extreme poverty and secure upper middle-
income country status by 2031 and achieve high income country status by 2041. Converging
towards these targets within the specified timeframe will require massive investments in physical
capital, human capital and innovation, enabled by structural reforms in key areas such as the
financial sector, fiscal policy, infrastructure, human development, and business regulation. Any
reform effort requires a clear strategy, political champions supported by a capable reform team,
and well-established consultation and coordination mechanisms to ensure a high level of
coordination among all relevant stakeholders.
Achieving the government’s vision will require addressing some challenges. These include:
The dominant banking sector is characterized by poor asset quality and concerns over the
supervisor’s enforcement capacity. Stress testing by BB indicates that loan defaults are the most
significant risk on capital adequacy. Sensitivity is particularly high to the top large borrowers.
Default by the top three large borrowers results in 23 banks falling below the minimum
regulatory Capital to Risk Weighted Asset Ratio (CRAR). Much of this is driven by the
burdensome court litigation process – Bangladesh is ranked 189 out of 190 in Doing Business 2019
(DB2019) for enforcing contracts.13 Further, DB2019 estimates that loan recovery rates are as low
as 28.3 cents on the dollar. These severely limit the supervisor’s enforcement capacity.
The SCBs and SDBs pose a financial and fiscal stability risk, exhibiting high losses, low capital
and weak corporate governance. SCBs and SDBs underperform on capital adequacy, NPLs and
profitability. State-owned banks suffer from weak internal controls and risk management
practices, as well as significant inefficiencies. There is inadequate clarity in defining ownership
purpose and rationale, and setting criteria for developmental impact, as well as commercial and
operational success. While SDBs have a higher concentration on agricultural loans, SCBs are
mostly in direct competition with the private sector.
The BB has been strengthening supervision and regulation. BB has issued new risk
management guidelines for all banks, aiming to control the NPLs and the increasing risks in the
banking sector. These will replace the guidelines issued in February 2012 and September 2015.
13 Several borrowers appear to have had their NPL status and credit information report stayed by the Courts, allowing them to receive fresh loans and potentially further contributing to the NPL issue.

21
The new guidelines require each bank to prepare a Comprehensive Risk Management Guideline
(CRMG) to be approved by the respective bank’s Board and submitted to BB. Banks are required
to appoint Chief Risk Officer as the head of the risk management department and reconstruct the
risk management organogram. The BB also asked lenders to increase the use of electronic
payment channels, such as the ‘Real-Time Gross Settlement’ and ‘Bangladesh Electronic Fund
Transfer Network,’ to promote transparency and efficiency. The BB has asked banks to maintain
an ‘Internal Credit Risk Rating’ to help them manage and control credit risks.
The BB has introduced a new policy for offshore banking operations. Banks, which are or
intend to engage in offshore banking, must invest at least 75 percent of total outstanding offshore
operations' funds inside the country and comply with the cash reserve requirement (CRR) and
the statutory liquidity ratio (SLR). Any bank wishing to operate offshore banking must obtain
approval from BB. Moreover, banks must follow Asset Liability Management (ALM)
guidelines for their offshore banking operations. In addition, closure of a bank's offshore
banking operations, as well as shifting and merging of any offshore banking unit, requires prior
permission from BB. Loans under offshore banking operations are required to be reported to the
Credit Information Bureau (CIB) of the BB.
There are continuing concerns regarding enforcement capacity. Bangladesh appears to be ahead
of other South Asian countries with Basel III implementation, which includes the definition of
capital, the establishment of a capital conservation buffer, and the meeting of leverage ratios and
liquidity standard measures. Nevertheless, there are capacity related concerns on the BB
stemming from the overall state of the banking sector as well as negative repercussions of
anecdotal market concerns over political pressures. Ten banks failed to maintain the regulatory
capital in in the first quarter of 2018, and nine banks failed to comply with NPL provisions, calling
into question BB’s credibility and ability to take prompt corrective actions. Financial institutions
have never been allowed to fail, and the contingency planning and lender of last resort policies
introduced in 2013 have never been tested. Finally, the Asia-Pacific Group on Money Laundering
released a mutual evaluation report in 2016 and a follow up in 2018 that cite numerous gaps on
the country’s anti-money laundering and combating the financing of terrorism (AML/CFT)
system, placing the country on enhanced follow-up.
Given the overall state of the banking sector and the outlook, improving banking sector
governance calls for policy action. These include: (i) ensuring true autonomy of the BB as the
sole regulator of the financial sector, including full regulatory oversight on the state-owned
banks;14 (ii) tightening regulation on loan rescheduling and stopping special rescheduling; and
(iii) integrating risk-based supervision and risk-weighted classification of assets in the BB’s
supervisory framework.
The government’s development commitments underscore the urgency to improve domestic
revenue mobilization and to deepen public financial management reforms aimed at improving
14 Undermining Bangladesh Bank’s regulatory prerogative by influential quarters like Bank owners’ association is damaging integrity of the financial sector.

22
the efficiency of service delivery. Domestic resource mobilization is a core priority in the
sustainable development agenda. Increasing the tax-GDP ratio must be one of the major
objectives of the government. In the absence of an effective VAT and SD Law 2012, which is
expected to come into effect in the beginning of FY20, the government has been exploring
alternative avenues of revenue mobilization.15 Weak institutional capacity and a plethora of tax
exemptions reduce the revenue base. The number of slabs in the VAT was reduced to five from
nine in the FY19 budget. Reduction of VAT and SD rates and casting the VAT net more widely to
new services such as Uber and different e-commerce is likely to have counteracting effects. To
limit tax evasion, the National Board of Revenue (NBR) introduced a new clause in the ‘Income
Tax Ordinance’ which will require all private organizations to inform the NBR about their
employees' income tax information each year.
Contribution from direct taxes needs to increase further. Notwithstanding some visible
improvements over time, the tax structure depends too heavily on indirect taxes, especially taxes
on trade (Table-4). Preparation and implementation of the new Direct Tax Act can be another
important milestone in the revenue reform effort. The corporate tax rate is higher in Bangladesh
than the Asian average of 21 percent and the global average of 24 percent.16 Corporate tax has
also been a major source for revenue, accounting for about 65 percent of total income tax
collection. Corporations in Bangladesh already receive several tax benefits including tax holidays
and reduced tax rates in selected sectors and economic zones. There is evidence that tax incentives
do not work as well in developing countries as they do in developed countries (OECD 2002). It is
imperative to overhaul the corporate tax regime by lowering rates and eliminating tax
exemptions and holidays that have outlived their original tenures.
Table 4: Structure of Total NBR tax collection
FY00 FY05 FY10 FY15 FY18
Indirect Tax 81.6 80.3 71.8 64.4 68.2
Trade Tax 54.9 50.4 36.9 28.2 29.9
Domestic Tax 26.7 29.9 34.9 36.1 38.2
Direct Tax 18.4 19.7 28.2 35.6 31.8
Source: National Board of Revenue (NBR)
. Moving forward, the following appear to be key fiscal reform priorities:
• Implementing the VAT and SD law 201217 with as little modification as possible from its current
design. There are pressures for multiple rates and restoration of truncated base. These need to
be judiciously managed. Implementation of the SD part of the law will help reduce the
incidence of trade taxation.
15The government made attempts to digitalize some activities through the introduction of the automated return process, bank search tool, advanced tax reminder tool, LTU-VAT mobile app, customs e-payments, VAT East and Benpass software etc. These steps, however, are unlikely to increase the revenue base by a significant margin as the taxpayers might not have enough incentive to use them. 16 Based on corporate tax rate table by KPMG. 17 VAT law implementation has suffered long delay due to delays in the design of implementation modalities and at the same time stiff resistance from the business to having a single VAT rate and complete elimination of all exemptions and rebates. These issues are still under discussion.

23
• Overhauling the income tax regime. Lowering and unifying corporate tax rates while eliminating
exemptions and holidays will yield gains in efficiency and compliance. Simplifying the
personal income tax regime by removing all direct interface between the taxpayers and tax
collectors will help expand the currently very low personal income tax base.
• Improving public investment management (PIM) by focusing initially on (i) introducing a multi-
year Public Investment Program; (ii) strengthening project design, appraisal and approval;
and (iii) institutionalizing the PIM reform agenda. Targeting reforms at the selection and
budgeting stage of PIM can contribute to addressing the challenge of a suboptimal selection
mechanism, which combined with existing budgeting and implementation practices, lead to
an overloaded ADP. With a strong framework provided by a multi-year PIP, the design,
appraisal and approval system could be strengthened. Institutionalization of the PIM reform
agenda through establishing effective consultation and coordination mechanisms is a
prerequisite for successful reforms.
• Addressing bottlenecks in public financial management as envisaged in the government’s Public
Financial Management Action Plan 2018-23. PFM bottlenecks affect the efficient allocation,
availability, and use of resources for social service delivery. The annual budgets are mostly
incremental with limited flexibility for equitable resource allocation geographically or among
different programs. Delays in budget releases are often cited as one of the biggest bottlenecks
to smooth and efficient service delivery. Social sector budgets are fragmented because of the
vertical programs and externally financed interventions that pose several management
challenges at the level of the budget holders and frontline service providers.
• Delinking SOEs from the national budget to harden their budget constraint and incentivize the
agents managing SOEs to look for better return on assets or face restructuring, liquidation or
privatization. This is a long-term agenda. In the short-term, better reporting and improved
monitoring and evaluation of SOEs can lead to more efficient and effective operations,
reducing the need for government subsidies or increasing dividends accruing to government
shareholdings.
Infrastructure is a key input to competitiveness, yet the infrastructure gap is large (Table-5).
The solution is not just to spend more, but also better maintenance of existing assets. Improving
services typically requires much more than just capital expenditure. The infrastructure challenge
can be addressed by adopting a comprehensive infrastructure financing strategy based on a
combination of tax funding, partnership with the private sector, and cost recovery. Structural
issues around bankability, coupled with near-term challenges, may hold back private sector
participation. The government will need to address near-term concerns in the context of longer-
term market improvements. There is also an urgent need to improve project preparation and
sustain the supporting conditions, such as through better information for market players. Greater
risk sharing between financiers can help cushion the impact from increased borrowing costs.
The entire primary road network is in poor condition and saturated with traffic. Consequently,
the opportunity costs of passengers and cargo traveling through Bangladesh is very high.

24
Excessive reliance on roads has proven costly both financially and in terms of environmental
degradation. Reforms need to be directed at improving the inter-modal balance with higher
priority given to inland waterways and railways. Ports and airports need urgent investments and
have higher commercial viability and importance for connectivity. In addition, the two sectors
share similar constraints (customs, labor, SOEs). Urban mass transit is a major issue. Bus
operations, both rapid transit and the regular bus feeder system, has a good potential of private
sector engagement.
Table 5: Comparison of Infrastructure Quality 2018
Country
Overall
Infrastructure
Ranking
Scores
Overall
Infrastructure
Score
Roads Efficiency
Rail road Port Air
Electric power
transmission
and
distribution
losses
South Asia
Bangladesh 109 53.4 35.2 40.9 40.9 45.5 92.7
Sri lanka 65 68.6 46.7 38.6 51.1 57.3 96.9
India 63 68.7 57.4 57.9 60.4 64.1 84.8
Pakistan 93 59.0 49.1 46.4 51.3 52.3 86.3
Nepal 117 48.5 27.0 5.2 13.1 33.4 78.1
East Asia
Korea, Rep 6 91.3 78.8 81.4 72.8 80.6 100.0
China 29 78.1 59.7 59.0 58.6 60.7 98.8
Indonesia 71 66.8 48.1 61.4 54.1 66.7 94.3
Thailand 60 69.7 55.9 27.4 51.5 66.8 97.7
Philippine 92 59.4 42.2 23.5 43.9 51.4 94.7
Cambodia 112 51.7 38.8 19.2 43.3 42.7 89.9
Vietnam 75 65.4 36.0 39.2 46.4 47.4 94.7
Source: Global Competitiveness Report 2018
Note: Scores ranges from 0 to 100. Higher is better
Urgent action is needed to reduce human fatalities on the road network, where it is estimated
more than 20,00018 people are killed and 200,000 seriously injured every year in road traffic
crashes. In addition to associated human tragedy, the economic cost of this major social and
economic crisis is estimated at 2-3 percent of GDP annually. Road crashes are responsible for 12
percent of all deaths among men in the 15-49 age bracket, for whom transport injuries in 2016 was
the 2nd leading cause of death, up from 11th in 1990. The rapid expansion of motor vehicles on the
roads (growing by about 15 percent per annum)19 and expected increases in transport demand of
10 percent per annum, underlines the urgent need for high level commitment to intervene and
mitigate this crisis through coherent policy, regulatory, institutional and operational reforms.
While Bangladesh has tripled its generation capacity in the last decade, the share of renewable
energy in the energy mix remains very low and can be improved. Similarly, the country’s
18 Depending on the source, the estimates of annual deaths range from 2,538 (reported fatalities in 2012) to nearly ten times that – between 20,736 (Global Burden of Disease, 2016)18 and 21,316 (WHO, 2015).18 The Global Burden of Disease (GBD) estimate implies a death rate of 12.8 per 100,000 people. 19 As per Bangladesh Road Transport Authority

25
potential for improved energy efficiency remains largely untapped. The need for developing a
long-term primary energy policy is becoming increasingly pressing. Incentives must be
improved in favor of sustainable sources through a combination of eliminating fossil fuel
subsidies and implementing a carbon tax, and through further expansion of regional energy
trade. To support economic growth and meet 10 percent annual demand increase, the
government intends to double capacity by 2021, and reach 50 GW by 2041. Planning and
implementation of energy infrastructure is often slow and inefficient and has not kept up with
the increasing demand. Inadequate power supply and suboptimal operation of the system has
led to frequent outages and load shedding (1GW on average), shaving close to 3 percent from
GDP and inhibiting private investment in productive sectors. Dispatch does not follow merit-
order and there is further room to reduce distribution losses. The current transmission and
distribution capacity is not enough to support the increased generation capacity, which causes
power outages. Transmission planning needs to refocus on building a flexible high-voltage
backbone, enabling generation and import from several sources to be accommodated without
requiring a major rework of the grid.
A growing and youthful workforce in Bangladesh provides a window of opportunity to
improve productivity and accelerate economic growth. Technological progress is rapidly
changing the nature of work in manufacturing and services. Firms need to not only constantly
adjust their business and production modalities with these technological changes, but also require
highly-skilled manpower who can enable such change processes. Equipping the young
generation with skills needed for such jobs remain crucial.
Bangladesh fared relatively well on the Human Capital Index. It ranked 106th among 157
countries in the first Human Capital Index (HCI) prepared by the World Bank, surpassing both
the South Asian average and the lower middle-income average in all criteria, except for stunting
(Figure 15). Based on the index, a child in Bangladesh today is likely to achieve 48 percent of full
potential during his/her lifetime (Table-6). He/she has a 97 percent probability of surviving until
age 5 and has 11 years of expected schooling. However, learning adjusted years of schooling is
only 6.5, reflecting the learning gap in education resulting in part from learning disabilities due
to nutritional deficiencies in early childhood.
Table 6: HCI by Gender
Boys Girls Overall
HCI 0.46 0.49 0.48
Survival to age 5 0.97 0.97 0.97
Expected years of school 10.7 11.3 11
Harmonized test scores 367 370 368
Learning-adjusted years of School 6.2 6.7 6.5
Adult Survival Rate 0.85 0.90 0.87
Not Stunted Rate 0.63 0.64 0.64
Source: World Development Report, 2019
Figure 15: Bangladesh’s HCI position compared
to Regions and Income Groups

26
Adequate nutrition is necessary for normal brain development. The first couple of years are
critical periods for the brain, which lay the foundation for the development of cognitive, motor
and socioeconomic skills throughout childhood and adulthood. Stunting remains a major
development challenge for Bangladesh. Sub-optimal feeding practices have detrimental effects
on a child’s brain by causing changes in brain maturation and resulting in cognitive deficits. More
than one-third of under five children that are stunted and underweight are at risk of failing to
reach their developmental potential, thereby having long-term effects on academic achievement
and economic productivity.20 In addition, stunting and wasting among children under five is
higher if the mother was under 18 at the time of her baby’s birth. Bangladesh has had a
consistently high rate of child marriage – in 2011, 50 percent of adolescent girls surveyed who
were under 18 were already married.21
Skills develop progressively over an individual’s life, from early childhood development, to
basic education, to tertiary education, and on-the-job training. It is a lifelong process involving
the acquisition of varied skill types: (i) basic cognitive skills, such as literacy and numeracy,
typically acquired during pre-primary and primary school; (ii) job-specific skills usually acquired
in TVET or higher education or through apprenticeships and on-the-job training, and (iii) non-
cognitive or soft skills, such as social and emotional skills, acquired all along, often by interactions
with family members, peers, or colleagues. To expand individuals’ potential, coherence in skills
development across the different learning environments and schooling stages is imperative. Low
learning outcomes across the education system underwrite failure to fully realize the potential of
human capital.
Cognitive and analytical skills are increasingly dominating the skills requirement for the job
landscape globally. Technological advancements have made skills requirements less predictable.
Consequently, workers with higher adaptive skills are being valued more and more. Specifically,
tertiary education and skills training are the hubs for equipping young minds with relevant skills
and expertise needed to meet the changing technology and skills demands of the modern
economy, as well as creating and disseminating new knowledge through cutting-edge research
and innovation. The higher education and vocational institutions in Bangladesh still have a long
way to go in responding to the economic changes and the quality standards both in the domestic
and overseas labor markets.
Bangladesh’s rankings on ease of doing business indices points to the need for major
regulatory improvements. The country ranked 176th out of 190 countries in the latest Ease of
Doing Business Index published by the World Bank (Table 7). This puts Bangladesh in the lowest
position among all the South Asian countries despite moving up one spot in the index compared
to last year. Out of the ten categories of a business lifecycle, Bangladesh’s Distance to Frontier
(DTF) score improved most in the ‘getting electricity’ category. There were slight improvements
20 In addition, about 18 percent of women between 15-49 years suffer from chronic undernutrition and 23 percent of the infants are born low birth weight. Young motherhood increases the risk of intra-uterine growth retardation and low birth weight. and subsequent stunting outcomes. 21 Grantham-McGregor, S. et al., 2007. Development potential in the first five years for children in developing countries. The Lancet, (369: 60–70)

27
in four other categories (starting a business, dealing with construction permits, registering
properties and resolving insolvency), and no improvement in the remaining five categories
(getting credit, protecting minority investors, paying taxes, trading across borders and enforcing
contracts). Bangladesh ranked highest (89th) in the ‘protecting minority investors’ category, and
lowest (189th) in the ‘enforcing contracts’ category.22
Table 7: Bangladesh's Ranking on the Ease of Doing Business
Year 2014 2015 2016 2017 2018 2019
Ease of Doing Business Rank 170 173 178 176 177 176
Starting Business 111 115 115 122 131 138
Dealing with Construction permits 142 144 138 138 130 138
Getting Electricity 189 188 187 187 185 179
Registering Property 183 184 186 185 185 183
Getting Credit 125 131 152 157 159 161
Protecting Minority Investors 43 43 69 70 76 89
Paying Taxes 78 83 148 151 152 151
Trading Across Borders 140 140 173 173 173 176
Enforcing Contracts 188 188 189 189 189 189
Resolving Insolvency 146 147 153 151 152 153
Source: Doing Business Reports
Initiatives are needed to overcome the challenges of informality. Informal employment is
concentrated among young, low-skilled, female, and rural workers. Policies targeting training
and education of these groups, especially in rural areas, could help their transition to formal
employment. Country-specific studies have found that reductions in tax and regulatory burdens
have often been associated with lower informality. Policies aimed at invigorating private sector
activity and productivity, as well as leveling the playing field for all workers and firms,
particularly measures to make the labor market more flexible, the regulatory framework more
adaptable, and governance more effective, can lower informality and improve working
conditions in the informal sector. The probability of reducing informality rises when reforms are
accompanied by business development and training programs, public awareness campaigns and
stronger enforcement.23
There is significant room to improve the ease of doing business in Bangladesh.24 This could
reduce informality by reducing the cost of entry and operating in the formal sector. Measures to
reduce the time, cost, and complexity of registration would also improve the business climate and
foster growth. High quality public services can provide an incentive for informal firms to become
formal in order to access these services. Enhanced monitoring and enforcement, including of tax
regulations, could help discourage informality. These require designing comprehensive policies,
22 For further details, see World Bank (2019). 23 The World Bank, Global Economic Prospects, January 2019. 24 The government took several initiatives through the Bangladesh Investment Development Authority (BIDA) to reform the laws and regulatory processes related to doing business. These, among others, include the enactment of the one-stop-shop (OSS) law, initiation of efforts to establish a national single window (NSW), and streamlining of eligibility rules for Special Bonded Warehouse (SBW) facilities. These need to be brought to closure expeditiously.

28
including streamlining tax codes, easing firm and labor regulations to create a level playing field
for both formal and informal participants, and expanding access to finance and public services to
help increase productivity in the informal sector.
Ensuring regulatory predictability is a high priority. Perceptions of unpredictable and opaque
administrative processes, as well as the uneven enforcement of regulations, can deter firm
creation and investment, push them towards informality and ultimately impede productivity in
the formal sectors. As in many other countries in the world, entrepreneurs in Bangladesh continue
to raise concerns about the difficulties and delays when dealing with the administration of
regulations, particularly in terms of what is perceived as a discretionary application of rules and
regulations. Entrepreneurs seeking to introduce new ways of doing business often face additional
regulatory barriers, since regulators usually lag innovations in the economy.
Businesses face regulatory unpredictability on many fronts. The most pressing are concerns
about inconsistencies in laws and regulations, and undue use of discretion by officials, with more
than 60 percent of respondents to a survey identifying these factors as problematic. They are also
concerned about poor access to information about rules and regulations, adverse and often
sudden changes in laws and regulations, and lack of effective grievance mechanisms. These
problems are a manifestation of deficient regulatory governance. Regulatory governance remains
weak because most regulatory reforms in the past have focused more on streamlining individual
regulatory processes with inadequate attention paid to systemic reforms.
Addressing regulatory uncertainty will require a multi-pronged approach aimed at systemic
reforms that strengthen regulatory governance. A set of high-level actions accompanied by more
specific reforms are needed. High-level actions include the development of a “whole of
government” vision, policy and strategy for the regulatory system and the establishment of a
technical regulatory oversight body at the center of government (such as in the Prime Minister’s
Office) to oversee, lead and report on regulatory reforms. Specific actions, some of which may be
piloted before wider roll-out, include introducing the practice of evidence-based regulatory
impact assessments, structured and inclusive consultations on draft laws and regulations, a
review of existing laws and regulations to identify gaps, inconsistencies and redundancies,
immediate publication of all Statutory Regulatory Orders (SROs) through widely-accessible
means, and introduction of business-to-government feedback loops on regulatory service quality
and reform implementation gaps.
The following section provides a more detailed analysis of regulatory unpredictability based on
international experience and a business perception survey data in Bangladesh. Annex I provides
information on the profile of the respondents covered by the survey.

29
Bangladesh aspires to achieve the SDGs by 2030 and become a high-income country by 2041. To this end,
the development strategy emphasizes economic diversification and productivity improvements, taking
advantage of technological developments, including digital technology. It envisages a critical role of the
private sector in achieving the SDGs, including in areas that had traditionally been considered the domain
of the public sector and/or NGOs. The success of this development strategy will hinge on increased private
investment and innovation. Investments will be needed in new ways of doing things: new products, new
technologies and new business models. This requires an enabling environment, and regulatory
predictability is an important dimension.
Regulatory uncertainty makes property rights insecure, which is a deterrent to investment.
Insecurity of property rights takes many forms, ranging from threat of outright asset
expropriation to policy and regulatory actions that make costs and revenue streams more
uncertain (on top of normal commercial risks). Examples include changes in rules of the game
after an investment has been committed, non-payment by government for goods and services
procured, and discriminatory or confiscatory taxation. A recent World Bank global survey of
more than 700 CEOs of multinational companies identified policy and regulatory uncertainty as
the second most important deterrent to foreign investment after political instability (World Bank
Group: Investment Competitiveness Report 2017).
The literature on regulatory uncertainty and its impact in developing countries is limited. Bigsten
and Soderbom (2006)25, which reviewed research based on firm level surveys in Africa, concluded
that uncertainty has a negative impact on investment. However, these studies looked at
uncertainty associated with economic variables, such as market demand and exchange rate
fluctuations, and not regulatory uncertainty.
The “growth diagnostics” framework, articulated by Hausmann, Rodrik, Velasco (2004)26,
identifies the appropriability of the returns to economic activity as an important driver of private
investment. While market failures, such as coordination externalities and information
externalities, are one source of low appropriability of returns, a variety of government failures
also lower appropriability of returns and thus discourage investment. Following this framework,
Hallward-Driemeier, Khun-Jush and Pritchett (2010)27 argue that regulatory uncertainty, or more
generally policy implementation uncertainty, “creates risks to the appropriability of the gains
from firm-level investment or innovation”. The paper makes a distinction between policies and
policy actions, the former referring to policies and rules as written on paper and the latter
25 Bigsten, Arne and Mans Soderbom, “What have we learned from a decade of manufacturing enterprise surveys in Africa?”, Worls Bank Research Observer 21(2), 2006. 26 Hausmann, R., D. Rodrik and A. Velasco, “Growth Diagnostics”, Cambridge, MA: Harvard University, mimeo, 2004. 27 Hallward-Driemeier, Mary, G. Khun-Jush, and L. Pritchett, “Deals versus Rules: Policy Implementation Uncertainty and Why Firms Hate It”, NBER Working Paper 16001, May 2010.

30
referring to the way these are implemented in practice by officials. De jure policy and rules may
change, often unexpectedly, and cause uncertainty for businesses. However, even when policies
and regulations remain stable on paper, there may be uncertainty about their implementation in
practice.28
Hallward-Driemeier, Khun-Jush and Pritchett (2010) assess the impact of policy and regulatory
uncertainty in Africa. Using Enterprise Survey data for more than 20 African countries, the
authors show that even within the same country wide variations exist across firms in complying
with various regulatory interfaces, such as time taken to obtain an operating license or time taken
for imports to clear customs, and that such variations are correlated with the proportion of firms
that reported a high degree of policy and regulatory uncertainty in their business environment.
Finally, the authors find a significant negative relationship between high variance in policy
implementation and in firm employment growth.
Who faces the most regulatory unpredictability?
Regulatory unpredictability is felt differently by businesses depending on their size (Figure
16). Such variation may reflect differences in firm-size specific characteristics, such as visibility
and influence over government officials. The relationship between firm size and the experience
with regulatory unpredictability is not linear. In most cases, the medium sized firms seem to bear
the brunt of regulatory unpredictability, more than large or small firms. Large and medium sized
firms believe more than small firms that regulatory officials use a lot of undue discretion in
dealing with businesses; 62 percent, 65 percent and 54 percent, respectively (Figure 16). However,
although 62 percent of large firms believe discretionary behavior exists, only one-third complains
that adverse policy or regulatory changes - often the result of discretionary behavior - make costs
and revenue streams uncertain for them. This suggests that large firms can cope better with
discretionary behavior.
28 The authors state: “Even when policy is unchanging and even when there is macroeconomic stability, firms faced massive risk and uncertainty about their operations and profitability due to variability in policy actions that results from weak capability for implementation of regulatory and economic policy”. Given the absence of a one-to-one relationship between the policies/rules on paper and their implementation on the ground, firms may also invest in influencing the decisions of officials, including through the payment of bribes. In other words, they reach a deal with officials.

31
Figure 16: Regulatory unpredictability as experienced by different firm size groups
Discretionary behavior by regulatory officials is at the core of regulatory uncertainty, including
non-uniform interpretation of rules and requirements. It is often the most serious source of
unpredictability. In this context, it is useful to distinguish between: a) the de jure space created for
discretionary behavior; and, b) the degree to which that space is used de facto by regulatory
officials (Box 2).
To understand this phenomenon better, a survey of businesses operating in Bangladesh assessed
their views on the manifestations and impact of regulatory unpredictability. The survey was
carried out in November-December 2017 in collaboration with the public-private dialogue
platform Business Initiative Leading Development (BUILD). The survey questionnaire was
prepared by the World Bank Group and put on SurveyMonkey. BUILD sent out the questionnaire
using SurveyMonkey to about 150 businesses. Of these, 72 sent a complete response. The analysis
presented here is based on these responses. Annex 1 provides a profile of the respondents.
0
10
20
30
40
50
60
70
80
Regulatory officials use a lot ofundue discretion in dealing with
businesses
Many laws in Bangladesh areinconsistent with each other
Finding information on existingrules and regulations is generally amajor obstacle for doing business
Adverse policy or regulatorychanges often make costs andrevenue streams very uncertain
Lack of effective grievancemechanisms is a major obstacle
for doing business
Rules and regulations are oftenannounced without prior notice,
consultation or impactassessments
Proportion of businesses citing different sources of regulatory unpredictability as a problem
5-19 employees 20-99 employees 100 plus employees

32
Box 2: The drivers of regulatory unpredictability
The de jure space for discretionary behavior
The space for discretionary behavior is often created by weaknesses in the rule-book. Policies, laws and
regulations, as written, may not be relevant, consistent or robust. Such deficiencies may leave regulatory
gaps and leave huge scope for differing interpretation of laws and regulations. The weaknesses in the
rule-book are often accentuated by the fact that regulatory agencies do not provide adequate guidance
to the front-line officials on how to interpret and administer the rules.
The roots of weak regulatory design lie in poor rule-making processes. This includes inadequate use of
evidence when making rules, such as lack of consultation with stakeholders and little use of impact
assessment. Rules and regulations may be announced without prior notice, consultation or impact
assessment. Thus, regulatory design does not benefit from the ground-level knowledge of businesses.
Moreover, even when well designed, sudden regulatory enactments cause problems for businesses. The
problems are accentuated if the rules are to be enforced immediately, as often happens in practice.
Inconsistencies in rules and regulations also create the space for discretionary interpretation by
regulatory officials. Government agencies often impose their own rules and procedures without
considering possible conflicts with rules and procedures imposed by other government agencies. The
resulting inconsistency may mean that regulatory officials do not get clear guidance from the rule book
and use this as an excuse to apply their own discretion in interpreting laws and regulations.
Regulatory gaps are also a serious issue. This is particularly so for innovative activities whose legality
may be questioned if there are gaps in the legal and regulatory framework, or grey areas subject to
discretionary interpretation.
The de facto use of the space for discretionary behavior
The extent to which regulatory officials exploit the space for discretionary behavior depends on several
factors. For example, officers may be encouraged to abuse their discretionary powers if they know that
businesses have difficulty in accessing rules and regulations. Businesses often lack adequate knowledge
on what rules, regulations and procedures they need to comply with, be it at the entry, operational or
exit stages. Even if they are aware of rules or procedures, businesses may lack knowledge of the detailed
requirements, such as documents required, fees, or where to apply. This informational asymmetry
reduces the ability and incentive of businesses to challenge regulatory officials.
Regulatory officials are further encouraged to use undue discretion if effective grievance mechanisms
are absent. Many regulatory areas lack effective grievance mechanisms through which businesses can
complain about regulatory decisions that adversely affect them. Even if businesses can voice their
grievances, there may be inadequate or no follow-up by the relevant agency, with businesses having
no recourse to higher authorities. Effective grievance mechanisms, and good access to information on
laws and regulations, can act as restraints on discretionary behavior since such accountability and
transparency mechanisms can increase the costs to regulatory officials of indulging in discretion. Thus,
their absence encourages officials to use the space that exists for discretionary behavior.

33
Businesses face regulatory unpredictability on many fronts (Figure 17). Businesses are most
concerned about inconsistencies in laws and regulations and undue use of discretion by officials.
More than 60 percent of respondents identified these factors as problematic. Businesses are
relatively less concerned about the announcement of regulations without prior consultation.
However, they find it difficult to access information about existing regulations. Almost half of
respondents believe that adverse policy or regulatory changes often make costs and revenue
streams uncertain.
Regulatory officials use a lot of undue discretion in dealing with businesses (Figure 18).
Nearly two-thirds reported wide variation in interpretation of rules and compliance requirements
among officials. About half of the respondents believed that there are no clear criteria for
decision-making in many areas. However,
even where such criteria exist these are not
followed in decision-making. Indeed,
businesses consider non-adherence to
decision-making criteria as a bigger issue
than the absence of criteria. Box 3 provides
an example of how inadequate guidance for
decision-making encourages discretionary
behavior.
0.0
10.0
20.0
30.0
40.0
50.0
60.0
70.0
80.0
Rules and regulationsare often announcedwithout prior notice,
consultation or impactassessments
Many laws inBangladesh are
inconsistent with eachother
Finding informationon existing rules and
regulations isgenerally a majorobstacle for doing
business
Regulatory officialsuse a lot of undue
discretion in dealingwith businesses
Lack of effectivegrievance
mechanisms is amajor obstacle for
doing business
Adverse policy orregulatory changes
often make costs andrevenue streams very
uncertain
perc
ent
of
respondents
Proportion agreeing this is a problem Proportion disagreeing this is a problem
Figure 17: Business views on different aspects of regulatory unpredictability in Bangladesh
Note: these proportions do not add up to 100 percent because some respondents neither agreed nor disagreed with the statement
0.0
10.0
20.0
30.0
40.0
50.0
60.0
70.0
Regulatoryofficials use alot of unduediscretion indealing withbusinesses
There is widevariation in theinterpretation of
rules andcompliance
requirements bydifferent officials
In many cases,clear criteria fordecision-makingdoes not exist
Where clearcriteria exist,these are not
usually followed
perc
ent
of
resp
ondents
Statements on discretionary behavior
Proportion agreeing this is a problem
Proportion disagreeing this is a problem
Figure 18: Business views on discretionary behavior by
officials in Bangladesh

34
Box 3: Lack of proper definition of sample items lead to discretionary behavior by customs
officials
According to the Government of Bangladesh’s Import Policy, “samples” can be imported free of cost and
without a permit from the office of the Chief Controller of Imports and Exports (CCI&E). This is because
sample items do not have a commercial value (they are not eligible for further re-sale), do not require
the opening of an import letter of credit (L/C), have no HS codes, and are sent free of charge. However,
there is no appropriate definition of which items are categorized as “samples”. As a result, importers
often face great difficulty in releasing sample items from the port, and customs officials impose taxes
and VAT on these goods in a discretionary manner. Furthermore, the officers-in-charge impose fines on
businesses for bringing these goods without opening an import L/C. Releasing these sample items from
customs takes 7-13 days causing significant delays and raising costs and uncertainty for businesses.
Discretionary behavior has many roots. Among these, weaknesses in the way rules and
regulations are written, lack of capacity of regulatory officials, rent-seeking behavior and
inadequate accountability of regulatory officials are most salient. Businesses feel that all these
factors are important in Bangladesh (Figure 19). For example, weaknesses in the way rules and
regulations are written is cited as a major problem – this response is consistent with the responses
on inconsistent laws and regulations. It may be noted that these are not mutually exclusive
factors but can be complementary. Thus, weaknesses in the way rules are written create the space
for discretionary behavior. Given the space to do so, the extent to which officials indulge in
discretionary behavior may be influenced by how much oversight they face. Annex II provides
more details on deeper correlates of regulatory unpredictability.
0.0
10.0
20.0
30.0
40.0
50.0
60.0
70.0
80.0
Such behavior is
usually due to
weaknesses in the way
rules and regulations
are written
Such behavior is
usually due to lack of
capacity of regulatory
officials
Such behavior is
usually due to rent-
seeking tendencies
Such behavior is
usually due to
inadequate
accountability of
regulatory officials
per
cen
t o
f re
spo
nd
ents
Types of discretionary behavior
Proportion agreeing this is a problem Proportion disagreeing this is a problem
Figure 19: Business views on causes of discretionary behavior by officials in Bangladesh

35
Access to information on rules and regulations. Information on business regulations is difficult
to find and, when available, is often of poor quality. One out of two businesses in Bangladesh feel
that finding information on existing rules and regulations is a major obstacle to doing business.
There are also concerns about the credibility of available information, with almost two-thirds
complaining that it is not updated regularly and is often incomplete.
A manifestation of this problem is the absence of a government website providing the VAT,
customs, and income tax laws/ordinances in one place, including all amendments. The
widespread and increasing practice of issuing rules and regulations through Statutory
Regulatory Orders (SROs) further accentuates the problem. Ministries and agencies frequently
issue such SROs, without necessarily rescinding old ones. On many subjects, there are even
hundreds of SROs in circulation, leading to widespread misunderstanding and misinterpretation
of rules. The problem is accentuated by the fact that no complete documentation of such SROs is
available in one place. Thus, considerable effort is required on the part of businesses to find SROs
relevant to them.
Regulatory gaps. Innovative businesses need legal underpinnings and clear rules of the game.
As the economy becomes more dynamic and connected to the global world, entrepreneurs
leverage technological developments and seek to pursue innovative activities, be it new products
or new ways of doing things. Where an enabling legal and regulatory framework exists, new
activities and markets are created - mobile banking is a good recent example. The government
supported its Digital Bangladesh agenda through several legal acts, including an ICT Act and an
E-payment Act. Such legal actions have helped create new markets. For example, the E-payment
Act, by legalizing electronic fund transfers, helped catalyze the creation of a new financial market
- mobile banking. However, in many cases, the government has not enacted relevant laws and
regulations. Rather, when confronted with a new technology or business model, it has reacted in
an ad-hoc manner, causing uncertainty and enabling harassment of innovative firms (Box 4).
Box 4: Regulatory gaps are creating uncertainty for innovative businesses
International ICT-based innovative businesses are interested in investing in Bangladesh. These include
Uber and other transportation services, e-commerce (dress, groceries, and food delivery among others).
However, Bangladesh is struggling to realize the potential of the Digital Bangladesh agenda due to
regulatory unpredictability. The unpredictable nature of the law and service delivery hampers business
operations, as well as growth and future business decisions. ICT-led transportation services, including
Uber, are operating illegally, as the government has failed to provide them registration, limiting their
growth potential. Many investors initially financed cars for ICT enabled transportation service
providers, but many are now people discouraged, as they are not legally registered and subject to
harassment by traffic police or other regulatory officials.
Lack of ex-post regulatory review mechanisms. Bangladesh lacks structured mechanisms for
ex-post reviews of regulations after they are enacted. Such reviews can help identify deficiencies
in the way regulations are being administrated, as well as any unintended consequences of the
regulation. An example illustrating the need for such review mechanisms comes from the jute
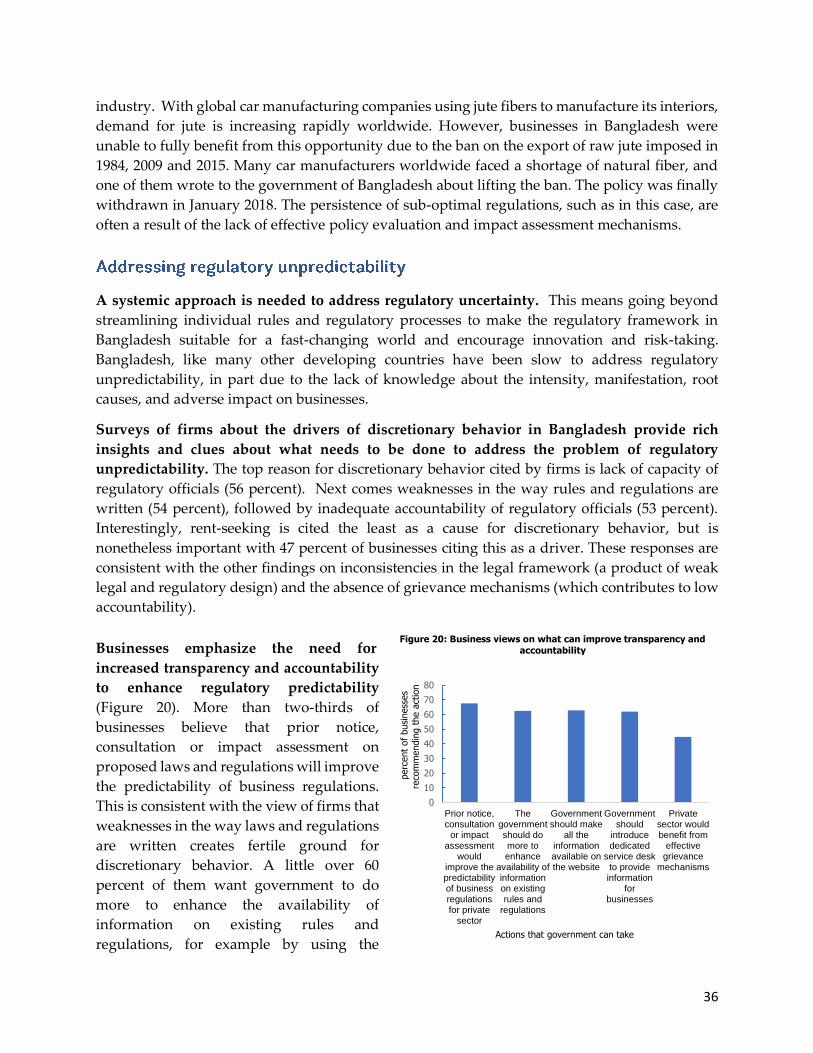
36
industry. With global car manufacturing companies using jute fibers to manufacture its interiors,
demand for jute is increasing rapidly worldwide. However, businesses in Bangladesh were
unable to fully benefit from this opportunity due to the ban on the export of raw jute imposed in
1984, 2009 and 2015. Many car manufacturers worldwide faced a shortage of natural fiber, and
one of them wrote to the government of Bangladesh about lifting the ban. The policy was finally
withdrawn in January 2018. The persistence of sub-optimal regulations, such as in this case, are
often a result of the lack of effective policy evaluation and impact assessment mechanisms.
A systemic approach is needed to address regulatory uncertainty. This means going beyond
streamlining individual rules and regulatory processes to make the regulatory framework in
Bangladesh suitable for a fast-changing world and encourage innovation and risk-taking.
Bangladesh, like many other developing countries have been slow to address regulatory
unpredictability, in part due to the lack of knowledge about the intensity, manifestation, root
causes, and adverse impact on businesses.
Surveys of firms about the drivers of discretionary behavior in Bangladesh provide rich
insights and clues about what needs to be done to address the problem of regulatory
unpredictability. The top reason for discretionary behavior cited by firms is lack of capacity of
regulatory officials (56 percent). Next comes weaknesses in the way rules and regulations are
written (54 percent), followed by inadequate accountability of regulatory officials (53 percent).
Interestingly, rent-seeking is cited the least as a cause for discretionary behavior, but is
nonetheless important with 47 percent of businesses citing this as a driver. These responses are
consistent with the other findings on inconsistencies in the legal framework (a product of weak
legal and regulatory design) and the absence of grievance mechanisms (which contributes to low
accountability).
Businesses emphasize the need for
increased transparency and accountability
to enhance regulatory predictability
(Figure 20). More than two-thirds of
businesses believe that prior notice,
consultation or impact assessment on
proposed laws and regulations will improve
the predictability of business regulations.
This is consistent with the view of firms that
weaknesses in the way laws and regulations
are written creates fertile ground for
discretionary behavior. A little over 60
percent of them want government to do
more to enhance the availability of
information on existing rules and
regulations, for example by using the
Figure 20: Business views on what can improve transparency and
accountability
0
10
20
30
40
50
60
70
80
Prior notice,consultation
or impactassessment
wouldimprove thepredictabilityof businessregulationsfor private
sector
Thegovernmentshould domore toenhance
availability ofinformationon existingrules and
regulations
Governmentshould make
all theinformationavailable onthe website
Governmentshould
introducededicated
service deskto provide
informationfor
businesses
Privatesector wouldbenefit from
effectivegrievance
mechanisms
perc
ent
of
busi
ness
es
reco
mm
endin
g t
he a
ctio
n
Actions that government can take

37
internet and setting up dedicated service desks to provide information. Almost half (45 percent)
of businesses feel they will benefit from effective grievance mechanisms – no surprise given that
lack of accountability of regulatory officials is a major reason for their discretionary behavior.
There is a need for a multi-pronged approach in addressing the identified problems. The
government has a track record of reforming individual regulatory processes and procedures.
However, challenges remain, especially when multiple stakeholders within and outside
government are involved. More recently, the government established a one-stop-shop to facilitate
regulatory approvals for starting a business. This automated facility, which is about to be
launched, will involve the streamlining of individual processes administrated by separate
agencies (underpinned by Standard Operating Procedures), provide information on regulatory
compliance requirements, and lead to better coordination between agencies and processes
through an automated inter-operability mechanism. While this is a good beginning, Bangladesh
now needs to focus on more ambitious systemic reforms that improve regulatory governance and
enhance regulatory predictability.
An ongoing exercise to assess the quality of regulatory policy and delivery in Bangladesh has
identified significant systemic problems29. For example, Bangladesh currently lacks a clear
policy and strategy outlining how the regulatory system will be managed, including principles,
objectives and reform modalities. The quality of the rule-making process is deficient. While
stakeholders are periodically consulted on regulatory issues, the consultation processes are ad-
hoc and not applied in a systematic or predictable manner. The establishment of the public-
private dialogue mechanism BUILD and its alignment with the Private Sector Coordination
Committee in the Prime Minister’s Office has brought greater structure to the dialogue. However,
scope remains for further significant improvement since many stakeholders, especially small
businesses, may still be left out of the process, and the importance of regular consultation for
reducing regulatory uncertainty may not be uniformly appreciated across government.
Processes for ensuring the quality of new proposed rules need strengthening based on
evidence. The Rules of Business (1996), which establish the processes and rules for the
preparation of policy proposals and legislation in Bangladesh, require extensive consultation
within government, but do not mandate the preparation of Regulatory Impact Assessments (RIA)
or the use of evidence in policy development. As a result, rules are often developed without
systematic analysis of the impact on businesses, as well as the ability and costs of enforcing the
regulations. Nonetheless, some beginnings have been made. These include pilot RIAs, such as a
2014 RIA on customs regulatory reform (prepared with ADB support), an agreement in 2017
between the Ministry of Law and Parliamentary Affairs and the WBG to raise awareness of RIA,
undertake further pilots, and build RIA capacity, as well as the July 2018 RIA training event
delivered by the WBG. The government may build upon this to establish a systematic approach
to evidence-based regulatory design.
29 World Bank Group (2018), Regulatory Policy and Delivery Review: Regulatory Governance in Bangladesh, Working draft, November 2018.

38
Improving regulatory governance is necessary to enhance regulatory predictability. This
requires consideration of the following high-level actions:
• Develop and publish a whole of government vision, policy and strategy for Bangladesh’s
regulatory system, including regulatory governance priorities, principles, targets, criteria,
responsibilities and use of tools. The policy and strategy should include short and
medium-term priorities and be prepared in a consultative and transparent manner with
relevant stakeholders, along with preparation of a detailed implementation plan.
• Establish a technical regulatory oversight body at the center of government (such as in the
Prime Minister’s Office) to oversee and lead the regulatory reforms and modernization
needed to achieve the government’s objective of Bangladesh becoming an upper middle-
income country by 2031. In this regard, the Government may also revisit the idea of the
short-lived Regulatory Reform Commission set up in late 2017.
• Develop government-wide consultation guidelines and procedures for important
regulatory issues and proposed regulations, including minimum time periods for public
consultation and standardized consultation documents and procedures with on-line
access.
The high-level actions need to be backed up by more specific actions, including:
• Gradually introducing and requiring the use of RIAs for all major regulatory
interventions. This new practice may be overseen by the technical oversight body, such as
an RIA Unit in the PMO or the Ministry of Law and Parliamentary Affairs, which could
provide quality control as well as training.
• Establishing a systematic approach for the review and overhaul of existing laws, acts,
rules and SROs, and identifying redundancies, conflicting areas, jurisdictional overlaps
and regulatory gaps. The government may start by identifying, in consultation with
businesses and relevant professionals, a few clusters of related laws and regulations, and
subjecting these to review, followed by a roll-out of the review process to other important
laws and regulations impacting on the private sector.
• Formulating necessary laws/acts/rules/SROs to reduce regulatory gaps.
• Establishing a “Notice and Comments” system that will include publication of a
regulatory calendar at the beginning of a fiscal year indicating all upcoming laws for the
year, and a structured mechanism to solicit comments on draft laws and regulations. In
line with the government’s Digital Bangladesh agenda, such a system may be technology-
based.
• Introducing a system to automatically publish all new laws, regulatory amendments, and
SROs on a dedicated website within a week of their coming into force. Since access to
information is most problematic for regulatory orders, which are also often a major source
of regulatory discretion, the government may initially focus this exercise on SROs.

39
• Introduce business-to-government feedback loops to identify gaps in service delivery and
reform implementation. This may initially be piloted with selected government-to-
business services through structured questionnaires and then gradually rolled out.
Technology may be leveraged to ensure cost-effectiveness and sustainability of such
efforts, for example, through an electronic feedback mechanism system for selected
government-to-business service delivery.
• Introducing a systemic online grievance mechanism for all government-to-government,
business and citizen services. This system may initially be piloted for select services
identified through a survey of stakeholders. The grievance mechanism is intended to
address specific cases and will complement the business-to-government feedback
mechanisms that are aimed at identifying patterns and trends across respondents,
ministries and thematic areas of regulation.
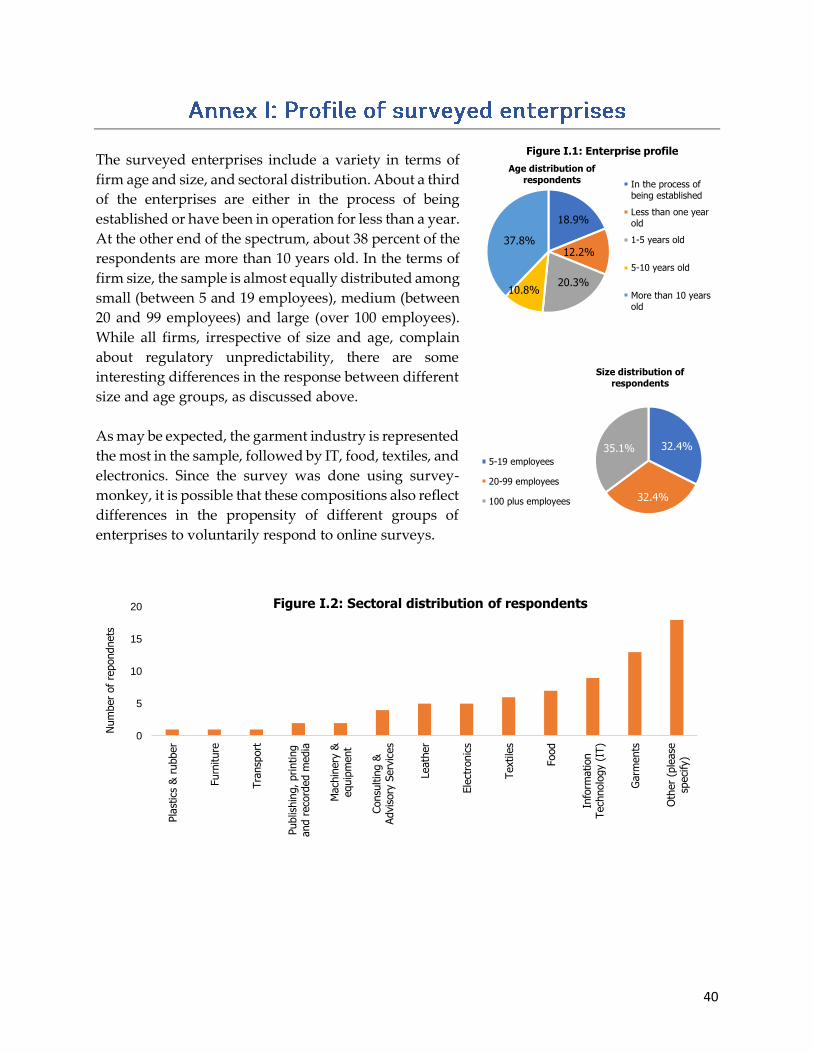
40
The surveyed enterprises include a variety in terms of
firm age and size, and sectoral distribution. About a third
of the enterprises are either in the process of being
established or have been in operation for less than a year.
At the other end of the spectrum, about 38 percent of the
respondents are more than 10 years old. In the terms of
firm size, the sample is almost equally distributed among
small (between 5 and 19 employees), medium (between
20 and 99 employees) and large (over 100 employees).
While all firms, irrespective of size and age, complain
about regulatory unpredictability, there are some
interesting differences in the response between different
size and age groups, as discussed above.
As may be expected, the garment industry is represented
the most in the sample, followed by IT, food, textiles, and
electronics. Since the survey was done using survey-
monkey, it is possible that these compositions also reflect
differences in the propensity of different groups of
enterprises to voluntarily respond to online surveys.
0
5
10
15
20
Pla
stic
s &
rubber
Furn
iture
Tra
nsp
ort
Publis
hin
g, printing
and r
eco
rded m
edia
Mach
inery
&equip
ment
Consu
ltin
g &
Advis
ory
Serv
ices
Leath
er
Ele
ctro
nic
s
Textile
s
Food
Info
rmation
Tech
nolo
gy (
IT)
Garm
ents
Oth
er
(ple
ase
speci
fy)
Num
ber
of
repondnets
Figure I.2: Sectoral distribution of respondents
18.9%
12.2%
20.3%10.8%
37.8%
Age distribution of
respondents In the process ofbeing established
Less than one yearold
1-5 years old
5-10 years old
More than 10 yearsold
Figure I.1: Enterprise profile
32.4%
32.4%
35.1%
Size distribution of
respondents
5-19 employees
20-99 employees
100 plus employees

41
Inconsistency in the legal framework creates
fertile ground for discretionary behavior by
officials. This problem is cited by more than
two-thirds of businesses in Bangladesh. There
appears to be a strong correlation between
perceptions of discretionary behavior and
inconsistency among laws in Bangladesh. Of
the 41 firms (out of 72) which feel that that
regulatory officials use a lot of undue discretion,
25 (or 83 percent) also believe that many laws in
Bangladesh are inconsistent with each other,
(Figure 1.3). The rest either disagree that laws
are inconsistent or gave an indifferent answer.
Of the firms that do not think there is undue use
of discretion, 62 percent also do not think that laws are inconsistent with each. These responses
suggest that legal and regulatory inconsistencies encourage discretion.
Discretionary behavior flourishes in the absence of effective grievance mechanisms. About 82
percent of the respondent firms which agree that regulatory officials use undue discretion in
dealing with businesses also feel that the absence of effective grievance mechanisms is a concern.
In contrast, 73 percent of businesses which do not complain about discretionary behavior by
regulatory officials, also do not view the lack of effective grievance mechanisms as a problem.
Such findings suggest a relationship between absence of effective grievance mechanisms and the
prevalence of discretionary behavior. Two other observations: (a) regulatory officials may be
encouraged to use undue discretion if they are immune from the accountability associated with
grievance mechanisms, and (b) businesses who face discretionary treatment may feel the absence
of grievance mechanisms more strongly than others.
Figure II.1: Relationship between discretionary behavior and legal inconsistency
Agree
38
percent
17
percent
62
percent
83
percent
Disagree
Agr
ee
Regulatory officials use a lot of undue
discretion in dealing with businesses
Dis
agre
e
Man
y la
ws
in B
angl
ade
sh
are

42
Poor access to information may also encourage
use of undue discretion by officials. The survey
findings show that inadequate knowledge about
rules and regulations may make businesses more
vulnerable to discretionary treatment by officials.
76 percent of respondent firms which agree that
regulatory officers engage in undue discretionary
behavior in dealing with businesses, also agree
that finding information on rules and regulations
is generally an obstacle for doing business (Figure
21). 55 percent of the surveyed firms which do not
believe that regulatory officers use undue
discretionary behavior also do not believe there is
any obstacle in finding information on rules and
regulations for doing business. However, 45 percent of the businesses which disagree on the use
of undue discretion by regulatory officials, still agree that there is difficulty in obtaining such
information.
Perceptions of discretionary behavior
appear to be correlated with that of
property rights insecurity. Four out of five
firms which feel that regulatory officials use
a lot of undue discretion also believe adverse
policy and regulatory changes can make
costs and revenues uncertain. Over half of
the respondents (56 percent) who do not feel
that regulatory officials use undue
discretionary behavior, also disagree that
adverse policy and regulatory changes are
making business difficult in Bangladesh by
creating uncertainty about cost and revenue
streams. At the same time, while 44 percent
of firms do not agree on the use of undue
discretionary behavior by regulatory
officials, they do indicate that adverse policy and regulatory changes may create uncertainty in
costs and revenues (Figure 1.5). The above findings suggest that discretionary behavior has a
strong potential to reduce security of property rights, although the latter may happen for other
reasons as well.
Figure II.2 Relationship between discretionary
behavior and access to information
Figure II.3 Relationship between discretionary behavior
and insecurity of property rights
Agree
44
percent
20 percent 56
percent
80 percent
Disagree
Agr
ee
Regulatory officials use a lot of undue
discretion in dealing with businesses
Dis
agre
e
Ad
vers
e p
olic
y o
r re
gula
tory
chan
ges
can
mak
e co
st a
nd
reve
nu
e st
ream
s u
nce
rtai
n
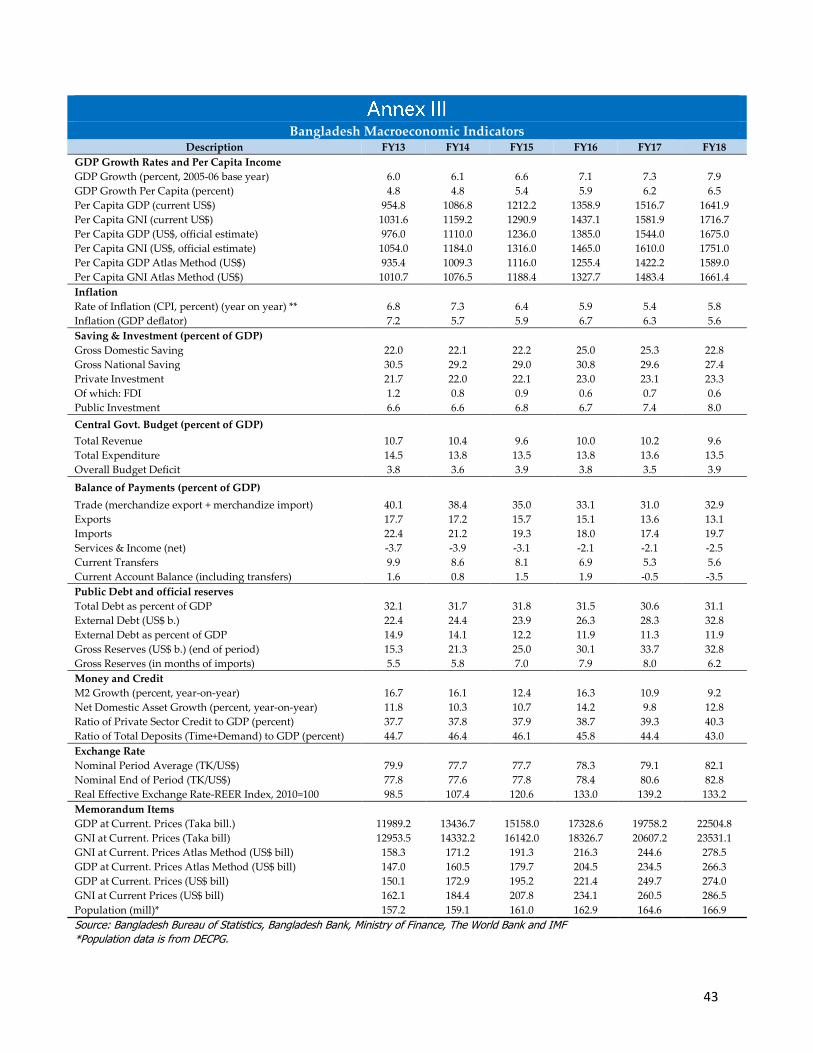
43
Bangladesh Macroeconomic Indicators
Description FY13 FY14 FY15 FY16 FY17 FY18
GDP Growth Rates and Per Capita Income
GDP Growth (percent, 2005-06 base year) 6.0 6.1 6.6 7.1 7.3 7.9
GDP Growth Per Capita (percent) 4.8 4.8 5.4 5.9 6.2 6.5
Per Capita GDP (current US$) 954.8 1086.8 1212.2 1358.9 1516.7 1641.9
Per Capita GNI (current US$) 1031.6 1159.2 1290.9 1437.1 1581.9 1716.7
Per Capita GDP (US$, official estimate) 976.0 1110.0 1236.0 1385.0 1544.0 1675.0
Per Capita GNI (US$, official estimate) 1054.0 1184.0 1316.0 1465.0 1610.0 1751.0
Per Capita GDP Atlas Method (US$) 935.4 1009.3 1116.0 1255.4 1422.2 1589.0
Per Capita GNI Atlas Method (US$) 1010.7 1076.5 1188.4 1327.7 1483.4 1661.4
Inflation
Rate of Inflation (CPI, percent) (year on year) ** 6.8 7.3 6.4 5.9 5.4 5.8
Inflation (GDP deflator) 7.2 5.7 5.9 6.7 6.3 5.6
Saving & Investment (percent of GDP)
Gross Domestic Saving 22.0 22.1 22.2 25.0 25.3 22.8
Gross National Saving 30.5 29.2 29.0 30.8 29.6 27.4
Private Investment 21.7 22.0 22.1 23.0 23.1 23.3
Of which: FDI 1.2 0.8 0.9 0.6 0.7 0.6
Public Investment 6.6 6.6 6.8 6.7 7.4 8.0
Central Govt. Budget (percent of GDP)
Total Revenue 10.7 10.4 9.6 10.0 10.2 9.6
Total Expenditure 14.5 13.8 13.5 13.8 13.6 13.5
Overall Budget Deficit 3.8 3.6 3.9 3.8 3.5 3.9
Balance of Payments (percent of GDP)
Trade (merchandize export + merchandize import) 40.1 38.4 35.0 33.1 31.0 32.9
Exports 17.7 17.2 15.7 15.1 13.6 13.1
Imports 22.4 21.2 19.3 18.0 17.4 19.7
Services & Income (net) -3.7 -3.9 -3.1 -2.1 -2.1 -2.5
Current Transfers 9.9 8.6 8.1 6.9 5.3 5.6
Current Account Balance (including transfers) 1.6 0.8 1.5 1.9 -0.5 -3.5
Public Debt and official reserves
Total Debt as percent of GDP 32.1 31.7 31.8 31.5 30.6 31.1
External Debt (US$ b.) 22.4 24.4 23.9 26.3 28.3 32.8
External Debt as percent of GDP 14.9 14.1 12.2 11.9 11.3 11.9
Gross Reserves (US$ b.) (end of period) 15.3 21.3 25.0 30.1 33.7 32.8
Gross Reserves (in months of imports) 5.5 5.8 7.0 7.9 8.0 6.2
Money and Credit
M2 Growth (percent, year-on-year) 16.7 16.1 12.4 16.3 10.9 9.2
Net Domestic Asset Growth (percent, year-on-year) 11.8 10.3 10.7 14.2 9.8 12.8
Ratio of Private Sector Credit to GDP (percent) 37.7 37.8 37.9 38.7 39.3 40.3
Ratio of Total Deposits (Time+Demand) to GDP (percent) 44.7 46.4 46.1 45.8 44.4 43.0
Exchange Rate
Nominal Period Average (TK/US$) 79.9 77.7 77.7 78.3 79.1 82.1
Nominal End of Period (TK/US$) 77.8 77.6 77.8 78.4 80.6 82.8
Real Effective Exchange Rate-REER Index, 2010=100 98.5 107.4 120.6 133.0 139.2 133.2
Memorandum Items
GDP at Current. Prices (Taka bill.) 11989.2 13436.7 15158.0 17328.6 19758.2 22504.8
GNI at Current. Prices (Taka bill) 12953.5 14332.2 16142.0 18326.7 20607.2 23531.1
GNI at Current. Prices Atlas Method (US$ bill) 158.3 171.2 191.3 216.3 244.6 278.5
GDP at Current. Prices Atlas Method (US$ bill) 147.0 160.5 179.7 204.5 234.5 266.3
GDP at Current. Prices (US$ bill) 150.1 172.9 195.2 221.4 249.7 274.0
GNI at Current Prices (US$ bill) 162.1 184.4 207.8 234.1 260.5 286.5
Population (mill)* 157.2 159.1 161.0 162.9 164.6 166.9
Source: Bangladesh Bureau of Statistics, Bangladesh Bank, Ministry of Finance, The World Bank and IMF
*Population data is from DECPG.

44
Bangladesh Bank (2018). “Report on Government Securities”. Dhaka.
Bigsten, Arne and Mans Soderbom, “What have we learned from a decade of manufacturing
enterprise surveys in Africa?”, World Bank Research Observer 21(2), 2006.
CPD. (2018). “State of the Bangladesh Economy in FY2017-18 (Third Reading).” Dhaka.
Hallward-Driemeier, Mary, G. Khun-Jush, and L. Pritchett, “Deals versus Rules: Policy
Implementation Uncertainty and Why Firms Hate It”, NBER Working Paper 16001, May 2010.
Hausmann, R., D. Rodrik and A. Velasco (2004) ‘Growth Diagnostics’, Cambridge, MA: Harvard
University, mimeo, 2004
ILO (2018). “Asia-Pacific Employment and Social Outlook 2018.” Bangkok.
Klaus, G., Bernstein, J., Patterson, F., Sonntag, A., Klaus, L.M., Fahlbusch, J., Towey, O., Foley, C.,
Gitter, S., Ekstorm,K. and Fritschel, H (2018). “2018 Global Hunger Index: Forced Migration and
Hunger”. Dublin/Bonn: Concern Worldwide and Welthungerhilfe.
OECD (2002). “Foreign Direct Investment for Development: maximizing benefits, minimizing
costs.” Paris.
Schwab, K. (2018). The Global Competitiveness Report 2017–2018. Geneva: World Economic Forum.
WEF (2018). “Regional Risks for Doing Business”. Geneva.
World Bank (2019). “Doing Business 2019, training for Reform, Economy Profile Bangladesh.”
Washington DC.
World Bank Group (2018), Regulatory Policy and Delivery Review: Regulatory Governance in
Bangladesh, Working draft, November 2018.
World Bank, Global Economic Prospects, January 2019.
Recommended