Agricultural and Forest Meteorology, 45 (1989) 299-312 299 Elsevier Science Publishers B.V., Amsterdam - - Printed in The Netherlands
A P P L I C A T I O N OF CERES-MAIZE MODEL TO YIELD P R E D I C T I O N OF A B R A Z I L I A N MAIZE HYB RID*
W.T.H. LIU
Fundacao Centro Tecnologico de Minas Gerais, Belo Horizonte, MG (Brazil)
D.M. BOTNER and C.M. SAKAMOTO
Cooperative Institute [or Applied Meteorology, University o[ Missouri, Columbia, MO 65201 (U.S.A.)
(Received March 15, 1988; revision accepted July 20, 1988)
ABSTRACT
Liu, W.T.H., Botner, D.M. and Sakamoto, C.M., 1989. Application of CERES-Maize Model to yield prediction of a Brazilian maize hybrid. Agric. For. Meteorol., 45: 299-312.
The CERES-Maize Model was used to simulate the growth and grain yield of a Brazilian maize hybrid, DINA 10. Measured crop phenological stages and grain yield were compared with simu- lated results, based on available soil, crop and weather data for 5 years, 1983-1987. The crop genetic parameters, calibrated with 1983 as a typical year, were used to run the simulations through the other 4 years ( 1984, 1985, 1986 and 1987 ). The results showed that the predicted and measured dates from seedling emergence to the end of the juvenile stage had a mean difference of 3 days, while dates from silking to physiological maturity had a mean difference of 0.5 days. For 1983, 1984, 1985, 1986 and 1987, the model-estimated grain yields were 98.3,107.1,103.6, 90.2 and 91.3% of measured yields, respectively, under the initial soil water content at the drained upper limit. The model also estimated well at the extractable lower limit, except in 1985, which it overesti- mated by 21.4% due to delayed germination caused by water stress. In this particular year, ad- vancing the sowing date by 1 day which had soil water content above the lower limit set for germination resulted in the model overestimating yield by only 3.3 %.
INTRODUCTION
Accurate crop yield forecasting is the ultimate goal of many scientists as well as government decision makers throughout the world. To meet this goal, many countries have established costly crop yield data collection networks to observe and estimate crop production on a real-time scale. However, the resulting es- t imates are often suspect due to inadequate coverage with trained observers over large areas such as Brazil.
*University of Missouri Agricultural Experiment Station Journal Series No. 10526.
0168-1923/89/$03.50 © 1989 Elsevier Science Publishers B.V.
300
In the early seventies, agrometeorological statistical regression models pre- dicted grain yield in various countries with reasonable success (McQuigg, 1975 ). However, the statistical model often failed to detect insect attacks, diseases, anomalous climatic events such as severe drought and flood damage, and the variability due to occurrences of extreme climatic conditions, the values of which were not recorded historically. Katz (1979) reported on the sensitivity analysis of this type of model. Various approaches were at tempted to improve the statistical models, such as shortening the data period from monthly to weekly, redefining the periods more sensitive to yield, or better formulating water availability in a crop moisture index (Sakamoto, 1978; Liu and Liu, 1986). These attempts did improve the estimation methods to some extent. However, the simple monthly statistical model remains a powerful and economical tool for a first approximation estimate, especially when the weather variation is not too pronounced.
More recent attempts to produce reliable crop yield forecasts incorporate current technologies such as satellite-derived vegetation indices (Sakamoto and Steyaert, 1986; Johnson et al., 1987) and plant growth simulation models for estimating large-area crop production. The latter use plant physiological processes such as photosynthesis, leaf, stem and root growths, flowering, grain filling and plant water use. The CERES-Maize model, developed at the Grass- land, Soil and Water Research Laboratory (Jones and Kiniry, 1986), recently estimated corn production for the U.S. Cornbelt (Hodges et al., 1987). In this study, the applicability of the CERES-Maize model to yield estimation for one location in Brazil was examined.
METHODS
Model description
The standard version of the CERES-Maize model simulates the effects of genotype, weather and soil physical properties on maize growth and yield. The simulation of crop growth, development and yield is based on quantitative knowledge, such as phenological development affected by genetics and daily climate; extension growth of leaves, stems and roots; biomass accumulation and partitioning; soil water balance; crop water use. Nutrient availability is assumed to be unlimited for crop growth.
The effects of crop management such as control of weeds, insects, diseases, toxicities, fertilizer applications and farming system practices and cata- strophic weather events such as hurricanes, flood, frost and wind damage were not considered.
To simulate maize growth and calibrate the model, daily maximum and min- imum temperature, precipitation and solar radiation data are needed. Neces- sary soil physical properties include the extractable soil water in the profile,
301
soil run-off, infiltration rate and soil evaporation. Crop parameters include hybrid, growth degree-days, photoperiod sensitivity, potential kernel number, potential kernel growth rate, leaf area index and historic yield. The model may be applied to large-area crop production with only daily weather data (Hodges et al., 1987). Standard soil physical property and crop genetic characteristics data are summarized in the model document (Jones and Kiniry, 1986).
Description of test location
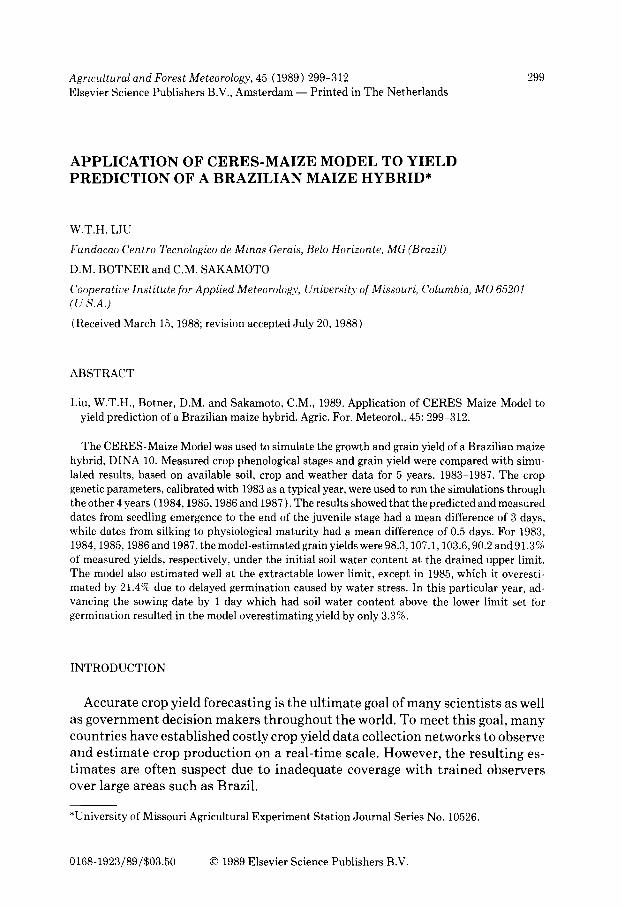
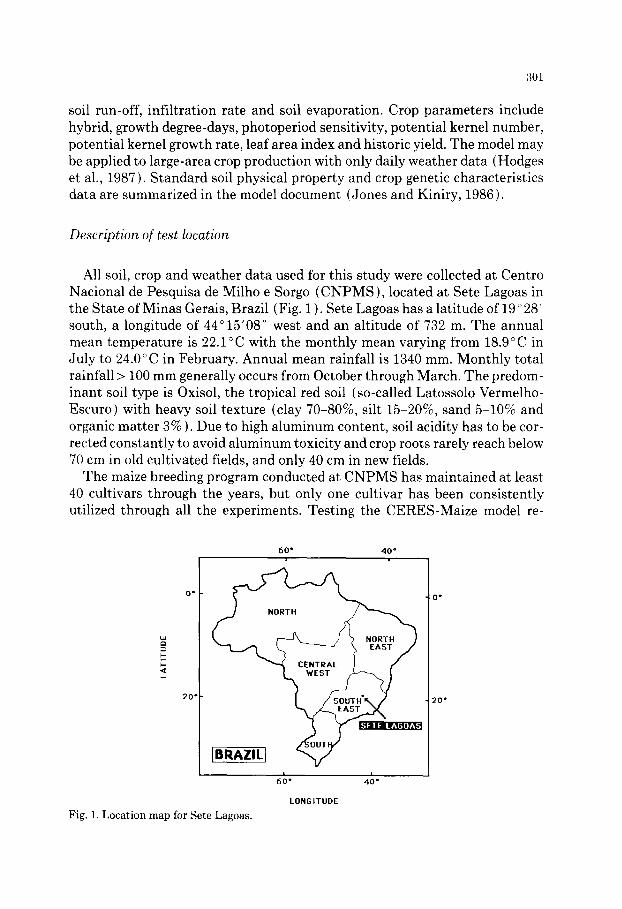
All soil, crop and weather data used for this study were collected at Centro Nacional de Pesquisa de Milho e Sorgo (CNPMS), located at Sete Lagoas in the State of Minas Gerais, Brazil (Fig. 1 ). Sete Lagoas has a latitude of 19 ° 28' south, a longitude of 44°15'08 '' west and an altitude of 732 m. The annual mean temperature is 22.1°C with the monthly mean varying from 18.9°C in July to 24.0°C in February. Annual mean rainfall is 1340 mm. Monthly total rainfall > 100 mm generally occurs from October through March. The predom- inant soil type is Oxisol, the tropical red soil (so-called Latossolo Vermelho- Escuro) with heavy soil texture (clay 70-80%, silt 15-20%, sand 5-10% and organic matter 3% ). Due to high aluminum content, soil acidity has to be cor- rected constantly to avoid aluminum toxicity and crop roots rarely reach below 70 cm in old cultivated fields, and only 40 cm in new fields.
The maize breeding program conducted at CNPMS has maintained at least 40 cultivars through the years, but only one cultivar has been consistently utilized through all the experiments. Testing the CERES-Maize model re-
h-
.J
0 °
20 •
60 ° 40 °
I I
60 ° 40 °
LONGITUDE
Fig. 1. Location map for Sere Lagoas.
0 °
2 0 "
302
quires crop da t a f rom a single cul t ivar . Only one cul t ivar , D I N A 10, had 4 years of da ta in a sequence f rom 1983 to 1986. A closely re la ted cul t ivar , D I N A 90, was used in 1987.
Parameter inputs
T h e p a r a m e t e r inpu t file, which includes crop and soil data , is l is ted in Tab le 1. D a t a on maize grain yield, phenologica l cycle, p l an t popu la t i on densi ty , sow- ing depth, p h o t o p e r i o d sensi t iv i ty , da tes of sowing, s i lking and physiological m a t u r i t y for cu l t ivars D I N A 10 and D I N A 90 at Sete Lagoas f rom 1983 to 1987 were ob t a ined f rom C N P M S . All the grain yield da t a were cor rec ted to a grain wa te r con t en t of 15.5%. Soil da ta which include d ra ined uppe r limit, lower l imit of p l a n t - e x t r a c t a b l e soil water , s a t u r a t e d soil wa te r c o n t e n t by volume, uppe r l imit of S tage 1 soil e v a p o r a t i o n and soil roo t ing dep th were obse rved values. Soil a lbedo was e s t i m a t e d based on soil organic m a t t e r of 3% and the conve r t ed tab le p rov ided by the model manua l . T h e soil p a r a m e t e r s of whole profi le d ra inage coeff ic ient and run -o f f curve n u m b e r were also e s t i m a t e d by m e t h o d s p rov ided in the model m a n u a l wi th obse rved soil phys ica l p r o p e r t y da ta f rom the s tudy site. T h e values of the weight ing fac tors for roo t ing in five
TABLE 1
Summary of initial input data, crop genetics parameters and soil characteristics parameters used for the CERES-Maize Model
Crop genetic code ..................................................................................................................... DINA 10 Crop phenological cycle from germination to physiological maturity .................................. 155 days Plant population density .................................................................................................. £ plants m ~ Sowing depth ................................................................................................................................... 5 cm Growing degree-days (base 8 o C) from seedling emergence to the
end of the juvenile phase (P~) ........................................................................................ 400 degrees Growing degree-days (base 8cC) from silking to physiological maturity (P~) ........... 1240 degrees Photoperiod sensitivity ................................................................................................................. 0 h Potential kernel number (G2) ............................................................................. 600 kernels per plant Potential kernel growth rate (Ga) ............................................................... 6.4 mg per kernel per day Lower limit of plant-extractable soil water content by volume ................................................ 27.5% Drained upper limit soil water content by volume ..................................................................... 37.5% Saturated soil water content by volume ...................................................................................... 39.0% Soil depth based on rooting depth, which was divided into five layers
(10, 10, 15, 15 and 15 cm) ........................................................................................................ 65 cm Soil albedo with average organic matter of 3 % .............................................................................. 0. ! 3 Upper limit of Stage 1 soil evaporation ............................................................................ 6 mm day Whole profile drainage coefficient ................................................................................. 0.41 cm day-1 Runoff curve number ........................................................................................................................ 75.0 Weighting factors for rooting in five layers of depth ................................. 0.93; 0.70; 0.32; 0.10; 0.05 Initial soil water content by volume ................................................................................ 27.5 or 37.5%
303
layers of soil depth presented in the standard model were used. Initial soil water content by volume at both drained upper limit and at plant-extractable lower limit were used throughout the tests.
Growing degree-day data from germination to the end of the juvenile phase (P1) and from silking to physiological maturity (P~) and data on potential kernel number (G2) and potential kernel growth rate (G3) were calibrated from the crop and climatic data available in 1983. A description of model cal- ibration follows in the Results and Discussion.
Weather inputs
Daily maximum and minimum temperature, precipitation and cloud cover data at Sete Lagoas from 1982 to 1987 were supplied by the Fifth District of the Brazilian National Institute of Meteorology. Daily solar radiation was es- t imated from cloud cover data, based on Black's (1956) equation with the ec- centricity correction for the earth's orbit (Iqbal, 1983). No irrigation was applied in the years considered in this study.
Outputs
Three output files were generated by the model: general, soil water and bio- mass. The general output file contains most of the parameter input data and root weighting factors for each soil layer. The general output file lists the dates of all the phenological stages throughout the growth cycle, cumulative biomass from the end of juvenile stage to the end of physiological maturity, leaf area index at various growth stages and cumulative precipitation. The general output file also compares the observed and predicted values of silking and ma- turity days, grain yield, kernel weight, biomass, maximum leaf area index at silking and the coefficient of soil water deficit at five stages of growth. The soil water output file lists the water balance components such as evapotranspira- tion and plant transpiration, weather data and volumetric soil water content of each layer at a cumulative interval base. A 7-day cumulative value was used throughout the study. The rooting depth, root length, leaf weight, root weight, stem weight, ear weight and leaf area index are listed in the biomass output file on a 7-day cumulative basis.
RESULTS AND DISCUSSION
The five genetic coefficients required by the model were not explicitly avail- able for the cultivar used in the experiments. The coefficients for the two trop- ical hybrids supplied by the model developers were tested in the model. These coefficients, however, produced phenological stages that were consistently too short and yields that were consistently too low. Brazilian maize hybrids have
304
E 2o
c
E ~s Z Q
~ 5 O
Z ,~ 08000
I I ! I 9 0 0 0 1 0 0 0 0 I I 0 0 0 1 2 0 0 0
SIMULATED YIELD (kg/ha)
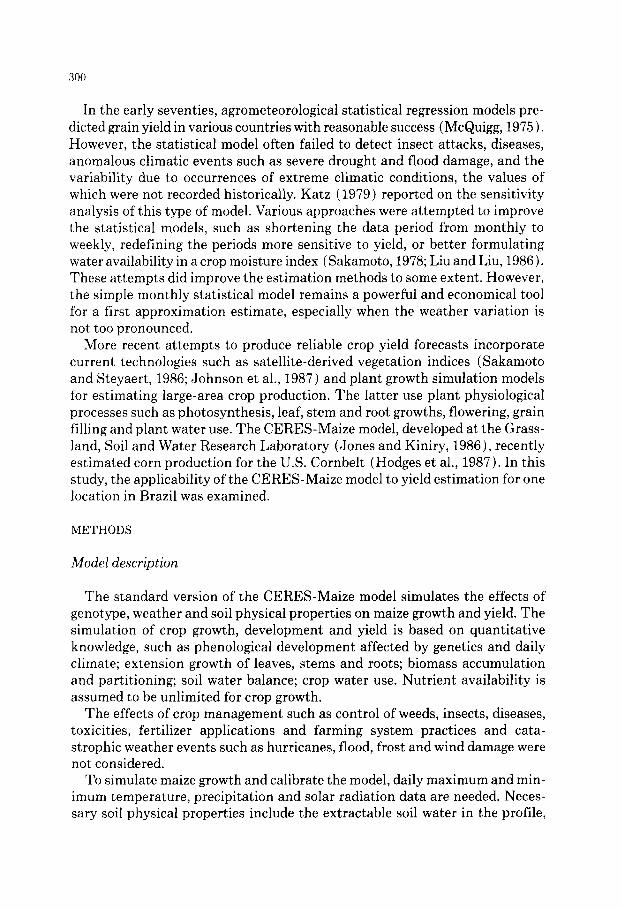
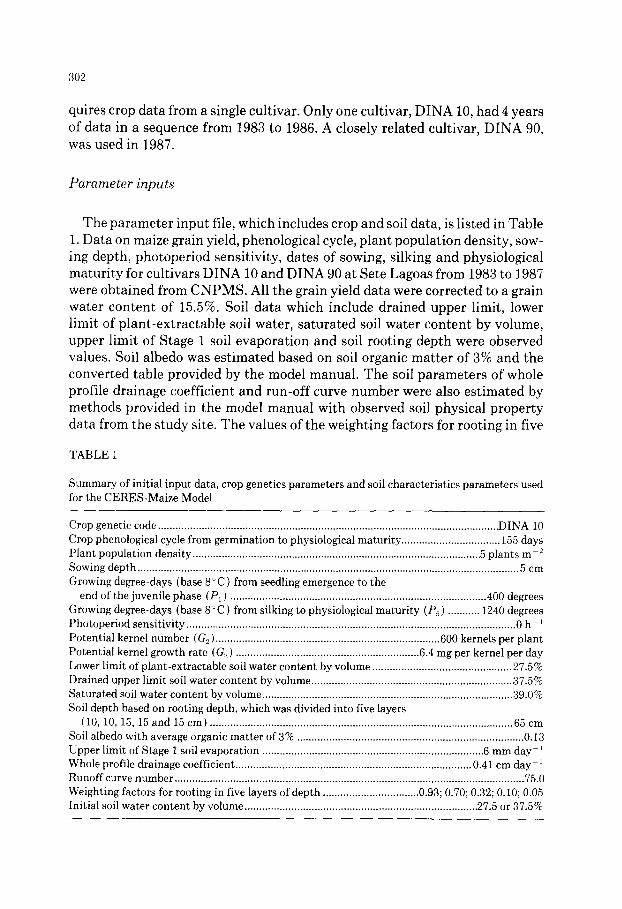
Fig. 2. Effect of plant population on simulated corn yield.
o
o -r
~ ° ~ c~
, , , - - - - - - , _
840O Be00 B800 9OOO 9 2 0 0 9 4 0 0 6 0 0 1 ~ 0 0 9 9SO0
S I I ' I U L A T E D Y I E L D ( k g / h a )
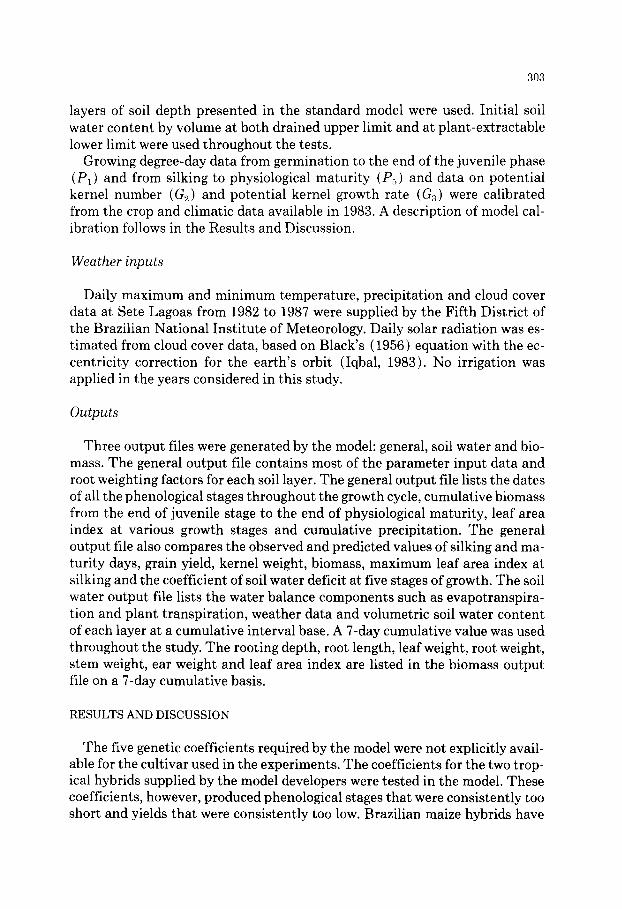
Fig. 3. Effect of sowing depth on simulated corn yield.
1oo
9 o
s o
7o~
5o.
50
SIMULATED YIELD (kg/ha)
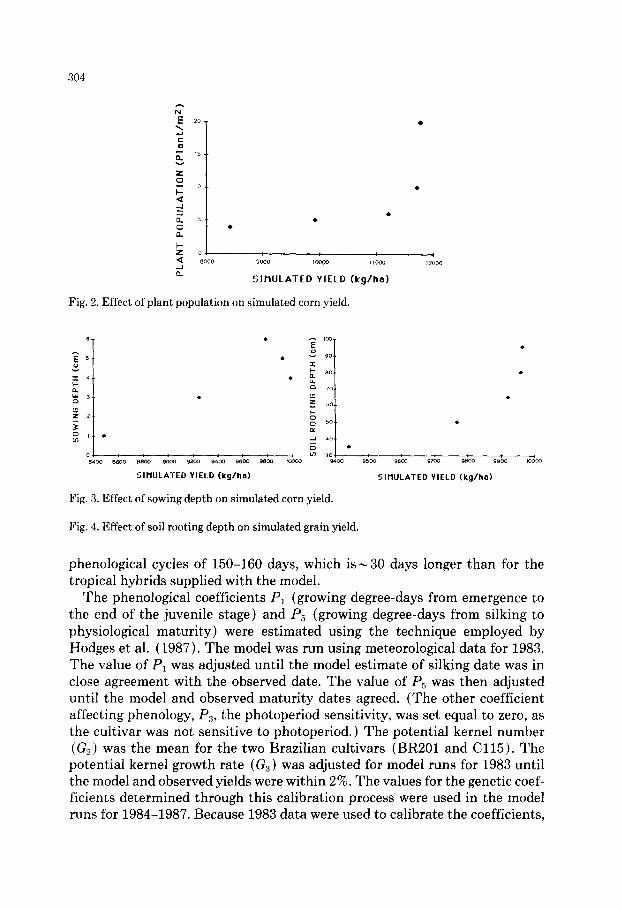
Fig. 4. Effect of soil rooting depth on simulated grain yield.
phenological cycles of 150-160 days, which i s~ 30 days longer than for the tropical hybrids supplied with the model.
The phenological coefficients P] (growing degree-days from emergence to the end of the juvenile stage) and P~ (growing degree-days from silking to physiological maturity) were estimated using the technique employed by Hodges et al. (1987). The model was run using meteorological data for 1983. The value of P1 was adjusted until the model estimate of silking date was in close agreement with the observed date. The value of P5 was then adjusted until the model and observed maturity dates agreed. (The other coefficient affecting phenology, P3, the photoperiod sensitivity, was set equal to zero, as the cultivar was not sensitive to photoperiod.) The potential kernel number (G2) was the mean for the two Brazilian cultivars (BR201 and Cl15). The potential kernel growth rate (G3) was adjusted for model runs for 1983 until the model and observed yields were within 2%. The values for the genetic coef- ficients determined through this calibration process were used in the model runs for 1984-1987. Because 1983 data were used to calibrate the coefficients,
305
TABLE 2
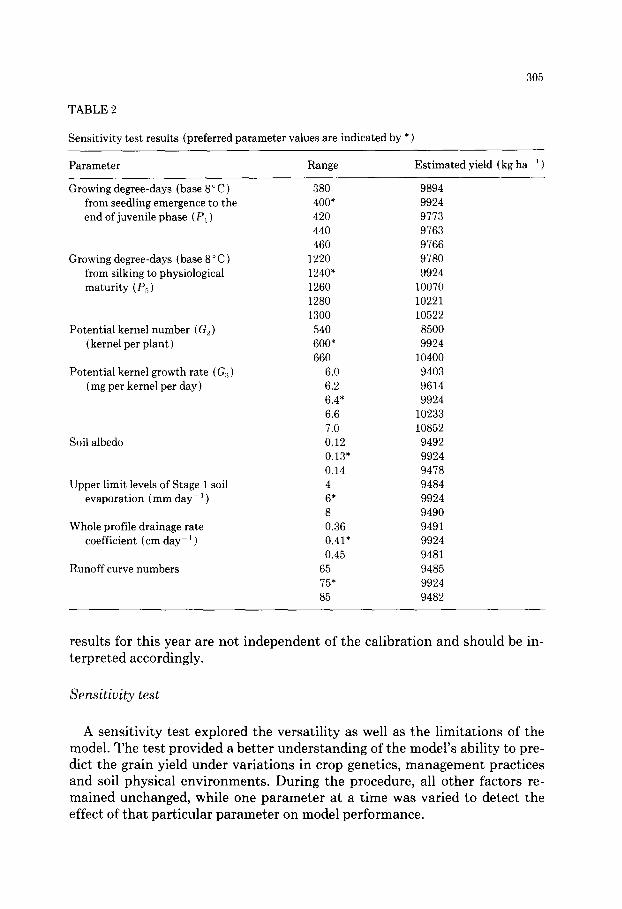
Sensitivity test results (preferred parameter values are indicated by * )
Parameter Range Estimated yield (kg ha ~ )
Growing degree-days (base 8 ° C) from seedling emergence to the end of juvenile phase (PI)
Growing degree-days (base 8 ° C) from silking to physiological maturity (P~,)
Potential kernel number (G~) (kernel per plant)
Potential kernel growth rate (G:~) (mg per kernel per day)
Soil albedo
Upper limit levels of Stage 1 soil evaporation (ram day- ~ )
Whole profile drainage rate coefficient (cm day- ~ )
Runoff curve numbers
380 9894 400* 9924 420 9773 440 9763 460 9766
1220 9780 1240" 9924 1260 10070 1280 10221 1300 10522 540 8500 600* 9924 660 104O0
6.0 9403 6.2 9614 6.4* 9924 6.6 1O233 7.0 10852 0.12 9492 0.13" 9924 0.14 9478 4 9484 6* 9924 8 9490 0.36 9491 0.41" 9924 0.45 9481
65 9485 75* 9924 85 9482
results for this year are not independent of the calibration and should be in- terpreted accordingly.
Sensitivity test
A sensitivity test explored the versatility as well as the limitations of the model. The test provided a better understanding of the model's ability to pre- dict the grain yield under variations in crop genetics, management practices and soil physical environments. During the procedure, all other factors re- mained unchanged, while one parameter at a time was varied to detect the effect of that particular parameter on model performance.
306
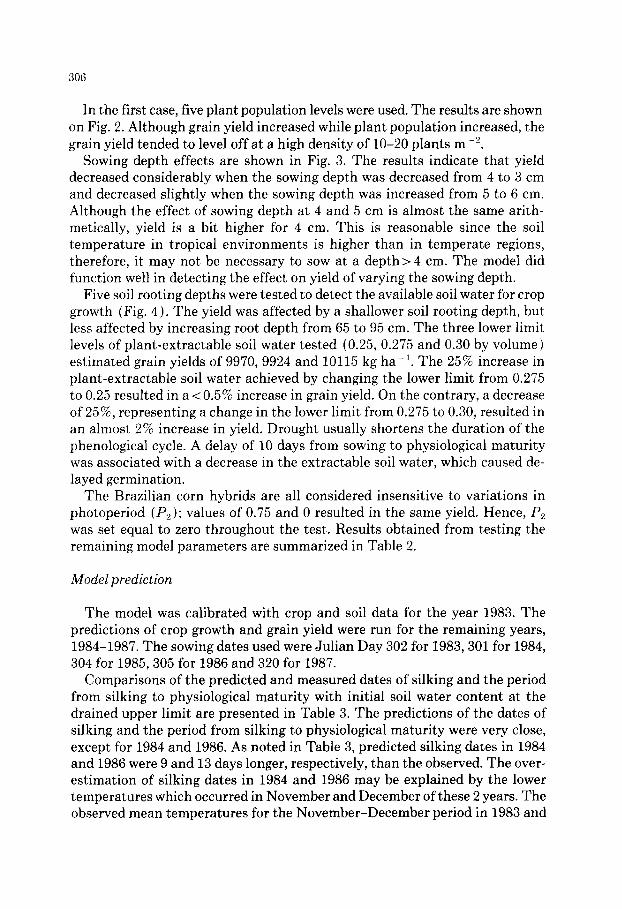
In the first case, five plant population levels were used. The results are shown on Fig. 2. Although grain yield increased while plant population increased, the grain yield tended to level off at a high density of 10-20 plants m -2.
Sowing depth effects are shown in Fig. 3. The results indicate that yield decreased considerably when the sowing depth was decreased from 4 to 3 cm and decreased slightly when the sowing depth was increased from 5 to 6 cm. Although the effect of sowing depth at 4 and 5 cm is almost the same arith- metically, yield is a bit higher for 4 cm. This is reasonable since the soil temperature in tropical environments is higher than in temperate regions, therefore, it may not be necessary to sow at a depth> 4 cm. The model did function well in detecting the effect on yield of varying the sowing depth.
Five soil rooting depths were tested to detect the available soil water for crop growth (Fig. 4). The yield was affected by a shallower soil rooting depth, but less affected by increasing root depth from 65 to 95 cm. The three lower limit levels of plant-extractable soil water tested (0.25, 0.275 and 0.30 by volume) estimated grain yields of 9970, 9924 and 10115 kg ha -1. The 25% increase in plant-extractable soil water achieved by changing the lower limit from 0.275 to 0.25 resulted in a < 0.5% increase in grain yield. On the contrary, a decrease of 25%, representing a change in the lower limit from 0.275 to 0.30, resulted in an almost 2% increase in yield. Drought usually shortens the duration of the phenological cycle. A delay of 10 days from sowing to physiological maturity was associated with a decrease in the extractable soil water, which caused de- layed germination.
The Brazilian corn hybrids are all considered insensitive to variations in photoperiod (P2); values of 0.75 and 0 resulted in the same yield. Hence, P2 was set equal to zero throughout the test. Results obtained from testing the remaining model parameters are summarized in Table 2.
Model prediction
The model was calibrated with crop and soil data for the year 1983. The predictions of crop growth and grain yield were run for the remaining years, 1984-1987. The sowing dates used were Julian Day 302 for 1983, 301 for 1984, 304 for 1985, 305 for 1986 and 320 for 1987.
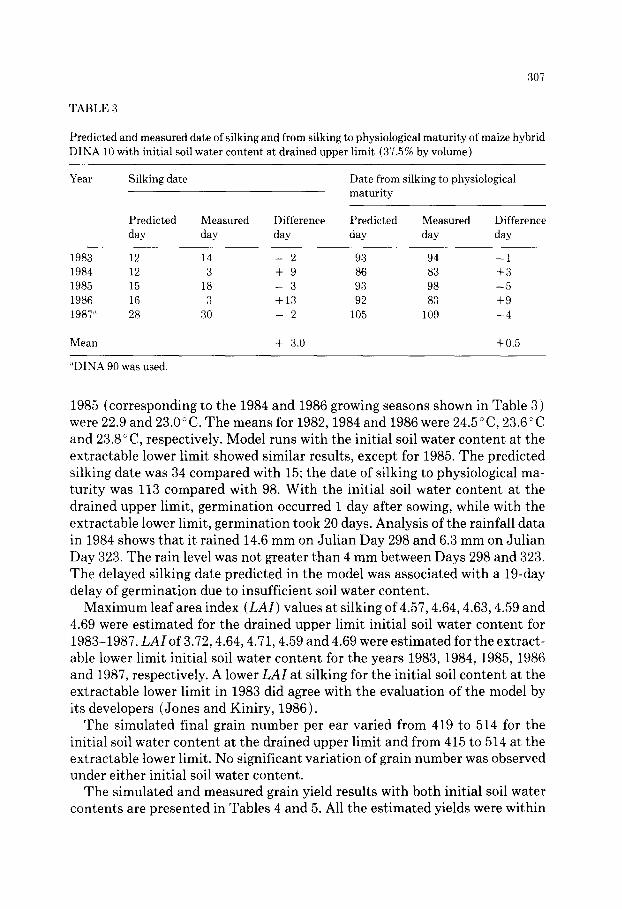
Comparisons of the predicted and measured dates of silking and the period from silking to physiological maturity with initial soil water content at the drained upper limit are presented in Table 3. The predictions of the dates of silking and the period from silking to physiological maturity were very close, except for 1984 and 1986. As noted in Table 3, predicted silking dates in 1984 and 1986 were 9 and 13 days longer, respectively, than the observed. The over- estimation of silking dates in 1984 and 1986 may be explained by the lower temperatures which occurred in November and December of these 2 years. The observed mean temperatures for the November-December period in 1983 and
307
TABLE 3
Predicted and measured date of silking and from silking to physiological matur i ty of maize hybrid DINA 10 with init ial soil water content at drained upper l imit (37.5% by volume)
Year Silking date Date from silking to physiological matur i ty
Predicted Measured Difference Predicted Measured Difference day day day day day day
1983 12 14 -- 2 93 94 -- 1 1984 12 3 + 9 86 83 + 3 1985 15 18 - 3 93 98 --5 1986 16 3 + 13 92 83 + 9 1987" 28 30 - 2 105 109 - 4
Mean + 3.0 +0.5
"DINA 90 was used.
1985 (corresponding to the 1984 and 1986 growing seasons shown in Table 3) were 22.9 and 23.0 ° C. The means for 1982, 1984 and 1986 were 24.5 ° C, 23.6 ° C and 23.8 ° C, respectively. Model runs with the initial soil water content at the extractable lower limit showed similar results, except for 1985. The predicted silking date was 34 compared with 15; the date of silking to physiological ma- turity was 113 compared with 98. With the initial soil water content at the drained upper limit, germination occurred 1 day after sowing, while with the extractable lower limit, germination took 20 days. Analysis of the rainfall data in 1984 shows that it rained 14.6 mm on Julian Day 298 and 6.3 mm on Julian Day 323. The rain level was not greater than 4 mm between Days 298 and 323. The delayed silking date predicted in the model was associated with a 19-day delay of germination due to insufficient soil water content.
Maximum leaf area index (LAI) values at silking of 4.57, 4.64, 4.63, 4.59 and 4.69 were estimated for the drained upper limit initial soil water content for 1983-1987. LAI of 3.72, 4.64, 4.71, 4.59 and 4.69 were estimated for the extract- able lower limit initial soil water content for the years 1983, 1984, 1985, 1986 and 1987, respectively. A lower LAI at silking for the initial soil content at the extractable lower limit in 1983 did agree with the evaluation of the model by its developers (Jones and Kiniry, 1986).
The simulated final grain number per ear varied from 419 to 514 for the initial soil water content at the drained upper limit and from 415 to 514 at the extractable lower limit. No significant variation of grain number was observed under either initial soil water content.
The simulated and measured grain yield results with both initial soil water contents are presented in Tables 4 and 5. All the est imated yields were within
308
TABLE 4
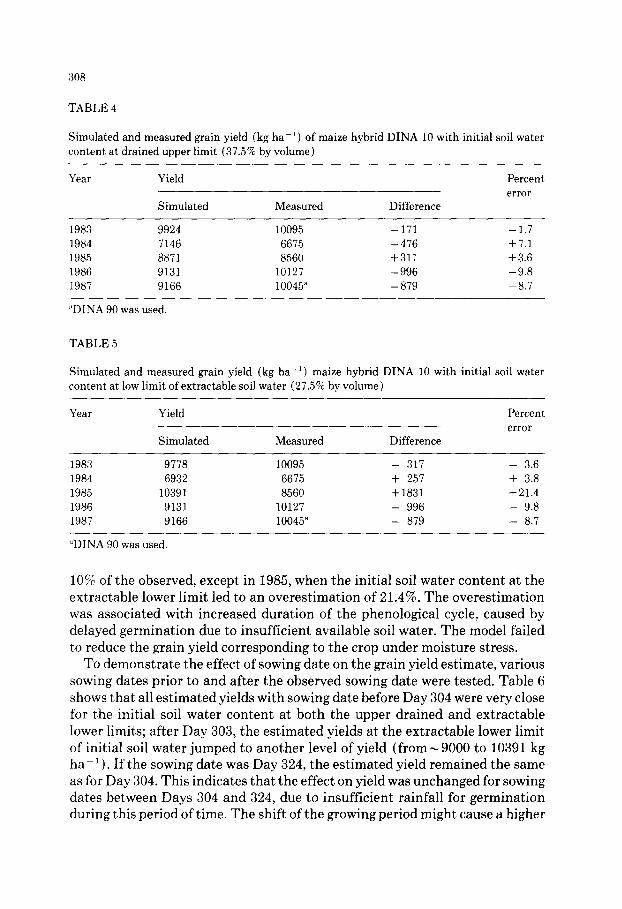
Simulated and measured grain yield (kg ha -~ ) of maize hybrid DINA 10 with initial soil water content at drained upper limit (37.5% by volume)
Year Yield Percent error
Simulated Measured Difference
1983 9924 10095 - 171 - 1.7 1984 7146 6675 - 4 7 6 + 7.1 1985 8871 8560 +311 +3.6 1986 9131 10127 - 9 9 6 - 9 . 8 1987 9166 10045 a - 8 7 9 - 8 . 7
"DINA 90 was used.
TABLE 5
Simulated and measured grain yield (kg ha -~) maize hybrid DINA 10 with initial soil water content at low limit of extractable soil water (27.5% by volume)
Year Yield Percent error
Simulated Measured Difference
1983 9778 10095 - 317 - 3.6 1984 6932 6675 + 257 + 3.8 1985 10391 8560 + 1831 +21.4 1986 9131 10127 - 996 - 9.8 1987 9166 10045 ~ - 879 - 8.7
~'DINA 90 was used.
10% of the observed, except in 1985, when the initial soil water content at the extractable lower limit led to an overestimation of 21.4%. The overestimation was associated with increased duration of the phenological cycle, caused by delayed germination due to insufficient available soil water. The model failed to reduce the grain yield corresponding to the crop under moisture stress.
To demonstrate the effect of sowing date on the grain yield estimate, various sowing dates prior to and after the observed sowing date were tested. Table 6 shows that all estimated yields with sowing date before Day 304 were very close for the initial soil water content at both the upper drained and extractable lower limits; after Day 303, the estimated yields at the extractable lower limit of initial soil water jumped to another level of yield (from ~ 9000 to 10391 kg ha- 1 ). If the sowing date was Day 324, the estimated yield remained the same as for Day 304. This indicates that the effect on yield was unchanged for sowing dates between Days 304 and 324, due to insufficient rainfall for germination during this period of time. The shift of the growing period might cause a higher
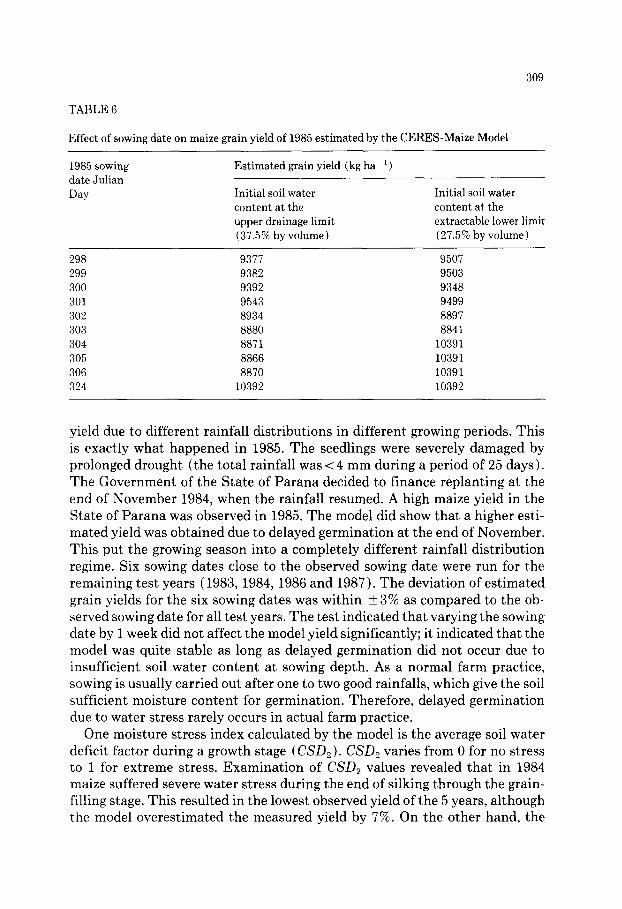
TABLE 6
Effect of sowing date on maize grain yield of 1985 estimated by the CERES-Maize Model
309
1985 sowing date Julian Day
Estimated grain yield (kg ha- 1 )
Initial soil water content at the upper drainage limit (37.5% by volume)
Initial soil water content at the extractable lower limit (27.5% by volume)
298 9377 9507 299 9382 9503 300 9392 9348 301 9543 9499 302 8934 8897 303 8880 8841 304 8871 10391 305 8866 10391 306 8870 10391 324 10392 10392
yield due to different rainfall distributions in different growing periods. This is exactly what happened in 1985. The seedlings were severely damaged by prolonged drought (the total rainfall was < 4 mm during a period of 25 days). The Government of the State of Parana decided to finance replanting at the end of November 1984, when the rainfall resumed. A high maize yield in the State of Parana was observed in 1985. The model did show that a higher esti- mated yield was obtained due to delayed germination at the end of November. This put the growing season into a completely different rainfall distribution regime. Six sowing dates close to the observed sowing date were run for the remaining test years (1983, 1984, 1986 and 1987). The deviation of est imated grain yields for the six sowing dates was within + 3% as compared to the ob- served sowing date for all test years. The test indicated that varying the sowing date by 1 week did not affect the model yield significantly; it indicated that the model was quite stable as long as delayed germination did not occur due to insufficient soil water content at sowing depth. As a normal farm practice, sowing is usually carried out after one to two good rainfalls, which give the soil sufficient moisture content for germination. Therefore, delayed germination due to water stress rarely occurs in actual farm practice.
One moisture stress index calculated by the model is the average soil water deficit factor during a growth stage (CSD2). CSD2 varies from 0 for no stress to 1 for extreme stress. Examinat ion of CSD2 values revealed that in 1984 maize suffered severe water stress during the end of silking through the grain- filling stage. This resulted in the lowest observed yield of the 5 years, although the model overestimated the measured yield by 7%. On the other hand, the
310
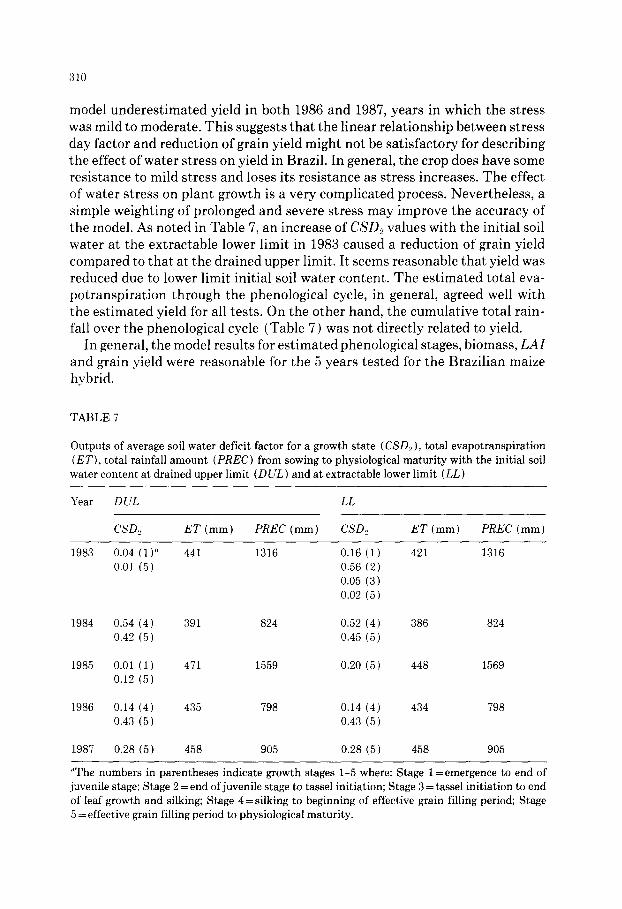
model underestimated yield in both 1986 and 1987, years in which the stress was mild to moderate. This suggests that the linear relationship between stress day factor and reduction of grain yield might not be satisfactory for describing the effect of water stress on yield in Brazil. In general, the crop does have some resistance to mild stress and loses its resistance as stress increases. The effect of water stress on plant growth is a very complicated process. Nevertheless, a simple weighting of prolonged and severe stress may improve the accuracy of the model. As noted in Table 7, an increase of CSD2 values with the initial soil water at the extractable lower limit in 1983 caused a reduction of grain yield compared to that at the drained upper limit. It seems reasonable that yield was reduced due to lower limit initial soil water content. The estimated total eva- potranspiration through the phenological cycle, in general, agreed well with the estimated yield for all tests. On the other hand, the cumulative total rain- fall over the phenological cycle (Table 7) was not directly related to yield.
In general, the model results for estimated phenological stages, biomass, LAI and grain yield were reasonable for the 5 years tested for the Brazilian maize hybrid.
TABLE 7
Outputs of average soil water deficit factor for a growth state (CSD,~), total evapotranspiration (ET), total rainfall amount (PREC) from sowing to physiological maturity with the initial soil water content at drained upper limit (DUL) and at extractable lower limit (LL)
Year D UL LL
CSD=, ET (ram) PREC (mm) CSD2 ET (ram) PREC (mm)
1983 0.04 (1) a 441 1316 1316 0.01 (5
1984 0.54 (4 0.42 (5
1985 0.01 (1 0.12 (5
0.16 (1) 421 0.56 (2) 0.05 (3) 0.02 (5)
391 824 0.52 (4) 386 824 0.45 (5)
471 1559 0.20 (5) 448 1569
1986 0.14 (4 435 798 0.14 (4) 0.43 (5) 0.43 (5)
434 798
1987 0.28 (5) 458 905 0.28 (5) 458 905
"The numbers in parentheses indicate growth stages 1-5 where: Stage 1 =emergence to end of juvenile stage; Stage 2 = end of juvenile stage to tassel initiation; Stage 3 = tassel initiation to end of leaf growth and silking; Stage 4 = silking to beginning of effective grain filling period; Stage 5 = effective grain filling period to physiological maturity.
311
CONCLUSIONS
The model predicted well from silking to physiological maturity, but tended to overestimate the dates from emergence to the end of juvenile stage when the months were colder than normal. The model predicted grain yields well when the germination was not delayed by severe water stress and predicted poorly when these delays occurred.
The model phenological stages should be shortened, reducing the grain yield when severe water stress occurs. This can be achieved by introducing the effect of a water stress factor with certain weighting coefficients to reduce various critical growth degree-day values set for the onset of different phenological stages.
The relationship between water stress and yield should be improved for con- ditions of prolonged and intense stress. In general, it is concluded that the model performed well in simulating plant growth and grain yield based on the physiological concept of formulating initiation and growth of leaves, stems and roots, and their complicated interactions within a soil-plant-atmosphere sys- tem. It is potentially feasible to apply the model to large areas in Brazil.
It is beyond the scope of this study to examine the problem of yield fore- casting, i.e., predicting yield before the end of the growing season. The accuracy of such forecasts is a function of both model accuracy and the skill of the weather forecasts. For an example of the application of the CERES-Maize model to yield forecasting in the U.S. Cornbelt, see Hodges et al. (1987).
This study showed that the CERES-Maize model produced useful estimates of maize yield for one location in Brazil. Further research will test the model at other locations and apply it to large-area yield estimation in Brazil.
ACKNOWLEDGMENTS
This research was conducted while the senior author was a Visiting Scientist at the Cooperative Institute for Applied Meteorology (CIAM). The Institute is composed of staff from the National Environmental Satellite, Data and In- formation Service (NESDIS), National Oceanic and Atmospheric Adminis- tration (NOAA), and the University of Missouri in Columbia, Missouri, U.S.A. The full support of CIAM was gratifying. In particular, we wish to thank Rita Terry for providing editorial review and Suzanne Rutter for typing. Also, thanks are given to the Fifth District of the National Institute of Meteorology at Belo Horizonte, Brazil, for providing the meteorological data, and the National Re- search Center for Maize and Sorghum at Sete Lagoas for providing the crop and soil data which made this study possible. The visit was supported by Con- selho Nacional de Desenvolvimento Cientifico e Tecnologico (CNPq), Brazil.
312
REFERENCES
Black, J.N., 1956. The distribution of solar radiation over the Earth's surface. Arch. Meteorol. Geophys. Bioklimatol., 7: 165-189.
Hodges, T., Botner, D., Sakamoto, C. and Haug, J., 1987. Using the CERES-Maize Model to estimate production for the U.S. cornbelt. Agric. For. Meteorol., 40: 293-303.
Iqbal, M., 1983. An Introduction to Solar Radiation. Academic Press, New York, 390 pp. Johnson, G.E., van Dijk, A. and Sakamoto, C.M., 1987. The use of AVHRR data in operational
agricultural assessment in Africa. Geocarto Int., 1: 41-60. Jones, C.A. and Kiniry, J.R., 1986. CERES-Maize, A Simulation Model of Maize Growth and
Development. Texas A & M University Press, College Station, 194 pp. Katz, R.W., 1979. Sensitivity analysis of statistical crop-weather models. Agric. Meteorol., 20:
291-300. Liu, W.T. and Liu, B.W., 1986. Modelo de Previsao de Produtividede de Cafe no Estado de Minas
Gerais. IV Congress Bras. de Meteorol. Anais, 1: 38-47. McQuigg, J.D., 1975. Economic impacts of weather variability. Department of Atmospheric Sci-
ence, University of Missouri, Columbia, MO, 256 pp. Sakamoto, C.M., 1978. The Z-index as a variable for crop yield estimation. Agric. Meteorol., 19:
305-313. Sakamoto, C.M. and Steyaert, L.T., 1987. International drought early warning program of NOAA/
NESDIS/AISC. In: D.A. Wilhite and W.E. Easterling (Editors), Planning for Drought: To- ward a Reduction of Societal Vulnerability. Westview Press, Boulder, CO, pp. 247-272.
Recommended