Appendix F
Aquifer Pumping Test Calculation

Calculation No.: U0174200
Technical Task Cover Sheet
Discipline: Hydrogeology
Project:
UMTRA Ground Water
Site:
Green River, Utah
Subject:
Green River Aquifer Test Data Analyses
Sources of Data:
Bouwer, H. and R.C. Rice, 1976, "A slug test for determining hydraulic conductivity of unconfined aquifers with completely or partially penetrating wells," Water Resources Research, v. 12, p. 423-428.
Bouwer, H., "The Bouwer and Rice slug test - an update," Ground Water, 27(3), 304, 1989.
Black, J H, 1978, "The use of the slug test in groundwater investigations," Water Services, March, p. 174-178.
Environmental Simulations, Inc., 1999. "Guide to Using Aquifer Win32," Version 2.17.
Hvorslev, M.J., 1951, "Time lag and soil permeability in ground water observations," U.S. Army Corps of Engineers Waterway Experimentation Station, Bulletin 36.
Kruseman, G.P., and DeRidder, N.A., 1991. Analysis and Evaluation of Pumping Test Data, International Institute
for Land Reclamation and Improvement, 2nd Edition, Wageningen, The Netherlands.
Moench, A.F.,1984, "Double-porosity models for a fissured groundwater reservoir with fracture skin," Water Resources Research, vol. 20, no. 7, pp. 831-846.
Theis, C.V., 1935. "The relation between the lowering of the piezometric surface and the rate and duration of discharge of a well using ground water storage," Am. Geophys. Union Trans., Vol. 16, pp. 519-524.
USDOE, 1995, Aquifer Test Analysis of Well 173, Calculation Set No. GRN0118-95114-03/00.
Task Order No. ST02-109 File Index No. GWGRN 13.2
Proj. No. UGW-511-0009-10-000 Calc. No. U0174200 Supersedes Calc. No. NA
S.M. Stoller U.S. Department of Energy Grand Junction Office
I
Calculation No.: U0174200
1.0 Introduction
Aquifer and slug tests were completed at the Green River Uranium Mill Tailings Remedial Action (UMTRA) Project site to collect the hydrogeologic data necessary to characterize the Browns Wash alluvial aquifer and the middle sandstone unit of the Cedar Mountain Formation. These data were collected to provide a range of the transmissivity and hydraulic conductivity of both the alluvial and Cedar Mountain middle sandstone aquifers, and the specific storage of the middle sandstone aquifer.
The alluvial aquifer consists of a mixture of silt, sand, gravel, and small cobbles, and ranges in thickness from 0 to 35 feet (ft). Saturated thickness during the testing period (July 2002) ranged from 0 to 3 ft, with the maximum thickness near Browns Wash.
The middle sandstone unit of the Cedar Mountain Formation consists predominately of coarsegrained sandstone with minor amounts of siltstone and conglomerate, and ranges in thickness from 15 to 30 ft in the vicinity of the site. Wells installed in this formation that were used for this investigation are generally screened from approximately 75 to 90 ft below ground surface (bgs). This unit is confined with a saturated thickness of approximately 19 ft.
2.0 Previous Testing
An aquifer test at well 0173 designed to evaluate the sustainable yield of the middle sandstone unit of the Cedar Mountain Formation was completed in October 1993. During this time the well was pumped for 72 hours at a rate of approximately 4 gallons per minute (gpm). The initial analyses of the data were completed using confined and leaky aquifer methods (Calculation Set No. GRN01-11-93-14-09-00). Subsequent analysis of the same data set (Calculation Set No. GRN01-08-95-14-03-00) estimated aquifer parameters using unconfined and confined dual porosity methods that provided a better fit between the collected data and type curves.
3.0 Test Procedures
3.1 Alluvial Aquifer
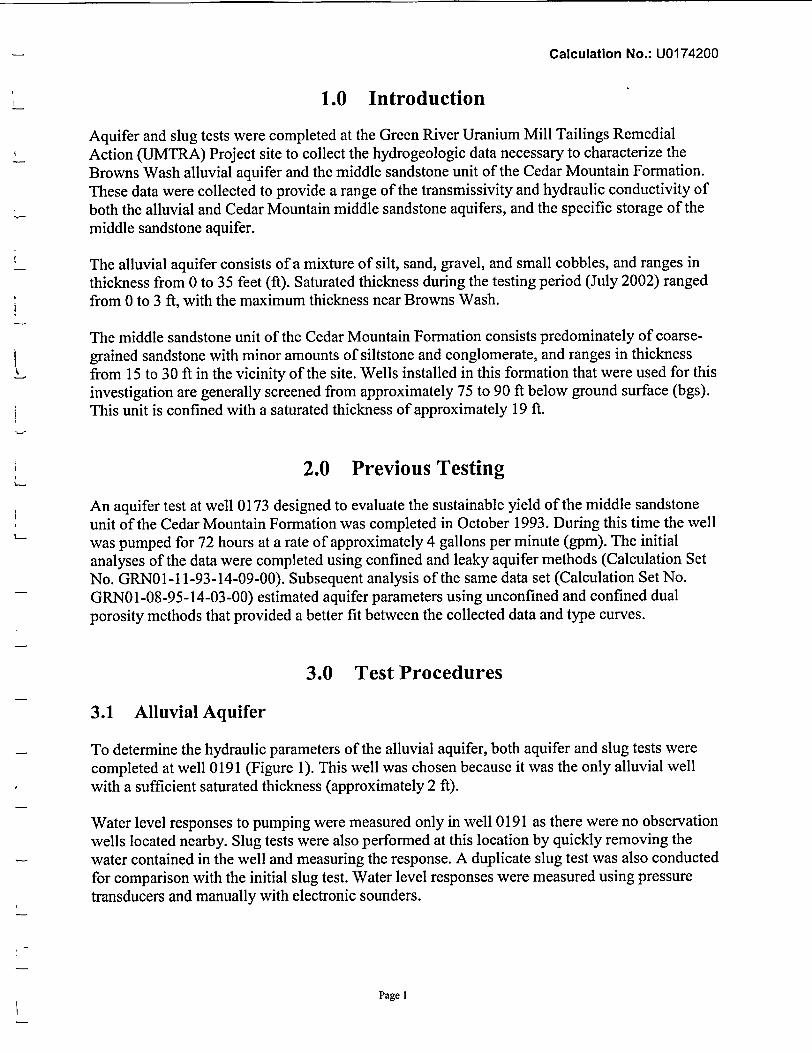
To determine the hydraulic parameters of the alluvial aquifer, both aquifer and slug tests were completed at well 0191 (Figure 1). This well was chosen because it was the only alluvial well with a sufficient saturated thickness (approximately 2 fit).
Water level responses to pumping were measured only in well 0191 as there were no observation wells located nearby. Slug tests were also performed at this location by quickly removing the water contained in the well and measuring the response. A duplicate slug test was also conducted for comparison with the initial slug test. Water level responses were measured using pressure transducers and manually with electronic sounders.
Page 1

Calculation No.: U0174200
O-fl
-Jmo
0 0
P., 2 c ui

Calculation No.: U0174200
Drawdown and residual drawdown data collected during the aquifer and slug tests were analyzed using the software'package AquiferWin32 (Environmental Simulations, Inc., Version 2.17). This package allows the user to analyze the data with a number of different analytical methods. Data, collected during the slug tests were analyzed using the Bouwer and Rice (1976), Hvorslev (195 1),'and Black (1978)'Methods. Residual drawdown data'collected during the short-term aquifer test from well 0191 were analyzed using theTheis (1935) Recovery Method.:
3.2 1 Cedar'Mountain Formation Middle Sandstone Unit
An aquifer test designed to characterize the Cedar Mountain Formation Middle Sandstone Unit was conducted using newly installed ývell 0181, located 18.7 ft northeast of well 0172. In addition to monitoring water level response in wells 0181 and 0172, water level data were cbllected from wells 0171, 0173, and 0174. Water levels in wells 0175 and 0813 were measured to monitor background fluctuations (Figure 1).
This test was initially designed to run for 72 hours; however, well 0181 did not sustain the pump rate dictated by the'step-drawdown test at this well. As a result, both a 3-hour (Test 1)and a, 52-hour (Test 2) aquifer test were performed at this location.
All water level responses were measured using pressure transducers and manually with electronic sounders. Ground water generated from each test was discharged a minimum of 100 ft from the pumping well and observation wells. Table 1 lists the well construction details for the pumping and observation wells associated with these tests.
Table 1. Well Construction Details forý the Cedar Mountain Middle Sandstone Unit Aq'bifer Test
-.-Well. 0181 0171 0172 0173- 0174 0175-1 0813
Distance from pumping well 0181 (ft) na 220 18.7 175 230 360 220 Elevation (ft msl) of top of middle ... .. . sandstone Unit - , t 4,059. -4,072 4.06i3 4,051., 4.065 4,084 4•.072,
Elevation (ft msl) of bottom of middle '4,047"4,051' 4,045' 4638 4'.056 4,052 4,045 sandstone unit Top of screen elevation (ft msl) 4,061 4,061 4,054 4,046 4,067 4,062 4,056
Bottom of screen elevation (ft insl) 4,046 4,051 4,044 4,036 4,057 4,052 4,036
Drawdow.vf ind residual drawdoivn datacollected during the.,aquifertests were analyzed using AquiferWin32. Drawdowvn data collected were ahhlyze.d i-sind th6Mdench (1984) Method for fractured a-quifrs, wh ile- residualdrawd own-dataii wereFin-alzedd fisingthe&Th-eis (1935) Recovery Method.__ T .
4.0 -,'Results '
4.1 Alluvial Aquifer Tests-_ Well 0191
The short-term aquiferiest at well 0191 was completed'or July 1 2002: Lsin'g'a pumpingrate* ranging from 0.9 to 1.3 gpm. After 3.5 ho urs of pimping,Athe pump was shut off andresidual drawdown data were collected from the well. The wvater level returned to' static'level within 15 minutes. Two slug tests were then conducted. The pump was set to its maximum discharge
Page 3

Calculation No.: U0174200
rate (-5 gpm) to evacuate the well as quickly as possible. After less than 30 seconds of pumping. water in the well NWas completely removed and the recovery monitored. Once the water level returned to static level, a duplicate slug test was conducted.
A number of assumptions were made in order to analyze the residual drawdown data collected during the short-terii aquifer test.'These include: ..
"* The well is pumped at a constant rate. (Flow rates fluctuated between 0.9 and 1.3 gpm during the pumping phase).
"• The pumping well is of infinitesimal diameter, and fully penetrates the aquifer.
"* The aquifer is unconfined (This assumption is only applicable to late-time drawdown data).
"* Discharge from the well is derived exclusively from aquifer storage.
Assumptions were also made in'order to complete the'analysis of the data collected during the slug tests. These include:
" The volume of water discharged from the well occurs instantaneously at time t = 0. (The pump used to remove the water from the well is set at a substantially high flow rate to instantly remove' the water.)'
" The discharging well is of finite, diameter and fully penetrates the aquifer.
"* The length of the well screen is significantly larger than the diameter of the well. (The diameter of well 0191 is 0.33 ft, while the well screen is 5 ft long.)
Table 2 presents analysis results from tests conducted at well 0191 in the alluvial aquifer. The recovery test data from the sho'rt-term aquifer test provides an estimate of aquifer transmissivity, while the slug test analyses provide hydraulic conductivity estimates.
Table 2. Analysis Results from the Alluvial Aquifer Short-Term Aquifer Test and Slug Tests
Aquifer Test Analysis Slug Test Analysis Test Number Theis Recovery Bouwer and Rice' Hvorslev Black-,
- T (ft /day) - K (f/day) K (ft/day) K (ft/day) K (ft/day) 0191lAq Test 1 86.7, 434 na na na
0191 Slug Test 1 na na 245 274 25.5 0191 Slug Test 2 na na 2214 296 25.1
Notes: na = not applicable K = Hydraulic Conductivity (based on a saturated thickness of 2 ft) T = Transmissivity
Using a saturated thickness of 2 ft, the hydraulic conductivity- derived from the short-term aquifer test is 43.4 ft/day. An aquifer test will typically influence a larger area of the aquifer compared to a slug test,arnd may prbvide' a more representative hy'draulic conductivity estimate. The plots associated with the aquifer and slug tests are in Appendix"A.
Page 4

Calculation No.: U0174200
It is possible that the weathered Manc-os Shale underlying the alluvium influences hydraulic, conductivity estimates for the alluvium. According t6 the boring log, the contact between the alluvium and'underlying bedrock was encountered at a depth of approximately .15 ft bgs. The static ground water level during the test was encountered at approximately the same depth, suggesting that for well 0191 the tests may have been representative of hydraulic conductivity of both units. -• - ,
Table 3 provides estimated sustainable flow rates for other wells completed in the alluvial aquifer based on well development data. As the table shows, the sustainable pumping rate associated with wvell 0191 is almost two orders of magnitude higher compared to the other three wells completed in the alluvium,'further suggesting the sustainable flow rate associated with well 0191 is not indicative of the entire alluvial aquifer.
Table 3. Sustainable Pumping Rates for Wells Completed Within the Alluvial Aquifer Based on Well Development Data
Well No. Sustainable pumping rate (gpm) 0191 - 1.0
0189 0.035
0188 0.004'
0194 00016
Note: Alluvial wells 0186, 0190, and 0193 were dry during the timeframe that development was completed ','".
4.2 Cedar Mountain Formation Middle Sandstone Unit Aquifer Tests
'W ell'0181 11 1 1 " '
A step-drawdown test was completed at 'well 0181 on'July 8,2002, using flow rates bf I and 2 gpm. The response to pumping indicated the well could not sustain a'flowi riite of 2'gpm. In order to maximize drawdown in the pumping and observation wells, an aquifer test was started at well 0181 6n Jutly 9, 2002. The constant pumping rate was-1.5 rlm. After 3 hours-of pumpfing, it was apparenf that the well could not su'stain'this rate over the desired 72-hour time period. Consequently, the pump was shut off and recovery data were collected from the pumping well only since none6f the'observaiion' wells significan'tly responded to the short pumping period. On July 10, a second 52-hour tesi'was performe'd using a rate'l-gpm. • .2 ,°
Drawdown measured in well 0181 and at each observation well at the conclusion of Test 2 is presented in Table 4. Observation well locations are shown on Figure 1.
"Table 4. Drawdown Measu'red in Response'to Pumping From Well 0181
0181 !0171 '0172 '. 0173 . 0174 0175 0813
Distance from pumping well 0181 (ft) na 220 18.7 175 230 360 220
Drawdown after pumping well10181 " -- 013 -069' 0.44 0 45 ',00 -- .0.16 for 52 hours at 1 1pm 0
Page 5
I "

Calculation No.: U0174200
As this table indicates, drawdown in wells 0171, 0173, 0174, 0175, and 0813 was less than 0.5 ft. Data collected from a background well indicated that barometric pressure changes caused water level fluctuations of approximately 0.2 ft during the test (Section 5.0). Consequently, the, drawdown data collected from the observation wells were not analyzed.
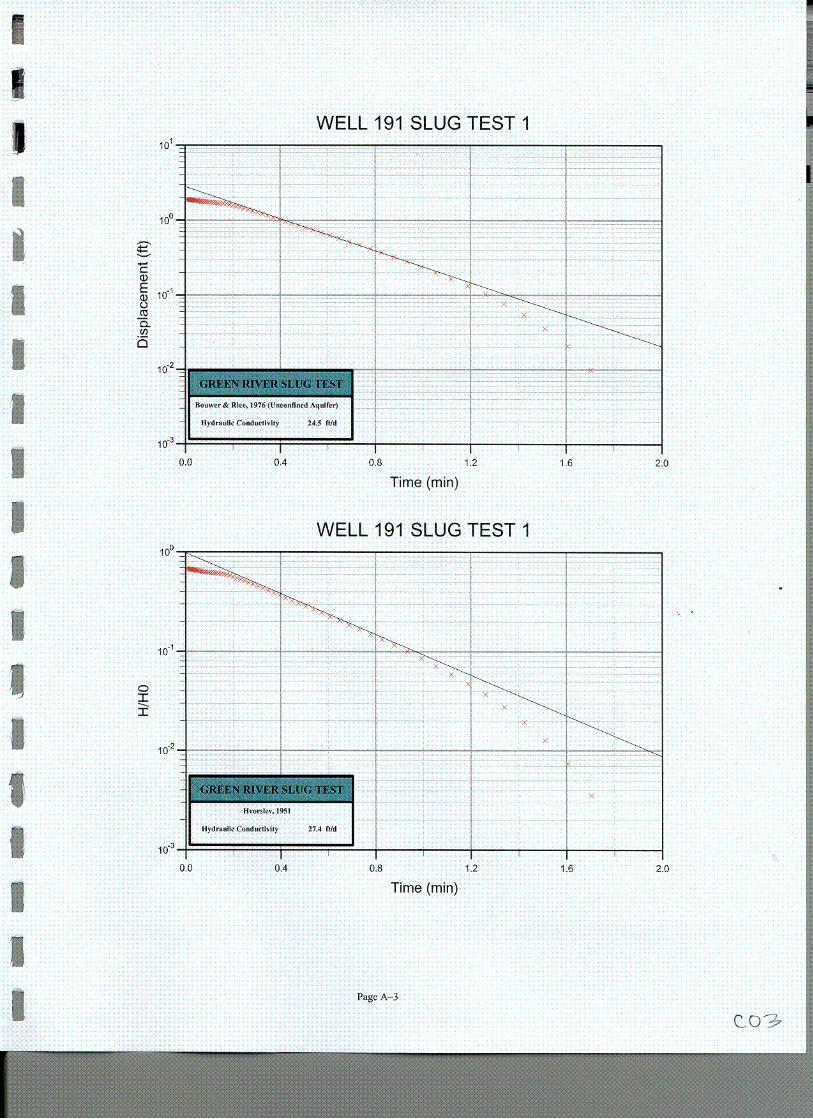
Drawdown data from observation well 0172 resulted in a plot representative of either a delayed yield response or a dual porosity medium (i.e., fracture flow). Field conditions observed in the sandstone suggested the response was caused by dual porosity phenomena.
A number of simplifying assumptions weremade so that drawdown data in well 0181 could be used to estimate the aquifer parameters. These assumptions include:
0 The well is pumped at a constant rate. (The pump discharge during the 52-hour test ranged from 0.95 to 1.04 gpm, which is assumed to be sufficiently small to have no impact on the test analysis.)
The pumping well filly penetirates the aquifer. (Based on the boring log for well 0181, the sandstone unit is 12.5 ft thick and occurs from 79 to 91.5 ft-bgs. This entire unit is contained within the screened interval. Although this well is considered-full ' penetrating. the actual saturated thickness is subject to interpretation. For the analysis, a saturated thickness of 19 ft was used, which is the average thickness of the sandstone unit in wells 0171, 0172, 0173. 0174, 0175, 0181, and 0813.)
The aquifer is fully confined. (Depth to water measurements are approximately 60 ft bgs, while the screened interval ranges from 77 to 92 ft bgs. The difference between elevations of the water bearing zone and the measured water level suggests the sandstone unit is confined. In addition, the water level response to barometric pressure changes in background wells also suggests that the aquifer is confined.)
" The discharge from the well is derived exclusively from aquifer storage. (The low specific storage estimated from this test is consistent with this assumption.)
" The sandstone aquifer can be represented by a fractured, dual porosity system consisting of low-permeability, primary porosity blocks and high-permeability, secondary porosity fissures. (Analysis of the data collected during this test indicates the dual-porosity model is representative of the aquifer.)
"* The aquifer matrix consists of slab or spherical blocks. (Some required inputs for the Moench Method were not measured during this field investigation; therefore, these inputs were based on previous test analyses. These inputs included the matrix configuration [slab as opposed to spherical blocks], well bore skin [set equal to 0], fracture skin [set between 0.9 and 3.1] and fracture bldck thickness [set equal to 5 ft].)
Table 5 presents results from analysis of the data collected during the two tests. Residual drawdown data measured in well 0181 from both tests were analyzed to estimate aquifer transmissivity. Drawdown measured at observation well 0172 was too small to warrant analysis. Plots associated with the tests are contained in Appendix B.
Page 6

Calculation No.: U0174200
Table 5. Analysis Results for the Cedar Mountain Formation Middle Sandstone Unit Aquifer Tests
Well I Test No. Fracture Parameters Aquifer Matrix Parameters Theis Recovery SK (if/dcay) Ss (ft"s) K (ft/day) Ss (ft1) '[fday) K (ft/day)
0181/1 na na 26 0.14 0181/2 nn na na 3A 0,16 0172/2 2.4 6.9 x 10 0 .5 X 10` 58.9 3.1
Notes: na = not applicable K = Hydraulic Conductivity (based on saturated thickness of 19 ft) Ss = Specific Storage T = Transmissivity
Hydraulic conductivity estimates for aquifer fractures fall within the range estimated from the previous (October 1993) test (0.4 to 13 ft/day). Estimates of fracture specific storage were larger than the high end of the range (9.2 x 10-' to 5.5 x 10(6 ft1) derived for this parameter in the previous test. The aquifer matrix hydraulic conductivity and specific storage estimates were both above the high end of the range calculated by the previous tests (1 x 10.4 to 3.3 x 10' ft/day and 1.8 x 10.5 to 2.0 x 10⁻⁴ fi-', respectively).
Analysis of the residual drawdown data from the pumping well in both tests produces similar transmissivity estimates (from 2.6 to 3.1 ft2/day). However, the result of the residual drawdown data analysis for observation well 0172 indicates the transmissivity is 58.9 ft2/day. The analysis of residual drawdown data produces an estimate of the combined hydraulic conductivity of fractures and matrix, and does not distinguish between fracture and aquifer matrix parameters. On the basis of all estimates of aquifer transmissivity, and using a saturated thickness of 19 ft, the hydraulic conductivity of the middle sandstone unit ranges from 0.14 to 3.1 ft/day.
5.0 Background Monitoring
Water level data collected from well 0813 were used to measure the background fluctuations df the potentiometric surface during the test. This data set is presented as Figure 2, which also presents the barometric pressure fluctuations. As the plot shows, the background ground water level fluctuates approximately 0.2 ft in response to the changes in the barometric pressure.
5• s4
a
I
-W] 813 DE ttW•
Figure 2. Temporal Changes in Barometric Pressure Changes and Well 0813 Water Levels
Page 7

I -__________
Calculation No.: U0174200
6.0 Conclusions / Discussion
6.1 Alluvial Aquifer
The following conclusions can be made based on the data collected from the alluvial aquifer hydrogeologic investigation at the Green River site:
" The saturated thickness of the alluvial aquifer was possibly limited as result of the drought conditions during the investigation.
" Residual drawdown data collected during the short-term aquifer test suggests the transmissivity of the alluvial aquifer is 86.7 ft2/day. Using a saturated thickness of 2 ft, the estimated hydraulic conductivity is 43.4 ft/day.
Analysis of slug test data from well 0191 indicates the hydraulic conductivity of the alluvium ranges from 22.4 to 29.6 ft/day.
The hydraulic conductivity estimate based on drawdown data from well 0191 is the largest of all hydraulic conductivity estimates for the alluvial aquifer. During development of other wells screened within the alluvial aquifer, it was estimated that these wells have sustainable pumping rates ranging from 0.0016 to 0.035 gpm. The weathered Mancos Shale unit underlying the alluvium at well 0191 may be the main contributor of ground water flow into the well. Approximately 2 ft of the screened interval for this well is within this weathered zone.
6.2 Cedar Mountain Formation Middle Sandstone Unit Aquifer
The following summary and conclusions are derived from data collected during the Cedar Mountain Formation aquifer hydrogeologic investigation at the Green River site:
"* The field conditions and the plot of the drawdown data collected from observation well 0172 suggested the response to pumping from well 0181 was caused by dual porosity phenomena. As a result, all data were analyzed using the Moench Method for a fractured, dual porosity medium, with hydraulic conductivity estimates based on a saturated thickness of 19 ft.
/ " Data from only one observation well (0172) were analyzed due to the limited drawdown
measured in other observation wells. The resulting estimated hydraulic conductivity of the fractures was 2.4 ft/day, which is within the range established during the previous test. The fracture specific storage was estimated to be 6.9 x 1 0 -4 ft1, which is above the high end of the range established during the previous testing.
" Based on the drawdown measured in well 0172 the estimated hydraulic conductivity of the sandstone matrix was 9.0 x 10.2 ft/day; the estimated matrix specific storage was 3.5 x 10⁻² ft'. Both of these estimates were above the high ends of the ranges estimated for these parameters during the previous testing.
Page 8

Calculation No.: U0174200
The estimated hydraulic conductivity of the fractures was significantly larger than the estimated hydraulic conductivity of the matrix, whereas the estimated specific storage of the matrix was significantly larger than the estimated specific storage of the fractures. Such a response is typically encountered in an aquifer associated with fractured, dual porosity media.
Analyses of recovery data indicated the combined hydraulic conductivity of the fractures and matrix ranged from 0.14 to 3.1 ft/day.
The sustainable pumping rate for well 0181 is 1 gpm, whereas a pumping rate of 4 gpm was sustained in well 0173 during the previous test completed in October 1993. This difference in the flow rates may explain the difference between analysis results from the two tests. It is possible the fracture system in the vicinity of well 0173 is more extensive and/or more conductive than the fracture system associated with well 0181.
Page 9

Calculation No.: U0174200
End of current text
Page 10

Appendix A
Browns Wash (Alluvial Aquifer) Slug and Aquifer Test Plots
WELL 191 SLUG TEST 1101
-n
O• 10"-%
ca
t02
Bo0w. r & R OAe, 1976 (Unoenfnt AquIror} Ilydraulle Conductivit y a4,5 hid
10-" I
0.0 0.4
>1
-. I0,8 1.2 16
Time (min)
WELL 191 SLUG TEST 1
00 OA 0.8 12 1.6
Time (min)
Page A 3
2,0
10O
C I ±
2.0
c 0O-3

WELL 191 SLUG TEST 1
io 10o 10 101
2KIt/(In(Re/rw)rwA2)102
Page A-
I ! I1 I I I I
I I I I
C•-,
C I I

Document Number U0174000
340 330
350 0 1020
30
320 40
310
300
290.
280
270
50
60
70
80
3 6 9 12 15 1890
260
250.
100
110
240 120
230 130
210
220
Explanation 6 Number of Orientation Measurements
M :IW•O 1 G~O~Og9Uc o01735EU01735C}DWG O9A19IO2 1109am WhiM HyJ
200 190 180
Figure 5-6. Orientation of Fracturing and Joints at the Green River Site
ccDOEAGrand Junction Office September 2002
Final Site Observational Work Plnn reen River, Utah Page5 II1
140
150160
170
Conceptual Site Model

Document Number U0174000
Final Site Observational Work Plan-Green River Site P.ge5 14
a m
160 .0)
CO(O
DO2 Gar hutin ff
I-nl,,20
Conceptual Site Model

Appendix B
Cedar Mountain Formation (Middle Sandstone Unit) Aquifer Test Plots

WELL 181 AQ REC TEST 1
10 101 102 10
Time, tUt'
WELL 181 AQ REC TEST 2
101 10n
Time, Vt
Page B 3
coY'
0 -n
2 n 'U -a 0, 0)
Io4
C
0
-e
C
-n to 0)
ioý ios loý
!OBS WELL 172 AQ TEST 2
10 10. 101 102
td/rdA2
WELL 172 AQ REC TEST 2
l0o 101 102 i10 o
Time, t/t'
Page BA
10l
I I
I
I! ii II
c0o9 I
le6
-o -c
C
0
-o
C
0 0, a)

Appendix G
Ecological Risk Assessment
, Appendix G
. =--- 1.0 EcologicalRisk Assessment
This Appendix supplements and provides details to Section 6.2.2 of the document. Some
information within the text of the document has also been included in thisAppendix to
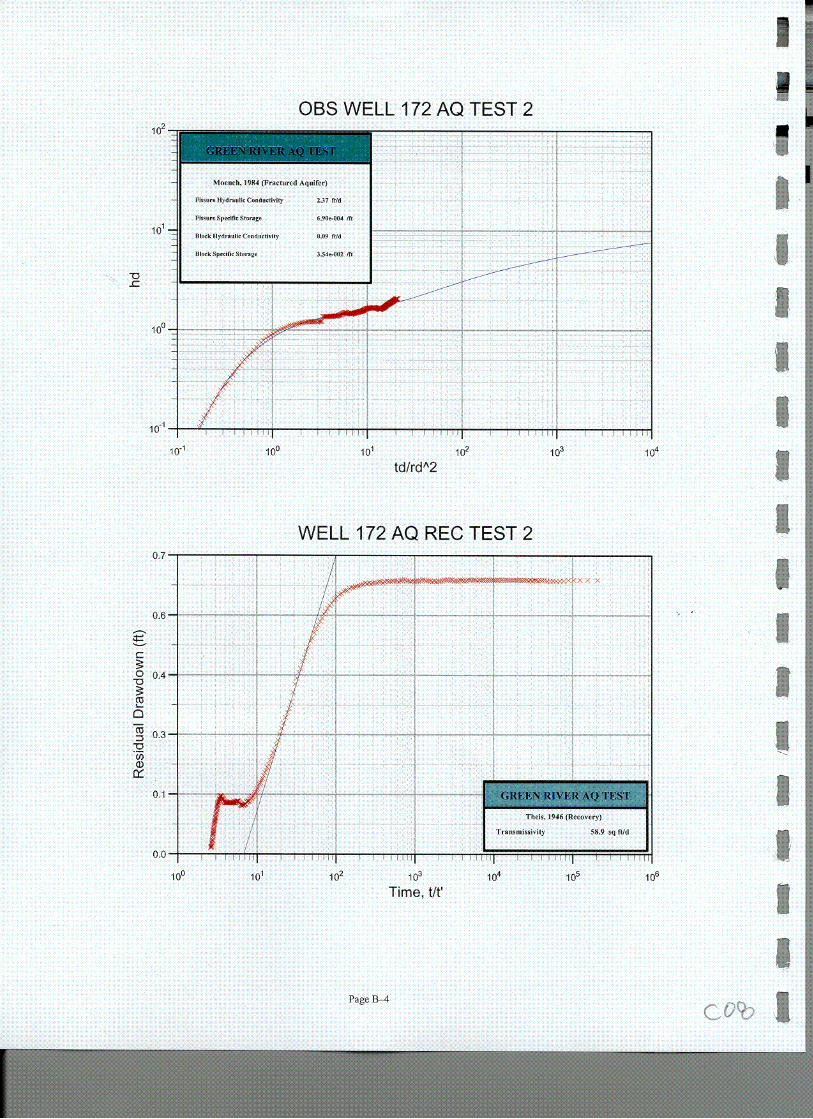
accurately reflect context. As shown in Figure 1, ihe franie•,vork of the co16-i&al risk assessment
(ERA) contains three main components: (1) problem formulation, (2) analysis, and (3) risk'
characterization. The overall goal of the problem formulation is to "set the stage" foi the analysis and risk characterization phases of the process. In the problem formulation, the need for a risk assessment is identified and the scope of the problem is defined. Available data are evaluated to
identify potential stressors (in this case, the potential stressors are ecological constituents of
potential concern [E-COPCs] associated with the ground water at the Green River processinig site), key ecological receptors, and potential exposure pathways linking the receptors to thel
stressors. This information is used to develop a site conceptual model and risk hypotheses. Finally, assessment and measurement endpoints are definied for the specific determination of risk
to these receptors and the environmental resources they represent. These endpoints are directly tied to overall management goals for the site.
The analysis phase of theERA includes two concurrent steps-the exposure assessment and the effects characterization. In the exposure assessment, the potential for each receptor to be exposed
to each stressor is evaluated and,-where possible, quantified. The effects characterization describes the potential for the stressor to adversely affect the receptors that ale exposed to ii. Because the stressors at the Green River site are chemical in'nature, the principal effects to
ecological receptors will be toxicological; however, they may also include physical effects, such
as those related to radiation.
The risk characterization phase evaluates (either qualitatively or quantitatively) the combined results of the exposure assessment and effects characterization to determine the potential for risk to the receptors due to their exposure to the stressors. A critical aspect of the' risk characterization is the analysis of uncertainties associated with predictiohs of potential risk. Typically, uncertainties result from data gaps, which necessitate the incorporation of assumptions into the analysis and risk characterization phases. In general, these assumptions are conservatively biased toward results that will lead to overestimations rather than underestimations of risk. The uncertainty analysis provides an analysis of these assumptions in terms of their potential for introducing significant bias in the risk estimation.
As described in the U.S. Environmental Protection Agency.(EPA) guidance (EPA 1998), ERA is an iterative process in which the evaluation of potential risks to ecological receptors is refined as
additional data are collected to fill data gaps and reduce uficertainties. At the' conclusion of each iteration (or "tier") in the process, decisions are made as to whether sufficient data have been collected and analyzed to proceed with risk management actions (if required), or whether ,
additional data should be collected. Such a tiered approach to the process was initiated at the Green River site in 1995 by the performance of the screening-level baseline risk assessment (BLRA) (DOE 1995)...
DOE/Grand Junction Office Final Site Observational Work Plan-Green River, Utah
September 2002 Page G-I

Document Number UO 174000
GREEN RIVER ECOLOGICAL RISK ASSESSMENT MODEL
PROBLEM FORMULATION
BLRA
CHARACTERIZATION ACTIVITIES WORK PLAN
E\aluate historical data Conduct constituent of potential concern (COPC) screening Preliminary identification of potential exposure pathuays and food sebs Preliminary selection of receptors Ddvelop initial site conceptual model Conduct screening-lesel risk assessment
Define work plan scope and objectives * Deelop management goals, assessment endpoints, and measures * Deelop data quality objectites (DQOs) for the field sampling * De-,elop field sampling and analysis strategy
-Select appropriate reference areas -Select sampling locations
Refine food % eb, site conceptual model, and ecological receptors
Conduct aquatic and terrestrial field sampling and analysis Conduct vegetation characterization and mapping
ANALYSIS
Characterization of Exposure & Ecological Effects
BLRA UPDATE
Statistically evaluate 1995 - 2002 sample data betw een location and reference areas for significant differences Compare maximum site COPC concentrations against ecological screening criteria
Ifdeemed necessary tbllo%& ing evaluation of ecological data Prepare exposure profiles Prepare toxicity assessment Prepare ecological response analysis De% elop exposure and ecological effects analysis
See note below
RISK CH 4.R.CTERIZATION
Risk Estimation - Calculate hazard quotients (ltQs) and hazard indices (Ills) * Evaluate lines ofe% idence
BLRA UPDAT'E Risk Description * Ecological nsk summary * Interpretation ofecological significance
Uncertainty Analysts
Note: If data c% aluation mdcates no significant differences bet%% een the Green River site and' reference areas, or unacceptable ecological risk appears unlikely based on screening criteria. quantitative risk assessment calculations %%ill not be performed.
Figure 1. Ecological Risk Model for the Green River Site
Final Site Observational Work Plan-Green River, Utah Page G-2
DOE'Grand Junction Office September 2002
Green R.c,¢.ERA ppr
Reý 12111
-j
Appendix G
I
t .,,d
I"

fl-,m-n Nu~mber UO 1i74000 AediG
Subsequently, additional data was c6llected from key environmental miedia. The ERA incorporates these new data as a refinement and update of the screening-level assessment . presented inthe BLRA. Additional ,samplifig of giound water and surface •7vater (from Browns Wash and the Green River) and sediments for chemical analysis was conducted between 1994 and 2002.
2.0 Problem Formulation
The problemnfoi'mulation phase' in this risk'assessnrfient is'represefited in part by the information presenied in the' BLRA (DOE 1995). The BLRA ',vhs b'bsed on analytical data colle'ýted'at the Green River site pri6i't6 1995' These data wer6 reV;ievwed to determine if coinceritrations of analy'tes in'ground \vater;,surface water, and sediment may pose a 'p6tential ecological'risk." Informatiofi on ttie'ge'ologic setting, grounid water hydrology, geochemistry€ and habitats of the site wer'e incorporated in the BLRA'evaluation. Priiiciphl results of the BLRA included an ifiitial screening of chemical anflytes as E-1COPCs-and an' assessment of potential risk to biota, including livestock and i-rigated crops. The ass'essineiit of potential iisk, however,' was primarily qualitative. The BLRA provided, in part, a basis for the preparation of this work plan. Sincethý completion of the BLRA, additional ground water and surface water samples were collected. These new analytical data are incltuded in this tipd~ite."
Potentially Affected Habitats and Poptlation
The Green River processing-site is highly disturbed from past-use and subsequent remediation actibities'. These disturbed areas were revegetated with selected seed-although vegetation has not be-ensignificantly'reestablished (DOE 1995). Areas adjacent to-the millsite are a mix of agricultfral, raiiching, and limited indtistrial activity. Due to the •ite's arid enivirofiife-nt arid
proximity to-the city-of Green River, flora and fauna species diversityis sbi'ri-liat liri-ited. The exceptions are the riparian zones along Browns Wash and the Green River o the north n-ad -vest of the site, respectively. Along Browns Wash and the Green River, the habitat is a mix of riparian species dominated by tamarisk, cottonwoods, and willow. The-'arid areas-are. characterized as a salt desert scrub community dominated by shadscale, saltbush, greasewood, and rabbitbrush (DOE 1988). Although Browns Wash was evaluated in the BLRA as a potential surface water medium, it is an ephemeral stream with very limited chpability for supporting an aquatic ecosystem. The exception is the mouth of Browns Wash where it empties into the Green River. This area could be considered a backwater of the Green River because of the presence of water most of the year. Its ecological significance, if any, was not discussed in the BLRA.
Few species of wildlife have been observed at the site because of the proximity to Interstate Highway 70 and other human activities. The environmental assessment (EA) lists 34 species of mammals, 18 species of raptors, 51 species of nongame birds, 23 species of reptiles, seven species of amphibians and 14 species of fish that could occur in the vicinity of the site (DOE 1988). There is no reason to believe that the species diversity has changed since the time the EA was written.
The EA also identified six endangered wildlife species protected under the Endangered Species Act as potentially occurring in the vicinity of the site. The species are the peregrine falcon (Falco peregrinus), bald eagle (Haliaeetus leucociphalus), black-footed ferret (Mustela nigripes),
DOE/Grand Junction Office Final Site Obsertational Work Plan-Green River, Utah
September 2002 Page G-3
;Anntendix G13not•m•nt N•lmh•r 1 fill 74flfll•

Appendix G Document Number UO0174000
Colorado pikeminnow (Ptychocheilis lucius), bonytail chub (Gila elegans), and humpback chub (Gila cypha). The razorback sucker was mentioned briefly, but dismissed as not potentially -occurring in the Green River area. Of the remaining species;, the peregrine falcon has since been delisted, and the black-footed ferret, humpback, and bonytail chubs are not believed to currently inhabit the site area. Therefore,, the Colorado pikeminnow and bald eagle are the only endangered species that will be considered further in this assessment.
Summary of the 1995 Ecological Risk Assessment Results
As a starting point for identifying E-COPCs for the 1995 BLRA, the data used were from locations where some ground water constituents were either detected in concentrations statistically elevated above the background (upgradient) concentrations or were detected in at least one sampleand insufficient data were available for a statistical comparison in that medium. Analytical data from surface water and sediment samples from Browns Wash and the Green River were also evaluated for E-COPCs based on comparisons of maximum detected concentrations to background (upstream) data, when available. The BLRA initially identified 20 ground-water-based constituents (Table 1) as possible E-COPCs for further screening and evaluation. Table 2 summarizes those E-COPCs that exceeded media standards or risk guidelines.
Table 1. Possible E-COPCs Based on the BLRA
-I
-I
-J
Final Site Observational Work Plan--Green River, Utah Page G-4
Constituents for Which Water Quality Constituents for Which Water Quality Criteria or Guidelines were Available Criteria or Guidelines were Not Available
Aluminum Ammonium Arsenic - - Calcium
Cadmium Magnesium Chloride Potassium
'Iron -'Radium-226
Manganese; ' - Sodium Molybdenum Sulfate
Nickel Vanadium Nitrate
Selenium Uranium
Zinc ,"_,,
DOE/Grand Junction Office September 2002

Table 2. Summary of Ecological COPCs in Ground Water, Surface Water, and Sediments that Exceeded Water Quahlty Cnteria or Risk Guidelines
t AConstituents Exceeding. Constituents Exceeding Constituents Above CriterialGuidelines in Green River Criteria/Guidelines in Browns
Background in Ground Surface WaterlSedimentsb Wash Surface WaterlSedimentsb Water'aSraeWtr~dmns _______________
Water - - -Sediments, ' Water Sediments
Aluminum 'No ' ; '- ,'NS' ., "No - No.
Ammonium No ' NS - NA°- .- No
Arsenic No NS No No
Cadmium - 'No 'NS -Yes,-- 'r -,Yes .
Calcium ,No- ' ' NS' ' NA 'No
Chloride "s" "- 'No - '' NS -• Yes :- ... No '"
Iron - ' 'No ý • NS:., • Yes . .... No
Magnesium' ' , No NS "' NA'-A'.' No
Manganese - " No ' , 'NS ',Yesw . No
Molybdenum ' No " NS --No , No'
Nickel ' No ' -NS .. No ' ,No
Nitrate " ' '' No , NS '' Yes '. " '"No
Potassium- ' , No - -- NS 'NA .... ,No
Radium-226 " ' No f NS , NA .,. No'.
Selenium "" '- ,- No "' '- NS ' Yes ' Yes
Sodium , No • .... NS :.., NA' No'
Sulfate No 'NS -' Yes : ', . No'
Uranium No NS Yes Yes
Vanadium No NS NA No
Zinc No NS No No
"aGround water constituents with concentrations that exceeded background Cedar Mountain Formation ground water
was used as background.-. . ,- , :, '
bGround water constituents with concentrations that exceeded background concentrations (upgradient of the site) in surface water, sedarfient, or the median are indicated by a Yes or No "
NA = Not assessed due to lack' of criteria 'or guidelines. "-NS =Not sampled or results not included in the BLRA. ' ' ', ' .
(DOE 1995)
Browns Wash
Location 0711 was used as the background surface waterjocation and was sampled in 1982,
1989, and 1993 during periods tof rioff assodiated with rainstorms. However, the BLRA points
out that using location 0711 as a true background location is questionable because water was not
present Ef this location in tier years due to the epjiemeral nature bf the wash: Therefore, ground water in the Cedar Mountain Formation was used 'as baclkgrou•nd f6or' 'urface water. Downgradient locations 0709, 0710, 0718, and 0526 were sampled intermittently between 1982
and 1993 in areds of exp'oied becdrock when standing'pools of waiter were present: On the basis of
thd data ea.luated, the BLR'states that "based on' chem'ical don'entrations in surfac'e water at these locatioh's, it is likely that at least some ofithe Surfadew-aite c" nt arinatio".:.6ri'ginates from ground water at' the site." The BLRA also states ihat the elevated concen'trationscould be attributied to storm water runoff or contaminated soils/sediments.' However, based on a review of
weather data, storm w&ai'r is eliminated to some extent as"the possible source of contamination.
DOE/Grand Junction Office September 2002
Final Site Observational Work Plan-Green River, Utah Page G-5
Appendix G
Concentrations of the 20 grou'nd water-based constituents were compared to federal or state water quality criteria or guidelines. Eight of the 20 constituents had no criteria or guidelines available. Of the eight, sulfate was retained for evaluation because limited data existed showing that livestock could be ad-Versely affected by elevated concentrations.
In Browns Wash, concentrations 'of five constituents (alumiftium, arsenic, molybdenum, nickel, zinc) did not exceed surfacewvater guidelines or criteria. Eight constituents, including sulfate, had concentrations that exceeded guidelines or criteria.
Sediment samples were collected from six locations in Browns Wash (Table 2) during a single sampling event in 1993. Sampling locaiions 0711 (backgrounid sahdy substrate), 0526, 0709, and 0710 were dry; samples-taken from lo-6-ations 0717 and 0718-iede wet. No true sediment background location was identified due to the ephemeral natufe'of Browns Wash. Additional sampling was completed at locations 0718 and 0720 in 1994 and 1995. It is unclear to what extent the 1994 and 1995 sampling was considered in the BLRA. It appears most of the conclusions drawn were based on the 1993 sampling event. No information is provided in- the BLRA as to what constituents wer'e-analyzed in sediments, oi" which had criteria or guidelines " available. However, caidmium-, selenium, and uranium were ideritified-as E-COPCs in BrownsWash sediments. Cadmium was selected because the concehnffation exceeded the lowest observed effect level at one location (0718) and is known to bioaccumulate iii plants. Selenium was also retained due to its ability to bioconcentrate. Uranium -vas selected due to the possibility that it could be transported up the food chain. Section 7.4.1 of the BLRA (DOE 1995) provides detailed rationale as to why these constituents were selected.
Green River
Surface water samples were collected at two locations between 1984 and 1992 and again in -
2002. Location 0801 served as the background (upstream) and 0802 as the location downstream of Browns Wash. Location 0846 was established (2002) at the confluence of Browns Wash with the Green River. Table 3.6 of the BLRA (DOE 1995) details the 36 constituents and frequency. for surface water sampling in the Green River. Sampling indicated that millsite constituents were undetectable in the Green River and, therefore, were not retained as E-COPCs. Sediments-were sampled during a single sampling event in 1994, prior to completion of the BLRA.
3.0 BLRA Risk Summary
The BLRA further evaluated the E-COPCs to determine the significance or degree of risk. Table 3 summarizes the final list of E-COPCs (by media) described in the BLRA.
Cadmium was retained as an E-COPC in sediments due to tle potential to bioaccumulate. However, it was only detected in Ione alluvial well and has not been detected in surface water since 1990. Although chloride conceniration was elevated in' ground'water and surface water' (standing pools), the significance and degree of effect was considerdd minimal due to the ephemeral nature of Brovins Wash. Iron concentration was elevated in ground water, but iro6n' was eliminated due to its low potential to contaminate surface water and sediments. Manfganese
Final Site Observational Work Plan-Green River. Utah Page G-6
DOE/Grand Junction Office September 2002
Document Number U0 174000---Ativendix G

- Table 3.-BLRA Final List of E-COPCs
Constituent Ground Water Surface Water Sediments Comment No Yes Bioaccumulates, and exceeded
Cadmium - No oYLOAEL at location 0718
.. _ -. Chloride exceeds water quality -standards at more than one standing Chloride Yes -Yes ,ND
e- N pool surface location in Browns S.. . . , - . . . . . . .. . .. . .. . . . .. . , .... .W a s h .- - - - . . . . . . . .
Exceeds aquatic water quality
Iron Yes No .. ND -standards in Cedar Mountain . - " - Formation
Exceeds'aquatic water quality_
Manganese Yes No ND standards in Cedar Mountain , FormationHigh concentration in aquifer and in
Nitrate, Yes Y- Yes ND standin 5bolswhen present. S-.Bioconcentrates. Elevated in pools in
Selenium - Yes -Yes Yes Browns Wash when water was ,r_ _ -present.
Could be transported up the food Uranium - - -No No - - -Yes - chain through vegetation to
"" - ' -" '" - ____________ livestock/wildlife i
LOAEL = lowest-observed-adverse-effect level .
ND not detected ......
-was included on the basis of its'elevated concentrations in ground water and potential for risk if I terrestrial or aquatic organisms were exposed to grbund water. Nitrate concentration was
elevated in :round water and surface water and could pose risk to terrestrial or aquatic " organislmI's. Selenium concentrations indicated risk to terrestrial and aquittic receptors in all three media: Uiranium was included due to'the potential f6r plant uptake in sediments and
- transportation up the fobd chain; however, risk wasnot determined in the BLRA.
Although limited media-specific benchmark--alues and receptor-specific toxicity information were available, the results of the screening ERA pr'es-ented in the BLRA indicated that thee potential for overall risk to ecological receptors at the Green River site is probably low.
For purposes of current risk assessment, ground water (Table 4) and surface water collected subsequent to completion of the BLRA. are used to reevaluate the list of E-COPCs and to further assess these constituents'for potential ecological riskat the Green River site. This update to the BLRA; focuses on data collected from 1995 through 2002. For~purposes ofthis assessment, soils and air are not considered contaminated media due to completion of surface remediation prior to the BLRA.
An important aspect of risk assessment is determining the locations considered most relevant to
ecological risk. The BLRA di§&ussed ecological risks associated with ground water if it were
brought to the surface'(ie.; stock pond)2 The BLRA also discussed risks associated with the
Green River and Br6owns Wash suiface water.,However, it focused considerable attention.on
Browns Wash as an ecological community due to its proximity to'ground water and its potential
- to serve as a point of exposure for aqiuatic receptors.-Because of the ephemeral nature of Browns
Wash and its limited potential to support an" aquatic community, the upper reaches of the wash
will not be evaliated as an aquatic community for purposes of this update. However, the pooled
area at the mouth of the wash, where it empties into the Green River, is considered a viable
aquatic community and will be assessed as such. Therefore, the only relevant surface water data
DOE/Grand Junction Office - Final Site Observational Work Plan--Green River. Utah September 2002 Page G-7
Appendix G

Apt~endix G Document Number UO 174000
Table 4. Summary of Preliminary Ecological COPCs in Ground Water (Uppermost Aquifer) at the Green River Site Based on Sampling Data from 1995 through 2002
Consitue~t IMaxium' - •'E-COPC?Constituent Maximum Concentration in Ground Water (Site) Reason
Nonradionuclide Inorganic Analytes (mg/L) Sample - Concentration Location FOD Dates __
Aluminum 95 0 22 0172 1126 " No' Based on FOD and histoncally low concentrations
Ammoniuma 95 0.67 0174 15124 Yes Exceeds background range Arsenica 95196/98-02 0.186 - 0813 221156 - Yes-- Exceeds background range
Cadmium 95198-02 0.0033 0172 1/146 No Based on FOD and historically low concentrations.
Calcium 95-02 A- 521 0176 162/162 No Essential nutrient Chloride8 95-02 1290 _ 0583 162/162 Yes Exceeds background range
- Exceeds background range Iron' 95/96 - 4.6 0813 9117 Yes and is elevated above BLRA
._ concentrations Magnesium 95-02 " 419 0176 152/152 No Essential nutrient Manganese' 95-02 0.936 0813 1111152 Yes Exceeds background range Molybdenum' 95-02 0.08 0177 591162 Yes Exceeds background range Nickel 95 ND --- 0/24 No Not detected . 11 Nitratea 95-02 1650 0172 65/211 Yes Exceeds background range Potassium 95-02 . 42 2- 0176 ,162/162 No Essential nutrient, Selenium8 95-02 0.849 - 0176 76/211 Yes Exceeds background range Sodium 95-02 3740 .. ... 0172 162/162 No. Essential nutrient Sulfatea 95-02. 8510 0172, 200/200 Yes Exceeds background range Uraniuma 95-02- 0.198 0179 130/211, , Yes . Exceeds background range Vanadium 95-02, ND --- 0/152 No Not detected
Zinc 95 ND 0/12 No Not detected Radionuclides (pCilL)
Radium-226a 95197-01 2.65 0813 97/116 Yes' Exceeds background range aConstituent was retained as a ground water E-COPC FOD = frequency of detection ND = not detected
in Browns Wash is that collected at locations 0526, 0846, and 0847: These sampling locations are within or at the mouth of Browns Wash, which could be considered a backwater to the Green River. Both surface water locations in the Green River (0801 and 0802) will be retained for purposes of this assessment.,
Further review of sediment data indicates that the value of these data in assessing potential risks to benthic organisms in Browns Wash is questionable. Prior to the BLRA, it was suspected that ground water may have been surfacing in the form of seeps into Browns Wash. However, attempts to collect sediment data in the past have typically resulted in collecting samples, from dry locations where there are no benthic organisms. Recent (2001 and 2002) inspections of the site also found no evidence of seeps, and ground water, therefore, has limited potential to , influence, Browns Wash sediments. With, the exception of location 0526, sediment sampling data at 'other Browns Wash locations will not be assessed due to limited potential for ecological risk. In the Green River, relevance of sediment data for locations 0801 and 0802 will be evaluated.
Final Site Observational Work Plan-Green River, Utah 'Page G-8
-J
-J
DOE•Grand Junction Oftice September 2002
An analyte was identified asan E-COPC if its maximum detected concentration exceeded historical background concentrations (the corresponding upgradient data:set).,This is due to the lack of current background data. Constituents that are consider&d to be essential nutrients(calcium, magnesium, potassium, and sodium) are excluded as E-COPCs. Sulfate and chloride are anions of low potential -toxicity in biota. However, because chloride has a State of Utah water quality standard for the&Green River, and toxicity data exist for sulfate, they have been retained for consideration as E-COPCs. Despite the relatively low toxicities of these anions and-cations,it is recognized that at high concentrations in water the•, can contribute to adverse ecological effects due to high osmotic potentials, and some can affect the use of water by wildlife and livestock by imparting strong'tastes to the water. These types of effects, however, are not addressed ,in this risk assessment."'
Aluminum and cadmium were'eliminated based on'low frequency of detection (FOD). Nickel, vanadium, and zinc also were eliminated because they have not-beeti-detected sirice completion, of the BLRA. Therefore, 11 constituents are retained for further assessment. To determine if , -. downgradient concentrations of these COPCs may present risk or may be'influencing the lower sections of Browns-Wash (inthe vicinity of surface locatiofis 0526 and 0846), the concentrations of these constituents were compared to those at downgradient ground watei" locations 0583 and 0810. On the basis of comparison, it appears'that downgradient'giound water in the uppermost aquifer is not being affected by nitrate and'selenium and is only slightly affected (if at all) by arsenic, manganese, molybdenum, and uranium. However sulfate and radium-226 concentrations at locations 0583 ahd 0810-do show mill-related influence. Ammonium'and iron were not sampled at these locations fromi 1995-2002. Surfacie wt6tr*dl'ita` fr6m locations 0526, 0801, 0802, 0846, and 0847 were considered most relevant for purposes of this ERA update.
A constituent 'was considered an E-COPC if its m!aximum detected concentration exceeded the' __ ig...... Green R er location (0801). It is maximum concentration from the upstream (background) Green i_"R - 'o n "I assumed that aluminum, ammonium, iron, and zinc_'were not sampled after 1994 due to low concentration's, low FOD, or they were not detected in subsequent ground water and surface water sampling.'Of the 10 remaining constituents;,arsenic, molybdenum, -selenium, and ... vanadium were not detected in 2000-2001 sanipling at location 0526. Chloride, manganesIe,-, 7
nitrate,-and uranium concentrations are below background (location 0801) and are well below the applicable surface-water standards or guidelines: Sulfate concentration- is below the seconrdary drinking w-ater'stahdaid (250 -milligrams per liter [mg/L])-and well below the threshold for .toxicity to'-ivestock (1,500-2,000 nig/L).-Rddiiim.226 c6ncenitration-is below-the Utah water-_quality standard an-d is-h6fc-n6-sidei~d -a fisk"ini-sfiffa-ce' ,vat&PteTh&iefofether-e appears t6 be norisk to surface water as a r6sultof mill-relatd c t6-s_6ients.
-- < ' C,• €" , -' I,'
Because no'additional sediment sampling has taken place at the Green River site since the 1993 samples'that were reported in theBLRA (DOE -1995), the data used to evaluate E-COPCs for sediment are unchanged from those of the BLRA. The concentrations from sample location 0526 are considered most relevant. A's stated in the BLRA summary above,-three constituents -.
-(cadmium, selenium, and uIranium) were detected in the Sediments of-the site at cohcentrations I I
that could pose potential ecological risk.-Due to the lack of data aftert 195 it is recommended that chloride, iron, manganese, and sulfate also be included for further analysisin sediments. These analytes constitute the sediment E-COPCs for purposes of the draft'ite observational work plan. , - - -
DOE/Grand Junction Office Stptember 2002
Final Site Observational Work Plan-Green River. Utah SPage G-9
,Appendix G

In July 2002, additional surface water samples were collected from two locations near the mouth of Browns Wash. Sampling location 0846 was at the confluence of Browns Wash and the Green River and sampling location 0847 was approximately 300 feet upstream of the confluence on Browns Wash. These locations represent the wetland and aquatic habitats of the mouth of Browns Wash, where the channel of the wash creates a backwater, inlet along the Green River. This inlet is potentially important habitat for fish, possibly including the Colorado pikeminnow. Concurrently with these sainples; a surface water sample was collected at the upstream (background) location on the Green River (location 0801).
Maximum concentrations of the nonradiological analytes measured at the two locations at the mouth of Browns Wash were compared to the measured concentrations from the Green River background location. Twelve of the 16 analytes at the mouth of Browns Wash exceeded the background location concentration for at least one of the two locations, indicating the possibility that they are influenced by the millsite. Two of these, however, (cadmium and strontium) were close enough to the background concentration that they considered not significantly elevated above background. In~the'case of strontium, the sample exceeding background was from the confluence, while the upstream Sample was less than background. Four of the analytes were essential nutrients (calcium, magnesium, potassium, and sodium):;The remaining seven analytes (Table 5) were identified, and E-COPCs for this wetland area and are further evaluated for, potential risk to aquatic, wetland, and terrestrial receptors.
Table 5. Nonradiological Constituents Retained for Risk Evaluation in the Surface Water at the Mouth of Browns Wash Based on Sampling Data from July 2002
Concentration in Surface Water (mglL) Constituent Maximum of Locations Green River E-COPC? Reason
0846 and 0847a Background ____________ 0 a 0, Location b_,_ ,
Arsenic -0.0014, 0.00093 . Yes Exceeds background range
Cadmium 0.00057 0 00056 No Considered not significantly greater than background
Calcium 47.9-- 47 2 No Essential nutrient Chloride 33.5 30.9 Yes Exceeds background range Fluoride 0 218 0 219 No' Within background range'
Magnesium j 26.2 25.9 No Essential nutrient Manganese 0.0398 0 0034 Yes Exceeds background range
Molybdenum 0.0055 0.0040 ,Yes Exceeds background range Nitrate 0.203 ,1 0.0506 Yes- Exceeds background range Potassium 3.38 3 40 . No Essential nutrient Selenium 0.0011 000077 Yes Exceeds background range Sodium 75.7- 71.4 No Essential nutrient
Strontium 0.618 0603 No Considered not significantly,, _greater than background0
Sulfate 193 181 Yes Exceeds background range Uranium 0.0029 0 0029 No Within background range Vanadium 0.0024 0 0024 'No Within background range
"4Location 0846 is at the confluence of Browns Wash and the Green River, location 0847 is approximately 300 feet upstream of the confluence on Browns Wash. % ". ,I . "The Green River background location is at location 0801.. 'The maxinium concentration for strontiuni was from the confluence with the Green River. BecaUse this concentrationexce~de'd'the background concentration by only 3 percent, and the concentration in the sample from 300 feet upstream of the confluence on Browns Wash (0.532 mg/L) was significantly less than the background concentration, it was determined that strontium at the mouth of Browns Wash is not significantly greater than background. Bold text indicates value exceeds the background concentration.
Final Site Observational Work Plan-Green River, Utah DOEIGrand Junction Office Page G- 10 September 2002
-4
-J
Appendix G Document Number U0 174000

4.0 Ecological Conceptual Site Model
The conceptual model for an ERA is developed from information about stressors, predicted exposure pathways, and the potential effects of exposure on ecological receptors. Conceptual models consist of two principal components (EPA 1998): " A set of risk hypotheses that provide descriptions of predicted relationships among stressor,
exposure, and assessment endpoint response, along with the rationale for their selection.
" A diagram that illustrates the relationships presented in the risk hypotheses.
A complete exposure pathway is the mechanism by which a contaminant in an environmental medium (i.e., the source) can contact an ecological receptor. A complete exposure pathway includes:
* Contaminant source. * Release mechanism thitt allows contaminants to become mobile or accessible. "* Transport nfi~chanismnthat moves contaminants away from the release. "* Ecological receptor. "* Route of exposure (e.g., dermal or direct contact, inhalation, or ingestiofi). i
Because the stressors at the Green River site are clhemical contaminants, the risk hypotheses are considered tob'e tfressor-initiated.
As part of the initial problem formulation in the BLRA, a generalized site conceptual model (Figure 2) was developed for the Green River site. That model has since been revised to address current and potential exposure pathways based on all the available data. The movement of contaminated ground water from the mill tailings area is believed to have corrie from the former tailings pile just south of Browns Wash. However, there is currently no evidence that this has continued to occur after 1994. For this reason, risk hypotheses are developed for surface water assuming that ground water does not influence surface water in Browns Wash. In addition, there has been no evidence that ground water is influencing'the Green River., This uncertainty will be addressed in the ongoing investigation.
Risk Hypotheses'Based 6n Cuzrrent Exposure 'Scenarios -' ,
The following are the risk hypotheses proposed for the'site whrier complete exposure pathways to ecological receptors may exist based on the current site conditions. Contaminants in the nearsurface ground water of the site may be taken up by deep roots of phreatophytes. These contaminants may result in phytotoxic effects on the plant or they may be transported to plant " tissues that are accessible to wildlife. If future sampling indicates that aquatic organisms in direct contact with these media:miy be affected 6r bioaccumulation up the food 6hain may occuir, further assessment may be required.'If a'pathway exisis, wildlife could b6 directly exk6bs~d t6 coritaminants through the ingestion of this water and/or the fool items'exliosed to the water and sedimeht andtihe iiicidental ingestion of the ;ediffient.'
DOE/Grand Junction Office Final Site Observational Work Plan-Green River, Utah
September 2002 Page G-I I
Appendix G
Document Number UO 174000
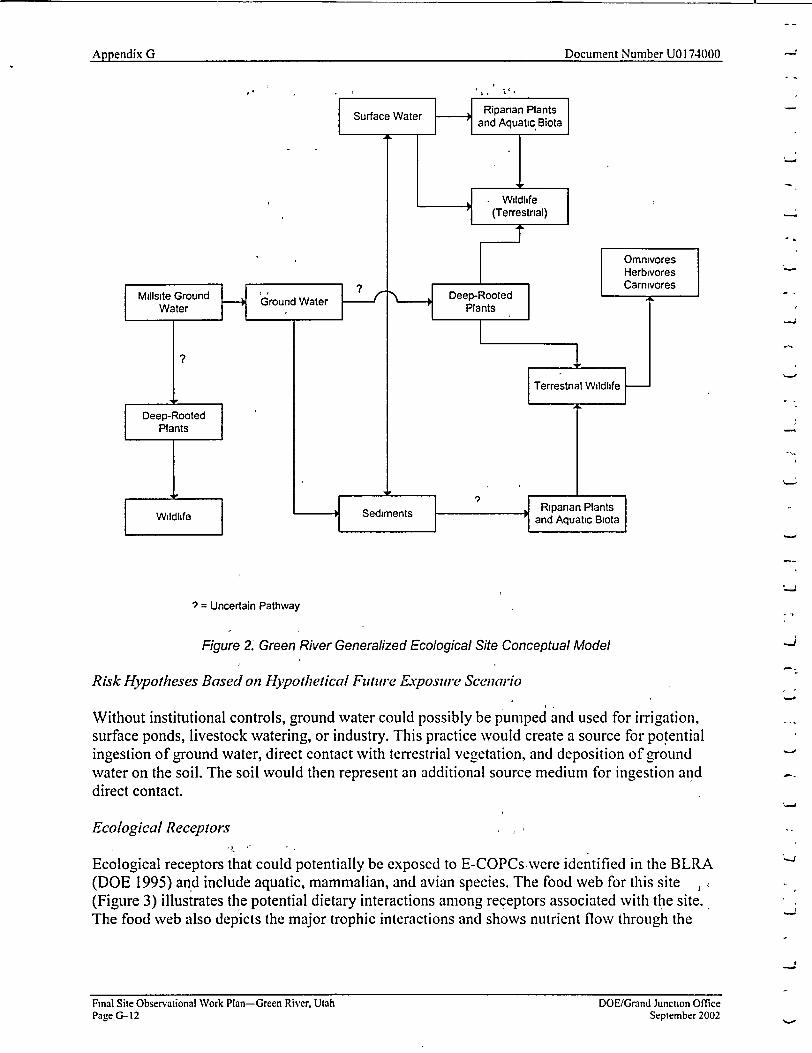
? = Uncertain Pathway
Figure 2. Green River Generalized Ecological Site Conceptual Model
Risk Hypotheses Based on Hypothetical Future Exposure Scenario
Without institutional controls, ground water could possibly be pumped and used for irrigation, surface ponds, livestock watering, or industry. This practice would create a source for potential ingestion of ground water, direct contact with terrestrial vegetation, and deposition of ground water on the soil. The soil would then represent an additional source medium for ingestion and direct contact.
Ecological Receptors
Ecological receptors that could potentially be exposed to E-COPCs.were identified in the BLRA (DOE 1995) and include aquatic, mammalian, and avian species. The food web for this site ,, -, (Figure 3) illustrates the potential dietary interactions among receptors associated with the site. The food web also depicts the major trophic interactions and shows nutrient flow through the
Final Site Observational Work Plan-Green River, Utah Page G- 12
DOE/Grand Junction Office September 2002
Avpendix G

- � v-�" C 7 jr� i:-: 7 UY � (--f F (: ý- ~=- r :--- -•
IV) U
R C) a.J
0
CD :
L)CC;
* *~ LEGEND
"General group'
Receptor as specified in the ecological risk assessment
-to all wetland and terrestrial wildlife species as drinking water . -
- to all wetland wildlife species as incidental sediment ingestion
)- to all terrestrial wildlife species as incdenal soil ingestion
Figure 3. Generalized Food Web for Green River Ecological Receptors
V.
0Z 0
C
C)
:1:1.
C; :2 0-
•J
(y- Fr

Appendix G Document Number UO 174000
trophic levels. This food web model was developed from the species lists and consideration of the exposure pathways. The food web diagram was used to portray potential pathways of ECOPCs from the ground water to biota at various trophic levels, with potential receptor species being identified as having potentially complete ecological exposure pathways. These potential receptors are as follows:
Green River and Browns Wash: The habitat of the river channel is primarily riparian. The potential receptors of these areas include:
" Plants-Wetland and riparian'plants that grow along the channel course in direct contact with water and sediments.
" Aquatic receptors-Aquatic receptors include fish, aquatic invertebrates, and aquatic plants that live in direct contact with water and sediments.
* Wetland wildlife-Wetland wildlife may be exposed to E-COPCs- along the river as a result of drinking surface water and feeding on the aquatic organisms and wetland plants. Potential receptors include insectivorous birds, such as swallows, flycatchers; shorebirds, such as sandpipers and killdeer; piscivorous birds, such as herons and the bald eagle; and mammals that are associated with wetland habitats, including muskrats and raccoons.
Potential receptors associated with the Green River at this site also include endangered fish species. However, no endangered species are exposed to elevated levels of contaminants and are therefore not considered potential receptors at this site.
The habitats of the Green River site area are primarily terrestrial; however, many of the wildlife receptors that occur in these habitats probably live and feed in close association with the aquatic habitats of the river. These receptors may use the river as a source of drinking water, and may thereby be exposed to E-COPCs, if they were elevated. Because the area of the millsite is highly disturbed, little wildlife use of these areas is expected. However, small mammals and birds use the areas, and terrestrial predators may sometimes hunt these animals. Larger species probably cross the area while going to and from the river, and may forage in the area on occasion.
5.0 Analysis
Exposure Assessment
Exposure Modeling and Assumptions
This assessment focuses on the potential risks posed to aquatic, wetland, and terrestrial species that may be exposed to the seven E-COPCs identified in the surface water at the mouth of Browns Wash. Only complete exposure pathways are quantitatively and qualitatively evaluated in an ERA. In this assessment, the following potential exposure pathways were considered for evaluation:
* Surface water ingestion and direct contact * Dietary ingestion of forage or prey, as appropriate, by receptor
-.J
Final Site Observational Work Plan-Green River, Utah Page G-14
DOE'Grand Junction Office September 2002
The'contaminants associated with the site are inorganics. Estimations of potential exposures to key ecological receptors are based on the dominant pathways frrri'these media for the specific receptor. Exposures in wetland plants and aquatic organisms are based on direct contact with the surface water in which they live and, in the cases of aquatic animals, also include the ingestion of food associated with this medium. In all of these'cases (plants and animals), potential exposure to an E-COPC is based on the concentration of that E-COPC in the surface water.
Exposures in'wildlife involve multiple potential pathways that may include ingestion of food,. water, and soil/sediment; direct contact and dermal absorption; and inhalation: In this assessment, the inhalation and dermal absorption pathways are assumed to be minor pathways with respect to the combined exposures based on ingestion. Most wildlife of the area have very little and infrequent direct dermal contact with potentially contaminated media due to their protective covers of feathers or fur and their habits and behaviors, such as preening and grooming, and (in the cases of most birds) living principally in trees and shrubs. The E-COPCs are not highly volatile. Therefore, their occurrence in the air is minimal. Exposures in wildlife through inhalation was considered a minor exposure pathway rel'ativeto sediment ingestion. Although both dermal absorption and inhalation will contribute to the overall exposure in these receptors, these contributions are assumed to be included witin the coinsrvatisnis incorporated in the estimation of exposures through the ingestion pathways. Sediment is not identified as a medium of concern, and therefore, sediment-based pathways are not evaluated.
In the estimation of ingestion-related exposure for the wildlife receptors, the E-COPCs are assumed to be 100 percent bioavailable, and the receptors are assumed to be exposed only at the selected exposure point concentration; regardless of home range size or seasonal use patterns. The exposure through multiple ingestion pathways is modeled using the methods described in EPA's JVidlife Exposure Factors Handbook (EPA: 1993).
The basic model for estimating the daily intake of an E-COPC per kilogram of body weight (i.e., the estimated daily dose of the E-COPC) through these ingestion pathways is
-IT'I '
Y_ (Ck-,Fk '10+w C Fw -, 1w Dix= k=1l -W
where
Dx is the estimated daily dose (milligrams per kilogram per day [mgj/kg-day]) of, E-COPC x, CA is the concentration of E-COPC'x'in inie ktl food tyie (ng/kg di&y weight), Fk is the fraction of the kth food type that comes from the site, 'h is the lngestionrate of the k food type (kg dry/weight/day), "iM is the number of food items'in'the receptor's diet, C, is the concentration of E-COPC x in wvtber (mg/L),', ." " ' ,, is thle fract'ion of the ingested water that c6hiis fr6ohi thle site, ' " I,,, is the ingestion rate of water (liters'per d6i[L/day]), and F 'Wis the body weight of the ireceptor (kg ,%,6t'weight). '
F, and F,,. are commonly assumed to'be the "ar•ea use factor (the area of the site divided by the home range' of the recep'tor or 1, whicheever is smaller) but may' also be'modified by a seasonal
- DOE/Grand Junction Office Final Site Observational Work Plan--Green River. Utah
September 2002 Page G-t 5
-Appendix G
use factor (number of days at the site divided by 365 days per year) if the home range is used for only part of the year. For estimating risk in this assessment, both area use and seasonal use are conservatively assumed to be 100 percent; therefore, FA, F, and Fj,. are assumed to be 1.
For the purposes of estimating exposure in wildlife, the E-COPC concentrations in plants were principally based on the empirically-derived uptake models (nonlinear or linear) as recommended by Oak Ridge National Laboratory (Bechtel Jacobs Company 1998a). Because these models are based on uptake from soil, the soil-water partitioning coefficient (Kd) is used to estimate the E-COPC concentiation in the soil from the water concentration. The nonlinear form of the uptake model is
Cplant = B0 (Kd .Cw )B,
where
Cplant is the concentration of the E-COPC in the plant (mg/kg dry weight), Kd is the soil-water partition coefficient Cw, is the water concentiation of the E-COPC (mg/L), and B0 and B, are'empirically derived model parameters for the E-COPC.
In the linear form of this model, B, is assumed to be exactly 1 and B0 becomes a soil-to-plant
transfer factor, where
C plant = B 0 K d " Cw
In cases where parameters were not available in the Oak Ridge National Laboratory uptake model documents, soil-to-plant transfer factors from other literature sburces (e.g., Baes and others 1984) were used in this linear model.
For aquatic prey species (invertebrates and fish), linear uptake models based on bioaccumulation factors (BAFs) were used to estimate concentrations of E-COPCs in tissues. These models are of the form:
C organism = BAF - C water
where: Cjrganz,, is the concentration of the E-COPC in the invertebrate or fish prey species (mg/kg dry weight), C,.,,ter is the concentration of the E-COPC in the water (mg/L), and BAF is the bioaccumulation factor for the E-COPC.
BAFs account for all exposure pathways (dermal absorption, uptake through respiratory organs, and ingestion). In contrast, bioconcentration factors (BCFs) account'for uptake through pathways other than ingestion. However, for most inorganic constituentsK uptake through ingestion is insignificant, and BAFs are considered to be equal to BCFs. Therefore, BCFs are used as BAFs in this assessment when the latter values are not available. Whenever possible, however, BAFs and BCFs specific to either inveriebrates or fish were used to mo'del the concentrations in these respective prey types. Data specific to chloride, nitrate, and 'sulfate ulptake could not be found; however, concentrations of these constituents in the prey species were assumed to equal its concentration in the surrounding h'edia. Table 6 presents the uptake model parameters (B0, B1,
Final Site Observational Work Plan-Green River, Utah DOE/Grand Junction Office Page G-1 6 September 2002
Appendix G Document Number U0 174000 --a

Appendix G4,-,,,4..m•.t 1J,.nmt•r I I/•I "7AA00'
BAF, and/or BCF values) used in modeling the concentrations of E-COPCs through the food
chain at the mouth of Browns Waish. '"
Table 6. Uptake Model Parameters and Bioaccumulation Factors for Ecological Contaminants of Potential Concern .
Plant Uptake Model . Bioaccumulation Factors
E-COPC Parameters Invertebrates Fish " -B, - B 1 _ _ _ _.. . . . ._ _ _ _
Arsenic -. 0.136 0.564a - 73.0" 17.0c
Chloride - 7 0 d 1.0e 1.0, 1.0o
Manganese 3.0 g 1.0e 65' 17.8'
Molybdenum , 08' 1.0e 10 ; 10'
N itrate -1.. -1.01- -.... 0. . .. . ._ 11 0
Selenium 0.508a 1.10 269b
S ulfate 1.0' 1.0 .. 1 1.01
8From Bechtel Jacobs Company (1998a) b From NMED (2000)-' ... cFrom Sample and others (1996) dFrom Baes and others (1984) .
'The uptake model is linear; therefore, B, = 1.0 'Default value. gFrom NCRP (1989). "From EPA (2001) " From IAEA(1994). - .. . . ....
ilnvertebrate bioaccumulation factor based on fish bioacc-umulation factor. "A _kGeometnc mean of selenite bioaccumulation factors for water fleas based on 14-day exposure from EPA (2001).
Key Indicator Receptors
The receptors used to evaluate potential risks were selected on the basis of their potential
presence in the habitats of the site, their potential for exposure toE-COPCs in the media at the
site, and their potential for conservatively representing potential exposures to a range of other
receptors at the site. The indicator receptors are representative of key links in the food wvebs associated with these habitats.
These indicator receptors are as follows:
* Terrestrial habitats--deer mouse (herbivorous), mule deer, coyote, northern harrier
0 . Wetland habitats-wetland plants, muskrat, raccoon, mallard, spotted sandpiper, bald eagle
* Aquatic habitats-aquatic organisms . : -, .2.::.
Terrestrial exposure pathways are found in limited areas of the floodplain and adjacent uplands.
For the terrestrial wildlife, surface water is considered to be the primary source medium for
E-COPC exposures, and therefore, evaluations of risks to all terrestrial receptors are based on the
potential consumption of drinking water4 from the mouth of, Browns Wash. The terrestrial
wildlife receptors used represent both maimmals afid birds;' the ma* nmals are represented by a
range of body sizes, from a deer mouse to a mule deer. , ,
For the wetlafid habitats, emergenit'plants are considered'to be the primary producers, and the
muskrat and mallard 'are cofisideredtorbe representative of herbivores tlhat may consume such
DOE/Grand Junction Office Final Site Observational Work Plan-Green River, Utah
September 2002 Page G-17

plants. The raccoon represents' an omnivore in this habitat.' The spotted sandpiper represents an insectivorous bird and the bald eagle a piscivorous bird. All animal prey of these wildlife receptors (the muskrat being the only one modeled as purely herbivorous) are assumed to be aquatic (invertebrates or fish).-The species-specific parameters used to model exposures to these key indicator receptors (wildlife only) are presented in Table 7.
Table 7. Exposure Parameters for W0ldlife Receptors
RBod, weight - Food ingestion -Water DietaryReceptorrate ingestion rate Composition (kg)a (kg [dry wt.]lday)b '(Iday)c (percent)d
Deer mouse (Peromyscus 0 0239e NA 0.00344 NA maniculatus)
Muskrat 1A35 0 0772' 0.111 Plant: 100 (Ondatra zibethicus)
Plant: 40 Raccoon 5.74 0 289 0.477 Invertebrate: 50 (Procyon lotor) Fish: 10
Coyote 108 NA 0.786 NA (Canis latrans) Mule deer 65e NA 424 NA (Odocodleus hemionus) Northern harrier 0.180, NA 00187 NA (Circus cyaneus) Mallard Plant: 90 (Anas platyrhynchos) 1.134 0.0592 00642 Invertebrate 10 Spotted sandpiper 0.0425 000503 00711 Invertebrate: 100 (Actitis macularia)
Bald eagle (Hafiaeetus 3.75 0.0863 0 135 Fish- 100 leucocephalus) I I _I
"3From EPA (1993), except where noted. bBased on allometric equations from Nagy (1987), as presented in EPA (1993), except where noted. cBased on allometnc equations from Calder and Braun (1983). as presented in EPA (1993), except where noted. d iets are generalized to emphasize specific trophic levels Dietary compositions of the raccoon and mallard are based on speciesspecific information presented in EPA (1993) and Martin and others (1951) and have generally been rounded to increments of 10 percent "From Silva and Downing (1995). fBased on species-specific food intake rate from EPA (1993), with assumed water content of food of 80 percent. gFrom Dunning (1993).
Receptors in the aquiatic habitats are not specified. Risk to these receptors is based on comparisons of the surface water E-COPC concentrations to broad-based benchmark values, such as ambient water quality criteria (AWQC), that are protective of a wide range of aquatic and benthic organisms. Fish are assumed to be included as potential aquatic receptors within this broad categorization. All wildlife receptors are modeled as potential receptors of E-COPCs in surface water through the consumption of that water at all sites where surface water is present as a medium of concern'.
6.0 Effects Characterization
The potential for adverse effects to ecological receptors resulting from 'exposures to E-COPCs at the site was evaluated through a comparison of the potential exposure in the receptor to a toxicity-based benchimark of exposure representing the threshold of potential adverse effects.
Final Site Observational Work Plan---Green River, Utah Page G- 18
DOE/Grand Junction Office September 2002
I
Appendix G Document Number U0 174000

Aoriendtx G
For aquatic and behthic receptors and plants, the exposure to an E-COPC is characterized by the
concentration of that E-,COPCini the medium (water or sediment, respectively) with which the
receptor is principally-in direct contact: Therefore, the benchmarks by which the potential for
adverse effects is evaluated are also based on media concentrations. For surface water,-either AWQC (EPA 1999) or Utah Department of Environmental Quality WaterQuality Standards
(whichever was less) were used as the principal benchmarks for evaluating potential risk to aquatic life. When neither was available for an E-COPC, other values are used. The water quality benchmarks are summarized in Table 8.
Table 8. Surface Water Quality Benchmarks f6rE6ological Cohtaminants of Potential Concern for the Protection of Freshwater Aquatic Life
COPIC Water Quality Benchmarks (mglL) AWQCa UDEQ WQSb Other
Arsenic . 0.15 - 0.19
Chloride 230 - - - - "
Manganese . - " .. 08c
Molybdenum - - -. 0.24c
Nitrate (as N) - -0.23... _______"_-
Selenium ,. - , 0.005 , '0 005 .. . .
Sulfate - 250e
"aEPA ambient water quality criteria (EPA 1999) bUtah Department of Environmental Quality Water Quality Standard for aquatic life (Rule R317.2)
cTier II secondary chronic value from Suter and Tsao (1996). -
dStafldard for NO 3 as N forclass 3Awaterat pH 8 5 and 25'C.-
"% *EPA secondary maximum contaminant level (EPA 2000) - .
- = No value available
For plants, toxicity benchmarks are based primarily on the inforniation 5i'ovided in Efroymson and others (1997). These b'6nchmarks are'ba'sed on lox;e'st-observed-adverse-effect levels' (LOAELs) using 20 percent reduction in growth as the 'efidpoint. Solutio'n-based (water) benchmarks were used. Although based on LOAELs, these benchmarks are considered conservative. the endj'oint is sublethal and reductioný in'plant grovth" may have no significaht effect on the reproductive potential or the 'continued existence of a plant populaiibn.'The plant toxicity benchmarks are presented in Table 9.
' Table 9.'Plant Toxicity'Benchmarks for Ecological Contaminants of Potential Concern
'E-COPC Plant Toxicity Benchmark for
P ,, ,, ,. . W aera r(, glL)
Arsenic - 0001' - *
Chloride -
Manganese 4.0
Molybdenum 0 5
Nitrate
Selenium 0.7
Sulfate --
'From Efroymson and others (1997) - = No benchmark available.
For the wildlife receptors, no-observed-adverse-effect levels (NOAELs) for chronic oral
exposure are used as benchmarks for toxic effects. The endpoints of particular interest in this
assessment are those associated with reproductive health, development, and mortality. Therefore,
DOE/Grand Junction Office Final Site Observational Work Plan-Green River, Utah Se temher 2002 Page G- 19
T•,,•* "Nhr,,.d.•;-v ! 11"11 "7•.•f•f•
V
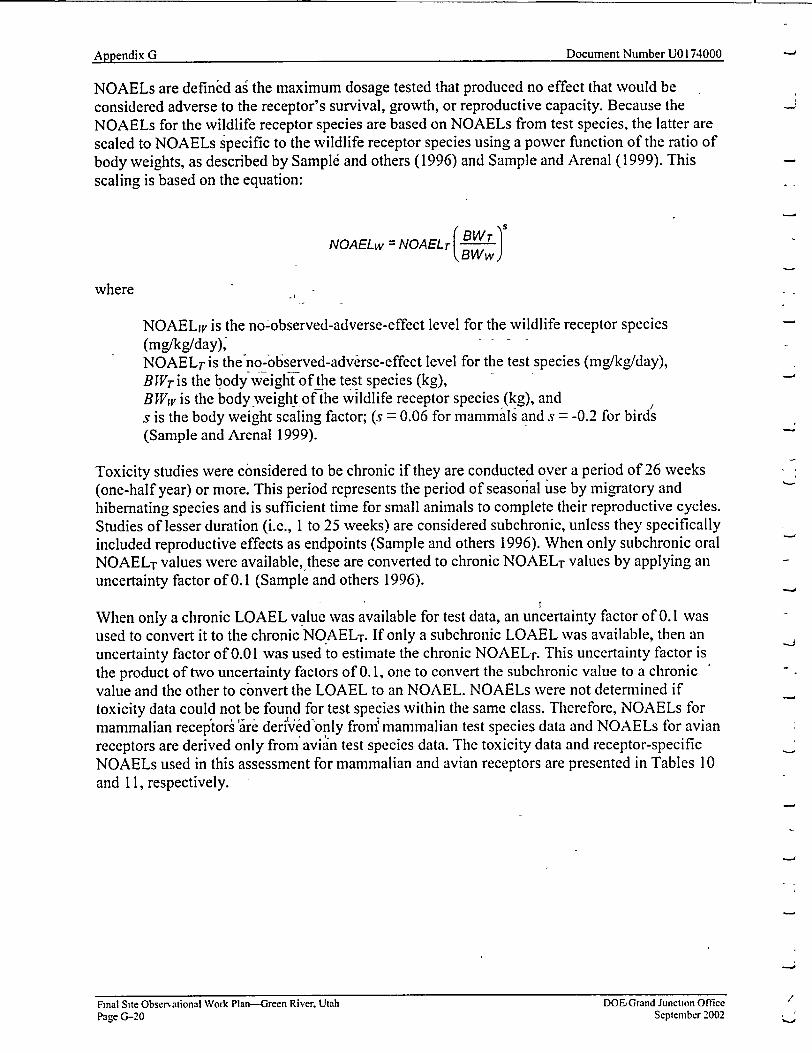
Appendix G Document Number UO 174000
NOAELs are defined ai the maximum dosage tested that produced no effect that would be considered adverse to the receptor's survival, growth, or reproductive capacity. Because the NOAELs for the wildlife receptor species are based on NOAELs from test species, the latter are scaled to NOAELs specific to the wildlife receptor species using a power function of the ratio of body weights, as described by Sample and others (1996) and Sample and Arenal (1999). This scaling is based on the equation:
NOAELwNO AAELT BWw)
where
NOAELw is the no-observed-adverse-effect level for the wildlife receptor species (mg/kg/day),. NOAELT is theno-observed-adverse-effect level for the test species (mg/kg/day), BWT is the body weightfof the test species (kg), BWw is the body weight of the wildlife receptor species (kg), and s is the body weight scaling factor; (s = 0.06 for mammals and s = -0.2 for birds (Sample and Arenal 1999).
Toxicity studies were considered to be chronic if they are conducted over a period of 26 weeks (one-half year) or more. This period represents the period of seasonal use by migratory and hibernating species and is sufficient time for small animals to complete their reproductive cycles. Studies of lesser duration (i.e., 1 to 25 weeks) are considered subchronic, unless they specifically included reproductive effects as endpoints (Sample and others 1996). When only subchronic oral NOAELT values were available, these are converted to chronic NOAELT values by applying an uncertainty factor of 0.1 (Sample and others 1996).
When only a chronic LOAEL value was available for test data, an uncertainty factor of 0.1 was used to convert it to the chronic NO.AELT. If only a subchronic LOAEL was available, then an uncertainty factor of 0.01 was used to estimate the chronic NOAELT. This uncertainty factor is the product of two uncertainty factors of 0.1, one to convert the subchronic value to a chronic value and the other to convert the LOAEL to an NOAEL. NOAELs were not determined if toxicity data could not be found for test species within the same class. Therefore, NOAELs for mammalian receptor.• aire deri'Ved-nly from; mammalian test species data and NOAELs for avian receptors are derived only from avian test species data. The toxicity data and receptor-specific NOAELs used in this assessment for mammalian and avian receptors are presented in Tables 10 and 11, respectively.
Final Site Observational Work Plan--Green River, Utah Page G-20
DOEGrand Junction Office September 2002

"Dcmn Nubr O1700- A ..e....
-Table 10. Mammal Toxicity Benchmarks for Ecological Contaminants of Potential Concern .
Mammalian Test Datao Mammalian Receptor NOAELs (mglkglday) E-COPC ' Test Y- - 'NOAEL Deer- Mus.rat " .... " Cyt . .. e ,
weight " Muskrat mRoccoons Coyote Mee deer Species (mg/kg/day). mouse
Arsenic Rabbit 4396 -0396 . 0541 0430,-, 0390 -0377, -, 0.37
Chloride ..-.......
Manganese 'Rat, 035 ', 880:_ 103,- 82.0 .74.4 , 720 ;,643
Molybdenum Mouse 0.03 026 0264 0209 0 190 0.183 0 164 Nitrate Guinea , , ,
Nitrate 0 86,'G 507 •'629 . .499' 452' - -438 .:. 391
Selenium- - Rat'- 035 '1 020 0235 - - 0186 '0169 0164'- 0146
Sulfate - - - .
"OFrom Sample and others (1996) 2' - = Insufficient toxicity information . ' . ..
- Table 11. Avian ToxicityBenchmarks for Ecological Contaminants of Potential Concern
Avian Test Data, ,- Avian Receptor NOAELs (mglkglday) E-COPC Body NOAEL Northern Mallard Spotted Bald Test Species weight (kg) hmMg//aardri•anlpiper eagle
Arsenic Mallard . - 1.0 5.14 -... 3.65, \-527 2.73 . 6.70
Chloride - -.. : ..
Manganese .Japanese quail -- 0.072 - 977- 1,170 .1,700- 879 2,150 Molybdenum . Chicken 11.5 3.53 2.31 -- .3.34 1.73 --'4.24.-Nitrate ' .. - _ ._ - - - _ -- - _-- _.. .
Selenium Mallard .1 1.0 - 0.40 0.284'. 0.410 0.213 0.521_ Sulfate ... ... .... _: -
"From Sample and others (1996). ' Insufficient toxicity information
7.0 Risk Characterization .
The potential for risk to ecological receptors is determined through hazard quotients (HQs). HQs are specific to a particular receptor for exposure to a particular E-COPC.An HQ is'defined by'
S ' . . ' 'Exposure ," ..
. Benchmark
For aquatic and benthic organisms and plants, exposures are equivalent to media concentrations (surface water or sediment) with which the organism is in contact. For wetland wildlife, exposures are modeled from multiple pathways.
The value of the HQ is greater than 1.0 if the magnitude of the exposure is greater than the corresponding benchmark, and conversely, the HQ is less than or equal to 1.0 if the exposure is less than or equal to the benchmark. An HQ value less than or equal to 1.0 is interpreted as evidence of no potential risk to that receptor for that E-COPC. If the HQs for an E-COPC are less than unity for all receptors, that E-COPC is eliminated from further consideration as a potential ecological risk driver. However, because exposure for the screening of E-COPCs is
Final SSte Observatonal Work Plan---Green River, Utah "Page G-21
Document Number U0 174000 • Annendix G
DOE/Grand Junction Office September 2002

Document Number U0174000
conservatively estimated, an HQ value greater than unity is not' interpreted as evidence of risk, but only as evidence that the potential for risk cannot be ruled out.
For the purposes of this evaluation, potential exposures were conservatively based on the maximum measured E-COPC in surface water at the mouth of Browns Wash. The following are summaries of the risk assessment results for specific receptor grups.
Risk to Ecological Receptors Associated with Suiface Water at the Mouth of Browns Wash
Table 12 presents the HQs for aquatic organisms and wetland plants exposed to surface water at' the mouth of Browns Wash. With one -exception (plant exposure to-arsenic), all of these HQs are less than 1. The single exception is -only slightly above 1. Because these HQs are based on the maximum of the two samples C-ollkcted at this site, with the other data point for arsenic (0.00088 mg/L) being less than the plant toxicity benchmark, the potential for risk to plants is considered negligible.
Table 12. Hazard Quotients for Aquatic Organisms and Wetland Plants at the Mouth of Browns Wash Based Upon Comparison of Surface Water Concentrations to Water Quality and Plant Toxicity
Benchmarksa
Aquatic Organisms - Wetland Plants E-COPC Water Quality Hazard Plant Toxicity Haza rd
Benchmark Benchmark Quotient Quotient "(mg/L) (rag/L)
Arsenic 0.15 0.00933 , 0.001 1.40 Chloride 230 0.146 -.. Manganese 0.08 0.498 . 4.0 0.00995 Molybdenum 0 24 0 0229 0.5 0.0110 Nitrate 023 - 0.199 -- -
Selenium 0 005 0.220 0.7 0 00157 Sulfate 250 0.772 -
aHazard quotients based on maximum surface concentration
-- = No benchmark value available', Hazard quotient greater than 1 shown in Bold
Tables 13 and 14 present the HQs for exposures to wetland and terrestrial wildlife to surface water and associated prey organisms at the mouth of Browns Wash. None of the E-COPCs at this site are at concentrations that pose a potential risk to either wetland or terrestrial wildlife that may exposed to surface water at the site or to food organisms eaten from the site.
Final Site Observational Work Plan--Green River, Utah Page G-22
DOE:Grand Junction Office September 2002
Appendix G
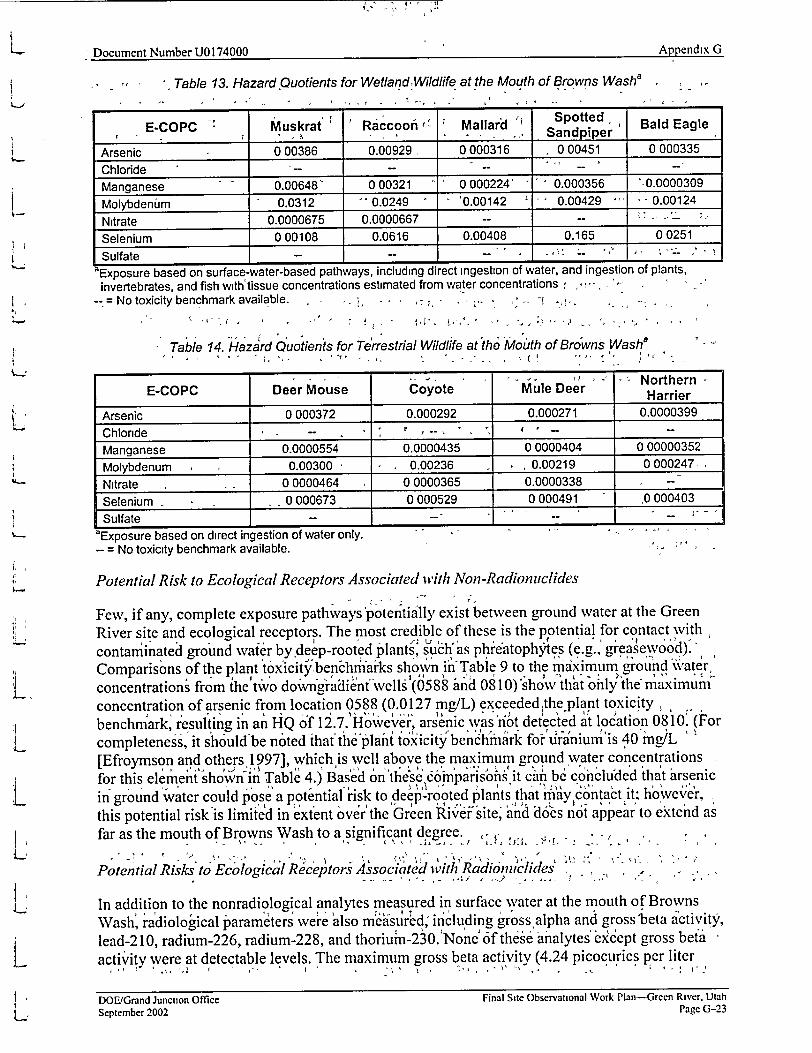
Table 13. Hazard Quotients for Wetland:Wildlife at the Mouth of Browns Wash a
E-COPC Muskrat' Raccoonr'- Mallard Spotted Bald Eagle , •- .,. Sandpiper __BaldEagle
Arsenic 0 00386 0.00929 0000316 0 00451 0 000335
C hloride - .......
Manganese - 0.00648- 0 00321 0 000224' 0.000356 0.0000309
Molybdenum 0.0312 0.0249 '0.00142 0.00429 . 0.00124
Nitrate 0.0000675 0.0000667 .. _
Selenium 0 00108 0.0616 0.00408 0.165 0 0251
Sulfate .... - , ° " -- ; , ;"- " - I
aExposure based on surface-water-based pathways, including direct ingestion of water, and ingestion of plants, invertebrates, and fish with'tissue concentrations estimated from water concentrations
-- = No toxicity benchmark available.
"Table 14. HazaIrd Quotients for Terrestrial Wildlife at Ithe Mouth of Browns Wash"
..- "NorthernE-COPC Deer Mouse Coyote Mule Deer Harrier
Arsenic 0 000372 0.000292 0.000271 0.0000399
Chloride - % . .-- -
Manganese 0.0000554 0.0000435 0 0000404 0 00000352
Molybdenum 0.00300 , 0.00236 0.00219 0 000247,
Nitrate . 0 0000464 0 0000365 0.0000338 -
Selenium 0 000673 0 000529 0 000491 .0 000403
Sulfate -L--"_ _ _ --__ _--__ _ _ _ _ _
aExposure based on direct ingestion of water only. - = No toxicity benchmark available. -
Potential Risk to Ecological Receptors Associated with Non-Radionuclides
Few, if any, complete exposure pathways'potenti1ly exist between ground water at the Green River site and ecological receptors. The most credible of these is the potential for contact with contaminated ground water by deep-rooted plants, such;as phreatophytes (e.g., greasewood). ,
i s shonch'Tasl phrtopthye (exigum greas waer, Comparisons of the plant t6xicity. benchmai'ks shown inTable 9 to the maximum'ground ,,ater
do' ~ ~ jI ngrtin -el'('88 id010''o h I '7e~ý- m
concentrations from the two downgraihnt wells (0588 and 0810) show that only the maximum
concentration of arsenic from location 0588 (0.0127 mg/L) exceeded~the plant toxicity
benchmark, resulting in an HQ of 12.7. However, arsenic was not detected a location 0810. (For
completeness, it s hould be noted that theplait tox'city benchmark fofruranium is 40 ig/L
[Efroymson and others 1997], which is wvell above the maximum ground water concentrations
for this elemen to in Table 4.) Based onit thn coclu'dd that irsenic in ground water could pose a potential risk to deep-rooted plants that my contact it: however, this potential risk is limited in extent ov-dr'the 'Green PRivei: site, and d•6es not appear to extend as
far as the mouth of Browns Wash to a significant degree. .. , ,
Potential Risks to Ecological Receptors' Associated with RadiotchdesI
In addition to the nonradiological analytes measured in surface water at the mouth of Browns Wash, raIdiooical arameters we're 'also measured; including grossalpha and gross'beta activity, lead-2 10, radium-226, radium-228, and thoriumi-230.'None 6f th6es ahalytes-ex•ept gross befit' activity were at detectable levels. The maximum gross beta activity (4.24 picocuries per liter
Docmen Nube L 740
DOE/Grand Junction Office September 2002
Final Site Observational Work Plan--Green River. Utah Page G-23
Amlendix G
[pCi/L]) is very low, and iihlikel; to be of potential concem'to ecological receptors. Radium-226 has been detected in the past in both surface and ground water samples from the Green River site at concentrations as high as 3.0 pCi/L. However, this is well below, the screening-level. benchmark for aquatic biota (160 pCi/L) derived byOak Ridge National Laboratory (Bechtel Jacobs Company 1998b), based on the methodology for estimating dose rates for aquatic biota(specifically large and small fish) developed by Blaylock, et al. (1993). Therefore. analysis of radionuclides in surface water and ground water samples from the site indicates no potential ecological risk.
Potential Risks to Sensitive Species
The Colorado pikeminnow is an endangered species that has the potential for occurring in the, Green River near the site. The bald eagle is a threatened species that could also occur in this area. Both of these species would be associated with the aquatic habitats of the Green River, the bald eagle potentially using this habitat to catch prey (fish). Because the HQs for aquatic organisms and the bald eagle exposed to E-COPCs at the mouth of Browns Wash were all less than 1, neither of these sensitive species appear to be at risk from these potential exposures.
8.0 Ecological Risk Summary
This ERA has determined that there is little potential for site-relhtkd constituents to affect surface water or sediments. There ig the possibility that ground water arsenic concentrations could affect deep-rooted plants if and explosure pathways exists. This assessment further concludes that there is limited, if any, potential for sensitive species to be adversely affected by site-related constituents.
9.0 References
Baes, III, C.F., R.D. Sharp, A.L. Sjoreen, and R.W. Shor, 1984. A Rev'iew and Analysis of Parameters for Assessing Transport'of Environmentally Released Radionuclides through Agriculture, ORNL-5786, Oak Ridge National Laboratory, OAk Ridge, Tennessee.
Bechtel Jacobs Compahy, 1998a. Empirici Models for the Uptake of Inorganic Chemicals fr-om Soil by Plants, BJC/OR-133, O'ak Ridge National Laboratory, Oak Ridge, Tennessee.
Bechtel Jacobs Company, 1998b. Radiological Benchmarks for Screening Contaminants of Potential Concern for Effects'on Aqua'tic Biota at Oak Ridge National Laboratory, Oak Ridge, Tennessee, BJC/Ok-80, Oak Ridge National Laboratory, Oak Ridge, Tennessee.
Blaylock, B.G., M.L. Frank, and B.R. O'Neal,' 1993. Methodology foi Estimating Radiation Dose Rates to Freshwater Biota Exposed to Radionuclides in the Environment, ES/ER/TM-78, Oak Ridge National Laborator, Oak Ridge, Tennessee.
Calder, W.A., and E.J. Braun, 1983. "Scaling of Osmotic Regulation in Mammnals and Birds," American Journal of Physiology, 244:R60 1-R606.
Dunning, J.B., 1993.' CRC Handbook ofAvian Body Masses, CRC Press, Boca Raton, Florida.
Final Site Observational Work Plan--Green River, Utah Page G-24
DOE/Grand Junction Office September 2002
Atmendix G

-Appendix G
Efroymson, R.A.; M.E. Will, G.W. Suter II, and A.C. Wooten, 1997. Toxicological Benchmarks
for Screening Potential Contaminants of Concern for Effects on Terrestrial Plants: 1997
Revision, ES/ER/TM-85/R3; Oak Ridge National Laboratory, Oak Ridge, Tennessee.
International Atomic Energy Agency (IAEA), 1994. "Handbook of Parameter Values for the
Prediction of Radionuclide Transfer in Temperate Environments," Technical Reports Series
No. 364, Vienna, Austria. ,:
Martin, A.C., H. S. Zim, and A. L. Nelson, 1951. American Wildlife and Plants: A Guide to
Wildlife Food Habits, McGraw-Hill Book Company, Inc., reprinted (1961) byDover Publications, Inc., New York.
Nagy, K.A., 1987. "Field Metabolic Rate and Food Requirement Scaling in Mammals and
Birds," Ecological Monographs, 57(2): 111-128.
National Council on Radiation Protection and Measurements (NCRP), 1989. "Screening Techniques for Determining Compliance with Environmental Standards: Releases of
Radionuclides to the Atmosphere," NCRP Conimentary No. 3, Revision of January 1989,
National Council on Radiation Protection and Measurements, Bethesda, Maryland, January.
New Mexico Environment Department (NMED), 2000. "Guidance for Assessing Ecological
Risks Posed by Chemicals: Screening-Level Ecological Risk Assessment," Hazardous and
Radioactive Materials Bureau, New Mexico Environment Department, Santa Fe, New Mexico.
Sample, B.E., D.M. Opresko, and G.W. Suter II, 1996. Toxicological Benchmarks for JVildlife:
1996 Revision, ES/ER/TM-86/R3, Risk Assessment Program, Health Sciences Research
Division, Oak Ridge National Laboratory, Oak Ridge, Tennessee.
Sample, B.E., and C.A. Arenal, 1999. "Allometric Models for Interspecies Extrapolation of
Wildlife Toxicity Data," Bulletin of Environmental Contamnination and Toxicity', 62:653-663.
Silva, M., and J.A. Downing, 1995. CRC Handbook of Mammalian Body Masses, CRC Press, Boca Raton, Florida.
Suter, G.W., II and C.L. Tsao, 1996. Toxicological Benchmnarks for Screening Potential
Contaminants of Concern for Effects on Aquatic Biota: 1996 Revision, ES/ER!TM-96/R2, Oak
Ridge National Laboratory, Oak Ridge, Tennessee.
U.S. Department of Energy, 1988. Environmental Assessment for Remedial Action at the Green
River Uraniwn Mill Tailings Site, Green River, Utah, DOE/EA-0343, July.
,1995. Baseline Risk Assessment of Ground WVater Contamination at the Uranium Mill
Tailings Site Near Green River, Utah, DOE/AL/623 50-1 16, Rev. 1, September.
U.S. Environmental Protection Agency (EPA), 1993. Wvildlife Exposure Factors Handbook,
Volume I of II, EPA/600/R-93/187a, Office of Research and Development, U.S. Environmental Protection Agency, Washington, D.C.
DOE/Grand Junction Office Final Site Observational Work Plan--Green River, Utah
September 2002 1 Page G-25
1"• ...... ,,,* Nl,,,-n• r I 1/'•1 "7,4('ff)(•

U.S. Environmental Protection Agency (EPA), 1998. "Guidelines for Ecological Risk Assessment," EPA/63 0/R-95/002F, Risk Assessment Forum, U.S. Environmental Protection Agency, Washingtfon, D.C.
1999. "National Recommended Water Quality Criteria-Correction," EPA 822-Z-99-00 1. Office of Water, U.S. Environmental Protection Agency, Washington, D.C.
2000. "Sulfate in Drinking Water," www.epa.toviOG WDW/standard/sul fate htl1. Office of Water, U.S. Environmental Protection Agency, Washington, D.C.
2001. "ECOTOX: Ecotoxoicology Database," U.S. Environmental Protection Agency, Washington, D.C.
I..
..J
Final Site Observational Work Plan-Green River, Utah Page G-26
DOE/Grand Junction Office September 2002
Aciiiendix G Document Number UO 174000

Di:,~men NuConceptual Site Model
A H
CAU � 'UT a
CIfl flThN�IAL - '0 nfl
CIXEft tATERI (VIJSL SMAK "E &L1
MIMRAE Oeti~rS (FrRCM *CESrftA MEEW RIVUE)
.-HN : TI"U WSTONE - ý
GE- -XCM At rwEE . U E a G N
*U WIELL WNNER MD LOCTO
MEN RNWER AhnICL*
OEOL .f ... "I WEO*5AC I.E 20OEC hLf J~dACSAE AW1110IIhMAX,
I -PE- ,
GREOLOGICMAP UAND CROOSSISCTION INDE
2RSSS UTON 73300
SEPTEMBER lB. 2002" U(1nX
Figure 5-2. Green River, Utah, Geologic Map and Cross-Section Index
Fintal Site Obs*v~rvotIoa W,,r1 Plunr-(ireen River. Utah Pae 5-3DO~tIta Juntsone Offcee
Scptenib~er 2002

Document Number U0174000
Tununk Member
'vof Maness Shal Gdvray. ca3lcareous madne shale
Most of DakotawSandstone removed by sosion
SDakota Thin coal, carbonaceous shale, Sandstone and fine grained sandstone
Conglomeratic sandstone, Sresistant iron-stained
upado 1 5
a thick Gray side. wl
scattered chert madules w/ pydite
Nodular hand, conglomerate -10 it thick Tptwhtfine-to
mnediunam-reain whabmy Upper evocator. 10," ft thick
Unit Probable shaley interval (does not crop out)
Middle Sandstone Fiuvial croesbedded, medium- to coarse-gratned Unit sandstone, 10-15 thick, continuous - caps mesas in area
Lima, congromcerate
Greenish claystone layer -15 at thick
Limey conglomerate
0 Grayto hmauv shale whscathered Iooey riddles
Lower Unit
Letiuar"tringer" sandstone
0 Gray to mauve shale w/ limey conglomerate and scattered cquadzitio "gizZard stones"
Tan brown sandstone, fine, medium, and coarse r grained, with some minor conglomerate, 8-15 It thick
B rsi e.b n prl hl j DC
Barushy Rdbonadprl hl Basin Pcoa n ~ hl MemFber of Morrison Rolrmation
WokPUre by U S DEPARTMENT OF ENERGY S V Stoller CordoroEon
NRAND oUUNCION OFTIDRAND JUNCIION. COCORADO0 Uoder DDE COtror
I NO dE ACl3-O2CJ794r
Schematie Generalized Strotigrophic Sec ion o. the Green River, UJih Site Area
Based on Geologic Outcrops
DATE PREPARED, FLENAME MU\UGW\511\o o\0G\UO1734\UOt 734000WG 09/16/02 257pm J50191 Septomb r 16, 2002 U0173400
Figure 5-3. Schematic Generalized Stratigraphic Section of the Green River, Utah, Site Area
DOE/Grand Junction Office Final Site Observational Work Plan- een River, Utah September 2002 Pae 5-5
Conceptual Site Model

ConceplDocument Number 1.174000
I -J
-S
No text for this page
Final Site Observational Work Plan-Green River, Utah Page 5-6
DOE/Grand Junction Office September 2002
.5
4
I
I
Conceptual Site Model

Conceptual Site Model Document Number U0 1 7400
A4200
4180
4160
4140
4120
4100
4080 0582
4060
4040
4020
4OOO
3980
3960
3940
3920
3900
3880
3800
3840-
31-
Monitor Well Number Quaternary - Ground Surface
Water Level Cretaceous
(July 2002)
Screened Interval JurassicZ
Cover Material (mostly Sand and Silt)
Terrace Deposits (from Ancestral Green Riv
Alluvium along Browns Wash
Dakota Sandstone
Cedar Mountain Formation
Morrison Formation, Brushy Basin Member
A' 4200
US. OEPARTMENT OF ENERGY S M. Slte, CotontaaO
Northwoest to Soctheast Cross Secion
ThrOUgh te Green River Site inal (A-A)
Figure 5-4. Northwest to Southeast Cross Section through the Green River Site Area (A-A) Cl I
Final Site Observational Work Planr-reen River, Utah Page 5 7
DOE/Grand Junction Office Septenmber 2002
Cc 01847
4180
4140
-4120
4100
4080
-- 4000
4040
-. 4020
4000
3980
3960
3940
3920
39D0
3880
3860
3840
OllialaW VV*naYj So b"21 inYO U0172800

Document Number U0174000
B 4200
4180
4160
4140 0
4120
4100
4080
4060
4040
4020
4000
3980
3960
3940
3920
3900
3880
B'
Qc 0586
-85 ---- ---
Jurassic m
~~ 09/23/2 2VRpmMteyj
DisDosal Cell
Cover Material (mostly Sand and Siht)
Terrace Deposits (from Ancestral Green River)
Alluvium along Browns Wash
Mancos Shale
Dakota Sandstone
Cedar Mountain Formation
Morrison Formation, Brushy Basin Member
50'
0 I[L 0 250'
0183 Monitor Well Number - Ground Surface
M Water Level (July 2002)
Screened Interval
4200
4180O
4160
4140
4120
4100
4080
4060
4040
4020
4000
3980
3960
3940
3920
3900
3880
US. OIPARTMENT OF ENERGY S M StoYor Caaoo
Southwest to Northeast Cross Section Through the Green River Site Area
(B-B') D STEP tembe. 2l22 U129
Senotember 23. 2002 U0172900
Figure 5-5. Southwest to Northeast Cross Section through the Green River Site Area (B-B)
DOE/Grand Juretion Office September 2002
Final Site Observational Work Plan-•reen River, Utah Page 5 9
ClZ.-
Concepunad Site Model
=m mat 50m
THIS PAGE IS AN OVERSIZED DRAWING
OR FIGURE,
THAT CAN BE VIEWED AT THE RECORD TITLED: FILENAME U0172700-01 GREEN RIVER, UTAH
UMTRA PROJECT SITE AND VICINITY
WITHIN THIS PACKAGE...OR, BY SEARCHING USING THE
DOCUMENT FILENAME U017270000-01
NOTE: Because of this page's large file size, it may be more convenient to copy the file to a local drive and use the Imaging (Wang) viewer, which can be accessed from the Programs/Accessories menu.
D-1
Recommended


![Guide to Conducting Pumping Tests - B.C. … 4 ] HOW IS PUMPING RATE SELECTED? The well should be pumped at or above the intended pumping rate of the well and the well should not be](https://img.pdfslide.us/doc/110x75/5ccd45bc88c993de558dee0c/guide-to-conducting-pumping-tests-bc-4-how-is-pumping-rate-selected-the-well.jpg)