APPENDIX E Transportation Memorandum

332 Pine Street | Floor 4 | San Francisco, CA 94104 | (415) 348-0300 | Fax (415) 773-1790
www.fehrandpeers.com
MEMORANDUM
Date: September 14, 2016
To: Wendy Bloom, San Francisco State University
CC: Ann Sansevero, Dudek
From: Ingrid Ballus Armet and Matt Goyne, Fehr & Peers
Anais Schenk, Dudek
Subject: SF State Creative Arts and Holloway Mixed-Use Project, Traffic and
Circulation Analysis
SF16-0881
This memorandum presents a study of travel demand at San Francisco State University (SF State)
and the transportation-related effects and impacts of the proposed Creative Arts and Holloway
Mixed-Use Project (herein referred to as “Project”). The Project is consistent with the SF State
Campus Master Plan (CMP) completed in 2007 and the transportation-related effects and impacts
identified in its Environmental Impact Review in 2007 (herein referred to as “2007 CMP EIR”).
This memorandum includes a description and assessment of existing transportation conditions at
the Project site followed by a travel demand analysis and assessment of potential impacts of the
Project on traffic, transit, bicyclists, and pedestrians. This evaluation is consistent with the 2007
CMP EIR Standards of Significance and the California State University’s Transportation Impact
Study Manual (November 2012) (herein “CSU’s TIS Manual”). The evaluation also includes
methods from the City and County of San Francisco’s Transportation Impact Analysis Guidelines
(October 2002) (herein “SF Guidelines”).
The travel demand analysis includes an assessment of changes in campus travel demand since the
completion of the 2007 CMP EIR as a result of changes in SF State’s campus population and their
travel behavior, and its effects on the Trip Envelope established by the 2007 CMP EIR. The
Adjusted CMP Trip Envelope is compared to the Project’s trip generation to determine if the
Project would result in any additional significant impacts not presented and evaluated within the
2007 CMP EIR.

Wendy Bloom, San Francisco State University
September 14, 2016
Page 2 of 30
EXECUTIVE SUMMARY
The Project, located on the south side of the SF State campus (Figure 1), includes the
construction of a new student housing building with 550 beds and campus-serving retail, a new
Creative Arts replacement building, and an associated 800-seat concert hall. The student
housing/mixed-use building will replace seven apartments with 22 beds and an existing student
housing building with 173 beds, resulting in a net increase of 355 beds.
Based on the results of the 2016 SF State Travel Survey (Attachment B) and the San Francisco
Guidelines, on an event day the Project would generate 233 net new vehicle trips and 70 net new
transit trips during the PM peak hour. On a non-event day the Project would result in a decrease
in trips with a total of -18 vehicle trips and -39 transit trips. This decrease in Project trips is a result
of locating students who would otherwise live off campus into on campus housing.
The 2007 CMP EIR estimated an increase in travel demand to campus of 466 additional vehicle
trips and 387 additional public transit trips during the PM peak hour by 2020. These additional
trips, referred to as the CMP Trip Envelope in this memo, were added to existing conditions and
analyzed in the 2007 CMP EIR. The total number of trips analyzed under the 2020 scenario of the
2007 CMP EIR is the threshold that projects are evaluated against to determine whether they
would generate additional impacts beyond what was analyzed in the 2007 CMP EIR. The CMP Trip
Envelope is the number of additional trips above existing conditions that can occur before trips
exceed the 2020 conditions analyzed in the 2007 CMP EIR. Because the 2007 CMP EIR was
completed in 2007 the Trip Envelope was adjusted to account for changes in existing conditions.
Since the completion of the 2007 CMP EIR, the campus population has remained steady or even
declined in some years. In addition, fewer students, staff, and faculty currently drive to campus
compared to 2007 due to the successful implementation of TDM measures. The combination of
these two factors has reduced the number of campus-generated vehicle trips since the
completion of the 2007 CMP and 2007 CMP EIR. 1 Due to the changing demographics and travel
behaviors, the total number of campus-generated vehicle trips has decreased while the number of
1 This is comparison to the 2007/2008 academic year which was the year the EIR was certified and the year
that baseline counts for implementation of CMP EIR Mitigation Measure TRA-1 were conducted. Data on the
campus population for every year is provided by the University Communications department and can be
found on the SF State website at http://puboff.sfsu.edu/sfsufact/archive. (Accessed August, 2016.)

Wendy Bloom, San Francisco State University
September 14, 2016
Page 3 of 30
campus-generated public transit trips has increased. Thus, the Trip Envelope from the 2007 CMP
EIR was adjusted to account for changed conditions. The resulting Trip Envelope is the difference
between current conditions (2016) and the number of trips analyzed in the 2007 CMP EIR for the
2020 scenario. The Adjusted Trip Envelope is 1,027 vehicle trips and 163 public transit trips during
the PM peak hour, which is greater than the number of vehicle and transit trips generated by the
Project.
Further, given that the number of PM peak hour vehicle trips campus wide has declined by 561
trips between 2007 (CMP EIR base year) and 2016, the net new PM peak hour vehicle trips
associated with the event-day Project conditions, would not result in an increase in PM peak hour
vehicle trips over the 2007 CMP EIR baseline conditions. Since the estimated number of Project
related trips is less than the Adjusted CMP Trip Envelope and the campus has reduced vehicle
trips to below 2007 levels, the severity of impacts on traffic and transit conditions would be less
than those presented in the 2007 CMP EIR.
The Project would also close Tapia Drive to vehicles (except for commercial loading and
deliveries). Holloway Avenue and Font Boulevard would be able to accommodate rerouted traffic
and passenger loading needs for the existing surrounding land uses and the Project’s concert hall.
The Project is directly accessible to 19th Avenue and the M Line as well as Routes 28/28R, 29 and
57, as shown in Figure 1. As discussed above and below, the Project will not result in new or
increased impacts to transit since the estimated number of Project transit trips is below what was
studied for the 2020 scenario in the 2007 CMP EIR. The Project will include a number of bicycle
and pedestrian improvements including secure bicycle parking, wider sidewalks, pedestrian bulb-
outs and new access ramps. While pedestrian and bicycle trips are expected to increase due to
the Project, existing and proposed facilities would be able to accommodate these trips and the
Project is expected to have a less-than-significant impact on bicycle and pedestrian conditions.
PROJECT DESCRIPTION
The Project site includes two parcels on the south side of the SF State campus, as shown on
Figure 1. One parcel is located on the south side of Holloway Avenue between Cardenas and
Varela Avenues, while the other parcel, known as the Tapia Triangle, is bounded by Tapia Drive,
Holloway Avenue, and Font Boulevard. The Project site is part of University Park South, an area
that extends beyond the central campus boundaries to the south. University Park South currently
includes existing residential units occupied by SF State students, affiliates and non-affiliates.
Wendy Bloom, San Francisco State University
September 14, 2016
Page 4 of 30
The CMP adopted in 2007 addresses all aspects of future physical development and land use on
the campus to accommodate the enrollment ceiling of 25,000 full-time equivalent (FTE) students.
The adopted CMP also accommodates a building program of 0.9 million gross square feet (GSF)
of new and replacement non-residential building space and the development or conversion of
about 1,200 additional units of housing for faculty, staff, and students. The Project is consistent
with the CMP building program. However, a master plan map revision is required to allow for the
proposed uses on the identified sites.
HOUSING
The Project includes the construction of new apartment-style student housing, campus-serving
retail, and student support services on the south side of Holloway Avenue. The redevelopment of
the block will allow for a more compact and dense configuration to increase the supply of on-
campus housing in conformance with the CMP objectives. This development pattern is also in
alignment with Parkmerced’s redevelopment plans. The retail and support services space will
include campus-serving retail, student support services, bike storage, study rooms, a copy center,
retail dining, and a modest amount of underground parking to replace parking being removed
elsewhere on-campus in the vicinity of the Project. The retail and student support services space
will serve SF State affiliates, as well as neighbors in the immediate vicinity of the campus.
CREATIVE ARTS AND CONCERT HALL BUILDINGS
The Project will also include constructing the Creative Arts replacement building and concert hall
in the Tapia Triangle. This development assumes a relocation of the existing Department of
Broadcast & Electronic Communication Arts (BECA) program from the existing Creative Arts
building, but does not increase the enrollment or full-time employees above current levels. The
800-seat concert hall will be located adjacent to the Creative Arts replacement building. The
concert hall will have recording and broadcast capabilities that will provide hands-on learning for
BECA students and will serve as a performance venue and state-of-the-art recording studio for
chamber orchestras, choral/vocal music, instrumental ensembles, and music groups. It also could
host and simulcast lecture series, film festivals, and debates. Some events may be open to the
campus community only while others will cater to the neighborhood and larger community,
similar to the University’s current program of performing arts and lectures housed in McKenna
and Knuth Theaters.
Wendy Bloom, San Francisco State University
September 14, 2016
Page 5 of 30
CHANGES TO TAPIA DRIVE AND VARELA AVENUE
SF State is applying to the City to close, or “vacate”, Tapia Drive to vehicles. This would allow SF
State to incorporate the street right-of-way into the Project site and to integrate the site into the
campus and, specifically, the academic core. SF State owns the property on both sides of Tapia
Drive, and closing the street is consistent with the 2007 CMP, which envisioned a major east/west
walkway connecting the central academic core with sites to the west, including the Mashouf
Wellness Center. The current Tapia Drive right-of-way would be developed as part of the site for
the proposed Creative Arts replacement building and concert hall and would be used primarily by
pedestrians, although some vehicular access would be required for loading at the existing
Creative Arts and Humanities building.
Varela Avenue is envisioned as a shared street. The Project would be designed to connect to the
future Parkmerced transit station by adding pedestrian amenities and a courtyard that opens
towards the transit hub. The alignment of the courtyard to this potential transit hub would
promote movement of visitors through the courtyard from the new transit hub, ultimately
connecting pedestrians to the SF State campus via Holloway Avenue. Once the future transit hub
is completed, Varela Avenue may be restricted to shuttles and Muni buses as part of that future
project such that pedestrians would be prioritized and the courtyard would act as an extension of
the transit hub on the opposite side of the street. Improvements will include eliminating parking
on Varela Avenue, a strategy to modify and reduce curbs so that ease of movement is promoted
across Varela Avenue, and pavers that strengthen the pedestrian connection as well as provide a
safe street crossing.
TDM AND TRANSPORTATION IMPROVEMENTS
The addition of housing and neighborhood retail services supports SF State’s goal to minimize
drive-alone auto trips to reduce traffic congestion and GHG emissions. Consistent with the SF
State transportation demand management (TDM) plan (Nelson/Nygaard 2009), new residential
and retail development should use strategies that minimize the need for parking, such as car
sharing, bike facilities, and access to transit.
The new student housing/mixed-use building at the southeast corner of Holloway Avenue and
Varela Avenue would include secure, covered bicycle storage on the first floor of the building.
Approximately 185 Class 1 secure, covered bicycle storage spaces would be provided in the
Wendy Bloom, San Francisco State University
September 14, 2016
Page 6 of 30
building. Approximately 12 Class 1 or Class II bicycle parking spaces would also be provided in the
vicinity of the Creative Arts replacement building and concert hall.
The Project will include direct bicycle and pedestrian access from Block 1 to paths accessing the
campus core, pedestrian bulb outs and wider sidewalks consistent with the Better Streets Plan,
improved crosswalks and new access ramps. The Project is directly accessible to 19th Avenue and
the M Line as well as Routes 28/28R, 29 and 57. Additionally, the Project is by nature a TDM
strategy to reduce vehicle trips as it relocates students who would otherwise live off-campus into
on-campus housing.
Parking will be provided in the basement of the new student housing/mixed-use building on
Holloway Avenue and will serve SF State affiliates, concert hall events, and visitors to campus.
Student residential parking will be limited to accessible spaces. Consistent with the 2007 CMP, the
parking on Holloway will relocate a portion of the campus parking supply to the perimeter of
campus, removing existing parking along Tapia Drive and from on-campus lots, and will
constitute no net increase in the overall campus parking supply.
The absence of available parking spaces, the available alternatives to vehicular travel (transit,
bicycling, and walking), and the dense pattern of urban development would induce many drivers
to seek other modes of travel or change their overall travel behavior. Any such resulting shifts to
transit service in particular would be in keeping with the City’s “Transit First” policy. The City’s
Transit First Policy (CCSF 2007) provides that parking policies for areas well-served by public
transit, such as the SF State campus, be designed to encourage travel by public transportation
and alternative transportation. The table below provides a summary of the key elements of the
Project.
Wendy Bloom, San Francisco State University
September 14, 2016
Page 7 of 30
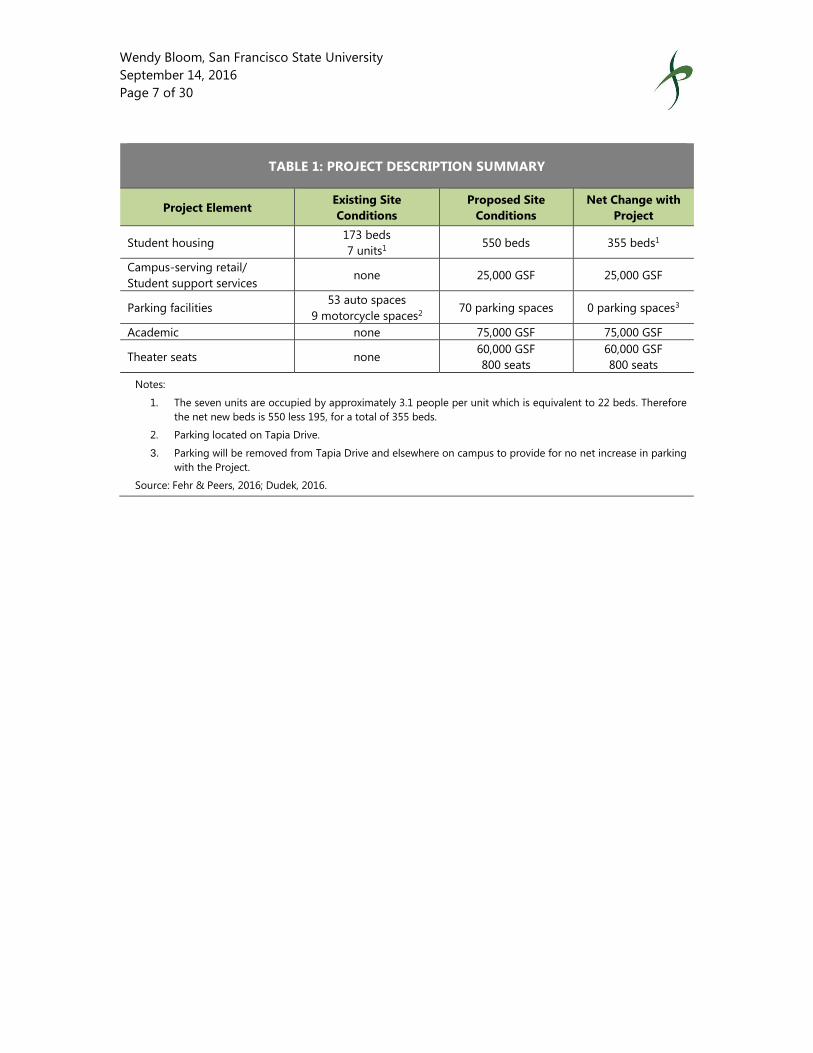
TABLE 1: PROJECT DESCRIPTION SUMMARY
Project Element Existing Site
Conditions
Proposed Site
Conditions
Net Change with
Project
Student housing 173 beds
7 units1 550 beds 355 beds1
Campus-serving retail/
Student support services none 25,000 GSF 25,000 GSF
Parking facilities 53 auto spaces
9 motorcycle spaces2 70 parking spaces 0 parking spaces3
Academic none 75,000 GSF 75,000 GSF
Theater seats none 60,000 GSF
800 seats
60,000 GSF
800 seats
Notes:
1. The seven units are occupied by approximately 3.1 people per unit which is equivalent to 22 beds. Therefore
the net new beds is 550 less 195, for a total of 355 beds.
2. Parking located on Tapia Drive.
3. Parking will be removed from Tapia Drive and elsewhere on campus to provide for no net increase in parking
with the Project.
Source: Fehr & Peers, 2016; Dudek, 2016.
TAPIA DR
San FranciscoState
University
Student Housing/Mixed Use
Creative Arts Building & Concert Hall
Bike
Pat
h To
Ston
esto
wn
Gal
ler i
a
30 ft
20 ft
90 ft130 ft
N:\P
roje
cts\
2016
_Pro
ject
s\S
F16-
0881
_SFS
U H
ollo
way
Mix
ed-U
se\G
raph
ics\
GIS
\MX
D\fi
g1_a
ug22
.mxd
Figure 1
Project Site and Existing Transportation Conditions
0 1000Feet
N
Project Sites
Class 2 Bicycle Facilities
Class 1 Bicycle Facilities
Muni Light Rail Station
Muni Bus Stop
Passenger Loading Zone
Continental Yellow Crosswalk
Standard Crosswalk
Class 3 Bicycle Facilities Commercial Loading Zone
57
57
57
57
29
29
28/28R28/28R/29
M Ocean View
Note: Crosswalks only shown along Holloway Avenueand Font Boulevard for pedestrian access to campusnear the Project Sites.
Wendy Bloom, San Francisco State University
September 14, 2016
Page 9 of 30
EXISTING CONDITIONS
ROADWAY NETWORK
As shown in Figure 1, the Project site is located to the west of the California State Route 1 (CA
SR-1)/19th Avenue at its intersection with Holloway Avenue. The student housing/mixed-use
building site is located to the immediate west of this intersection and the Creative Arts building
and concert hall site is located at the intersection of Holloway Avenue and Font Boulevard,
approximately 0.3 mile from 19th Avenue.
19th Avenue is a north-south arterial road with three travel lanes in each direction and on-street
parking and sidewalks on both sides. Muni light rail lines travel through the center of 19th Avenue
in both directions in a dedicated right-of-way. 19th Avenue provides the primary north-south
connection between the west side of San Francisco and I-280. I-280 is located approximately one
mile away and provides the primary regional connection to the Project site.
Holloway Avenue is a two-way east-west road that provides primary local access to the Project
site. Holloway Avenue has one travel lane in each direction, a narrow concrete median, on-street
parking, and sidewalks, and Class 2 bicycle facilities (i.e. painted bike lanes).
Adjacent to the Creative Arts building and concert hall site, Font Boulevard is a two-way
northwest-southeast road with one wide travel lane in each direction, angled parking on both
sides, and a wide planted median and standard concrete sidewalks on both sides.
Tapia Drive is a one-way neighborhood street with one travel lane and one lane of on-street
parking on both sides adjacent to the Creative Arts building and concert hall site. Tapia Drive is
northbound north of Holloway Avenue and westbound east of Font Boulevard. From Holloway
Avenue, Tapia Drive can only be accessed from the westbound direction.
Adjacent to the student housing/mixed-use building site, Varela Avenue and Cardenas Avenue
are neighborhood streets with one travel lane in each direction as well as on-street parking and
sidewalks on both sides. Serrano Drive is also a neighborhood street with one-way operations
(westbound) between Varela Avenue and Cardenas Avenue. Between Cardenas Avenue and
Arellano Avenue, Serrano Drive is two-way with one travel lane in each direction, angled parking
on both sides and sidewalks on both sides.

Wendy Bloom, San Francisco State University
September 14, 2016
Page 10 of 30
The intersection of 19th Avenue and Holloway Avenue is signalized and includes marked white
standard crossings with push-buttons and signals with countdowns for pedestrians. The
intersection of Holloway Avenue, Tapia Drive (northbound) and Font Boulevard has a traffic circle
with marked yellow continental pedestrian crossings. There is another traffic circle at the
intersection of Font Boulevard and Tapia Drive (westbound), with marked yellow continental
crossings across the northeast and southeast legs of the intersection, across Tapia Drive and Font
Boulevard, respectively; all other crossings are unmarked.
Traffic Operating Conditions
Field observations of current traffic conditions on Holloway Avenue, Font Boulevard and Tapia
Drive around the Project site were conducted by Fehr & Peers on Tuesday, May 24th, 2016, during
the evening peak period (4:00 PM – 6:00PM).
During the weekday evening peak period, low-to-moderate vehicle volumes and congestion were
observed on Holloway Avenue and Font Boulevard whereas low vehicle volumes were observed
on Tapia Drive and the neighborhood streets adjacent to the student housing/mixed-use building
site. Higher vehicle volumes and congestion were observed on 19th Avenue, consistent with
findings from the 2007 CMP EIR.
TRANSIT NETWORK
Transit services near the Project site are shown in Figure 1. Primary public transit access to the
Project site is provided by San Francisco Municipal Railway (“Muni”) bus and light rail services.
Four Muni bus routes run in proximity to the Project site: 28/28R 19th Avenue, 29 Sunset, 57
Parkmerced and 91 Owl. Bus stops nearest to the Project site are located at 19th Avenue/Holloway
Avenue (serving the 28/28R 19th Avenue, 29 Sunset and 91 Owl), Crespi Drive/Varela Avenue
(serving the 29 Sunset), Font Boulevard/Tapia Drive (serving the 57 Parkmerced) and Font
Boulevard/Arballo Drive (serving the 57 Parkmerced). The M Ocean View Muni light rail line also
runs near the Project site, with a stop on the north side of the 19th Avenue/Holloway Avenue
intersection, in the center of 19th Avenue’s right-of-way. Additionally, the Daly City and Balboa
BART stations are approximately 1.5 miles and 2.0 miles, respectively, away from the Project site
and serve the four BART lines running through San Francisco: Richmond-SFO/Millbrae,
Pittsburg/Baypoint-SFO/Millbrae, Dublin/Pleasanton-Daly City, and Fremont-Daly City.
The northbound and southbound bus stops at 19th Avenue/Holloway Avenue (serving the 28/28R
19th Avenue, 29 Sunset and 91 Owl) are both located on the north side of the intersection.

Wendy Bloom, San Francisco State University
September 14, 2016
Page 11 of 30
Notably, the 29 Sunset south/eastbound stops are located east of the Crespi Drive/Varela Avenue
intersection, at a traffic circle, and nearside, south of the 19th Avenue/Holloway Avenue
intersection. The northbound and southbound bus stops for the 57 Parkmerced are located at
opposite sides of the traffic circles on Font Boulevard.
Existing Muni Ridership Data
The availability of existing local and regional transit service near the Project site was analyzed
using the screenline method to determine if screenline corridors that serve the SF State area have
adequate capacity to serve demand and operate at or below the 85 percent capacity utilization
threshold.
Table 2 presents the existing ridership and capacity utilization at the maximum loading point for
the routes crossing the Southwest Screenline. All corridors within the screenline currently operate
under the 85 percent performance standard.
TABLE 2: MUNI DOWNTOWN SCREENLINES – SOUTHWEST SCREENLINE – EXISTING
CONDITIONS
Outbound Screenline PM Peak Hour*
Ridership
PM Peak Hour*
Capacity
PM Peak Hour*
Capacity Utilization
Subway lines 4,904 6,164 80%
Haight/Noriega 977 1,554 63%
Other lines 555 700 79%
Southwest Screenline Total 6,435 8,418 76%
* PM peak hour; outbound (i.e. away from Downtown) only
Source: San Francisco Planning Department, May 2015; Fehr & Peers, 2016.
Proposed Changes to Transit Service
In March 2014, the SFMTA Board of Directors approved many recommendations that emerged
from the Muni Forward Program, a review of the City’s public transit system, and were designed
to make Muni service faster, more reliable, and more frequent. These recommendations include
new routes and route extensions, service-related capital improvements, more service on busy
routes, designation of rapid transit routes and travel time reduction proposals on those routes,
and elimination or consolidation of certain routes or route segments with low ridership. The Muni
Forward Implementation Strategy anticipates that many of the service improvements would be
implemented between 2016 and 2017, pending resource availability. Muni Forward proposes the
following changes for lines in the Project vicinity:
Wendy Bloom, San Francisco State University
September 14, 2016
Page 12 of 30
28(R) 19th Avenue (Rapid) – The 28 19th Avenue would increase frequency during AM
and PM peak from 10 to 9 minutes and during midday from 12 to 9 minutes. The 28R 19th
Avenue Rapid service would increase operations, operating seven days a week between
6:00 AM and 8:00 PM with 9 minute headways during the AM and PM peak periods. The
route for these two services would be modified near Fort Mason, by eliminating a section
on Laguna, Beach, Buchanan and Bay streets. In addition, new transit and pedestrian
bulbs are planned for the intersection of 19th Avenue/Holloway Avenue, near the Project
site.
29 Sunset – The 29 Sunset would increase in frequency during the AM peak from 9 to 8
minutes. The route has been modified (in 2014) so that buses make a left from Lincoln
Way to Crossover Drive (instead of a series of three right turns). In addition, part of the
route – on Geneva Avenue and Mission Street south of Ocean Avenue – would be
eliminated; buses would travel directly on Ocean Avenue.
Muni Subway Expansion Project
In addition, the San Francisco Municipal Transportation Agency (SFMTA) is studying options to
improve the M Ocean View Muni light rail line. In 2011, as part of Parkmerced’s Development
Agreement, an alternative was developed to extend the existing M-line into Parkmerced and add
an M-line crossing at 19th Avenue at Holloway Avenue. In 2015, as part of the Pre-Environmental
Study, another alternative was developed that would build a subway under 19th Avenue between
West Portal and Parkmerced and introduces a new transfer at SF State for the M- and J-lines.2 The
19th Avenue Transit Study (SFCTA 2014), developed for the Muni Subway Expansion Project
considers several alternatives for building a subway: Baseline, Longer Subway and Bridge, and
Shorter Subway and Tunnel. The alternatives studied for the M-line included simplifying the
crossing at 19th Avenue and Winston Avenue or 19th Avenue and Holloway, with a shorter
distance across the street and fewer light-rail tracks to cross. In addition, the Longer Subway and
Bridge alternative would add a new protected bike connection over Junipero Serra in the southern
part of the corridor as a part of the light-rail bridge, a connection seen as particularly important
for improving the bike connection between SF State and Daly City BART.
While the 19th Avenue Transit Study (SFCTA 2014) does include initial analysis of options for
improving transit connections to the Daly City BART station, the Study’s main focus was on
2 SFMTA (2016). 19th Avenue/M Ocean View Project Factsheet. Accessed at
https://www.sfmta.com/sites/default/files/projects/2016/factsheet_19thAve.pdf on 6/7/2016.
Wendy Bloom, San Francisco State University
September 14, 2016
Page 13 of 30
assessing the feasibility and benefits of grade-separating the M-Ocean View crossings of 19th
Avenue. All alternatives considered in the Study for the M-line include a trail track which would
enable a future extension of the light-rail to Daly City BART. However, because of the time
sensitive need to advance the grade-separation project as it relates to Parkmerced Development
Agreement timeline provisions, and because of the significant and independent benefit the grade
separation project would provide, the next phase of project development will focus exclusively on
advancing the grade-separation project, while leaving next steps on the question of Daly City
transit access upgrades as a future phase of work that could be turned to. The potential
improvements to the M line have not undergone environmental review yet.
BICYCLE & PEDESTRIAN FACILITIES
Pedestrian facilities within the vicinity of the Project site include sidewalks, crosswalks, directional
or diagonal curb ramps, pedestrian signals, and streetscape and landscape features (i.e. trees,
planters, street lighting). The intersection of 19th Avenue and Holloway Avenue is signalized and
includes marked white standard crossings with push-buttons and signals with countdowns for
pedestrians. The pedestrian crossings across Holloway Avenue at Varela Avenue, Cardenas
Avenue and Arellano Avenue are marked, standard crosswalks. However, the south leg of the
crossing at Holloway Avenue/Cardenas Avenue, across Cardenas Avenue, is not marked. The
marked crosswalks at the traffic circles on Font Boulevard – at Holloway Avenue/Tapia Drive and
at Arballo Drive/Tapia Drive – are high-visibility crosswalks, with yellow continental pattern
striping. However, only about half of the crossings at these two traffic circles are marked.
Crossings are generally not marked on neighborhood streets such as Varela Avenue, Cardenas
Avenue, Arellano Avenue and Serrano Drive.
There are Class 2 bicycle lanes in both directions on Holloway Avenue adjacent to the Project site,
between Font Boulevard and Junipero Serra Boulevard (Figure 1). Font Boulevard between
Holloway Avenue and Lake Merced Boulevard is designated as a Class 3 bicycle route that does
not have painted “sharrows.”
There are a number of bicycle parking facilities on the SF State campus. Near the Project site,
there are Class 2 bicycle racks (i.e. unsecured outdoor racks) adjacent to the existing Creative Arts
Building on Tapia Drive (where the road curves) and near the intersection of Font Boulevard and
the access road to the Village parking lot. These bicycle racks can accommodate 80 and 40
bicycles, respectively.
Wendy Bloom, San Francisco State University
September 14, 2016
Page 14 of 30
Existing pedestrian conditions were evaluated during field visits to the Project site during the
evening peak period (4:00 PM to 6:00 PM) on Tuesday, May 24, 2016. Pedestrian activity was
observed to be moderate along Holloway Avenue and Font Boulevard. Fewer pedestrians were
observed on Tapia Drive and the residential streets south of Holloway Avenue. Pedestrian activity
was observed to be higher at the 19th Avenue/Holloway Avenue intersection due to activity
surrounding the highly-used Muni bus stops on 19th Avenue and M Ocean View light rail station.
Few cyclists were observed traveling along Font Boulevard and Holloway Avenue during the
evening peak period. On Holloway Avenue, cyclists were observing using the bicycle lanes. One
cyclist was observed using the sidewalk on 19th Avenue at Holloway Avenue.
There are no near-term planned changes to bicycle and pedestrian infrastructure in the area,
aside from the Project’s proposed closure of Tapia Drive. The M-Line improvement project would
include new pedestrian and bicycle amenities such as a Class I mixed-use pathway on the west
side of 19th Avenue, wider sidewalks, and shorter and more frequent pedestrian crossings across
19th Avenue.
ON-STREET PARKING CONDITIONS
Fehr & Peers conducted on-street parking surveys in the vicinity of the Project site (within one
block of the Project site) on Holloway Avenue between 19th Avenue and Font Boulevard, Tapia
Drive between Holloway Avenue and Font Boulevard, Font Boulevard between Serrano Drive and
the campus access road to the Village/Mary Ward Hall, Serrano Drive between Varela Avenue and
Font Boulevard, Varela Avenue between Holloway Avenue and Serrano Drive, Crespi Drive
between Serrano Drive and Cardenas Avenue, Cardenas Avenue between Holloway Avenue and
Crespi Drive, and Arellano Avenue between Holloway Avenue and Serrano Drive. The survey was
conducted during a weekday evening peak period (4:00 PM to 6:00 PM), on Tuesday, May 24,
2016.
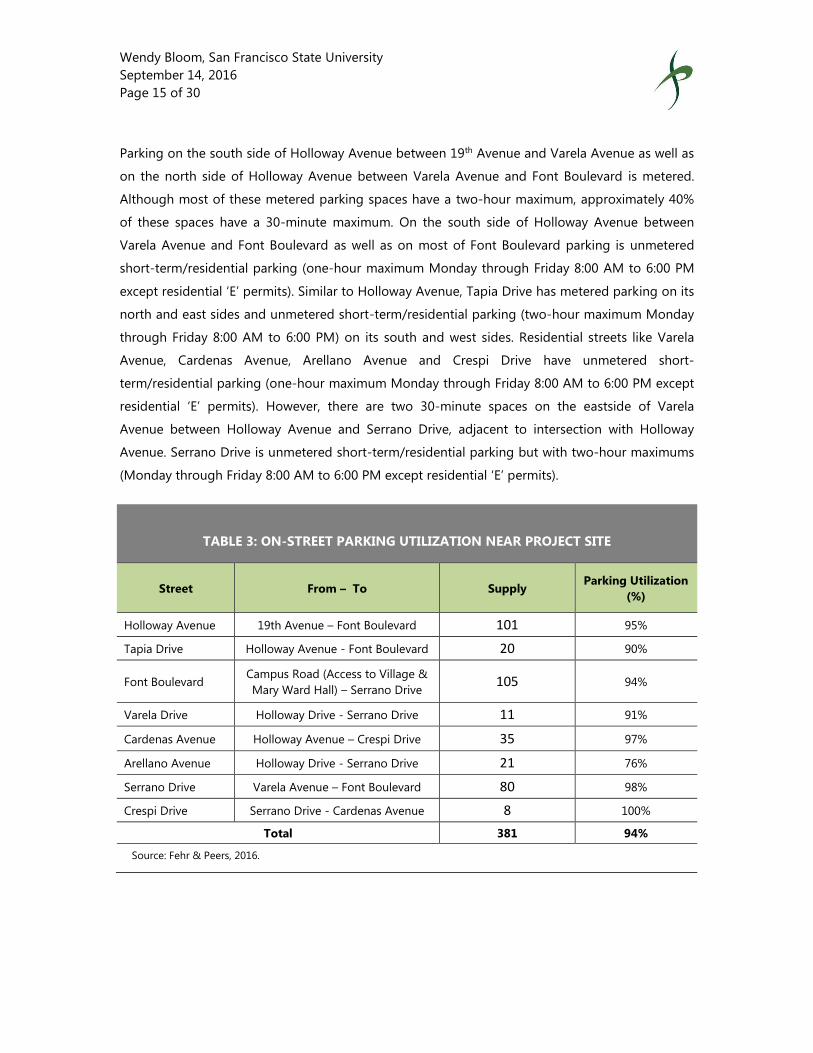
Table 3 presents the on-street parking supply and demand (occupancy) near the Project site by
street during the PM peak period. There are a total of 381 on-street parking spaces within one
block of the Project site, with the majority of spaces located on Holloway Avenue (101 spaces)
and Font Boulevard (105 spaces). In general, parking within one block of the Project site is highly
utilized, with an overall occupancy of 94% during the evening peak period. During the
observation period, a few parked cars appeared to be engaged in moving loading activities (i.e.
moving students out of student housing).
Wendy Bloom, San Francisco State University
September 14, 2016
Page 15 of 30
Parking on the south side of Holloway Avenue between 19th Avenue and Varela Avenue as well as
on the north side of Holloway Avenue between Varela Avenue and Font Boulevard is metered.
Although most of these metered parking spaces have a two-hour maximum, approximately 40%
of these spaces have a 30-minute maximum. On the south side of Holloway Avenue between
Varela Avenue and Font Boulevard as well as on most of Font Boulevard parking is unmetered
short-term/residential parking (one-hour maximum Monday through Friday 8:00 AM to 6:00 PM
except residential ‘E’ permits). Similar to Holloway Avenue, Tapia Drive has metered parking on its
north and east sides and unmetered short-term/residential parking (two-hour maximum Monday
through Friday 8:00 AM to 6:00 PM) on its south and west sides. Residential streets like Varela
Avenue, Cardenas Avenue, Arellano Avenue and Crespi Drive have unmetered short-
term/residential parking (one-hour maximum Monday through Friday 8:00 AM to 6:00 PM except
residential ‘E’ permits). However, there are two 30-minute spaces on the eastside of Varela
Avenue between Holloway Avenue and Serrano Drive, adjacent to intersection with Holloway
Avenue. Serrano Drive is unmetered short-term/residential parking but with two-hour maximums
(Monday through Friday 8:00 AM to 6:00 PM except residential ‘E’ permits).
TABLE 3: ON-STREET PARKING UTILIZATION NEAR PROJECT SITE
Street From – To Supply Parking Utilization
(%)
Holloway Avenue 19th Avenue – Font Boulevard 101 95%
Tapia Drive Holloway Avenue - Font Boulevard 20 90%
Font Boulevard Campus Road (Access to Village &
Mary Ward Hall) – Serrano Drive 105 94%
Varela Drive Holloway Drive - Serrano Drive 11 91%
Cardenas Avenue Holloway Avenue – Crespi Drive 35 97%
Arellano Avenue Holloway Drive - Serrano Drive 21 76%
Serrano Drive Varela Avenue – Font Boulevard 80 98%
Crespi Drive Serrano Drive - Cardenas Avenue 8 100%
Total 381 94%
Source: Fehr & Peers, 2016.

Wendy Bloom, San Francisco State University
September 14, 2016
Page 16 of 30
LOADING CONDITIONS
Fehr & Peers observed passenger loading activities at the Project site during the May 24th site
visit. As indicated in Figure 1, there are two passenger loading zones within one block of the
Project site, located at:
North side of Holloway Avenue between Varela Avenue and 19th Avenue: 130 feet long,
active from 7:00 AM to 10:00 PM Monday-Friday;
North side of Holloway Avenue between Tapia Drive and Arellano Avenue: 90 feet long,
active between from 8:00 AM to 11:00 PM daily.
At the time of observations, no loading activities were observed at these two locations. However,
passenger loading (pick-up/drop-off) was observed at the location of two ADA parking spaces on
the northeast side of the traffic circle on Font Boulevard at Tapia Drive/Arballo Drive.
A commercial loading zone was observed on the east side of Cardenas Avenue (30 feet long).
There is also a commercial loading zone located on campus at the northeast corner of Tapia Drive
(20 feet long) for the existing College of Liberal and Creative Arts. At the time of observations, no
commercial loading activities were observed.
METHODOLOGY
The analysis presented herein is based on the methodology set forth in the CSU’s TIS Manual and
the SF Guidelines.
The CSU TIS Manual states that a full TIS, including Level of Service (LOS) analysis, would be
required if an assessment of the project’s trip generation indicated potential new significant
impacts to traffic conditions based on the CEQA Guidelines Appendix G checklist. As presented
later in this memorandum, the Project’s trip generation would not exceed the 2007 CMP EIR Trip
Envelope, which indicates no potential new significant impacts to traffic conditions. Additionally,
the number of vehicle trips generated by the campus in the PM peak hour has declined due to an
effective TDM program and changing demographics and population. Therefore, even with event
day conditions for the Project, the number of vehicle trips generated would not result in an
increase in PM peak hour vehicle trips over the 2007 CMP EIR baseline conditions. Thus, a LOS
analysis was not conducted for the Project.

Wendy Bloom, San Francisco State University
September 14, 2016
Page 17 of 30
Additionally, this memorandum presents a Downtown transit screenline analysis as described in
the SF Guidelines. A screenline is an imaginary line on a map, composed of one or more straight
line segments. Various screenlines were created by the City of San Francisco that intercept groups
of transit lines at or near their maximum load point. The SF Guidelines establishes that a project
would have a significant effect on the transit provider if project-related transit trips would cause
the capacity utilization standard to be exceeded during the peak hour at those screenlines. For
the Muni transit screenlines, the capacity utilization standard is 85 percent.
The impact analysis section presented in this memorandum reviews the potential transportation
impacts due to the Project and compares them to what was presented in the 2007 CMP EIR. The
2007 CMP EIR found that the increased campus population by 2020 would result in a significant
traffic impact to two study intersections and a significant transit impact. These significant impacts
were found to be less than significant following implementation of several mitigation measures,
including a Transportation Demand Management program and an associated trip survey and
monitoring program that includes extensive coordination between SF State, BART, and SFMTA.
TRAVEL DEMAND ANALYSIS
The section presents the Project’s travel demand and the changes in SF State’s campus travel
demand between 2007 and 2016 on the 2020 Trip Envelope presented in the 2007 CMP EIR.
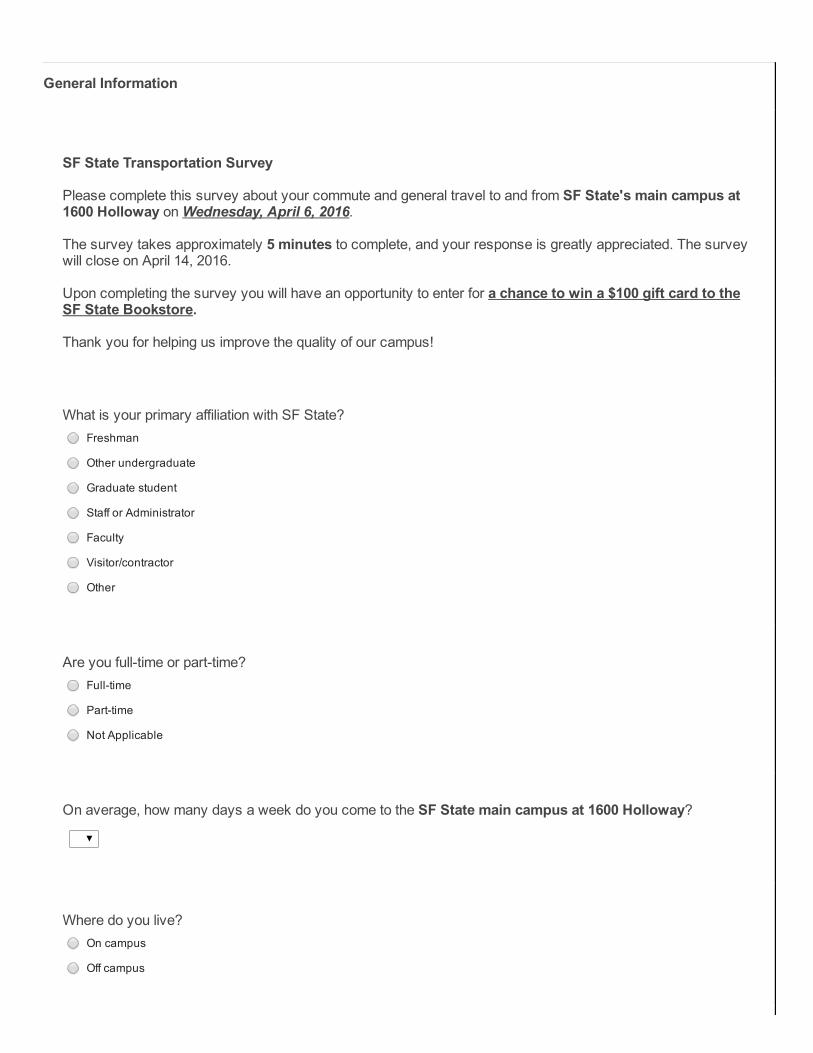
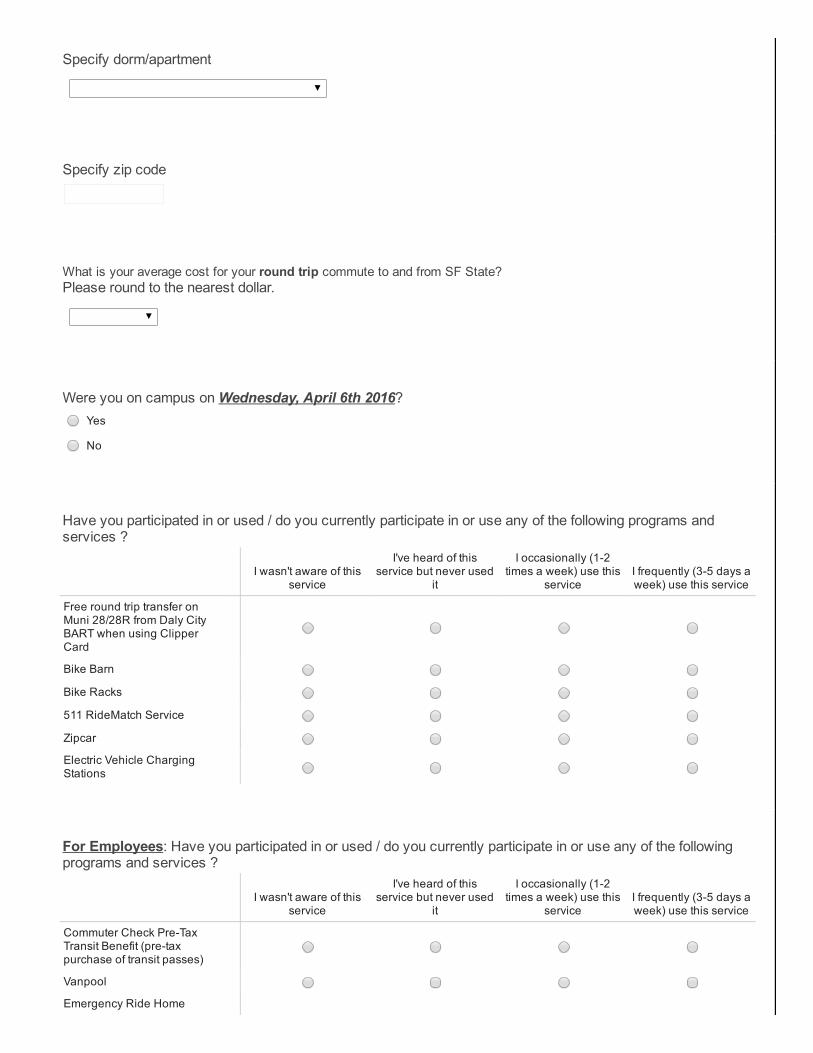
SF State has conducted an online Travel Survey at least every three years starting in April 2008;
the latest survey having been conducted in April 2016. The survey asked SF State students, faculty,
and staff (both on and off-campus residents) a series of questions about their commutes and
general travel behavior for trips to and from SF State’s campus, including trip time and mode of
travel to/from campus. The 2016 Travel Survey instrument is presented in Attachment A.
Nelson/Nygaard prepared a report presenting the 2016 Travel Survey results, which is included in
Attachment B.
STUDENT HOUSING/MIXED-USE BUILDING TRIP GENERATION
The Project’s new on-campus student housing/mixed-use building would provide a net increase
of 382 beds. These units are expected to be occupied by students that are currently living off-
campus. PM peak hour trip rates and mode splits for the new student housing were estimated for
students living both on- and off-campus based on the results of the 2016 Travel Survey. This
summary is inclusive of both internal trips (e.g. a student traveling from on-campus student

Wendy Bloom, San Francisco State University
September 14, 2016
Page 18 of 30
housing to an evening class) and external trips (e.g. a staff member traveling home from the
concert hall). Table 4 presents the net change in trips by mode to/from and within campus during
the PM peak hour that would result from the addition of the 382 on-campus beds. With respect
to external campus trips - vehicle and transit trips would decrease as students currently living off-
campus move on-campus while walk and bike trips within the campus would increase. Overall, the
total number of person trips generated by on-campus students during the PM peak hour is
slightly less than for off-campus students. In net, the Project’s new on-campus student
housing/mixed-use building would reduce trips external to the campus by 18 vehicle trips and 39
public transit trips.
TABLE 4: PM PEAK HOUR STUDENT HOUSING TRIP GENERATION
Existing
355 Off-Campus
Students
Project
355 On-Campus
Students
Net Change1
Trips Percent Trips Percent Trips
Total Person Trips 96 100.0% 85 100.0% -11
Trip Rate2 0.27 - 0.24 - -
Drive Alone, Motorcycle 17 17.9% 0 0.5% -17
Carpool3 1 1.4% 0 0.0% -1
Taxi, Transportation Network
Company (TNC), Pick up/Drop off4 4 3.7% 3 3.8% -1
Public Transit 54 55.9% 15 18.1% -39
Walk/Bike 20 21.1% 60 70.0% 40
Other5 0 0.0% 6 7.6% 6
Vehicle Trips3 21 - 3 - -18
Public Transit Trips6 54 - 15 - -39
Notes:
1. Net change in trip generation due to the Project, i.e. trips generated by 355 students living on-campus minus
trips generated by 355 students living off-campus.
2. The 2016 Travel Survey asked about trip making behavior during the two hour PM peak period for a typical day
on campus. Therefore, the PM peak hour trip rates shown here include the following assumptions: the PM peak
hour generates 60 percent of the trips from the two-hour PM peak period (based on the peak hour factors in
SF-CHAMP, the City of San Francisco’s travel demand model), and 80 percent of students will be present on-
campus on any one day (based on the responses to the SF State 2016 Travel Survey and survey data from other
university campuses in San Francisco).
3. Vehicle trips include drive alone, motorcycle, carpool, and taxi/TNC/pick-up and drop-off. Vehicle occupancy for
carpool trips is 2.2 people per vehicle, based on cordon counts performed on April 6, 2016. Because so few
students are currently using carpool, this number was rounded down for a conservative assessment.
4. Transportation Network Companies, or TNCs, connect paying passengers with drivers who transport people in
their own private vehicles. Examples include Lyft, Uber, and Cabify.
5. Mode for “Other” trips were not specified by 2016 Travel Survey respondents. These are assumed to be people
using skateboards or other active modes typically used on university campuses. i.e. not vehicle or transit trips.
6. Public transit trips include the SF State campus shuttle.
Source: Fehr & Peers, 2016; Nelson/Nygaard, 2016.
Wendy Bloom, San Francisco State University
September 14, 2016
Page 19 of 30
The mixed-use component of the Project includes campus-serving retail, student support services,
bike storage, study rooms, a copy center, and retail dining. These land uses supplement or replace
existing on-campus services and primarily cater to SF State affiliates, although the retail options
will also be open to nearby residents of the adjacent Parkmerced neighborhood (similar to
existing on-campus retail services). As a result of these new on-campus services, SF State affiliates
may choose to stay on campus for activities they would have otherwise done off campus. This
effect may decrease the number of trips from campus. In contrast, nearby residents may travel to
these new on-campus services whereas they would not previously have traveled to campus. These
effects have not been quantified as part of this analysis, although patrons of the businesses are
expected to be from the campus or within walking or biking distance in the adjacent
neighborhood. Thus, the campus-serving retail and student support services are assumed not to
generate new vehicle or transit trips to campus.
CREATIVE ARTS BUILDING AND CONCERT HALL TRIP GENERATION
The Project will also include the construction of the Creative Arts replacement building. This
building will provide a new home for the existing BECA program. There are not currently any
plans to use the old Creative Arts building to add new programs, students, staff, or faculty to the
existing services provided at SF State. Therefore, this building would not increase the enrollment
or full-time employees above current levels nor result in an increase in the number of trips
to/from campus.
The Project will also include an 800-seat concert hall that would provide hands-on learning for
BECA students and would also serve as a performance venue and state of the art recording studio.
On a typical day, the concert hall will function as a teaching and learning environment for existing
BECA students. The addition of the concert hall will not result in additional students or faculty and
staff on non-event days. Therefore, when there are no events at the concert hall, the concert hall
will not result in additional vehicle trips.
Events at the concert hall will vary in size and purpose. Some events will cater only to students
while others will have a regional draw. In order to calculate the trip generation for the concert hall
on an event day, a large event scenario was assumed based on input from SF State. The large
event scenario assumes full capacity, or 800 attendees, with 85% of attendees coming from off-
Wendy Bloom, San Francisco State University
September 14, 2016
Page 20 of 30
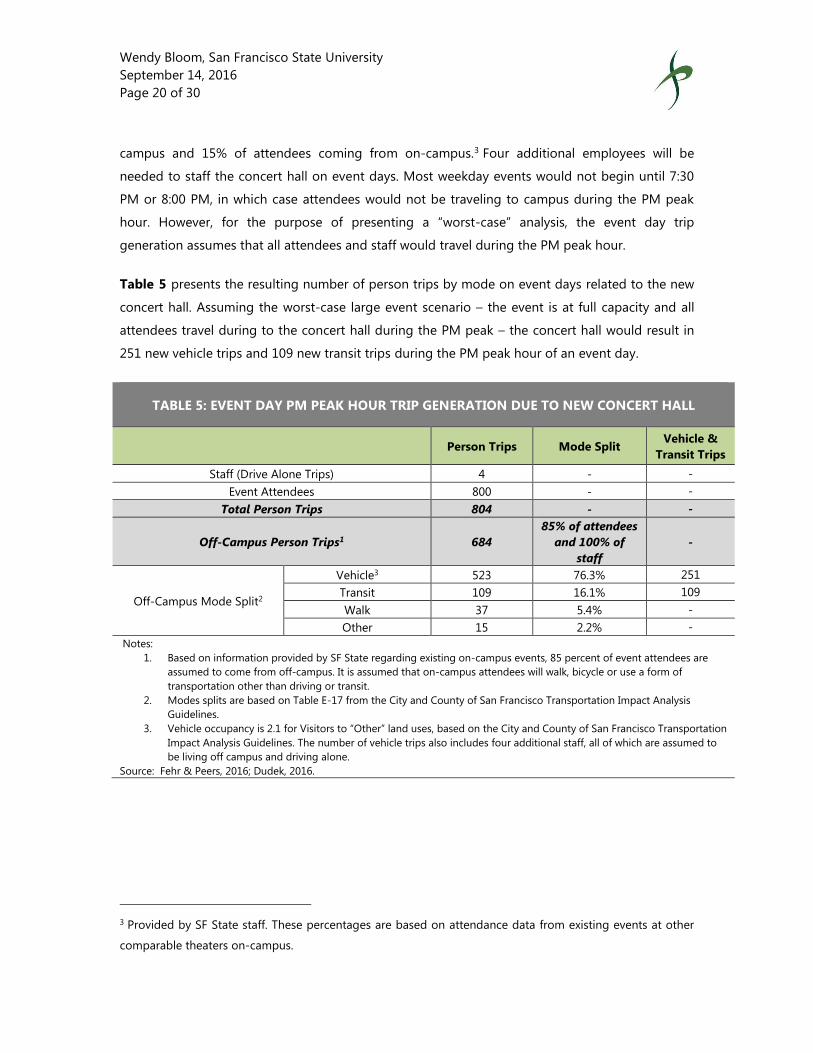
campus and 15% of attendees coming from on-campus.3 Four additional employees will be
needed to staff the concert hall on event days. Most weekday events would not begin until 7:30
PM or 8:00 PM, in which case attendees would not be traveling to campus during the PM peak
hour. However, for the purpose of presenting a “worst-case” analysis, the event day trip
generation assumes that all attendees and staff would travel during the PM peak hour.
Table 5 presents the resulting number of person trips by mode on event days related to the new
concert hall. Assuming the worst-case large event scenario – the event is at full capacity and all
attendees travel during to the concert hall during the PM peak – the concert hall would result in
251 new vehicle trips and 109 new transit trips during the PM peak hour of an event day.
TABLE 5: EVENT DAY PM PEAK HOUR TRIP GENERATION DUE TO NEW CONCERT HALL
Person Trips Mode Split Vehicle &
Transit Trips
Staff (Drive Alone Trips) 4 - -
Event Attendees 800 - -
Total Person Trips 804 - -
Off-Campus Person Trips1 684
85% of attendees
and 100% of
staff
-
Off-Campus Mode Split2
Vehicle3 523 76.3% 251
Transit 109 16.1% 109
Walk 37 5.4% -
Other 15 2.2% -
Notes:
1. Based on information provided by SF State regarding existing on-campus events, 85 percent of event attendees are
assumed to come from off-campus. It is assumed that on-campus attendees will walk, bicycle or use a form of
transportation other than driving or transit.
2. Modes splits are based on Table E-17 from the City and County of San Francisco Transportation Impact Analysis
Guidelines.
3. Vehicle occupancy is 2.1 for Visitors to “Other” land uses, based on the City and County of San Francisco Transportation
Impact Analysis Guidelines. The number of vehicle trips also includes four additional staff, all of which are assumed to
be living off campus and driving alone.
Source: Fehr & Peers, 2016; Dudek, 2016.
3 Provided by SF State staff. These percentages are based on attendance data from existing events at other
comparable theaters on-campus.
Wendy Bloom, San Francisco State University
September 14, 2016
Page 21 of 30
PROJECT TRIP GENERATION SUMMARY
The total number of net new trips generated by the Project (student housing/mixed-use building
and Creative Arts replacement building and concert hall) is shown in Table 6 below. The Project
would generate a total of 233 net new vehicle trips and 70 net new public transit trips during the
PM peak hour on an event day assuming the worst-case large event scenario described above. On
typical, non-event days, the Project would contribute to further reducing vehicle trips on campus
during the PM peak hour, as existing students living off campus relocate to the student
housing/mixed use building.
TABLE 6: PM PEAK HOUR PROJECT TRIP GENERATION
Student
Housing/Mixed-
Use Net New
Trips1
Creative Arts
Building and
Concert Hall Net
New Trips2
EVENT DAY
Net New Trips
TYPICAL DAY
Net New Trips
Person Trips -11 804 793 -11
Vehicle Trips3 -18 251 233 -18
Public Transit Trips -39 109 70 -39
Walk/Bike4 40 37 77 40
Other4 6 15 21 6
Notes:
1. As presented in Table 4.
2. As presented in Table 5.
3. Vehicle occupancy is 2.2 for carpool trips to/from the new student housing and 2.1 for visitor trips to concert
hall, as presented in Tables 4 and 5.
4. Mode split was obtained from two different sources and each categorizes mode split differently. The housing
land use mode split was used from the 2016 Travel Survey. The concert hall mode split was obtained from the
SF Guidelines using “visitor trips” because campus specific mode split for events was not collected in the 2016
Travel Survey. Due to the differences in how mode split is collected, this row includes walking and bicycle trips
for the student housing/mixed-use land use, whereas it only includes walking trips for the Creative Arts Building
land use. Biking trips are characterized under “other” and cannot be extracted based on available data.
Source: Fehr & Peers, 2016; Dudek, 2016; Nelson Nygaard, 2016.
CMP TRIP ENVELOPE
The 2007 CMP EIR estimated that the projected campus expansion by 2020 would result in an
additional 466 vehicle trips and 387 public transit trips during the PM peak hour by 2020. The
2007 CMP EIR evaluated transportation impacts based on this “CMP Trip Envelope” for vehicle
and transit trips. However, since 2007, the campus population has decreased from 33,612 to
33,563 students, faculty, and staff. In addition, fewer students, staff, and faculty currently drive to
campus compared to 2007. The combination of these two factors has reduced the number of
Wendy Bloom, San Francisco State University
September 14, 2016
Page 22 of 30
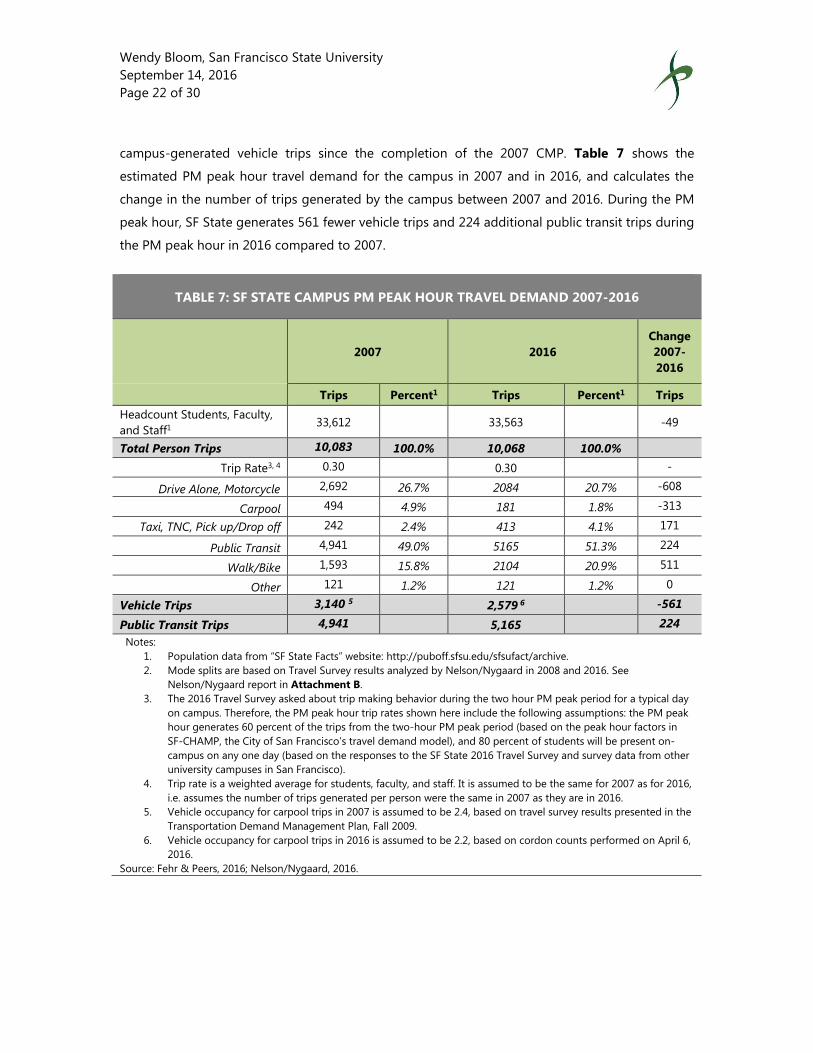
campus-generated vehicle trips since the completion of the 2007 CMP. Table 7 shows the
estimated PM peak hour travel demand for the campus in 2007 and in 2016, and calculates the
change in the number of trips generated by the campus between 2007 and 2016. During the PM
peak hour, SF State generates 561 fewer vehicle trips and 224 additional public transit trips during
the PM peak hour in 2016 compared to 2007.
TABLE 7: SF STATE CAMPUS PM PEAK HOUR TRAVEL DEMAND 2007-2016
2007 2016
Change
2007-
2016
Trips Percent1 Trips Percent1 Trips
Headcount Students, Faculty,
and Staff1 33,612 33,563 -49
Total Person Trips 10,083 100.0% 10,068 100.0%
Trip Rate3, 4 0.30 0.30 -
Drive Alone, Motorcycle 2,692 26.7% 2084 20.7% -608
Carpool 494 4.9% 181 1.8% -313
Taxi, TNC, Pick up/Drop off 242 2.4% 413 4.1% 171
Public Transit 4,941 49.0% 5165 51.3% 224
Walk/Bike 1,593 15.8% 2104 20.9% 511
Other 121 1.2% 121 1.2% 0
Vehicle Trips 3,140 5
2,579 6
-561
Public Transit Trips 4,941
5,165
224
Notes:
1. Population data from “SF State Facts” website: http://puboff.sfsu.edu/sfsufact/archive.
2. Mode splits are based on Travel Survey results analyzed by Nelson/Nygaard in 2008 and 2016. See
Nelson/Nygaard report in Attachment B.
3. The 2016 Travel Survey asked about trip making behavior during the two hour PM peak period for a typical day
on campus. Therefore, the PM peak hour trip rates shown here include the following assumptions: the PM peak
hour generates 60 percent of the trips from the two-hour PM peak period (based on the peak hour factors in
SF-CHAMP, the City of San Francisco’s travel demand model), and 80 percent of students will be present on-
campus on any one day (based on the responses to the SF State 2016 Travel Survey and survey data from other
university campuses in San Francisco).
4. Trip rate is a weighted average for students, faculty, and staff. It is assumed to be the same for 2007 as for 2016,
i.e. assumes the number of trips generated per person were the same in 2007 as they are in 2016.
5. Vehicle occupancy for carpool trips in 2007 is assumed to be 2.4, based on travel survey results presented in the
Transportation Demand Management Plan, Fall 2009.
6. Vehicle occupancy for carpool trips in 2016 is assumed to be 2.2, based on cordon counts performed on April 6,
2016.
Source: Fehr & Peers, 2016; Nelson/Nygaard, 2016.
Wendy Bloom, San Francisco State University
September 14, 2016
Page 23 of 30
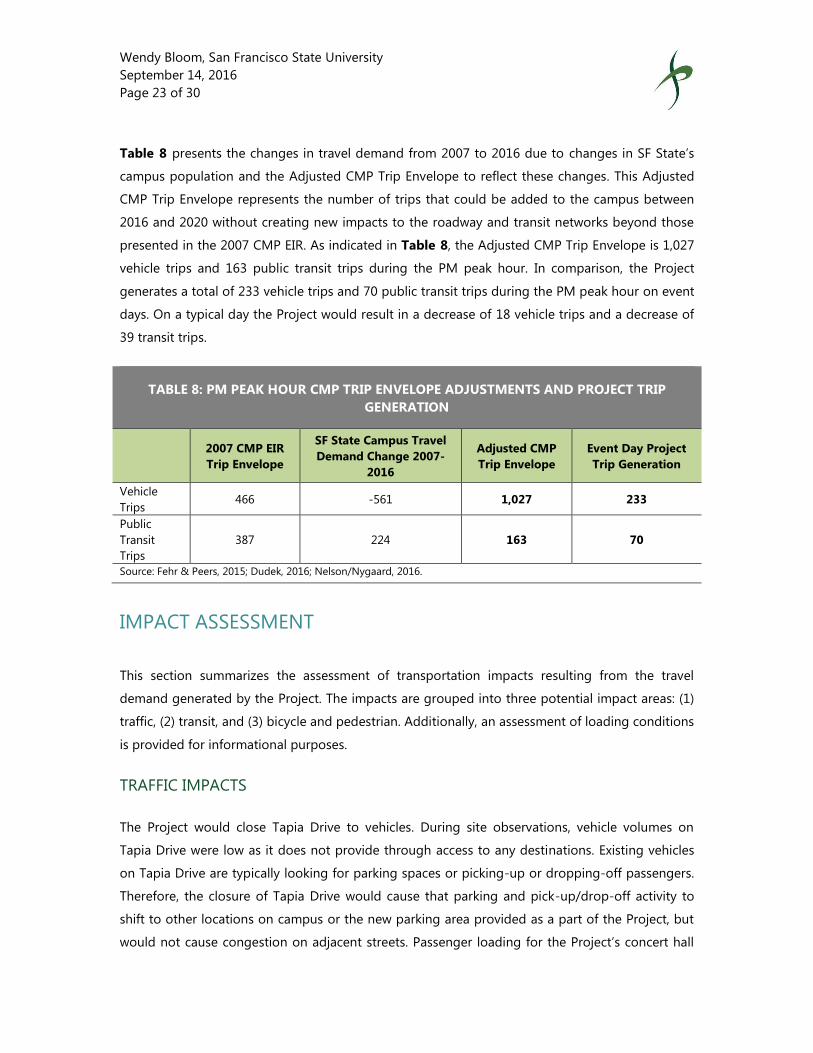
Table 8 presents the changes in travel demand from 2007 to 2016 due to changes in SF State’s
campus population and the Adjusted CMP Trip Envelope to reflect these changes. This Adjusted
CMP Trip Envelope represents the number of trips that could be added to the campus between
2016 and 2020 without creating new impacts to the roadway and transit networks beyond those
presented in the 2007 CMP EIR. As indicated in Table 8, the Adjusted CMP Trip Envelope is 1,027
vehicle trips and 163 public transit trips during the PM peak hour. In comparison, the Project
generates a total of 233 vehicle trips and 70 public transit trips during the PM peak hour on event
days. On a typical day the Project would result in a decrease of 18 vehicle trips and a decrease of
39 transit trips.
TABLE 8: PM PEAK HOUR CMP TRIP ENVELOPE ADJUSTMENTS AND PROJECT TRIP
GENERATION
2007 CMP EIR
Trip Envelope
SF State Campus Travel
Demand Change 2007-
2016
Adjusted CMP
Trip Envelope
Event Day Project
Trip Generation
Vehicle
Trips 466 -561 1,027 233
Public
Transit
Trips
387 224 163 70
Source: Fehr & Peers, 2015; Dudek, 2016; Nelson/Nygaard, 2016.
IMPACT ASSESSMENT
This section summarizes the assessment of transportation impacts resulting from the travel
demand generated by the Project. The impacts are grouped into three potential impact areas: (1)
traffic, (2) transit, and (3) bicycle and pedestrian. Additionally, an assessment of loading conditions
is provided for informational purposes.
TRAFFIC IMPACTS
The Project would close Tapia Drive to vehicles. During site observations, vehicle volumes on
Tapia Drive were low as it does not provide through access to any destinations. Existing vehicles
on Tapia Drive are typically looking for parking spaces or picking-up or dropping-off passengers.
Therefore, the closure of Tapia Drive would cause that parking and pick-up/drop-off activity to
shift to other locations on campus or the new parking area provided as a part of the Project, but
would not cause congestion on adjacent streets. Passenger loading for the Project’s concert hall

Wendy Bloom, San Francisco State University
September 14, 2016
Page 24 of 30
would be provided in the existing Holloway Avenue passenger-loading zone (see Figure 1) or
along Font Boulevard, since it is a wide street and through vehicles would be able to maneuver
around double-parked vehicles.
As presented in the travel demand analysis section, the Project would add 233 net new vehicle
trips during the PM peak hour, which is less than the Adjusted CMP Trip Envelope of 1,027 vehicle
trips. This increase in vehicle trips would occur during Concert Hall event days only (up to 80 per
year or about 7 per month), and only in the rare occasion when there is an early evening, full-
capacity event that attracts mostly off-campus attendees. Most evening events are expected to
begin at 7:30 or 8pm, after the PM peak hour. On most days during the year, the Project would
result in fewer vehicle trips to SF State’s campus. Additionally, the number of vehicle trips
generated by the campus has declined since the 2007 base year. Therefore, even under the event
day scenario, the Project and the campus as a whole would still be generating fewer trips than the
2007 base year. Thus, the Project will not result in any additional vehicle traffic or significant traffic
impacts beyond those identified in the 2007 CMP EIR.
TRANSIT IMPACTS
As presented in Table 8, the Project would add 70 net new public transit trips during the PM peak
hour, which is less than the Adjusted CMP Trip Envelope of 163 public transit trips during the PM
peak hour. Therefore, the Project would not result in any additional transit ridership beyond that
identified in the 2007 CMP EIR.
In addition to the comparison to the Adjusted CMP Trip Envelope, the Project’s contribution to
Downtown transit screenlines were evaluated using the SF Guidelines methodology to determine
whether the Project would cause an existing transit line to exceed its capacity. The SF Guidelines
methodology requires analysis of outbound trips away from Downtown. As indicated in Table 4,
the proposed student housing/mixed-use building would generate a net decrease of 39 public
transit trips in the PM peak hour. Based on the 2016 Travel Survey results, only eight percent of
these trips (i.e. three trips) represent trips towards the SF State campus (i.e. Muni’s outbound
direction, away from downtown), which would affect the PM peak hour Muni screenline analysis.
This small reduction in transit trips would have a negligible effect on the Downtown transit
screenline analysis and will therefore not be taken into account in this analysis.
On the other hand, the concert hall would generate 109 transit trips on an event day assuming
the worst-case large event scenario. Based on the 2016 Travel Survey, of the 109 transit trips

Wendy Bloom, San Francisco State University
September 14, 2016
Page 25 of 30
generated by the concert hall during the PM peak hour, 33 percent of the trips would use the M
line to SF State (i.e. Muni’s outbound direction, away from downtown). This represents 36
additional trips on the M line across the Downtown screenline. The remainder of the transit trips
would use the SF State shuttle or other Muni lines that do not cross any of the screenlines –
routes 28/28R 19th Avenue, 29 Sunset, and 57 Parkmerced.
As presented in Table 9, based on the worst-case large event scenario, Project trips represent a
less than one percent increase in the number of transit riders crossing the Downtown screenline.
Even with the addition of these 36 trips, neither the individual M line nor the Southwest screenline
would exceed the 85 percent PM peak hour capacity utilization. Therefore, the Project would not
result in any additional significant public transit impacts beyond those identified in the 2007 CMP
EIR.
TABLE 9: PM PEAK HOUR MUNI DOWNTOWN SCREENLINES – SOUTHWEST SCREENLINE
Outbound
Screenline
Existing Existing Plus Project
PM Peak
Hour1
Ridership
PM Peak
Hour1
Capacity
PM Peak
Hour1
Capacity
Utilization
PM Peak
Hour1
Project
Ridership2
Existing
Plus
Project
Ridership
PM Peak
Hour1
Capacity
Utilization
Subway lines 4,904 6,164 80% 36 4,940 80%
Haight/Noriega 977 1,554 63% 0 977 63%
Other lines 555 700 79% 0 555 79%
Southwest
Screenline Total
6,435 8,418 76% 36 6,471 77%
Notes:
1. PM peak hour outbound (i.e. away from Downtown, inbound to SF State) only.
2. Data is based on the 2016 Travel Survey. Transit riders using BART (the subway) have to use another mode to
arrive to campus because the nearest BART stop is over 1.5 miles away. Some of these BART riders are likely to
take MUNI. Therefore, the total number of transit trips will be greater than 109 as some people will take both BART
and MUNI to get to campus.
Source: San Francisco Planning Department, May 2015; Fehr & Peers, 2016; Nelson Nygaard, 2016.
BICYCLE & PEDESTRIAN IMPACTS
As presented in the travel demand analysis section of this memorandum (see Table 8), the Project
would add 77 net new pedestrian and bicycle trips on event days and 40 net new on-campus
pedestrian and bicycle trips on non-event days. The Project’s closure of Tapia Drive to through
vehicular traffic would create a more pleasant pedestrian and bicycle environment on campus
near the Project site. Commercial loading access to the Concert Hall and College of Liberal and
Wendy Bloom, San Francisco State University
September 14, 2016
Page 26 of 30
Creative Arts on Tapia Drive and vehicle access the parking garage at new student
housing/mixed-use building along Holloway Avenue would be designed to minimize conflicts
with pedestrians and bicyclists by providing adequate sight distance and conforming to the SF
Planning Code. At the vacated Tapia Drive, access to most vehicles would be limited through the
provision of bollards or signage, similar to the designs of other mixed commercial loading and
pedestrian spaces on campus.
The proposed changes to Tapia Drive due to the Project would improve conditions for
pedestrians and bicyclists by reducing intermodal conflicts. Sidewalks installed as part of the
Project would be consistent with the Better Streets Plan and would be able to accommodate the
new pedestrians. Other pedestrian improvements as part of the Project would improve access and
add more space for the pedestrians. Further, the existing facilities near the Project site would be
able to accommodate the new bicyclists associated with the Project.
The Project would be designed to connect to the future Parkmerced transit station by adding
pedestrian amenities and a courtyard that opens towards the transit hub. The alignment of the
courtyard to this potential transit hub would promote movement of visitors through the courtyard
from the new transit hub, ultimately connecting pedestrians to the SF State campus via Holloway
Avenue. Varela Avenue would be designed to prioritize pedestrians. Improvements will include
eliminating parking on Varela Avenue, a strategy to modify and reduce curbs so that ease of
movement is promoted across Varela Avenue, and pavers that strengthen the pedestrian
connection as well as provide a safe street crossing.
The new student housing/mixed-use building would also include secure, covered bicycle storage
on the first floor of the building. Approximately 185 Class 1 secure, covered bicycle storage
spaces would be provided in the building. Approximately 12 Class II bicycle parking spaces would
also be provided in the vicinity of the Creative Arts replacement building and concert hall and will
be in a visible location, easily accessible to the buildings. These spaces are part of a campus-wide
planning effort to improve bicycle infrastructure and access to campus, addressing routes, safety,
and centralized bike parking areas that include a mix of racks and secure facilities.
While pedestrian and bicycle trips are expected to increase due to the Project, the Project would
not create unsafe conditions for pedestrians or bicyclists, nor would the additional walk and bike
trips cause crowding on nearby sidewalks. In addition, the Project’s closure of Tapia Drive to
vehicles (except commercial loading and deliveries) and other pedestrian improvements along
nearby roadways would improve pedestrian conditions on campus near the Project site. These
Wendy Bloom, San Francisco State University
September 14, 2016
Page 27 of 30
improvements include new access ramps, bulb-outs, crosswalks, improved sidewalks, and other
pedestrian amenities that will ensure safer access. Therefore, the Project would not result in any
additional significant impacts to pedestrians and bicyclists beyond those identified in the 2007
CMP EIR.
Loading Assessment
The existing commercial loading zone located on Tapia Drive for the College of Liberal and
Creative Arts would remain, with access through the bollard or sign controlled pedestrian zone via
Holloway Avenue. Therefore, the Project would not change the existing commercial loading
access for College of Liberal and Creative Arts. Commercial loading for the Creative Arts Building
and Concert Hall would occur within Tapia Drive and typically include delivery of materials for the
Creative Arts Building or preparing for concerts at the Concert Hall, which would occur
throughout the day. The new pedestrian plaza would be designed to accommodate the
commercial loading trucks, providing a clear pathway from Holloway Avenue to the loading zone
and from the loading zone to Font Boulevard, including adequate curb radii. This would be similar
to other loading facilities on campus where the loading zone is located within a shared loading
and pedestrian/bicycle zone. Access to these loading zones would conform to SF Planning Code
and Better Streets Plan.
Passenger loading for the concert hall should be provided on Font Boulevard. The passenger
loading zone would need to be similar in size to the existing passenger loading zone on Holloway
Avenue in front of the McKenna theatre, which is approximately 100 feet. This passenger loading
zone would be subject to SFMTA approval.
Residential loading (deliveries and passenger loading) would be accommodated within the
existing commercial loading zone on Cardenas Avenue and the new parking garage in the
proposed student housing/mixed-use building. San Francisco’s Planning code (section § 152)
requires one off-street loading space to be provided for the student housing/mixed-use building4.
In addition, there are passenger loading zones along Holloway as shown on Figure 1.
4 San Francisco Planning Code, section 152, states that new buildings between 100,001 and 200,000 square
feet shall provide one off-street freight loading space. The student housing/mixed-use building would
approximately be 140,00 square feet.
Wendy Bloom, San Francisco State University
September 14, 2016
Page 28 of 30
As the Project will be designed to accommodate commercial and passenger loading demand and
meet the Code requirements, it would not create new hazards for other roadway users, including
pedestrians and bicyclists. Therefore, the Project would not result in any additional significant
impacts to pedestrians and bicyclists beyond those identified in the 2007 CMP EIR due to loading
facilities.
CONCLUSION
The Creative Arts and Holloway Mixed-Use Project would not create new significant impacts or
worsen the severity of impacts identified in the 2007 CMP EIR. The new student housing portion
of the Project would reduce the total number of vehicle and transit trips to the campus during the
PM peak; the number of students living on campus – who would otherwise live off-campus and
arrive to campus via car, public transit, or other means – would increase and therefore reduce the
number of trips from off-campus student residences. The Creative Arts replacement building
would not include an increase in enrollment or full-time employees and thus would not result in
any changes in travel demand to/from campus. The new concert hall would not result in
additional trips on non-event days. On event days, vehicle and transit trips related to the concert
hall during the PM peak hour would increase, but the added number of trips would be below the
Adjusted Trip Envelope presented in this memorandum. Additionally, the total number of vehicle
trips generated by the campus even with event day traffic of the Project is well below the total
number of vehicle trips studied in the baseline year of the 2007 CMP EIR. Therefore, the Project
would not result in new or additional impacts beyond those identified in the 2007 CMP EIR.
While pedestrian and bicycle trips are expected to increase due to the Project, the Project would
not create unsafe conditions for pedestrians or bicyclists, nor would the additional walk and bike
trips cause crowding on nearby sidewalks or bicycle facilities. In addition, the Project’s closure of
Tapia Drive to vehicles (except commercial loading and deliveries) and additional pedestrian and
bicycle amenities would improve pedestrian and bicycle conditions on campus near the Project
site. Thus, the Project would not result in any additional significant impacts to pedestrians and
bicyclists beyond those identified in the 2007 CMP EIR.
Attachments
Attachment A – 2016 Travel Survey Instrument
Attachment B – San Francisco State University 2016 Transportation Survey Results Report by
Nelson/Nygaard - DRAFT
332 Pine Street | Floor 4 | San Francisco, CA 94104 | (415) 348-0300 | Fax (415) 773-1790
www.fehrandpeers.com
ATTACHMENT A – 2016 TRAVEL SURVEY INSTRUMENT
Freshman
Other undergraduate
Graduate student
Staff or Administrator
Faculty
Visitor/contractor
Other
Fulltime
Parttime
Not Applicable
On campus
Off campus
General Information
SF State Transportation Survey
Please complete this survey about your commute and general travel to and from SF State's main campus at1600 Holloway on Wednesday, April 6, 2016. The survey takes approximately 5 minutes to complete, and your response is greatly appreciated. The surveywill close on April 14, 2016. Upon completing the survey you will have an opportunity to enter for a chance to win a $100 gift card to theSF State Bookstore. Thank you for helping us improve the quality of our campus!
What is your primary affiliation with SF State?
Are you fulltime or parttime?
On average, how many days a week do you come to the SF State main campus at 1600 Holloway?
Where do you live?
Yes
No
Specify dorm/apartment
Specify zip code
What is your average cost for your round trip commute to and from SF State? Please round to the nearest dollar.
Were you on campus on Wednesday, April 6th 2016?
Have you participated in or used / do you currently participate in or use any of the following programs andservices ?
I wasn't aware of this
service
I've heard of thisservice but never used
it
I occasionally (12times a week) use this
serviceI frequently (35 days aweek) use this service
Free round trip transfer onMuni 28/28R from Daly CityBART when using ClipperCard
Bike Barn
Bike Racks
511 RideMatch Service
Zipcar
Electric Vehicle ChargingStations
For Employees: Have you participated in or used / do you currently participate in or use any of the followingprograms and services ?
I wasn't aware of this
service
I've heard of thisservice but never used
it
I occasionally (12times a week) use this
serviceI frequently (35 days aweek) use this service
Commuter Check PreTaxTransit Benefit (pretaxpurchase of transit passes)
Vanpool
Emergency Ride Home
Yes, and I have used the resources available to me before
Yes, but I have not used the resources available to me
No, I do not know what resources are available to me
SF State Website home page
Parking & Transportation Website
Word of mouth (fellow student or coworker)
My manager
Human resources
Hiring materials
A distribution list that I signed up for
Digital screens found around campus
Other (please specify)
Yes
No
Program
PreTax Parking Benefit (pretax purchase of parking)
Do you know where to go if you have questions about your commute or need other transportation information?
Which resources have you used to get transportation and commute information? (please check all that apply)
In an effort to reduce parking demand and to expand affordable transportation options, SF State is exploring thepossibility of pursuing discounts for our students, faculty, and staff for ondemand taxi services known asTNCs such as Uber and Lyft. Would you be interested in such a benefit?
Please provide any additional comments about transportation issues that relate to SF State.
If you would like to be entered for a chance to receive a $100 gift card to the SF State Bookstore, please enteryour email address.
Walk, bike, or other active transport
Public transportation / shuttle
Private vehicle (cars, carpool, motorcycle, etc.)
Taxi, Uber, Lyft, or other ondemand taxi or realtime ridesharing services known as TNCs
Walk
Bicycle
Other
Your Trip to Campus
Your Trip to Campus
The following questions are about your trip to the main campus at 1600 Holloway. You will be asked todescribe your commute by indicating the mode of transportation used for each segment of the trip.
For example, your commute might have only one segment if you drove, walked, or biked directly to campus.Or, it might have three segments if you 1) drove and parked at your closest BART station, 2) took BART toDaly City, and 3) took the shuttle to campus. Please describe your commute to the main campus on Wednesday, April 6, 2016.
If you took more than one mode/ have multiple segments, please start the survey by selecting your firstsegment.
For your trip to the main campus, where did you start your trip?
(For example, Main Campus and OnCampus Dorms = 94132).
Zipcode
For your trip to the main campus, what time did you arrive at the main campus?
Please enter time in the following format: HH:MM AM
HH
MM
AM/PM
Select the mode of transportation for your first segment:
Which mode of transportation did you use?
Muni
BART
SF State Shuttle
Caltrain
Other bus provider than Muni (e.g. AC Transit/Golden Gate Transit/SamTrans)
Drove Alone
Dropped Off / Picked Up
Motorcycle/Moped
Carpool/Vanpool
Taxi
Uber
Lyft
Other ondemand taxi or realtime ridesharing service
Please estimate (in miles) the distance you traveled for this segment of your trip(E.g. If you traveled 1 1/2 miles, enter 1.5)
Specify Muni Line
Please estimate (in miles) the distance you traveled in this segment of your trip (E.g. If you traveled 1 1/2 miles, enter 1.5)
Specify BART start station
Specify BART end station
Specify Caltrain start station
Passenger
Driver
Walk, bike, or other active transport
Public transportation / shuttle
Private vehicle (cars, carpool, motorcycle, etc.)
Specify Caltrain end station
Please estimate (in miles) the distance you traveled for this segment of your trip(E.g. If you traveled 1 1/2 miles, enter 1.5)
I was the:
Number of people in the carpool/vanpool on Wednesday April, 6, 2016:
Please estimate (in miles) the distance you traveled for this segment of your trip(E.g. If you traveled 1 1/2 miles, enter 1.5)
Please estimate (in miles) the distance you traveled for this segment of your trip(E.g. If you traveled 1 1/2 miles, enter 1.5)
Your Trip Segments to Campus
On your trip to SF State's main campus, what was the mode of transportation for your second segment?
If you used BART previously, please use this question to tell us how you got from BART to campus.
Taxi, Uber, Lyft, or other ondemand taxi or realtime ridesharing services known as TNCs
None
Walk
Bicycle
Other
Muni
BART
SF State Shuttle
Caltrain
Other bus provider than Muni (e.g. AC Transit/Golden Gate Transit/SamTrans)
Drove Alone
Dropped Off / Picked Up
Motorcycle/Moped
Carpool/Vanpool
Taxi
Uber
Lyft
Other ondemand taxi or realtime ridesharing service
Which mode of transportation did you use?
Please estimate (in miles) the distance you traveled for this segment of your trip (for instance if you traveled 11/2 miles, enter 1.5)
Specify Muni Line
Please estimate (in miles) the distance you traveled in this segment of your trip (for instance if you traveled 11/2 miles, enter 1.5)
Specify BART start station
Passenger
Driver
Specify BART end station
Specify Caltrain start station
Specify Caltrain end station
Please estimate (in miles) the distance you traveled for this segment of your trip (for instance if you traveled 11/2 miles, enter 1.5)
I was the:
Number of people in the carpool/vanpool on Wednesday April, 6, 2016:
Please estimate (in miles) the distance you traveled for this segment of your trip (for instance if you traveled 11/2 miles, enter 1.5)
Please estimate (in miles) the distance you traveled for this segment of your trip (for instance if you traveled 11/2 miles, enter 1.5)
Walk, bike, or other active transport
Public transportation / shuttle
Private vehicle (cars, carpool, motorcycle, etc.)
Taxi, Uber, Lyft, or other ondemand taxi or realtime ridesharing services known as TNCs
None
Walk
Bicycle
Other
Muni
BART
SF State Shuttle
Caltrain
Other bus provider than Muni (e.g. AC Transit/Golden Gate Transit/SamTrans)
Drove Alone
Dropped Off / Picked Up
Motorcycle/Moped
Carpool/Vanpool
Taxi
Uber
Lyft
Other ondemand taxi or realtime ridesharing service
On your trip to SF State's main campus, what was the mode of transportation for your third segment?
If you used BART previously, please use this question to tell us how you got from BART to campus.
Which mode of transportation did you use?
Please estimate (in miles) the distance you traveled for this segment of your trip (for instance if you traveled 11/2 miles, enter 1.5)
Specify Muni Line
Please estimate (in miles) the distance you traveled in this segment of your trip (for instance if you traveled 11/2 miles, enter 1.5)

Passenger
Driver
Specify BART start station
Specify BART end station
Specify Caltrain start station
Specify Caltrain end station
Please estimate (in miles) the distance you traveled for this segment of your trip (for instance if you traveled 11/2 miles, enter 1.5)
I was the:
Number of people in the carpool/vanpool on Wednesday April, 6, 2016:
Please estimate (in miles) the distance you traveled for this segment of your trip (for instance if you traveled 11/2 miles, enter 1.5)

Walk, bike, or other active transport
Public transportation / shuttle
Private vehicle (cars, carpool, motorcycle, etc.)
Taxi, Uber, Lyft, or other ondemand taxi or realtime ridesharing services known as TNCs
None
Walk
Bicycle
Other
Muni
BART
SF State Shuttle
Caltrain
Other bus provider than Muni (e.g. AC Transit/Golden Gate Transit/SamTrans)
Drove Alone
Dropped Off / Picked Up
Motorcycle/Moped
Carpool/Vanpool
Taxi
Uber
Lyft
Other ondemand taxi or realtime ridesharing service
Please estimate (in miles) the distance you traveled for this segment of your trip (for instance if you traveled 11/2 miles, enter 1.5)
On your trip to SF State's main campus, what was the mode of transportation for your fourth segment?
If you used BART previously, please use this question to tell us how you got from BART to campus.
Which mode of transportation did you use?
Please estimate (in miles) the distance you traveled for this segment of your trip (for instance if you traveled 11/2 miles, enter 1.5)
Specify Muni Line
Passenger
Driver
Please estimate (in miles) the distance you traveled in this segment of your trip (for instance if you traveled 11/2 miles, enter 1.5)
Specify BART start station
Specify BART end station
Specify Caltrain start station
Specify Caltrain end station
Please estimate (in miles) the distance you traveled for this segment of your trip (for instance if you traveled 11/2 miles, enter 1.5)
I was the:
Number of people in the carpool/vanpool on Wednesday April, 6, 2016:

Parking lot / garage
On the street
I did not drive today.
On Campus
Near Campus
Near Daly City BART station
Near another BART station
Park & Ride lot
Other
Please estimate (in miles) the distance you traveled for this segment of your trip (for instance if you traveled 11/2 miles, enter 1.5)
Please estimate (in miles) the distance you traveled for this segment of your trip (for instance if you traveled 11/2 miles, enter 1.5)
Parking
Did you park on the street or in a parking lot / garage?
Where did you park when you came to the main campus on Wednesday, April 6, 2016?
Please choose a zone where you parked (map below)
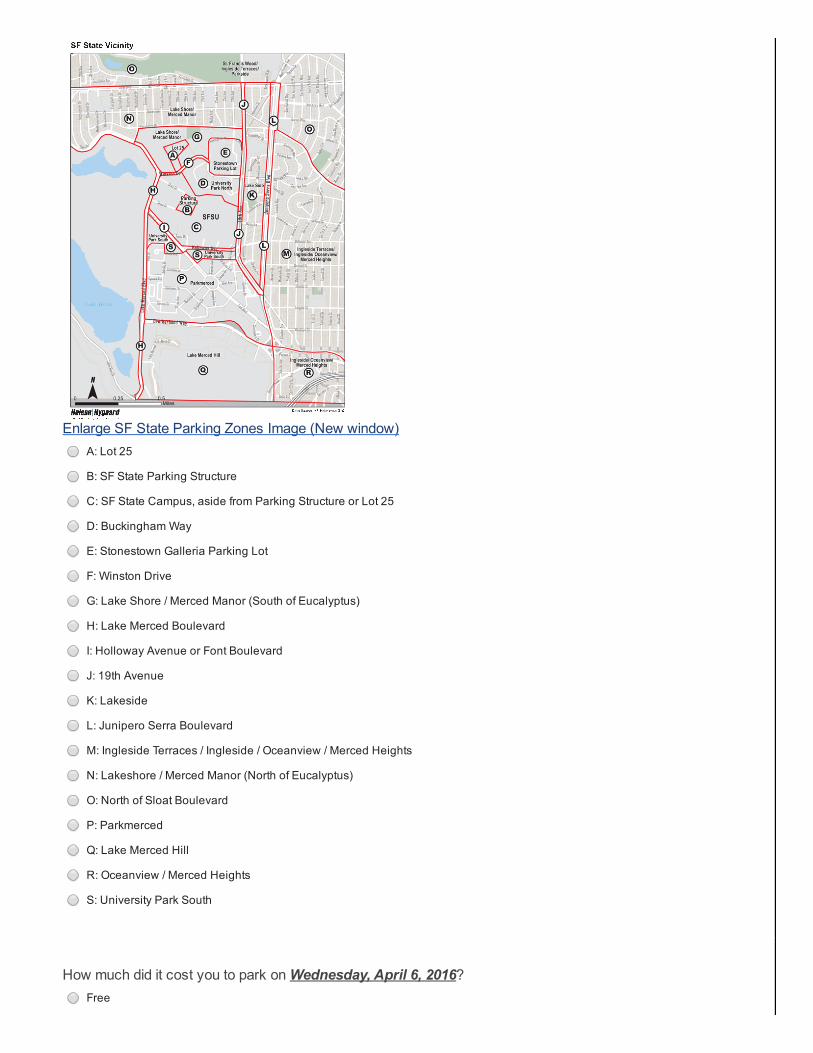
A: Lot 25
B: SF State Parking Structure
C: SF State Campus, aside from Parking Structure or Lot 25
D: Buckingham Way
E: Stonestown Galleria Parking Lot
F: Winston Drive
G: Lake Shore / Merced Manor (South of Eucalyptus)
H: Lake Merced Boulevard
I: Holloway Avenue or Font Boulevard
J: 19th Avenue
K: Lakeside
L: Junipero Serra Boulevard
M: Ingleside Terraces / Ingleside / Oceanview / Merced Heights
N: Lakeshore / Merced Manor (North of Eucalyptus)
O: North of Sloat Boulevard
P: Parkmerced
Q: Lake Merced Hill
R: Oceanview / Merced Heights
S: University Park South
Free
Enlarge SF State Parking Zones Image (New window)
How much did it cost you to park on Wednesday, April 6, 2016?
Less than $1
$1$2
$2$4
$4$7
$7$10
More than $10
I have a SF State Semester / Yearly Parking Pass
Which of the following programs, if any, would encourage you to commute to campus via a mode of travel otherthan driving alone?
Please rank your first, second, and third choices.
First choice:
Second choice:
Third choice:
Your Trip Segments From Campus
Your Trip from Campus
The following questions are about your trip from the main campus at 1600 Holloway. You will be asked todescribe your commute away from campus by indicating the mode of transportation used for each segment ofyour trip.
For example, your trip might have only one segment if you drove, walked, or biked directly from campus. Or, itmight have three segments if you 1) took the shuttle to BART, 2) took BART to the East Bay and 3) walkedhome.
Please describe your trip from campus on Wednesday, April 6, 2016.
If you took more than one mode/ have multiple segments, please start the survey by selecting your firstsegment.
Yes
No
Walk, bike, or other active transport
Public transportation / shuttle
Private vehicle (cars, carpool, motorcycle, etc.)
Taxi, Uber, Lyft, or other ondemand taxi or realtime ridesharing services known as TNCs
Walk
Bicycle
Other
Muni
BART
SF State Shuttle
Caltrain
Other bus provider than Muni (e.g. AC Transit/Golden Gate Transit/SamTrans)
Drove Alone
Dropped Off / Picked Up
For your trip from the main campus, what time did you depart from the main campus?
Please enter time in the following format: HH:MM AM
HH
MM
AM/PM
Did you use the exact same means of transportation when you left the campus on Wednesday, April 6,2016 as you did when coming to campus?
If any segment of your trip from campus was different from your trip to campus, please select No.
For your trip from the main campus, where did you end your trip?
Zipcode
Select the mode of transportation for your first segment:
If your next segment is via BART, please use this question to tell us how you got from campus to the BARTstation.
Which mode of transportation did you use?

Motorcycle/Moped
Carpool/Vanpool
Taxi
Uber
Lyft
Other TNC
Please estimate (in miles) the distance you traveled for this segment of your trip (for instance if you traveled 11/2 miles, enter 1.5)
Specify Muni Line
Please estimate (in miles) the distance you traveled in this segment of your trip (for instance if you traveled 11/2 miles, enter 1.5)
Specify BART start station
Specify BART end station
Specify Caltrain start station
Specify Caltrain end station

Passenger
Driver
Walk, bike, or other active transport
Public transportation / shuttle
Private vehicle (cars, carpool, motorcycle, etc.)
Taxi, Uber, Lyft, or other ondemand taxi or realtime ridesharing services known as TNCs
None
Walk
Bicycle
Other
Muni
Please estimate (in miles) the distance you traveled for this segment of your trip (for instance if you traveled 11/2 miles, enter 1.5)
I was the:
Number of people in the carpool/vanpool on Wednesday, April, 6, 2016:
Please estimate (in miles) the distance you traveled for this segment of your trip (for instance if you traveled 11/2 miles, enter 1.5)
Please estimate (in miles) the distance you traveled for this segment of your trip (for instance if you traveled 11/2 miles, enter 1.5)
On your trip from SF State's main campus, what was the mode of transportation for your second segment?
If your next segment is via BART, please use this question to tell us how you got from campus to the BARTstation.
Which mode of transportation did you use?
BART
SF State Shuttle
Caltrain
Other bus provider than Muni (e.g. AC Transit/Golden Gate Transit/SamTrans)
Drove Alone
Dropped Off / Picked Up
Motorcycle/Moped
Carpool/Vanpool
Taxi
Uber
Lyft
Other TNC
Please estimate (in miles) the distance you traveled for this segment of your trip (for instance if you traveled 11/2 miles, enter 1.5)
Specify Muni Line
Please estimate (in miles) the distance you traveled in this segment of your trip (for instance if you traveled 11/2 miles, enter 1.5)
Specify BART start station
Specify BART end station
Specify Caltrain start station
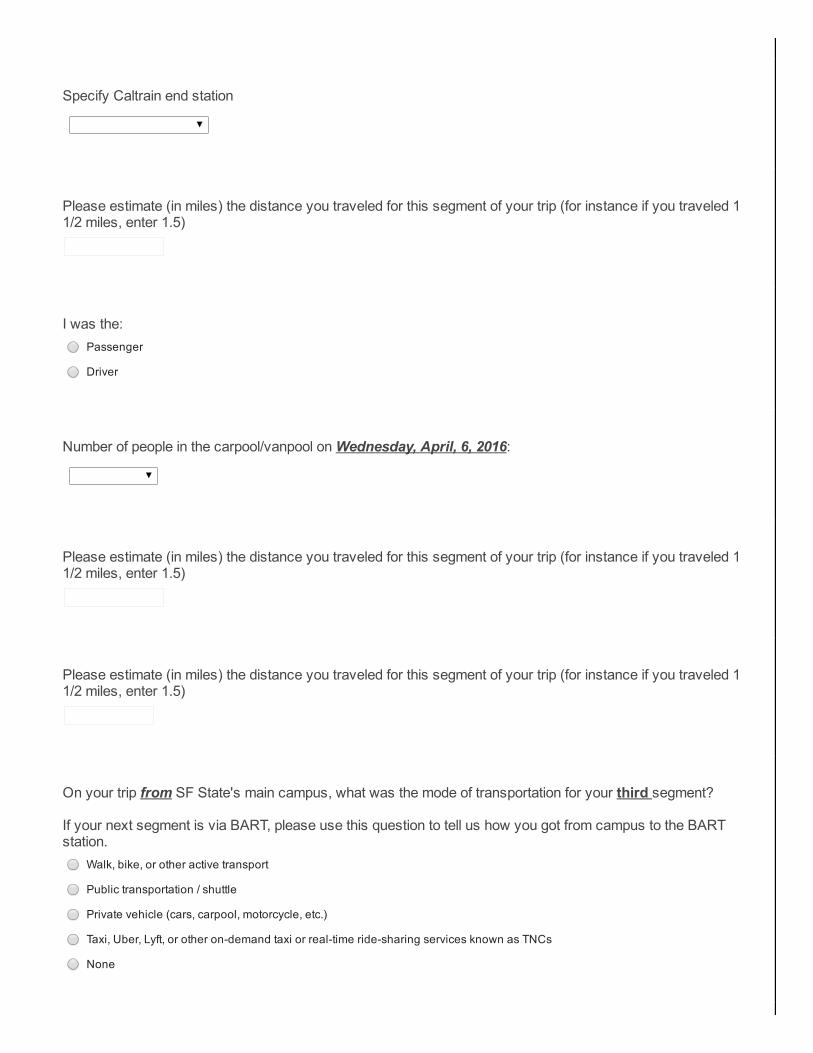
Passenger
Driver
Walk, bike, or other active transport
Public transportation / shuttle
Private vehicle (cars, carpool, motorcycle, etc.)
Taxi, Uber, Lyft, or other ondemand taxi or realtime ridesharing services known as TNCs
None
Specify Caltrain end station
Please estimate (in miles) the distance you traveled for this segment of your trip (for instance if you traveled 11/2 miles, enter 1.5)
I was the:
Number of people in the carpool/vanpool on Wednesday, April, 6, 2016:
Please estimate (in miles) the distance you traveled for this segment of your trip (for instance if you traveled 11/2 miles, enter 1.5)
Please estimate (in miles) the distance you traveled for this segment of your trip (for instance if you traveled 11/2 miles, enter 1.5)
On your trip from SF State's main campus, what was the mode of transportation for your third segment?
If your next segment is via BART, please use this question to tell us how you got from campus to the BARTstation.
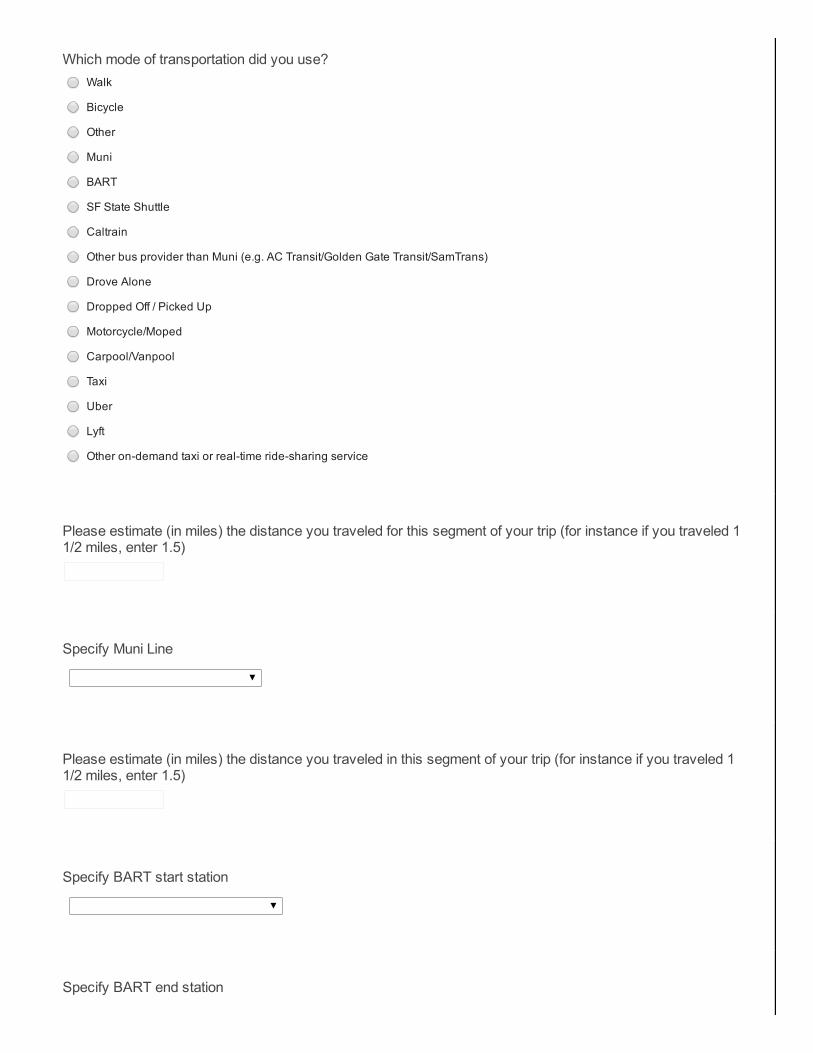
Walk
Bicycle
Other
Muni
BART
SF State Shuttle
Caltrain
Other bus provider than Muni (e.g. AC Transit/Golden Gate Transit/SamTrans)
Drove Alone
Dropped Off / Picked Up
Motorcycle/Moped
Carpool/Vanpool
Taxi
Uber
Lyft
Other ondemand taxi or realtime ridesharing service
Which mode of transportation did you use?
Please estimate (in miles) the distance you traveled for this segment of your trip (for instance if you traveled 11/2 miles, enter 1.5)
Specify Muni Line
Please estimate (in miles) the distance you traveled in this segment of your trip (for instance if you traveled 11/2 miles, enter 1.5)
Specify BART start station
Specify BART end station
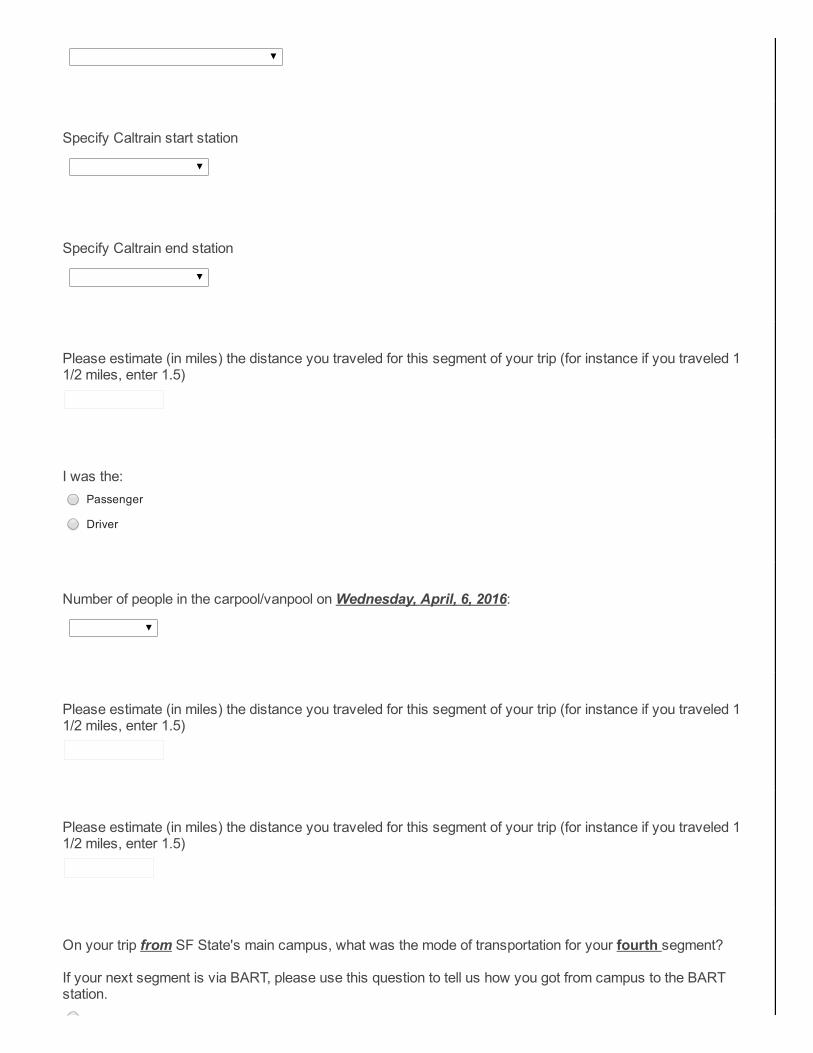
Passenger
Driver
Specify Caltrain start station
Specify Caltrain end station
Please estimate (in miles) the distance you traveled for this segment of your trip (for instance if you traveled 11/2 miles, enter 1.5)
I was the:
Number of people in the carpool/vanpool on Wednesday, April, 6, 2016:
Please estimate (in miles) the distance you traveled for this segment of your trip (for instance if you traveled 11/2 miles, enter 1.5)
Please estimate (in miles) the distance you traveled for this segment of your trip (for instance if you traveled 11/2 miles, enter 1.5)
On your trip from SF State's main campus, what was the mode of transportation for your fourth segment?
If your next segment is via BART, please use this question to tell us how you got from campus to the BARTstation.
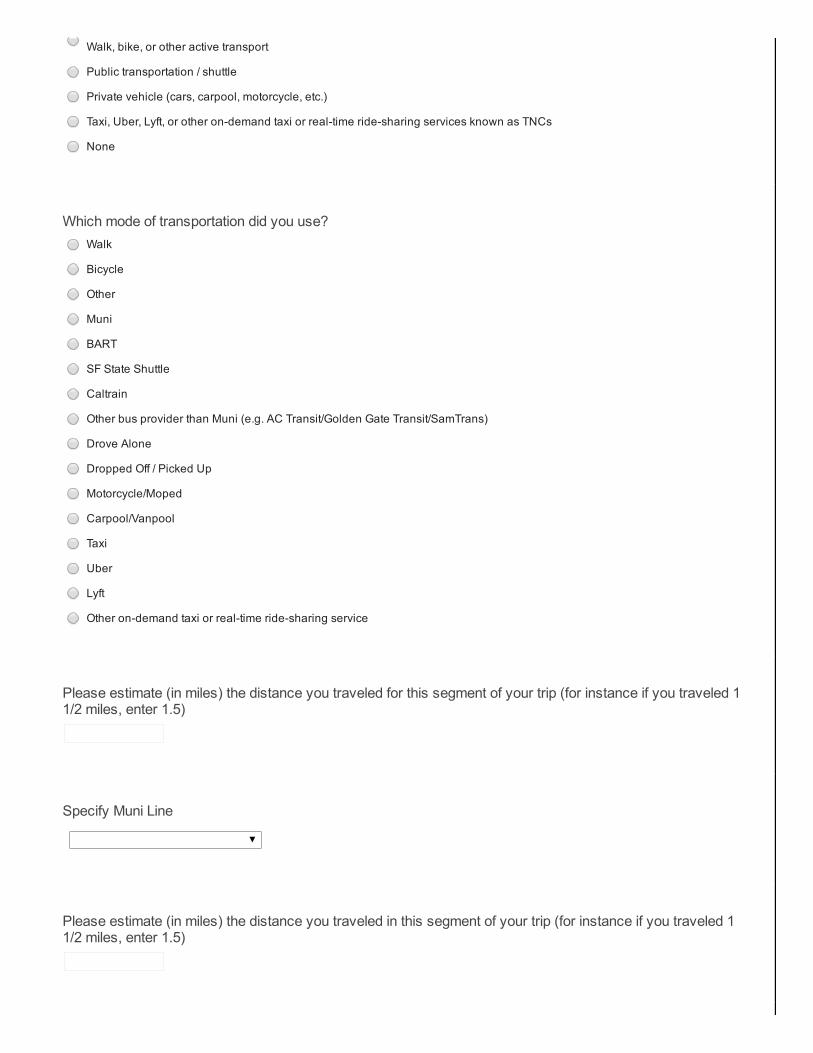
Walk, bike, or other active transport
Public transportation / shuttle
Private vehicle (cars, carpool, motorcycle, etc.)
Taxi, Uber, Lyft, or other ondemand taxi or realtime ridesharing services known as TNCs
None
Walk
Bicycle
Other
Muni
BART
SF State Shuttle
Caltrain
Other bus provider than Muni (e.g. AC Transit/Golden Gate Transit/SamTrans)
Drove Alone
Dropped Off / Picked Up
Motorcycle/Moped
Carpool/Vanpool
Taxi
Uber
Lyft
Other ondemand taxi or realtime ridesharing service
Which mode of transportation did you use?
Please estimate (in miles) the distance you traveled for this segment of your trip (for instance if you traveled 11/2 miles, enter 1.5)
Specify Muni Line
Please estimate (in miles) the distance you traveled in this segment of your trip (for instance if you traveled 11/2 miles, enter 1.5)
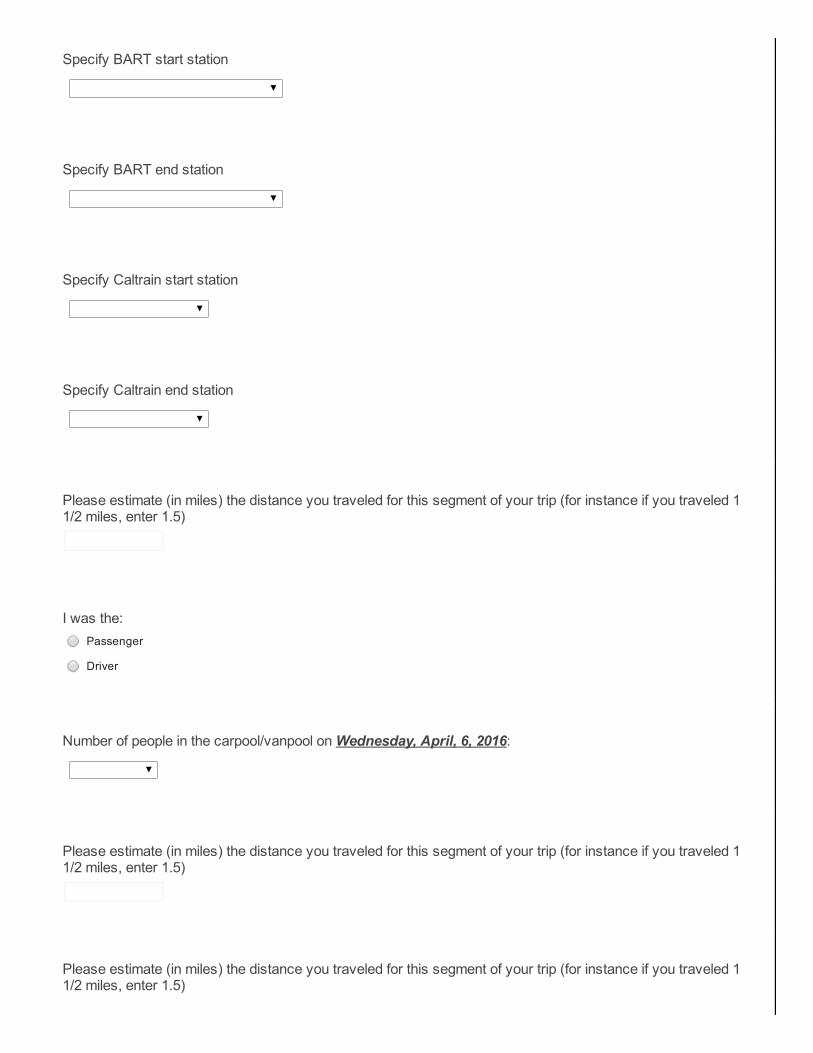
Passenger
Driver
Specify BART start station
Specify BART end station
Specify Caltrain start station
Specify Caltrain end station
Please estimate (in miles) the distance you traveled for this segment of your trip (for instance if you traveled 11/2 miles, enter 1.5)
I was the:
Number of people in the carpool/vanpool on Wednesday, April, 6, 2016:
Please estimate (in miles) the distance you traveled for this segment of your trip (for instance if you traveled 11/2 miles, enter 1.5)
Please estimate (in miles) the distance you traveled for this segment of your trip (for instance if you traveled 11/2 miles, enter 1.5)
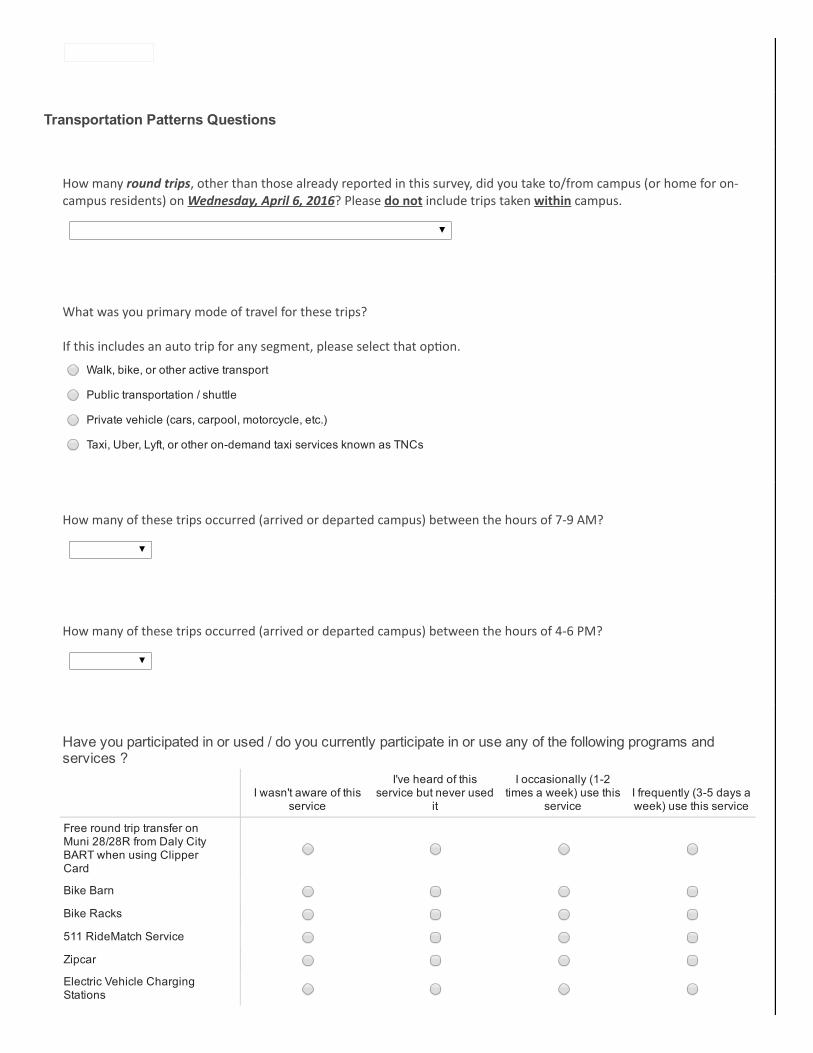
Walk, bike, or other active transport
Public transportation / shuttle
Private vehicle (cars, carpool, motorcycle, etc.)
Taxi, Uber, Lyft, or other ondemand taxi services known as TNCs
Transportation Patterns Questions
How many round trips, other than those already reported in this survey, did you take to/from campus (or home for on‐campus residents) on Wednesday, April 6, 2016? Please do not include trips taken within campus.
What was you primary mode of travel for these trips?
If this includes an auto trip for any segment, please select that op�on.
How many of these trips occurred (arrived or departed campus) between the hours of 7‐9 AM?
How many of these trips occurred (arrived or departed campus) between the hours of 4‐6 PM?
Have you participated in or used / do you currently participate in or use any of the following programs andservices ?
I wasn't aware of this
service
I've heard of thisservice but never used
it
I occasionally (12times a week) use this
serviceI frequently (35 days aweek) use this service
Free round trip transfer onMuni 28/28R from Daly CityBART when using ClipperCard
Bike Barn
Bike Racks
511 RideMatch Service
Zipcar
Electric Vehicle ChargingStations
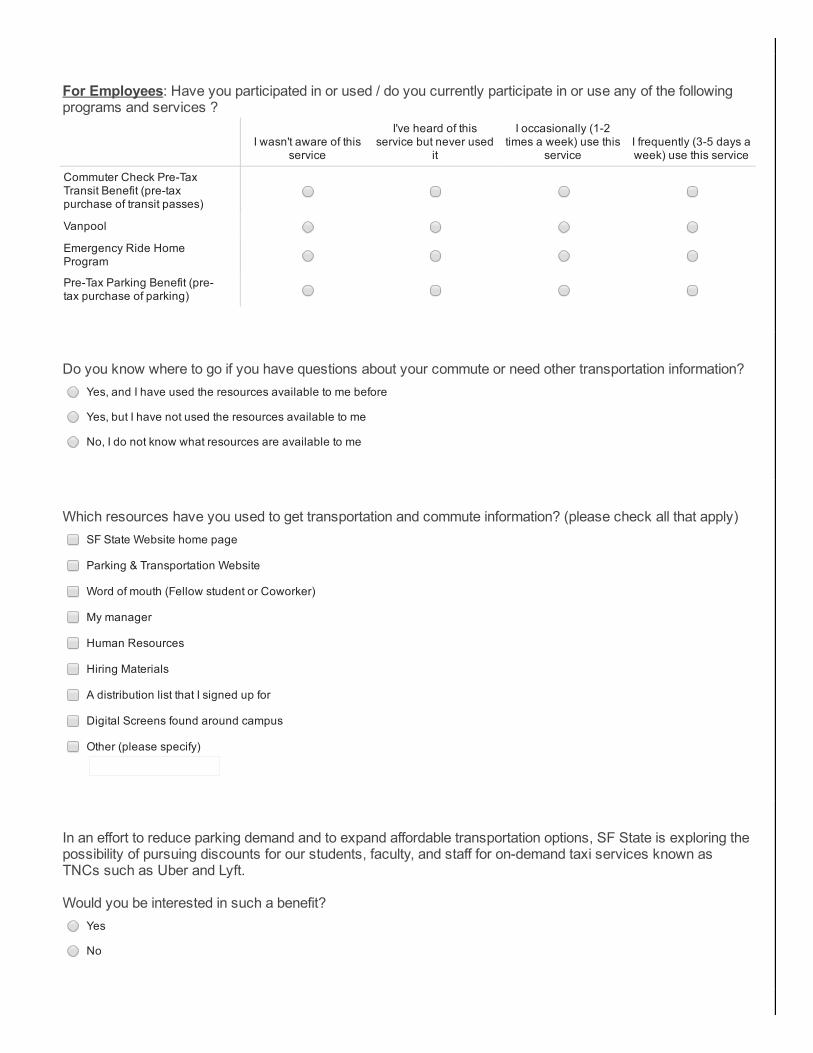
Yes, and I have used the resources available to me before
Yes, but I have not used the resources available to me
No, I do not know what resources are available to me
SF State Website home page
Parking & Transportation Website
Word of mouth (Fellow student or Coworker)
My manager
Human Resources
Hiring Materials
A distribution list that I signed up for
Digital Screens found around campus
Other (please specify)
Yes
No
For Employees: Have you participated in or used / do you currently participate in or use any of the followingprograms and services ?
I wasn't aware of this
service
I've heard of thisservice but never used
it
I occasionally (12times a week) use this
serviceI frequently (35 days aweek) use this service
Commuter Check PreTaxTransit Benefit (pretaxpurchase of transit passes)
Vanpool
Emergency Ride HomeProgram
PreTax Parking Benefit (pretax purchase of parking)
Do you know where to go if you have questions about your commute or need other transportation information?
Which resources have you used to get transportation and commute information? (please check all that apply)
In an effort to reduce parking demand and to expand affordable transportation options, SF State is exploring thepossibility of pursuing discounts for our students, faculty, and staff for ondemand taxi services known asTNCs such as Uber and Lyft. Would you be interested in such a benefit?
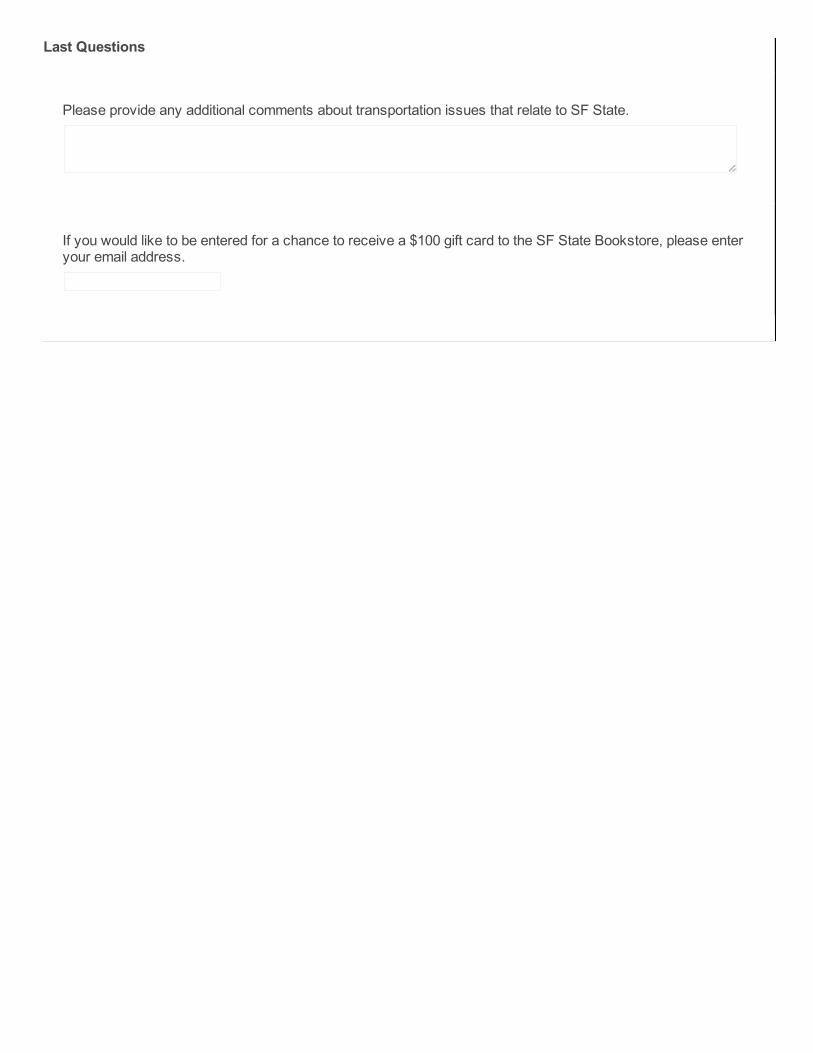
Last Questions
Please provide any additional comments about transportation issues that relate to SF State.
If you would like to be entered for a chance to receive a $100 gift card to the SF State Bookstore, please enteryour email address.

332 Pine Street | Floor 4 | San Francisco, CA 94104 | (415) 348-0300 | Fax (415) 773-1790
www.fehrandpeers.com
ATTACHMENT B – SAN FRANCISCO STATE UNIVERSITY 2016
TRANSPORTATION SURVEY RESULTS REPORT BY
NELSON/NYGAARD
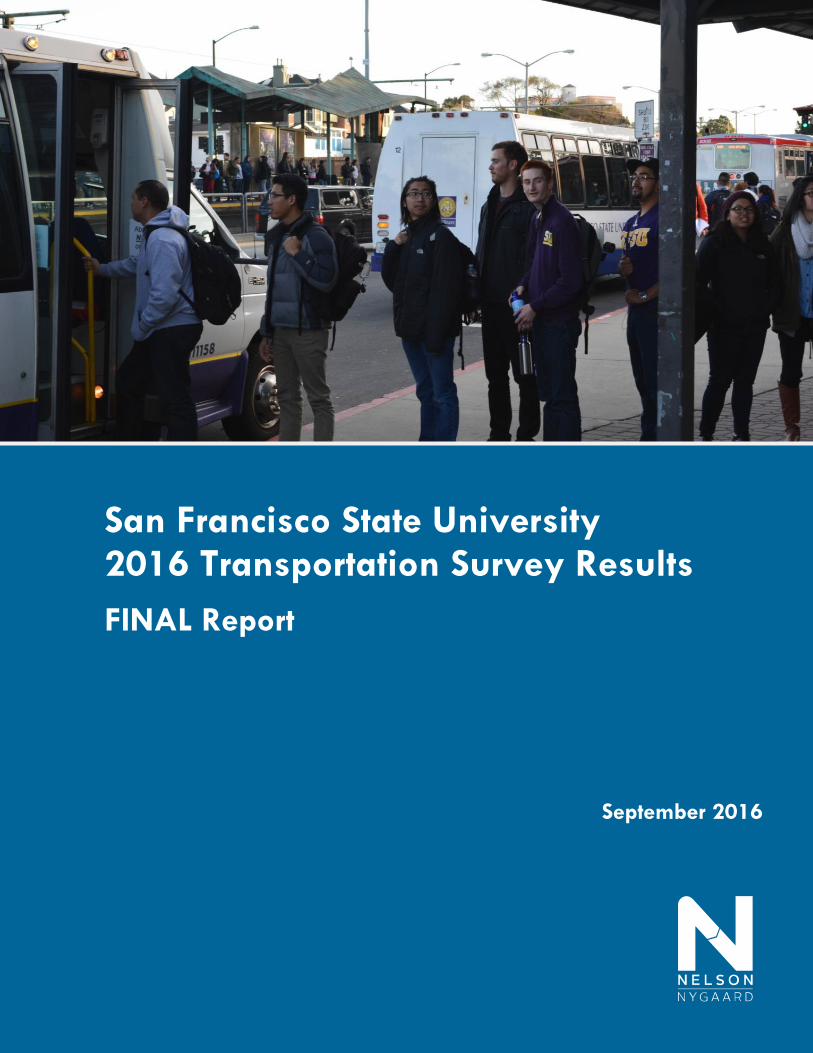
San Francisco State University 2016 Transportation Survey Results
FINAL Report
September 2016
2016 Transportation Survey Results | DRAFT
San Francisco State University
Nelson\Nygaard Consulting Associates Inc. | ii
Table of Contents
Page
1 Executive Summary .........................................................................................................1-1
2 Introduction ......................................................................................................................2-1
3 Online Survey ..................................................................................................................3-1 Survey Design ......................................................................................................................................... 3-1 Methodology .......................................................................................................................................... 3-2 Results ....................................................................................................................................................... 3-5
4 Cordon Count ...................................................................................................................4-1 Introduction .............................................................................................................................................. 4-1 Methodology .......................................................................................................................................... 4-1 Results ....................................................................................................................................................... 4-3
5 Carbon Emissions ............................................................................................................5-1 Introduction .............................................................................................................................................. 5-1 Methodology .......................................................................................................................................... 5-1 Results ....................................................................................................................................................... 5-4 Online Survey .............................................................................................................................................. ii
2016 Transportation Survey Results | DRAFT
San Francisco State University
Nelson\Nygaard Consulting Associates Inc. | ii
Table of Figures
Page
Figure 3-1: Adjusted Faculty/Staff and Student Responses .................................................................. 3-4
Figure 3-2: Population Scale ........................................................................................................................ 3-4
Figure 3-3: Mode of Arrival to Campus ..................................................................................................... 3-5
Figure 3-4: Number of Legs in Journey to Campus ................................................................................. 3-6
Figure 3-5: All Modes Used to Get to Campus ....................................................................................... 3-7
Figure 3-6: Mode Split by Affiliation ......................................................................................................... 3-8
Figure 3-7: Cost of Commute ........................................................................................................................ 3-9
Figure 3-8: Daily Estimated Number of Muni trips by Muni route ..................................................... 3-10
Figure 3-9: Peak Hour Estimated Number of Muni Trips for the SF State Peak Period ................. 3-10
Figure 3-10: Peak Hour Estimated Number of Muni Trips for the Muni System Wide Peak Period of 5:00 PM to 6:00 PM ........................................................................................ 3-11
Figure 3-12: Peak Hour, Estimated Number of Peak Direction Riders for M line ............................ 3-11
Figure 3-13: Peak Hour, Estimated Number of Peak Direction Riders for Bus Route 28/28R ..... 3-12
Figure 3-11: Muni Route 18-46th Ave and 57-Parkmerced Route Change Map ........................... 3-13
Figure 3-12: Muni 28-19th Avenue Proposal, Approved July 2015 ................................................. 3-14
Figure 3-13: Home County of BART Riders .............................................................................................. 3-15
Figure 3-14: Estimated Parking On and Near Campus ........................................................................ 3-17
Figure 3-15: Parking Costs ......................................................................................................................... 3-18
Figure 3-16: Programs to Encourage Drivers to Use Alternative Modes........................................... 3-18
Figure 3-17: Affiliation with San Francisco State University ................................................................ 3-19
Figure 3-18: Place of Residence ................................................................................................................ 3-19
Figure 3-19: Campus Affiliates by Zip code ........................................................................................... 3-21
Figure 3-20: Location of SF State University Affiliates ........................................................................... 3-0
Figure 4-1: Cordon Count Locations ............................................................................................................ 4-2
Figure 4-2: Number of Vehicles Entering and Exiting by Location ....................................................... 4-3
Figure 4-3: Count of Vehicles Entering and Exiting by Location and Time in 2016 .......................... 4-4
Figure 4-4: Percent Change in the Count of Vehicles Entering and Exiting from 2014 to 2016 ... 4-4
Figure 4-5: Count of Vehicles Entering and Exiting by Mode and by Hour ....................................... 4-6
Figure 4-6: Count of Persons Entering and Exiting by Mode and by Hour......................................... 4-7
Figure 4-7: Peak Hour and Total Auto Trips ............................................................................................. 4-8
Figure 5-1: Total Passenger Miles Travelled per Day by Mode .......................................................... 5-5
Figure 5-2: Total Pounds of CO2-e per Day by Mode .......................................................................... 5-7
Figure 5-3: Pounds of CO2 Emissions per Passenger Mile ...................................................................... 5-8
Figure 5-4: Total Miles Travelled and CO2 Emissions per Day 2016 .................................................. 5-9
Figure 5-5: Passenger-miles travelled, pounds CO2 per mile, and total CO2 per year by mode ... 5-10
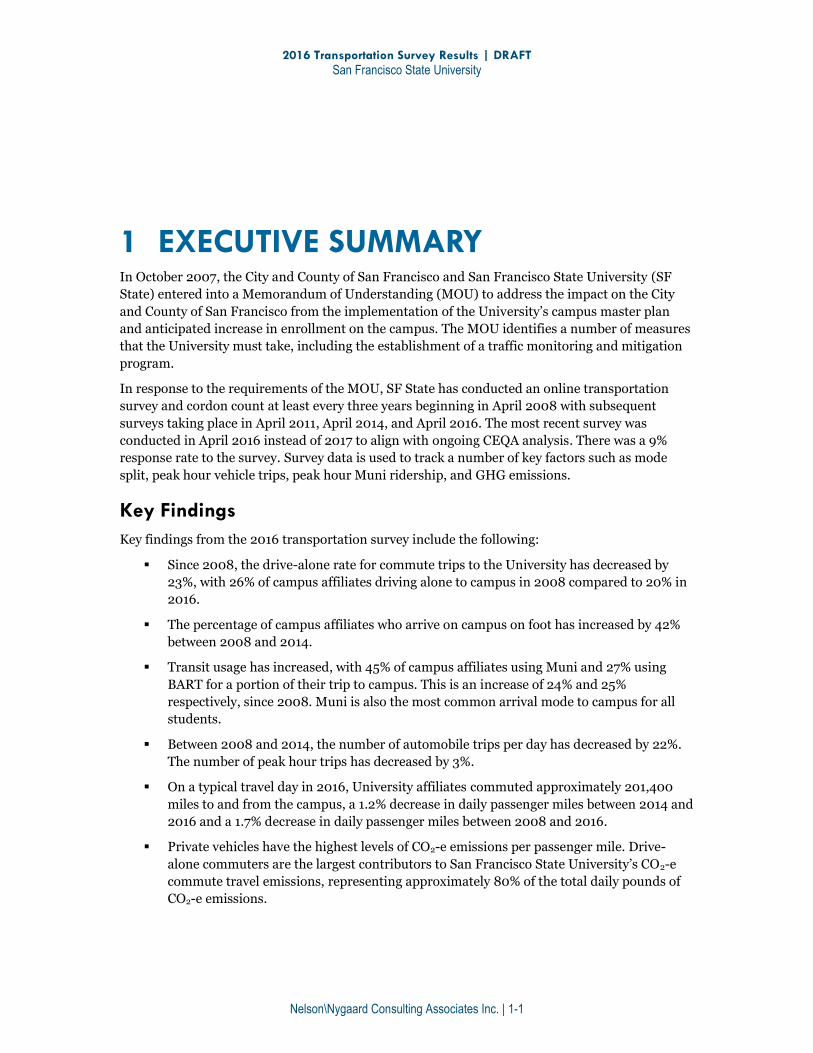
2016 Transportation Survey Results | DRAFT
San Francisco State University
Nelson\Nygaard Consulting Associates Inc. | 1-1
1 EXECUTIVE SUMMARY In October 2007, the City and County of San Francisco and San Francisco State University (SF
State) entered into a Memorandum of Understanding (MOU) to address the impact on the City
and County of San Francisco from the implementation of the University’s campus master plan
and anticipated increase in enrollment on the campus. The MOU identifies a number of measures
that the University must take, including the establishment of a traffic monitoring and mitigation
program.
In response to the requirements of the MOU, SF State has conducted an online transportation
survey and cordon count at least every three years beginning in April 2008 with subsequent
surveys taking place in April 2011, April 2014, and April 2016. The most recent survey was
conducted in April 2016 instead of 2017 to align with ongoing CEQA analysis. There was a 9%
response rate to the survey. Survey data is used to track a number of key factors such as mode
split, peak hour vehicle trips, peak hour Muni ridership, and GHG emissions.
Key Findings
Key findings from the 2016 transportation survey include the following:
Since 2008, the drive-alone rate for commute trips to the University has decreased by
23%, with 26% of campus affiliates driving alone to campus in 2008 compared to 20% in
2016.
The percentage of campus affiliates who arrive on campus on foot has increased by 42%
between 2008 and 2014.
Transit usage has increased, with 45% of campus affiliates using Muni and 27% using
BART for a portion of their trip to campus. This is an increase of 24% and 25%
respectively, since 2008. Muni is also the most common arrival mode to campus for all
students.
Between 2008 and 2014, the number of automobile trips per day has decreased by 22%.
The number of peak hour trips has decreased by 3%.
On a typical travel day in 2016, University affiliates commuted approximately 201,400
miles to and from the campus, a 1.2% decrease in daily passenger miles between 2014 and
2016 and a 1.7% decrease in daily passenger miles between 2008 and 2016.
Private vehicles have the highest levels of CO2-e emissions per passenger mile. Drive-
alone commuters are the largest contributors to San Francisco State University’s CO2-e
commute travel emissions, representing approximately 80% of the total daily pounds of
CO2-e emissions.
2016 Transportation Survey Results | DRAFT
San Francisco State University
Nelson\Nygaard Consulting Associates Inc. | 1-2
BART commuters travel only slightly fewer total miles per day than car drivers but emit
far lower levels of CO2-e per day; BART commuters emit an estimated 650 pounds of
CO2-e in a day, compared to approximately 6,000 pounds of CO2-e emitted by those who
drive alone.
2016 Transportation Survey Results | DRAFT
San Francisco State University
Nelson\Nygaard Consulting Associates Inc. | 2-1
2 INTRODUCTION In 2007, San Francisco State University developed its campus master plan to accommodate a 25%
increase in its student population through infill and renovation of its compact campus. Many
community members raised concerns that campus growth would result in traffic congestion and
parking scarcity.
Nelson\Nygaard helped SF State and the City and County of San Francisco negotiate a
Memorandum of Understanding (MOU) in October 2007. The MOU includes the University’s
“fair share” funding commitment to address the impacts of campus growth on the surrounding
neighborhood and the transportation network. The University committed to almost $2 million in
transit improvements, along with an extensive list of programs and projects to minimize vehicle
trips.
The MOU includes the establishment of a traffic monitoring and mitigation program to determine
whether the University’s expanded Transportation Demand Management (TDM) efforts are
successfully minimizing or avoiding new peak hour trips. As part of the traffic monitoring and
mitigation program, the University was required to conduct a baseline cordon count and intercept
survey no less than 12 months after the certification of the master plan EIR. Furthermore,
additional cordon counts must be conducted at intervals of no more than every three years, and
no later than when enrollment grows by 1,000 students by headcount.
In fulfillment of the requirements, SF State conducted the baseline cordon count and intercept
survey on the main campus at 1600 Holloway Avenue on Wednesday, April 30, 2008. A
Wednesday was selected to ensure that the cordon count and intercept survey would be
representative of a typical day on campus, when classes are in session and most affiliates are on
campus. The cordon count covered 15 vehicle, pedestrian, and bicycle entry points to campus.
Intercept surveys were conducted at seven entrances to campus, and a total of 1,400 surveys were
completed.
A subsequent cordon count was conducted on Wednesday, April 27, 2011. The second cordon
count covered 16 vehicle, pedestrian, and bicycle entry points to campus. In 2014, the cordon
count methodology was revised significantly to focus on vehicle entry points to campus. The third
cordon count was conducted on Wednesday, April 23, 2014 at nine locations, and the fourth
cordon count was conducted on Wednesday, April 7, 2016 at nine locations.
In addition to the cordon count, the University conducted online surveys in 2008, 2011, 2014, and
2016. The online survey, sent to all University affiliates, replaced the intercept survey, per
discussions between the University and the San Francisco Municipal Transportation Agency
(SFMTA). An online survey can provide more detailed information on travel behavior than can be
collected during an intercept survey or cordon count.
This report presents the findings from the online survey and cordon count efforts on Wednesday,
April 6, 2016. In total, 3,090 University affiliates responded to the online survey. The report
provides an in-depth analysis of the online survey, with a discussion of methodology and a
comparison of 2016 survey results to those from previous surveys. The report concludes with a
carbon footprint analysis for commute trips using data gathered from the online survey.

2016 Transportation Survey Results | DRAFT
San Francisco State University
Nelson\Nygaard Consulting Associates Inc. | 3-1
3 ONLINE SURVEY
San Francisco State University conducted an online survey that asked University affiliates how
they travelled to and from campus on Wednesday, April 6, 2016. A total of 3,090 University
affiliates responded to the survey, and of the total, 2,358 stated that they were on campus on
Wednesday, April 6.
SURVEY DESIGN
Survey respondents were asked a series of questions about their commutes and general travel
behavior for trips to and from SF State’s main campus at 1600 Holloway on Wednesday, April 6,
2016. All respondents were asked a number of background questions, such as their primary
affiliation with the University and their zip code. Respondents were then asked to provide travel
information for up to four legs of their journey to and from campus.
Each leg of the journey was treated as a separate question, and respondents were asked to identify
the mode they took for each leg. For example, someone who drove to BART and then took the SF
State shuttle from the Daly City BART station to campus would enter trip information for three
legs. Similarly, if a respondent transferred from one Muni route to another Muni route, they
would enter trip information for two legs. If respondents took Muni, they were asked to select the
Muni route they took, and if a respondent selected BART or Caltrain, they were asked to identify
their start and end stations. For each leg, respondents were asked to estimate the distance they
traveled, in miles, for that segment of the trip.
Respondents who stated that they drove or carpooled to campus were asked a series of questions
related to parking, including their parking location and how much they paid for parking.
Respondents were also asked their arrival and departure time to campus, as well as participation
and knowledge of different TDM programs and services.
The 2016 survey was similar to the 2014 version. To accommodate the rise of Transportation
Network Companies (TNCs) such as Lyft and Uber, TNCs were added as a mode choice option in
the 2016 survey. The 2016 survey also included arrival and departure times, which had been left
out of the 2014 survey inadvertently. The 2016 survey also included updated Muni routes and
names, given SFMTA’s Muni Forward initiative that has included substantial route changes since
2014.
The survey was implemented in the Qualtrics survey platform. A copy of the online survey
instrument is provided in the Appendix A for reference.
Constraints and Limitations
In 2016, a total of 3,090 University affiliates responded to the survey, and out of the 3,090 total
respondents, 2,358 persons (76% of respondents) stated they were on campus on Wednesday,
2016 Transportation Survey Results | DRAFT
San Francisco State University
Nelson\Nygaard Consulting Associates Inc. | 3-2
April 6. Only those people who stated they were on campus are included in this analysis unless
otherwise noted.
The response rate in 2016 (9%) were lower than in previous years (12% in 2014, 11% in 2011, and
13% in 2008), which might be primarily attributed to the timing and marketing of the survey.
Other major campus efforts, such as the student transit pass referendum and the anticipation of a
possible, but avoided, strike may have added to survey fatigue among campus affiliates. Despite a
lower response rate than previous years, the survey sample is still statistically valid. For a campus
population of 33,563, a minimum of 1,753 responses is needed to generate results at a 99%
confidence level with a confidence interval of +/-3%. The 3,090 survey responses received
exceeds this minimum number of survey responses needed for statistical significance.
METHODOLOGY
The online survey collected rich data on trip patterns. Data clean-up and restructuring was
necessary to allow for data analysis. This section describes the data clean-up and restructuring
processes, including assignment of weights to make the survey response distribution among
students, staff, and faculty reflect the distribution of those groups among the campus population
as a whole.
Data Clean-up and Data Restructuring
A number of steps were taken to clean and restructure the online survey responses to properly
format them for analysis. Duplicates were removed, and data was cleaned to ensure ease of
analysis.
The format of the online survey made it possible for respondents to select up to four legs of their
trip. A few respondents did not report on the legs of their trip to campus in a logical or feasible
way. For example, a total of 42 respondents stated that they arrived on campus via Caltrain or
BART. Since that is not physically possible, the last leg of their journey was adjusted. For
respondents with a last leg mode of Caltrain, their record was adjusted to reflect taking BART
from Millbrae to Daly City and then transferring to the SF State Shuttle or Muni Route 28. For
respondents stating that they arrived on campus via BART, their records were adjusted to reflect
the SF State Shuttle or Muni Route 28 as their last mode. 1
Mode Split
In order to determine the mode split for University affiliates commuting to and from campus, it
was necessary to create several new variables. The newly created variables are as follows:
1. Arrival Mode – The “arrival mode” is the mode by which respondents arrived on campus.
2. Mode prior to arrival mode – The “mode prior to arrival mode” is the mode respondents
used before their arrival mode. This trip may have occurred on leg 1, 2, or 3 of their trip,
depending on the total number of legs. Respondents who used only one mode of
transportation to arrive on campus have no recorded “mode prior to arrival mode.”
1 Respondents who stated they arrived by BART or Caltrain were assigned to Muni Route 28 or the SF State Shuttle based on the percentage breakdown of those respondents who said they took BART and selected a mode of arrival of either Muni Route 28 or the SF Shuttle.
2016 Transportation Survey Results | DRAFT
San Francisco State University
Nelson\Nygaard Consulting Associates Inc. | 3-3
3. Departure Mode – The “departure mode” is the mode by which respondents left campus,
the first leg of the trip from campus.
In addition to creating new variables, the existing data needed to be restructured in order to meet
the requirements of the MOU between the University and the City and County of San Francisco.
The MOU requires that all respondents who park and walk within 10 minutes of campus be
classified as drivers rather than walkers when determining the mode split and peak hour auto
trips. The following steps were taken to address this requirement:
1. Respondents with an arrival mode of walking and a mode prior to arrival of driving or
carpooling were identified using the arrival mode variable and the mode prior to arrival
variable.
2. An arrival mode distance variable was then calculated using the responses given in the
survey to the question “Please estimate the distance you travelled in this segment of your
trip.” People whose walk segment was a half mile or less were classified with an auto
arrival mode. Half a mile was used because the average speed of walkers is three miles per
hour, meaning a 10 minute walk is equivalent to approximately a half mile.
3. For people who did not provide a distance, the location where they parked their car was
used. Respondents who drove or carpooled and parked on or near campus were asked to
select the zone that corresponded to their parking location on a map of the area
surrounding campus. The map covered the area bounded by I-280, Lake Merced
Boulevard, Sloat Boulevard, Santa Clara Avenue, Victoria Street, and Head Street.
Respondents were given 19 zones from which to choose. Using a half-mile radius, the
zones that are within a 10-minute walk to campus were identified. Zones where part but
not all of the zone is within a 10-minute walk were considered to be within the half-mile
radius. Of the 19 zones, only three are not within the half-mile radius.
4. The same steps were then repeated for the trips from campus.
A similar methodology was applied to people whose arrival mode was “walk” and their mode prior
to arrival was Muni in order to more accurately determine the number of peak-hour Muni trips,
as required by the MOU. The following steps were taken to address this requirement:
1. Using the arrival mode distance variable, respondents whose walk segment was a half-
mile or less were reclassified with a Muni arrival mode. For respondents who did not
provide an arrival mode distance, the “Muni route taken” was used. People travelling on
routes directly serving campus (M-Ocean View, 57-Parkmerced, 18-46th Avenue, 28-19th
Avenue, 28R-19th Avenue Rapid, and 29-Sunset) were reclassified with a Muni arrival
mode. Persons travelling on any other Muni routes retained “walk” as their arrival mode.
2. The same steps were then repeated for the trips from campus
Weights
Based on the distribution of responses between students and faculty/staff, a weight was created
and applied to all responses for the analysis.
As of Spring 2016, there were approximately 30,000 students and 3,300 faculty and staff
members are on campus (
Figure 3-1 and Figure 3-2). The analysis team weighted survey responses to yield an equivalent
ratio. It should be noted weights were applied to responses from people who stated they were on
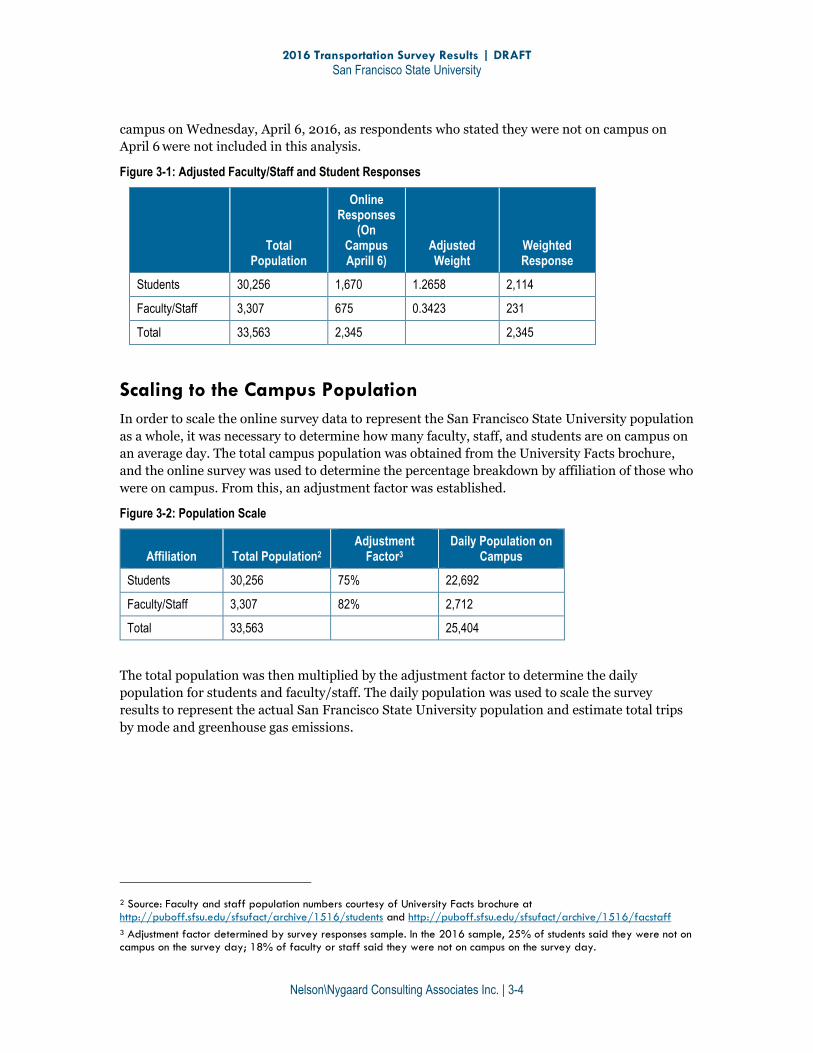
2016 Transportation Survey Results | DRAFT
San Francisco State University
Nelson\Nygaard Consulting Associates Inc. | 3-4
campus on Wednesday, April 6, 2016, as respondents who stated they were not on campus on
April 6 were not included in this analysis.
Figure 3-1: Adjusted Faculty/Staff and Student Responses
Total
Population
Online Responses
(On Campus Aprill 6)
Adjusted Weight
Weighted Response
Students 30,256 1,670 1.2658 2,114
Faculty/Staff 3,307 675 0.3423 231
Total 33,563 2,345 2,345
Scaling to the Campus Population
In order to scale the online survey data to represent the San Francisco State University population
as a whole, it was necessary to determine how many faculty, staff, and students are on campus on
an average day. The total campus population was obtained from the University Facts brochure,
and the online survey was used to determine the percentage breakdown by affiliation of those who
were on campus. From this, an adjustment factor was established.
Figure 3-2: Population Scale
Affiliation Total Population2 Adjustment
Factor3 Daily Population on
Campus
Students 30,256 75% 22,692
Faculty/Staff 3,307 82% 2,712
Total 33,563 25,404
The total population was then multiplied by the adjustment factor to determine the daily
population for students and faculty/staff. The daily population was used to scale the survey
results to represent the actual San Francisco State University population and estimate total trips
by mode and greenhouse gas emissions.
2 Source: Faculty and staff population numbers courtesy of University Facts brochure at http://puboff.sfsu.edu/sfsufact/archive/1516/students and http://puboff.sfsu.edu/sfsufact/archive/1516/facstaff
3 Adjustment factor determined by survey responses sample. In the 2016 sample, 25% of students said they were not on campus on the survey day; 18% of faculty or staff said they were not on campus on the survey day.
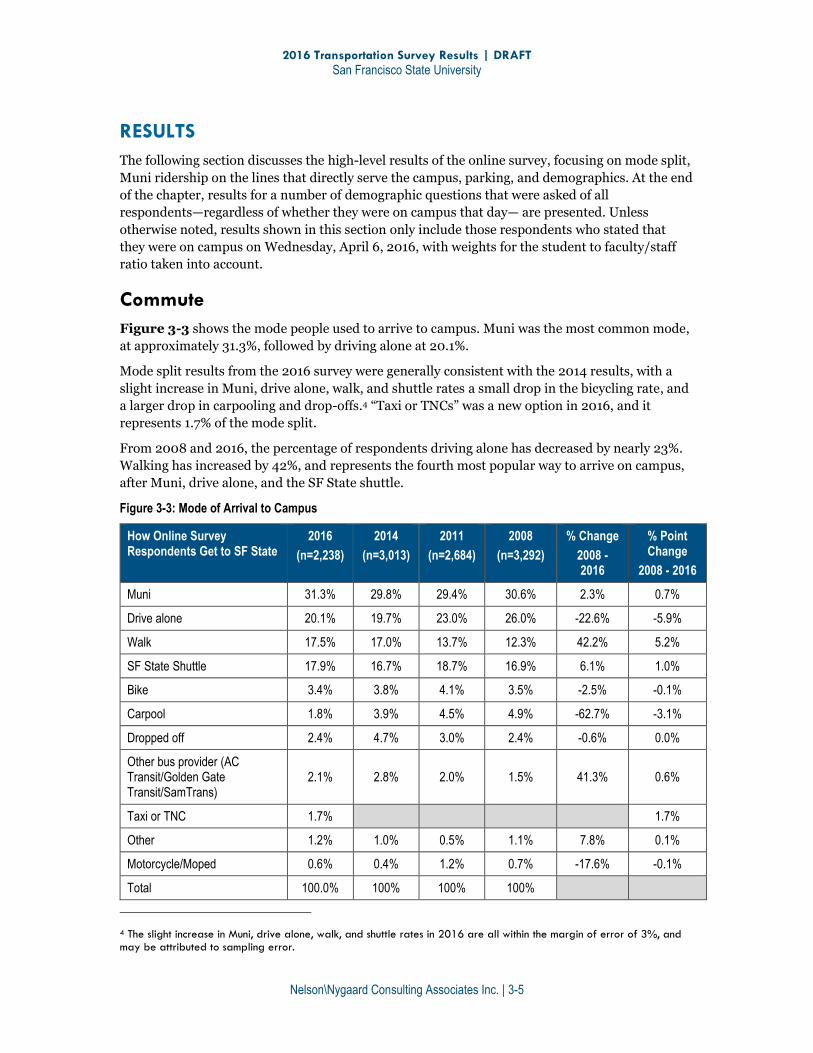
2016 Transportation Survey Results | DRAFT
San Francisco State University
Nelson\Nygaard Consulting Associates Inc. | 3-5
RESULTS
The following section discusses the high-level results of the online survey, focusing on mode split,
Muni ridership on the lines that directly serve the campus, parking, and demographics. At the end
of the chapter, results for a number of demographic questions that were asked of all
respondents—regardless of whether they were on campus that day— are presented. Unless
otherwise noted, results shown in this section only include those respondents who stated that
they were on campus on Wednesday, April 6, 2016, with weights for the student to faculty/staff
ratio taken into account.
Commute
Figure 3-3 shows the mode people used to arrive to campus. Muni was the most common mode,
at approximately 31.3%, followed by driving alone at 20.1%.
Mode split results from the 2016 survey were generally consistent with the 2014 results, with a
slight increase in Muni, drive alone, walk, and shuttle rates a small drop in the bicycling rate, and
a larger drop in carpooling and drop-offs.4 “Taxi or TNCs” was a new option in 2016, and it
represents 1.7% of the mode split.
From 2008 and 2016, the percentage of respondents driving alone has decreased by nearly 23%.
Walking has increased by 42%, and represents the fourth most popular way to arrive on campus,
after Muni, drive alone, and the SF State shuttle.
Figure 3-3: Mode of Arrival to Campus
How Online Survey Respondents Get to SF State
2016
(n=2,238)
2014
(n=3,013)
2011
(n=2,684)
2008
(n=3,292)
% Change
2008 - 2016
% Point Change
2008 - 2016
Muni 31.3% 29.8% 29.4% 30.6% 2.3% 0.7%
Drive alone 20.1% 19.7% 23.0% 26.0% -22.6% -5.9%
Walk 17.5% 17.0% 13.7% 12.3% 42.2% 5.2%
SF State Shuttle 17.9% 16.7% 18.7% 16.9% 6.1% 1.0%
Bike 3.4% 3.8% 4.1% 3.5% -2.5% -0.1%
Carpool 1.8% 3.9% 4.5% 4.9% -62.7% -3.1%
Dropped off 2.4% 4.7% 3.0% 2.4% -0.6% 0.0%
Other bus provider (AC Transit/Golden Gate Transit/SamTrans)
2.1% 2.8% 2.0% 1.5% 41.3% 0.6%
Taxi or TNC 1.7% 1.7%
Other 1.2% 1.0% 0.5% 1.1% 7.8% 0.1%
Motorcycle/Moped 0.6% 0.4% 1.2% 0.7% -17.6% -0.1%
Total 100.0% 100% 100% 100%
4 The slight increase in Muni, drive alone, walk, and shuttle rates in 2016 are all within the margin of error of 3%, and may be attributed to sampling error.
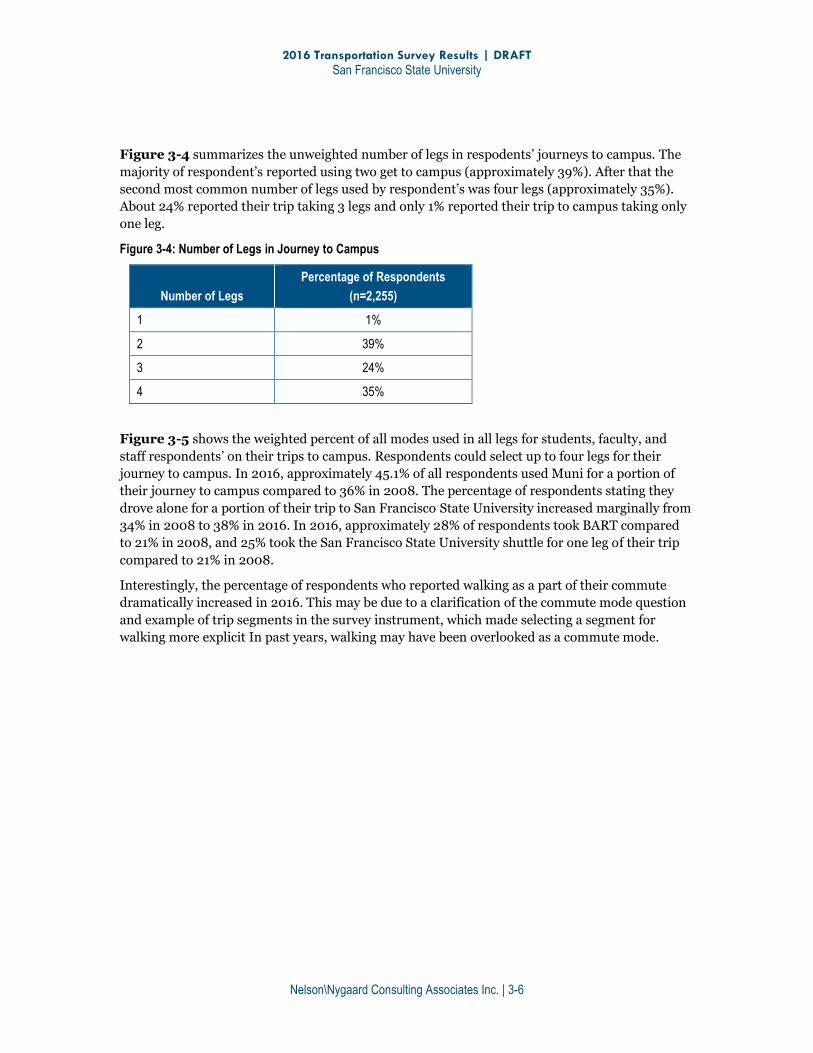
2016 Transportation Survey Results | DRAFT
San Francisco State University
Nelson\Nygaard Consulting Associates Inc. | 3-6
Figure 3-4 summarizes the unweighted number of legs in respodents’ journeys to campus. The
majority of respondent’s reported using two get to campus (approximately 39%). After that the
second most common number of legs used by respondent’s was four legs (approximately 35%).
About 24% reported their trip taking 3 legs and only 1% reported their trip to campus taking only
one leg.
Figure 3-4: Number of Legs in Journey to Campus
Number of Legs
Percentage of Respondents
(n=2,255)
1 1%
2 39%
3 24%
4 35%
Figure 3-5 shows the weighted percent of all modes used in all legs for students, faculty, and
staff respondents’ on their trips to campus. Respondents could select up to four legs for their
journey to campus. In 2016, approximately 45.1% of all respondents used Muni for a portion of
their journey to campus compared to 36% in 2008. The percentage of respondents stating they
drove alone for a portion of their trip to San Francisco State University increased marginally from
34% in 2008 to 38% in 2016. In 2016, approximately 28% of respondents took BART compared
to 21% in 2008, and 25% took the San Francisco State University shuttle for one leg of their trip
compared to 21% in 2008.
Interestingly, the percentage of respondents who reported walking as a part of their commute
dramatically increased in 2016. This may be due to a clarification of the commute mode question
and example of trip segments in the survey instrument, which made selecting a segment for
walking more explicit In past years, walking may have been overlooked as a commute mode.
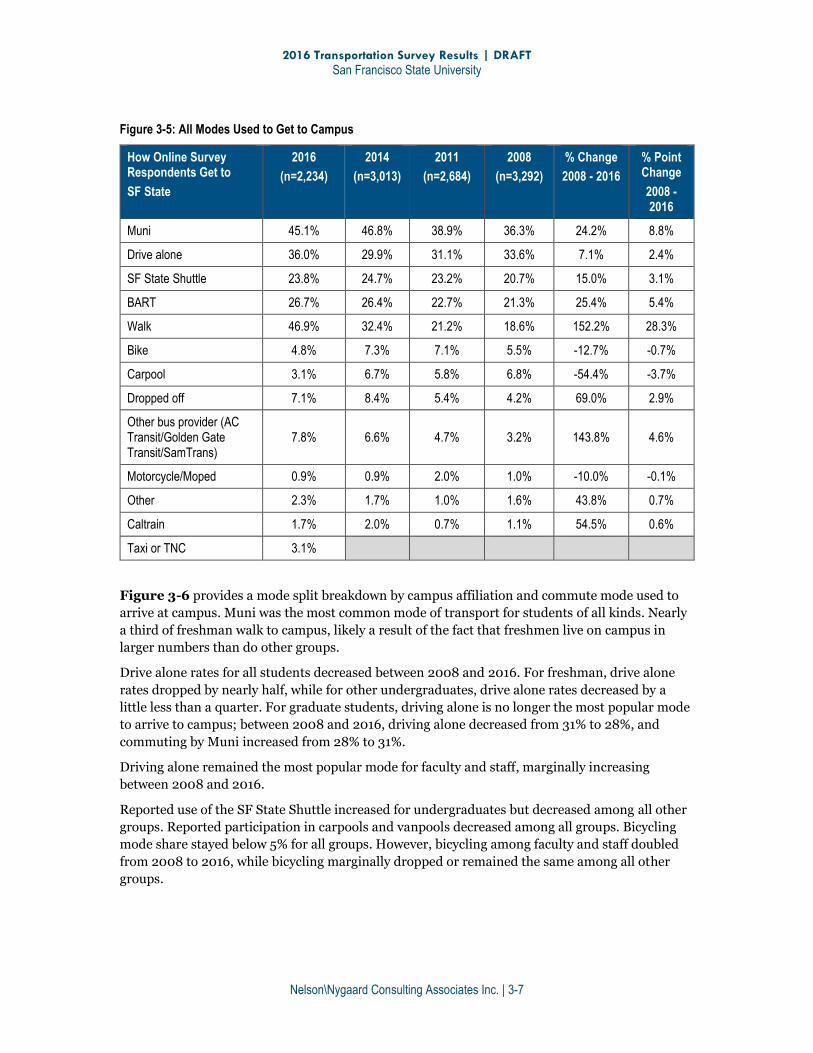
2016 Transportation Survey Results | DRAFT
San Francisco State University
Nelson\Nygaard Consulting Associates Inc. | 3-7
Figure 3-5: All Modes Used to Get to Campus
How Online Survey Respondents Get to
SF State
2016
(n=2,234)
2014
(n=3,013)
2011
(n=2,684)
2008
(n=3,292)
% Change
2008 - 2016
% Point Change
2008 - 2016
Muni 45.1% 46.8% 38.9% 36.3% 24.2% 8.8%
Drive alone 36.0% 29.9% 31.1% 33.6% 7.1% 2.4%
SF State Shuttle 23.8% 24.7% 23.2% 20.7% 15.0% 3.1%
BART 26.7% 26.4% 22.7% 21.3% 25.4% 5.4%
Walk 46.9% 32.4% 21.2% 18.6% 152.2% 28.3%
Bike 4.8% 7.3% 7.1% 5.5% -12.7% -0.7%
Carpool 3.1% 6.7% 5.8% 6.8% -54.4% -3.7%
Dropped off 7.1% 8.4% 5.4% 4.2% 69.0% 2.9%
Other bus provider (AC Transit/Golden Gate Transit/SamTrans)
7.8% 6.6% 4.7% 3.2% 143.8% 4.6%
Motorcycle/Moped 0.9% 0.9% 2.0% 1.0% -10.0% -0.1%
Other 2.3% 1.7% 1.0% 1.6% 43.8% 0.7%
Caltrain 1.7% 2.0% 0.7% 1.1% 54.5% 0.6%
Taxi or TNC 3.1%
Figure 3-6 provides a mode split breakdown by campus affiliation and commute mode used to
arrive at campus. Muni was the most common mode of transport for students of all kinds. Nearly
a third of freshman walk to campus, likely a result of the fact that freshmen live on campus in
larger numbers than do other groups.
Drive alone rates for all students decreased between 2008 and 2016. For freshman, drive alone
rates dropped by nearly half, while for other undergraduates, drive alone rates decreased by a
little less than a quarter. For graduate students, driving alone is no longer the most popular mode
to arrive to campus; between 2008 and 2016, driving alone decreased from 31% to 28%, and
commuting by Muni increased from 28% to 31%.
Driving alone remained the most popular mode for faculty and staff, marginally increasing
between 2008 and 2016.
Reported use of the SF State Shuttle increased for undergraduates but decreased among all other
groups. Reported participation in carpools and vanpools decreased among all groups. Bicycling
mode share stayed below 5% for all groups. However, bicycling among faculty and staff doubled
from 2008 to 2016, while bicycling marginally dropped or remained the same among all other
groups.
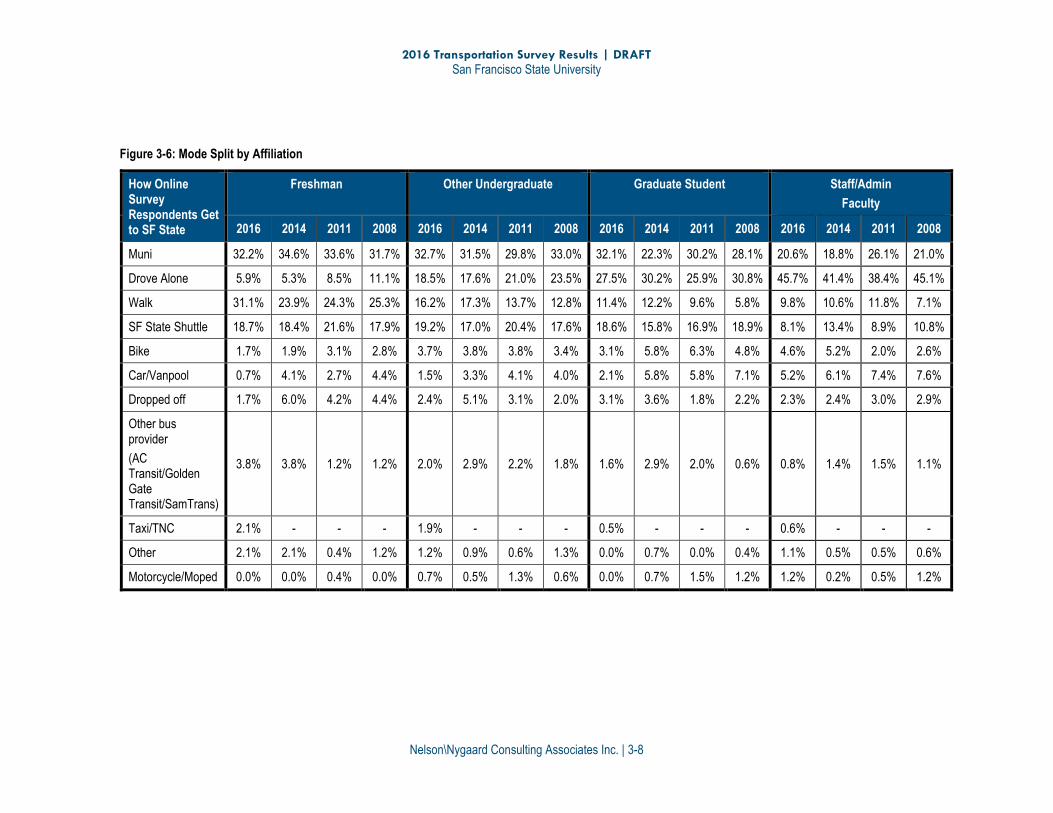
2016 Transportation Survey Results | DRAFT
San Francisco State University
Nelson\Nygaard Consulting Associates Inc. | 3-8
Figure 3-6: Mode Split by Affiliation
How Online Survey Respondents Get to SF State
Freshman Other Undergraduate Graduate Student Staff/Admin
Faculty
2016 2014 2011 2008 2016 2014 2011 2008 2016 2014 2011 2008 2016 2014 2011 2008
Muni 32.2% 34.6% 33.6% 31.7% 32.7% 31.5% 29.8% 33.0% 32.1% 22.3% 30.2% 28.1% 20.6% 18.8% 26.1% 21.0%
Drove Alone 5.9% 5.3% 8.5% 11.1% 18.5% 17.6% 21.0% 23.5% 27.5% 30.2% 25.9% 30.8% 45.7% 41.4% 38.4% 45.1%
Walk 31.1% 23.9% 24.3% 25.3% 16.2% 17.3% 13.7% 12.8% 11.4% 12.2% 9.6% 5.8% 9.8% 10.6% 11.8% 7.1%
SF State Shuttle 18.7% 18.4% 21.6% 17.9% 19.2% 17.0% 20.4% 17.6% 18.6% 15.8% 16.9% 18.9% 8.1% 13.4% 8.9% 10.8%
Bike 1.7% 1.9% 3.1% 2.8% 3.7% 3.8% 3.8% 3.4% 3.1% 5.8% 6.3% 4.8% 4.6% 5.2% 2.0% 2.6%
Car/Vanpool 0.7% 4.1% 2.7% 4.4% 1.5% 3.3% 4.1% 4.0% 2.1% 5.8% 5.8% 7.1% 5.2% 6.1% 7.4% 7.6%
Dropped off 1.7% 6.0% 4.2% 4.4% 2.4% 5.1% 3.1% 2.0% 3.1% 3.6% 1.8% 2.2% 2.3% 2.4% 3.0% 2.9%
Other bus provider
(AC Transit/Golden Gate Transit/SamTrans)
3.8% 3.8% 1.2% 1.2% 2.0% 2.9% 2.2% 1.8% 1.6% 2.9% 2.0% 0.6% 0.8% 1.4% 1.5% 1.1%
Taxi/TNC 2.1% - - - 1.9% - - - 0.5% - - - 0.6% - - -
Other 2.1% 2.1% 0.4% 1.2% 1.2% 0.9% 0.6% 1.3% 0.0% 0.7% 0.0% 0.4% 1.1% 0.5% 0.5% 0.6%
Motorcycle/Moped 0.0% 0.0% 0.4% 0.0% 0.7% 0.5% 1.3% 0.6% 0.0% 0.7% 1.5% 1.2% 1.2% 0.2% 0.5% 1.2%
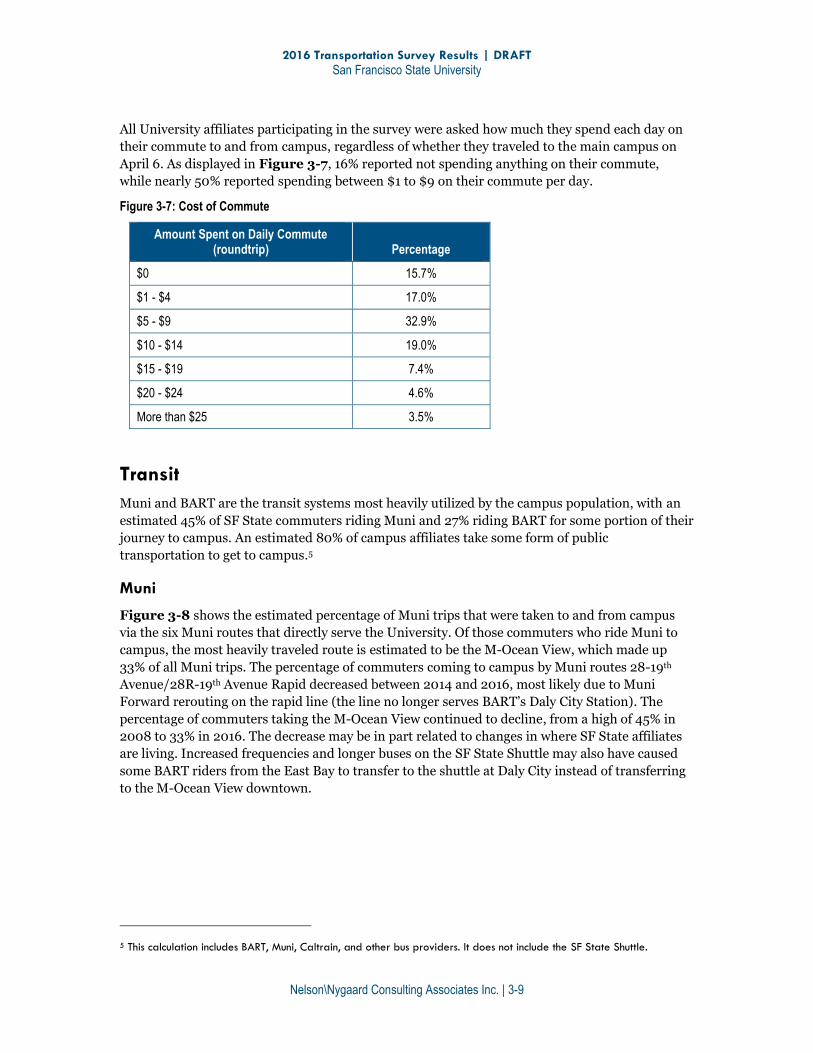
2016 Transportation Survey Results | DRAFT
San Francisco State University
Nelson\Nygaard Consulting Associates Inc. | 3-9
All University affiliates participating in the survey were asked how much they spend each day on
their commute to and from campus, regardless of whether they traveled to the main campus on
April 6. As displayed in Figure 3-7, 16% reported not spending anything on their commute,
while nearly 50% reported spending between $1 to $9 on their commute per day.
Figure 3-7: Cost of Commute
Amount Spent on Daily Commute (roundtrip) Percentage
$0 15.7%
$1 - $4 17.0%
$5 - $9 32.9%
$10 - $14 19.0%
$15 - $19 7.4%
$20 - $24 4.6%
More than $25 3.5%
Transit
Muni and BART are the transit systems most heavily utilized by the campus population, with an
estimated 45% of SF State commuters riding Muni and 27% riding BART for some portion of their
journey to campus. An estimated 80% of campus affiliates take some form of public
transportation to get to campus.5
Muni
Figure 3-8 shows the estimated percentage of Muni trips that were taken to and from campus
via the six Muni routes that directly serve the University. Of those commuters who ride Muni to
campus, the most heavily traveled route is estimated to be the M-Ocean View, which made up
33% of all Muni trips. The percentage of commuters coming to campus by Muni routes 28-19th
Avenue/28R-19th Avenue Rapid decreased between 2014 and 2016, most likely due to Muni
Forward rerouting on the rapid line (the line no longer serves BART’s Daly City Station). The
percentage of commuters taking the M-Ocean View continued to decline, from a high of 45% in
2008 to 33% in 2016. The decrease may be in part related to changes in where SF State affiliates
are living. Increased frequencies and longer buses on the SF State Shuttle may also have caused
some BART riders from the East Bay to transfer to the shuttle at Daly City instead of transferring
to the M-Ocean View downtown.
5 This calculation includes BART, Muni, Caltrain, and other bus providers. It does not include the SF State Shuttle.
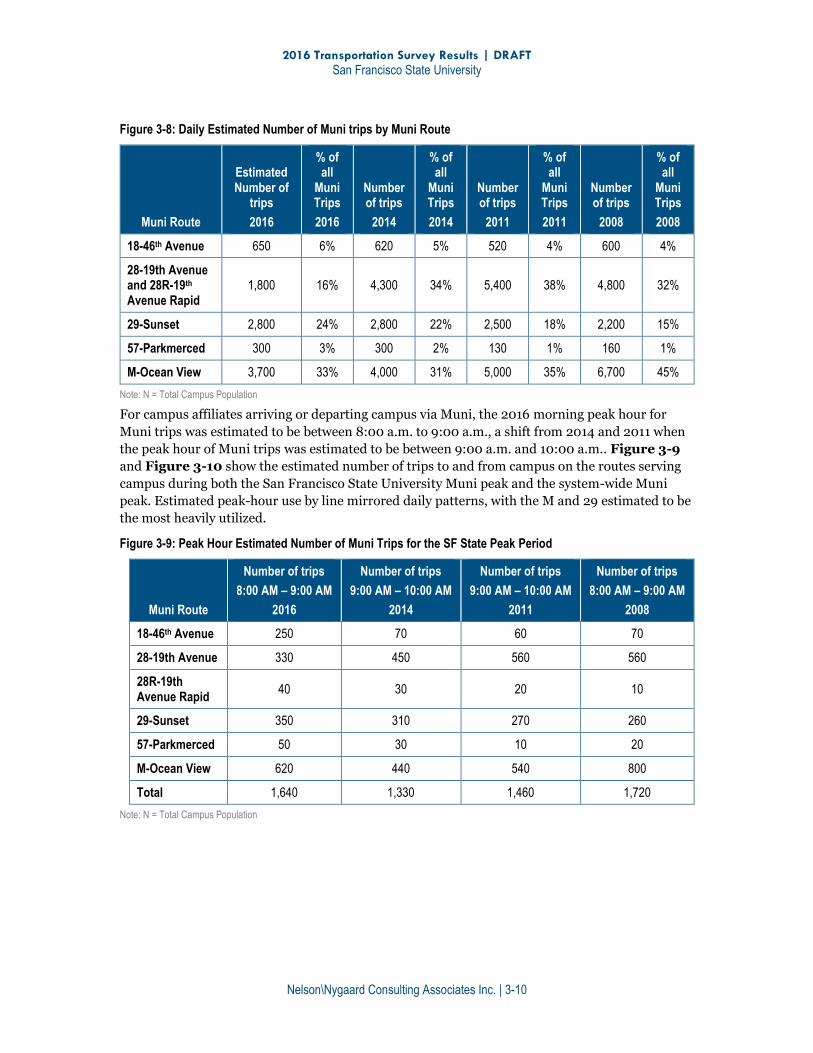
2016 Transportation Survey Results | DRAFT
San Francisco State University
Nelson\Nygaard Consulting Associates Inc. | 3-10
Figure 3-8: Daily Estimated Number of Muni trips by Muni Route
Muni Route
Estimated Number of
trips
2016
% of all
Muni Trips
2016
Number of trips
2014
% of all
Muni Trips
2014
Number of trips
2011
% of all
Muni Trips
2011
Number of trips
2008
% of all
Muni Trips
2008
18-46th Avenue 650 6% 620 5% 520 4% 600 4%
28-19th Avenue and 28R-19th Avenue Rapid
1,800 16% 4,300 34% 5,400 38% 4,800 32%
29-Sunset 2,800 24% 2,800 22% 2,500 18% 2,200 15%
57-Parkmerced 300 3% 300 2% 130 1% 160 1%
M-Ocean View 3,700 33% 4,000 31% 5,000 35% 6,700 45%
Note: N = Total Campus Population
For campus affiliates arriving or departing campus via Muni, the 2016 morning peak hour for
Muni trips was estimated to be between 8:00 a.m. to 9:00 a.m., a shift from 2014 and 2011 when
the peak hour of Muni trips was estimated to be between 9:00 a.m. and 10:00 a.m.. Figure 3-9
and Figure 3-10 show the estimated number of trips to and from campus on the routes serving
campus during both the San Francisco State University Muni peak and the system-wide Muni
peak. Estimated peak-hour use by line mirrored daily patterns, with the M and 29 estimated to be
the most heavily utilized.
Figure 3-9: Peak Hour Estimated Number of Muni Trips for the SF State Peak Period
Muni Route
Number of trips
8:00 AM – 9:00 AM
2016
Number of trips
9:00 AM – 10:00 AM
2014
Number of trips
9:00 AM – 10:00 AM
2011
Number of trips
8:00 AM – 9:00 AM
2008
18-46th Avenue 250 70 60 70
28-19th Avenue 330 450 560 560
28R-19th Avenue Rapid
40 30 20 10
29-Sunset 350 310 270 260
57-Parkmerced 50 30 10 20
M-Ocean View 620 440 540 800
Total 1,640 1,330 1,460 1,720
Note: N = Total Campus Population
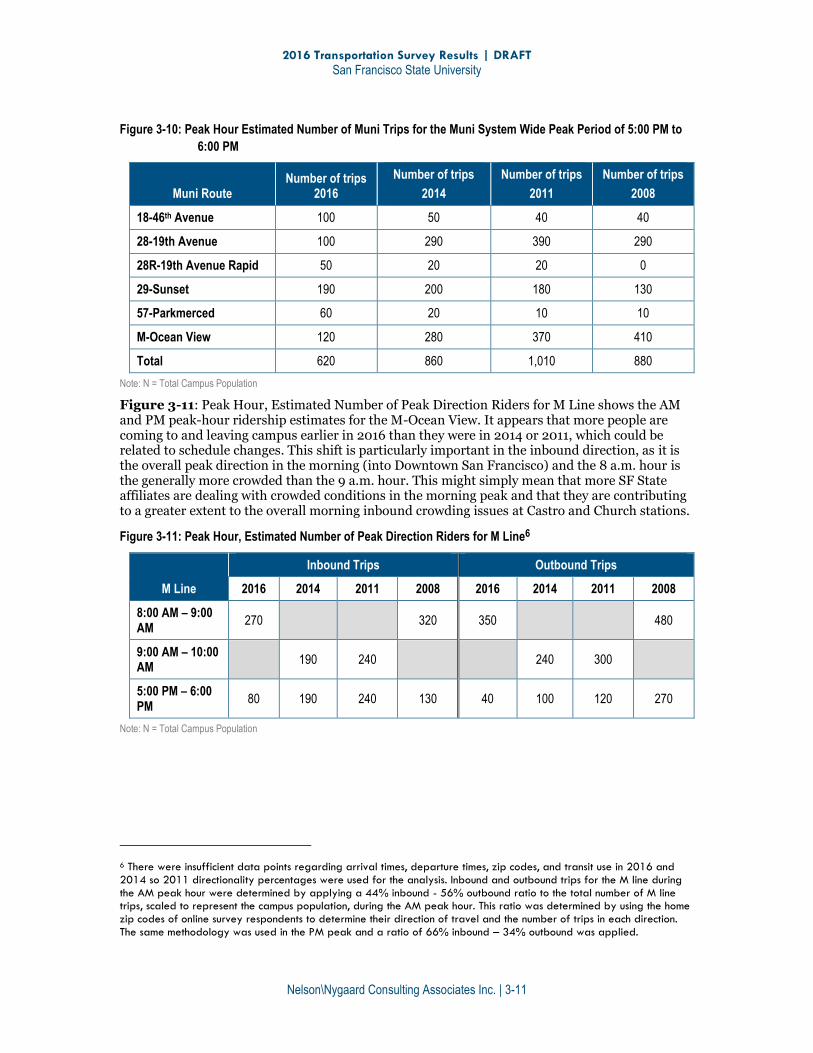
2016 Transportation Survey Results | DRAFT
San Francisco State University
Nelson\Nygaard Consulting Associates Inc. | 3-11
Figure 3-10: Peak Hour Estimated Number of Muni Trips for the Muni System Wide Peak Period of 5:00 PM to
6:00 PM
Muni Route Number of trips
2016
Number of trips
2014
Number of trips
2011
Number of trips
2008
18-46th Avenue 100 50 40 40
28-19th Avenue 100 290 390 290
28R-19th Avenue Rapid 50 20 20 0
29-Sunset 190 200 180 130
57-Parkmerced 60 20 10 10
M-Ocean View 120 280 370 410
Total 620 860 1,010 880
Note: N = Total Campus Population
Figure 3-11: Peak Hour, Estimated Number of Peak Direction Riders for M Line shows the AM and PM peak-hour ridership estimates for the M-Ocean View. It appears that more people are coming to and leaving campus earlier in 2016 than they were in 2014 or 2011, which could be related to schedule changes. This shift is particularly important in the inbound direction, as it is the overall peak direction in the morning (into Downtown San Francisco) and the 8 a.m. hour is the generally more crowded than the 9 a.m. hour. This might simply mean that more SF State affiliates are dealing with crowded conditions in the morning peak and that they are contributing to a greater extent to the overall morning inbound crowding issues at Castro and Church stations.
Figure 3-11: Peak Hour, Estimated Number of Peak Direction Riders for M Line6
M Line
Inbound Trips Outbound Trips
2016 2014 2011 2008 2016 2014 2011 2008
8:00 AM – 9:00 AM
270 320 350 480
9:00 AM – 10:00 AM
190 240 240 300
5:00 PM – 6:00 PM
80 190 240 130 40 100 120 270
Note: N = Total Campus Population
6 There were insufficient data points regarding arrival times, departure times, zip codes, and transit use in 2016 and 2014 so 2011 directionality percentages were used for the analysis. Inbound and outbound trips for the M line during the AM peak hour were determined by applying a 44% inbound - 56% outbound ratio to the total number of M line trips, scaled to represent the campus population, during the AM peak hour. This ratio was determined by using the home zip codes of online survey respondents to determine their direction of travel and the number of trips in each direction. The same methodology was used in the PM peak and a ratio of 66% inbound – 34% outbound was applied.
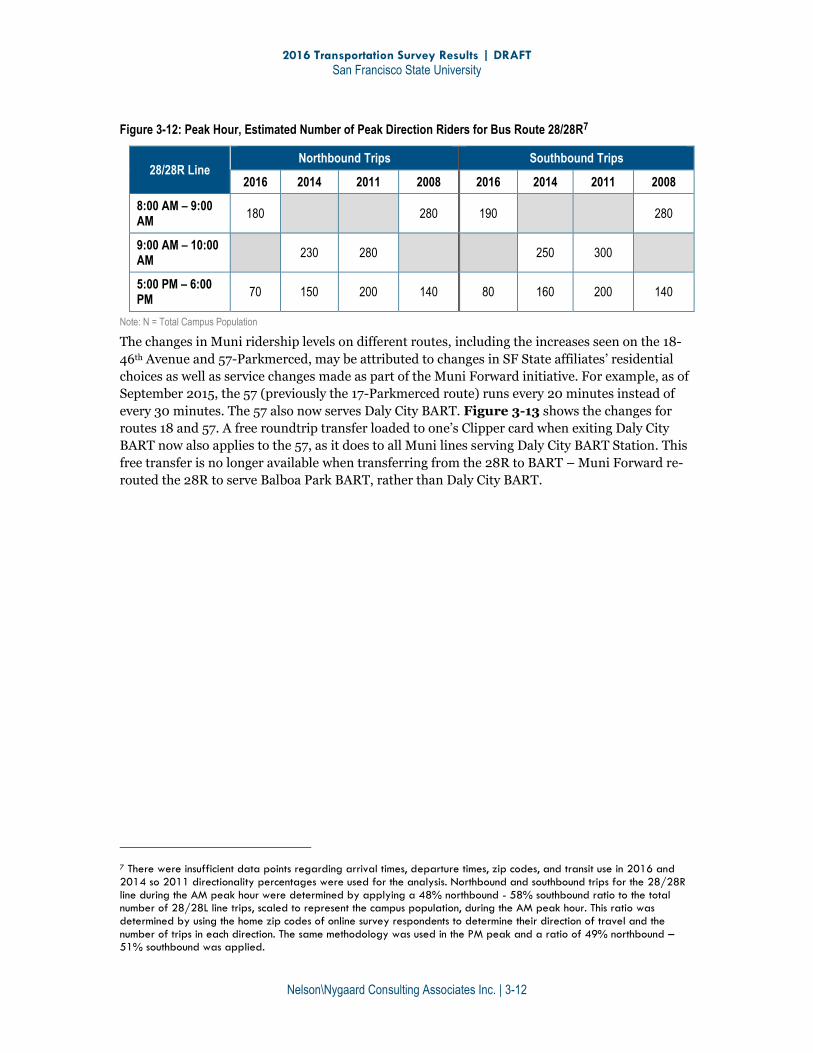
2016 Transportation Survey Results | DRAFT
San Francisco State University
Nelson\Nygaard Consulting Associates Inc. | 3-12
Figure 3-12: Peak Hour, Estimated Number of Peak Direction Riders for Bus Route 28/28R7
28/28R Line Northbound Trips Southbound Trips
2016 2014 2011 2008 2016 2014 2011 2008
8:00 AM – 9:00 AM
180 280 190 280
9:00 AM – 10:00 AM
230 280 250 300
5:00 PM – 6:00 PM
70 150 200 140 80 160 200 140
Note: N = Total Campus Population
The changes in Muni ridership levels on different routes, including the increases seen on the 18-
46th Avenue and 57-Parkmerced, may be attributed to changes in SF State affiliates’ residential
choices as well as service changes made as part of the Muni Forward initiative. For example, as of
September 2015, the 57 (previously the 17-Parkmerced route) runs every 20 minutes instead of
every 30 minutes. The 57 also now serves Daly City BART. Figure 3-13 shows the changes for
routes 18 and 57. A free roundtrip transfer loaded to one’s Clipper card when exiting Daly City
BART now also applies to the 57, as it does to all Muni lines serving Daly City BART Station. This
free transfer is no longer available when transferring from the 28R to BART – Muni Forward re-
routed the 28R to serve Balboa Park BART, rather than Daly City BART.
7 There were insufficient data points regarding arrival times, departure times, zip codes, and transit use in 2016 and 2014 so 2011 directionality percentages were used for the analysis. Northbound and southbound trips for the 28/28R line during the AM peak hour were determined by applying a 48% northbound - 58% southbound ratio to the total number of 28/28L line trips, scaled to represent the campus population, during the AM peak hour. This ratio was determined by using the home zip codes of online survey respondents to determine their direction of travel and the number of trips in each direction. The same methodology was used in the PM peak and a ratio of 49% northbound – 51% southbound was applied.
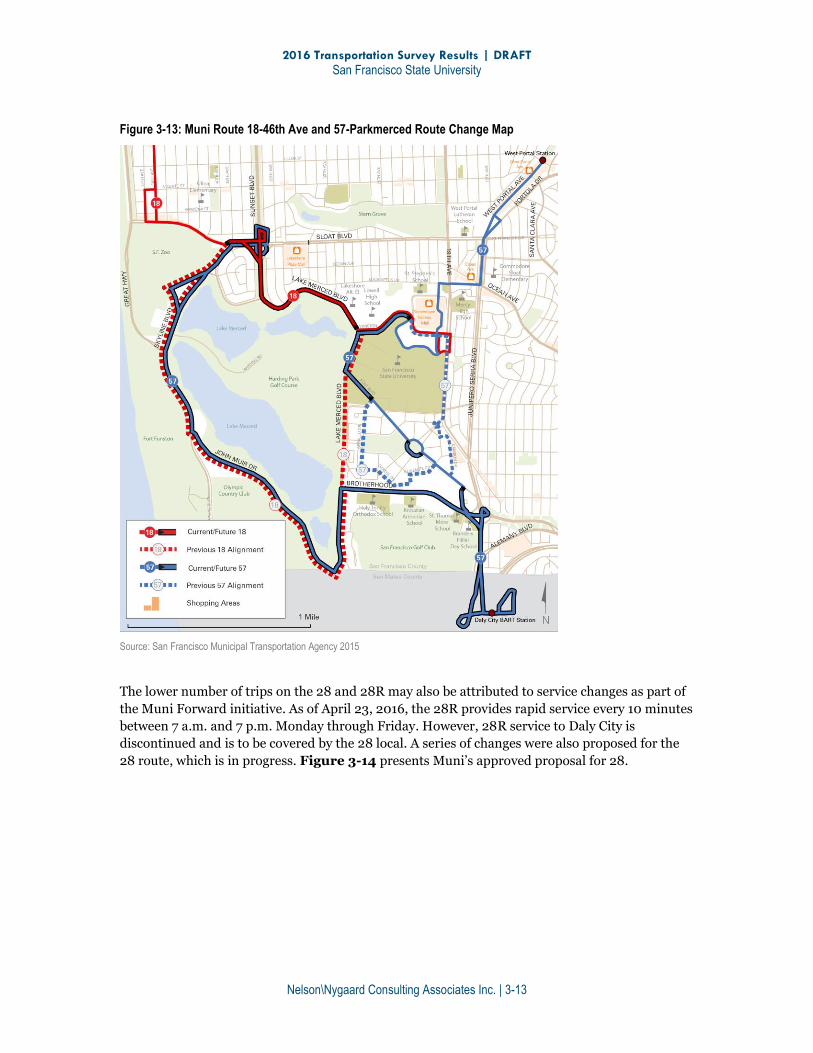
2016 Transportation Survey Results | DRAFT
San Francisco State University
Nelson\Nygaard Consulting Associates Inc. | 3-13
Figure 3-13: Muni Route 18-46th Ave and 57-Parkmerced Route Change Map
Source: San Francisco Municipal Transportation Agency 2015
The lower number of trips on the 28 and 28R may also be attributed to service changes as part of
the Muni Forward initiative. As of April 23, 2016, the 28R provides rapid service every 10 minutes
between 7 a.m. and 7 p.m. Monday through Friday. However, 28R service to Daly City is
discontinued and is to be covered by the 28 local. A series of changes were also proposed for the
28 route, which is in progress. Figure 3-14 presents Muni’s approved proposal for 28.
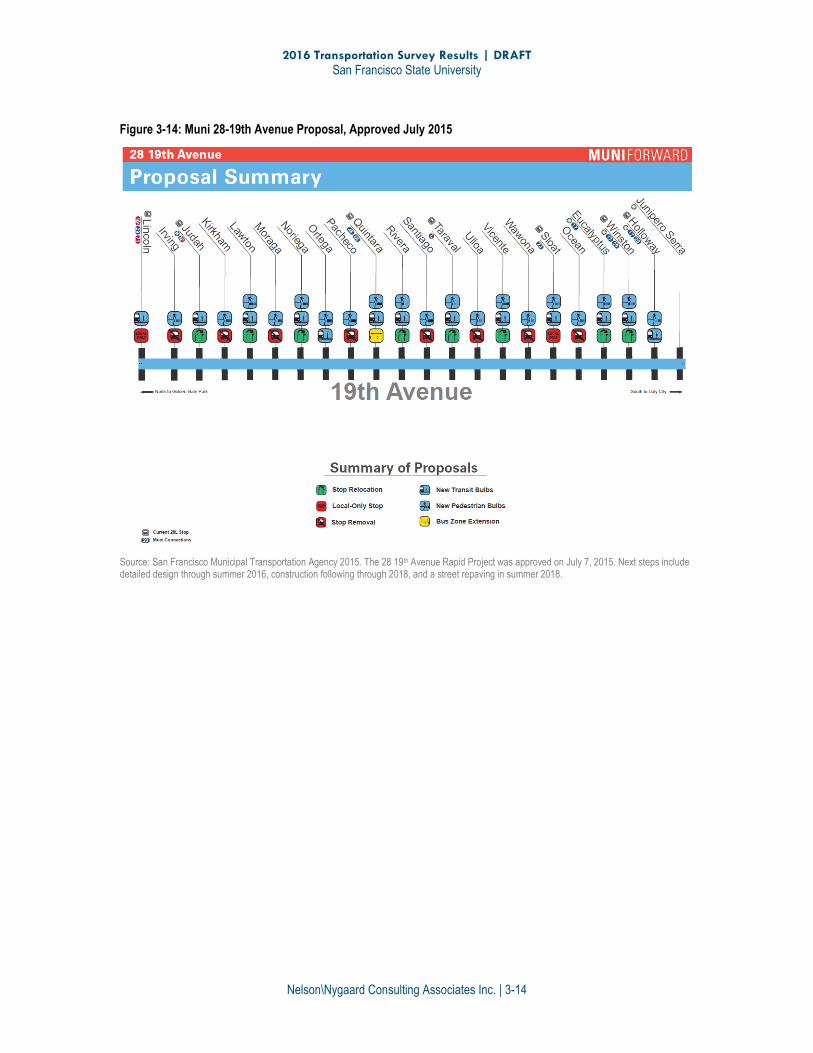
2016 Transportation Survey Results | DRAFT
San Francisco State University
Nelson\Nygaard Consulting Associates Inc. | 3-14
Figure 3-14: Muni 28-19th Avenue Proposal, Approved July 2015
Source: San Francisco Municipal Transportation Agency 2015. The 28 19th Avenue Rapid Project was approved on July 7, 2015. Next steps include detailed design through summer 2016, construction following through 2018, and a street repaving in summer 2018.
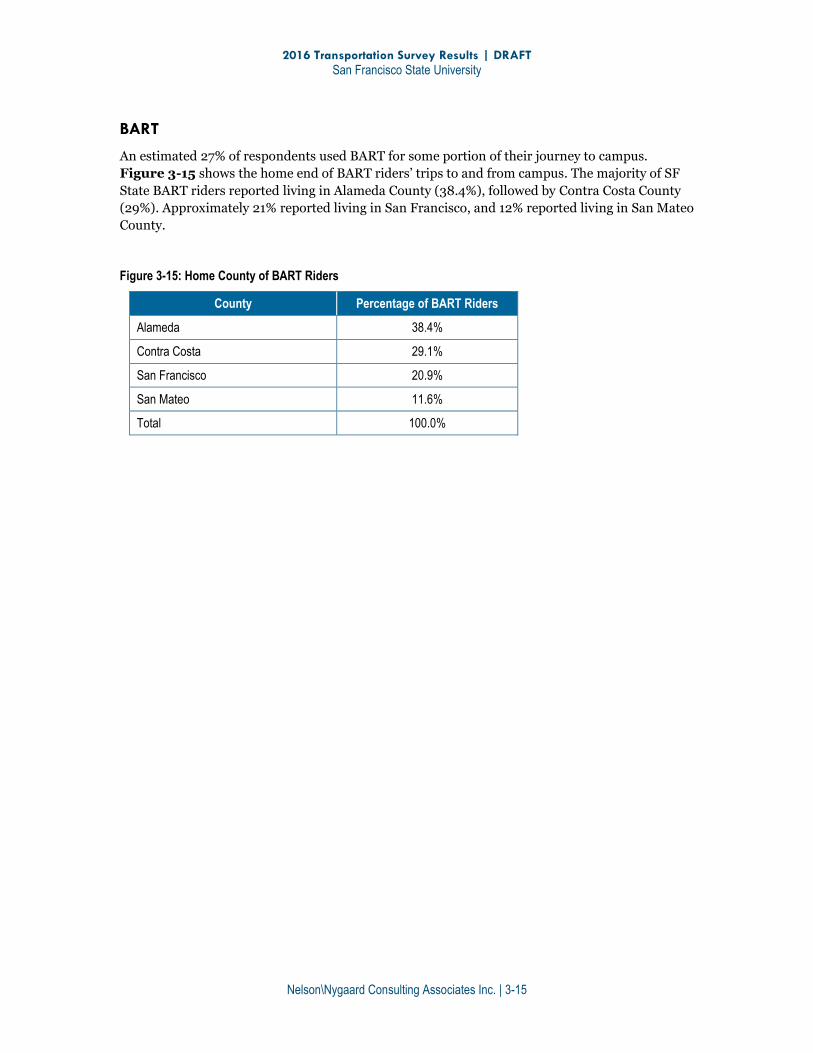
2016 Transportation Survey Results | DRAFT
San Francisco State University
Nelson\Nygaard Consulting Associates Inc. | 3-15
BART
An estimated 27% of respondents used BART for some portion of their journey to campus.
Figure 3-15 shows the home end of BART riders’ trips to and from campus. The majority of SF
State BART riders reported living in Alameda County (38.4%), followed by Contra Costa County
(29%). Approximately 21% reported living in San Francisco, and 12% reported living in San Mateo
County.
Figure 3-15: Home County of BART Riders
County Percentage of BART Riders
Alameda 38.4%
Contra Costa 29.1%
San Francisco 20.9%
San Mateo 11.6%
Total 100.0%

2016 Transportation Survey Results | DRAFT
San Francisco State University
Nelson\Nygaard Consulting Associates Inc. | 3-16
Parking
An estimated 20% of commuters arrived on campus by single-occupancy vehicle. Fourty nine
percent of those University affiliates who reported driving parked on campus, and 32% reported
parking near campus. Three percent of drivers stated that they parked at Daly City BART, while
two percent of drivers said they parked at a park and ride lot. Approximately three percent of
drivers selected “other” with regards to their parking location.
The survey asked respondents who stated that they parked on or near campus to identify where
they parked. The number of responses was scaled to reflect the entire population of the
University. Figure 3-16 provides a breakdown of parkers by location. Nearly 49% of on-campus
parkers reported parking in the main parking garage at the center of campus. Close to campus,
approximately 11% parked in Parkmerced, and 10% parked along Junipero Serra Boulevard. This
marks a shift in where campus affiliates are predominantly parking near campus. In 2014, a
higher percentage of parkers were parking on Holloway Avenue or Font Boulevard, and Lake
Merced Boulevard. The decrease in the number of people parking on Font Boulevard may be
attributed to the construction of the Mashouf Wellness Center. In 2011, a higher percentage of
drivers parked on 19th Avenue.
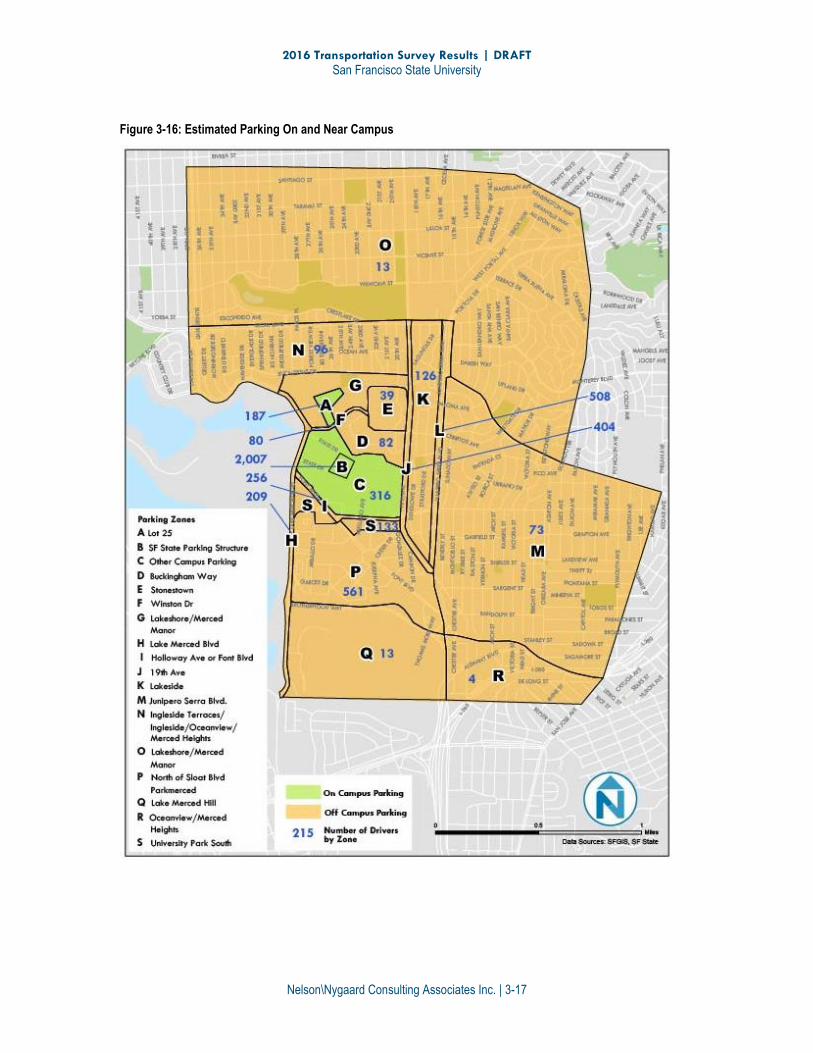
2016 Transportation Survey Results | DRAFT
San Francisco State University
Nelson\Nygaard Consulting Associates Inc. | 3-17
Figure 3-16: Estimated Parking On and Near Campus
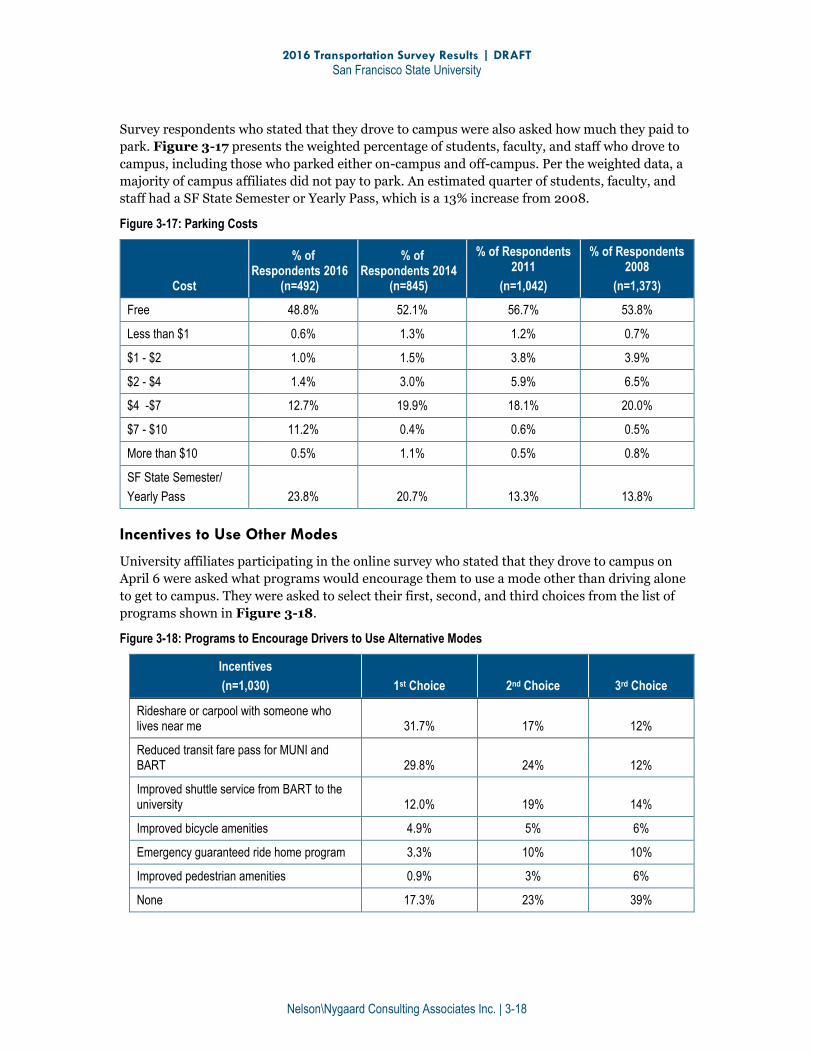
2016 Transportation Survey Results | DRAFT
San Francisco State University
Nelson\Nygaard Consulting Associates Inc. | 3-18
Survey respondents who stated that they drove to campus were also asked how much they paid to
park. Figure 3-17 presents the weighted percentage of students, faculty, and staff who drove to
campus, including those who parked either on-campus and off-campus. Per the weighted data, a
majority of campus affiliates did not pay to park. An estimated quarter of students, faculty, and
staff had a SF State Semester or Yearly Pass, which is a 13% increase from 2008.
Figure 3-17: Parking Costs
Cost
% of Respondents 2016
(n=492)
% of Respondents 2014
(n=845)
% of Respondents 2011
(n=1,042)
% of Respondents 2008
(n=1,373)
Free 48.8% 52.1% 56.7% 53.8%
Less than $1 0.6% 1.3% 1.2% 0.7%
$1 - $2 1.0% 1.5% 3.8% 3.9%
$2 - $4 1.4% 3.0% 5.9% 6.5%
$4 -$7 12.7% 19.9% 18.1% 20.0%
$7 - $10 11.2% 0.4% 0.6% 0.5%
More than $10 0.5% 1.1% 0.5% 0.8%
SF State Semester/
Yearly Pass 23.8% 20.7% 13.3% 13.8%
Incentives to Use Other Modes
University affiliates participating in the online survey who stated that they drove to campus on
April 6 were asked what programs would encourage them to use a mode other than driving alone
to get to campus. They were asked to select their first, second, and third choices from the list of
programs shown in Figure 3-18.
Figure 3-18: Programs to Encourage Drivers to Use Alternative Modes
Incentives
(n=1,030) 1st Choice 2nd Choice 3rd Choice
Rideshare or carpool with someone who lives near me 31.7% 17% 12%
Reduced transit fare pass for MUNI and BART 29.8% 24% 12%
Improved shuttle service from BART to the university 12.0% 19% 14%
Improved bicycle amenities 4.9% 5% 6%
Emergency guaranteed ride home program 3.3% 10% 10%
Improved pedestrian amenities 0.9% 3% 6%
None 17.3% 23% 39%
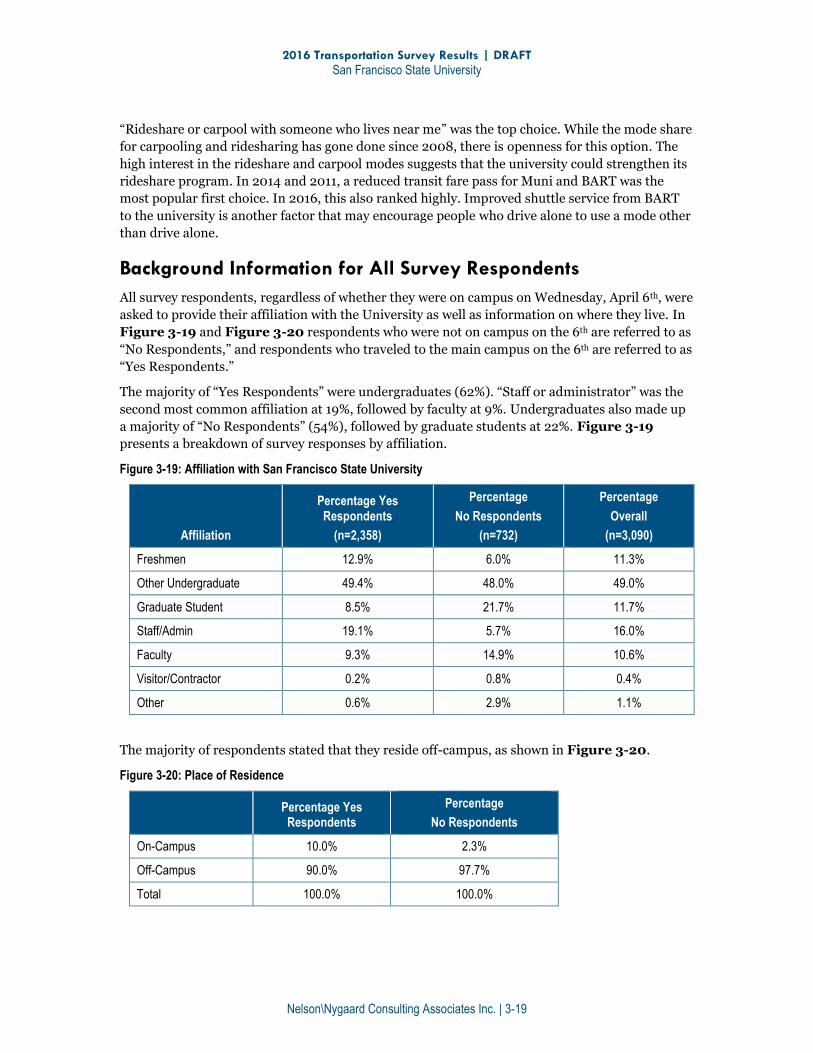
2016 Transportation Survey Results | DRAFT
San Francisco State University
Nelson\Nygaard Consulting Associates Inc. | 3-19
“Rideshare or carpool with someone who lives near me” was the top choice. While the mode share
for carpooling and ridesharing has gone done since 2008, there is openness for this option. The
high interest in the rideshare and carpool modes suggests that the university could strengthen its
rideshare program. In 2014 and 2011, a reduced transit fare pass for Muni and BART was the
most popular first choice. In 2016, this also ranked highly. Improved shuttle service from BART
to the university is another factor that may encourage people who drive alone to use a mode other
than drive alone.
Background Information for All Survey Respondents
All survey respondents, regardless of whether they were on campus on Wednesday, April 6th, were
asked to provide their affiliation with the University as well as information on where they live. In
Figure 3-19 and Figure 3-20 respondents who were not on campus on the 6th are referred to as
“No Respondents,” and respondents who traveled to the main campus on the 6th are referred to as
“Yes Respondents.”
The majority of “Yes Respondents” were undergraduates (62%). “Staff or administrator” was the
second most common affiliation at 19%, followed by faculty at 9%. Undergraduates also made up
a majority of “No Respondents” (54%), followed by graduate students at 22%. Figure 3-19
presents a breakdown of survey responses by affiliation.
Figure 3-19: Affiliation with San Francisco State University
Affiliation
Percentage Yes Respondents
(n=2,358)
Percentage
No Respondents
(n=732)
Percentage
Overall
(n=3,090)
Freshmen 12.9% 6.0% 11.3%
Other Undergraduate 49.4% 48.0% 49.0%
Graduate Student 8.5% 21.7% 11.7%
Staff/Admin 19.1% 5.7% 16.0%
Faculty 9.3% 14.9% 10.6%
Visitor/Contractor 0.2% 0.8% 0.4%
Other 0.6% 2.9% 1.1%
The majority of respondents stated that they reside off-campus, as shown in Figure 3-20.
Figure 3-20: Place of Residence
Percentage Yes Respondents
Percentage
No Respondents
On-Campus 10.0% 2.3%
Off-Campus 90.0% 97.7%
Total 100.0% 100.0%
2016 Transportation Survey Results | DRAFT
San Francisco State University
Nelson\Nygaard Consulting Associates Inc. | 3-20
All survey respondents were asked their home zip code. Responses to this question were mapped
to show what parts of the Bay Area SF State affiliates live in. As shown in Figure 3-21, the largest
concentration of SF State affiliates reported living within San Francisco. Outside of San Francisco,
the largest concentration of University affiliates are estimated to be in Oakland, Daly City,
Berkeley, South San Francisco, San Mateo, Pacifica, and Hayward.
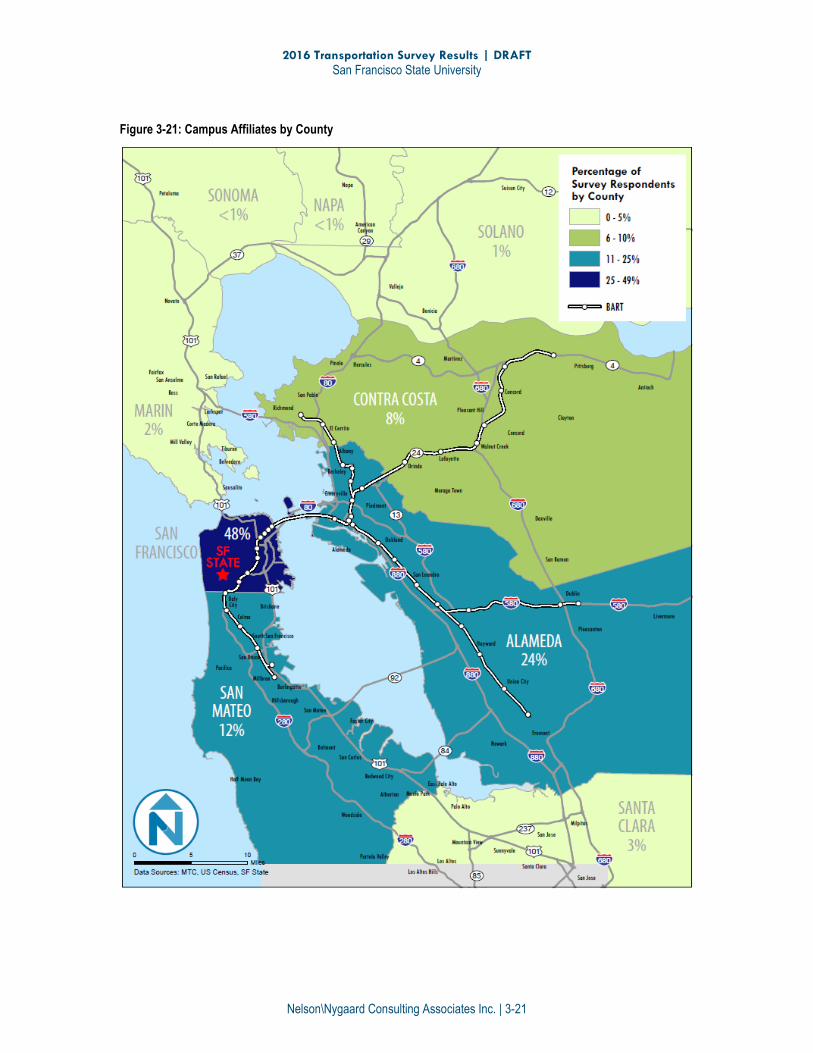
2016 Transportation Survey Results | DRAFT
San Francisco State University
Nelson\Nygaard Consulting Associates Inc. | 3-21
Figure 3-21: Campus Affiliates by County
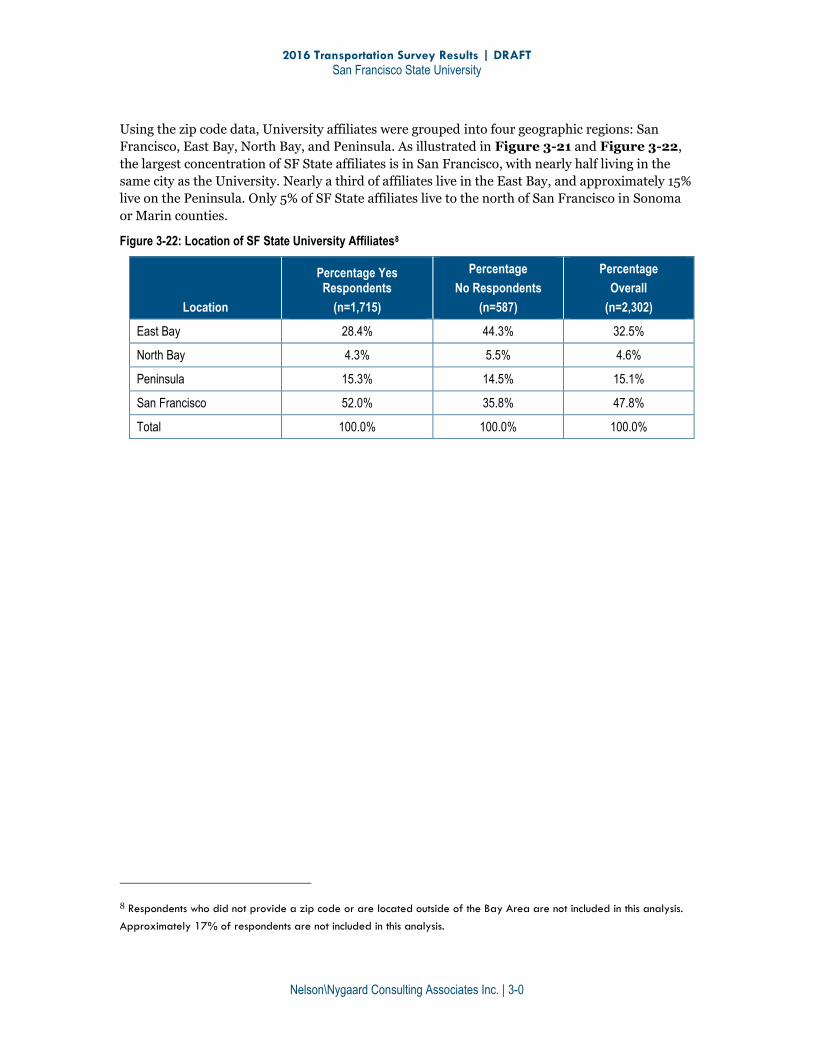
2016 Transportation Survey Results | DRAFT
San Francisco State University
Nelson\Nygaard Consulting Associates Inc. | 3-0
Using the zip code data, University affiliates were grouped into four geographic regions: San
Francisco, East Bay, North Bay, and Peninsula. As illustrated in Figure 3-21 and Figure 3-22,
the largest concentration of SF State affiliates is in San Francisco, with nearly half living in the
same city as the University. Nearly a third of affiliates live in the East Bay, and approximately 15%
live on the Peninsula. Only 5% of SF State affiliates live to the north of San Francisco in Sonoma
or Marin counties.
Figure 3-22: Location of SF State University Affiliates8
Location
Percentage Yes Respondents
(n=1,715)
Percentage
No Respondents
(n=587)
Percentage
Overall
(n=2,302)
East Bay 28.4% 44.3% 32.5%
North Bay 4.3% 5.5% 4.6%
Peninsula 15.3% 14.5% 15.1%
San Francisco 52.0% 35.8% 47.8%
Total 100.0% 100.0% 100.0%
8 Respondents who did not provide a zip code or are located outside of the Bay Area are not included in this analysis.
Approximately 17% of respondents are not included in this analysis.
2016 Transportation Survey Results | DRAFT
San Francisco State University
Nelson\Nygaard Consulting Associates Inc. | 4-1
4 CORDON COUNT
INTRODUCTION
As part of the University’s effort to comply with the MOU, the University sponsored a cordon
count on Wednesday, April 6, 2016 to accompany the survey effort. The cordon count provides
information on where University affiliates are entering and exiting the campus, and at what times
of day they enter and exit. The data collected from the cordon count provides a sense of how many
people come to campus each day. This year’s count represents the fourth conducted in recent
years per the MOU between the University and City and County of San Francisco.
METHODOLOGY
The count was conducted from 7:00 a.m. to 7:30 p.m. at nine locations around the campus, as
shown in Figure 4-1. This is the same time period used in 2014 and 2011. The locations were
selected as they represent all public vehicle entry access points, including access to interior
roadways and parking facilities. Eight of the nine locations used for the cordon counts in 2016
were in the same locations as those used in 2014 and 2011. The only location that changed can be
seen in Figure 4-1.
At each location, vehicles were counted in 15-minute increments. Surveyors were instructed to
distinguish between vehicles with only a single driver, carpools (vehicles with two or more
persons), motorcycles, and other vehicles. Other vehicles included campus vehicles, delivery
trucks, transit vehicles, and security vehicles. Surveyors were instructed to include drop-offs as a
carpool vehicle. One surveyor was stationed at each location.

2016 Transportation Survey Results | DRAFT
San Francisco State University
Nelson\Nygaard Consulting Associates Inc. | 4-2
Figure 4-1: Cordon Count Locations9
9 The cordon count locations are the same in 2016 as in 2014, with the exception of location 9, which has moved southwest on Winston Drive.
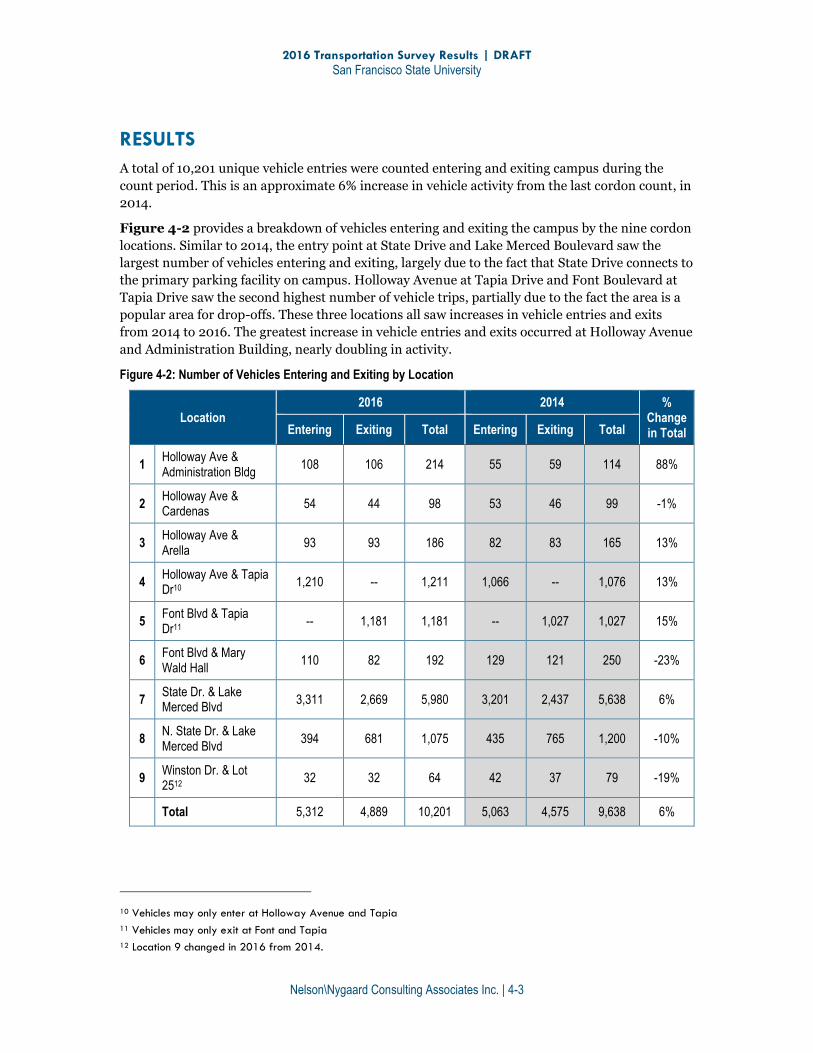
2016 Transportation Survey Results | DRAFT
San Francisco State University
Nelson\Nygaard Consulting Associates Inc. | 4-3
RESULTS
A total of 10,201 unique vehicle entries were counted entering and exiting campus during the
count period. This is an approximate 6% increase in vehicle activity from the last cordon count, in
2014.
Figure 4-2 provides a breakdown of vehicles entering and exiting the campus by the nine cordon
locations. Similar to 2014, the entry point at State Drive and Lake Merced Boulevard saw the
largest number of vehicles entering and exiting, largely due to the fact that State Drive connects to
the primary parking facility on campus. Holloway Avenue at Tapia Drive and Font Boulevard at
Tapia Drive saw the second highest number of vehicle trips, partially due to the fact the area is a
popular area for drop-offs. These three locations all saw increases in vehicle entries and exits
from 2014 to 2016. The greatest increase in vehicle entries and exits occurred at Holloway Avenue
and Administration Building, nearly doubling in activity.
Figure 4-2: Number of Vehicles Entering and Exiting by Location
Location 2016 2014 %
Change in Total Entering Exiting Total Entering Exiting Total
1 Holloway Ave & Administration Bldg
108 106 214 55 59 114 88%
2 Holloway Ave & Cardenas
54 44 98 53 46 99 -1%
3 Holloway Ave & Arella
93 93 186 82 83 165 13%
4 Holloway Ave & Tapia Dr10
1,210 -- 1,211 1,066 -- 1,076 13%
5 Font Blvd & Tapia Dr11
-- 1,181 1,181 -- 1,027 1,027 15%
6 Font Blvd & Mary Wald Hall
110 82 192 129 121 250 -23%
7 State Dr. & Lake Merced Blvd
3,311 2,669 5,980 3,201 2,437 5,638 6%
8 N. State Dr. & Lake Merced Blvd
394 681 1,075 435 765 1,200 -10%
9 Winston Dr. & Lot 2512
32 32 64 42 37 79 -19%
Total 5,312 4,889 10,201 5,063 4,575 9,638 6%
10 Vehicles may only enter at Holloway Avenue and Tapia
11 Vehicles may only exit at Font and Tapia
12 Location 9 changed in 2016 from 2014.

2016 Transportation Survey Results | DRAFT
San Francisco State University
Nelson\Nygaard Consulting Associates Inc. | 4-4
The distribution of vehicles entering and exiting by time varied by cordon count location.
However, at most locations, vehicles peaked between 9:00 a.m. and 11:00 a.m. and 5:00 p.m. to
7:30 p.m.. Figure 4-3 highlights the number of vehicles entering and exiting by time for the 2016
cordon count, and Figure 4-4 illustrates the percent change in the count of vehicles entering and
exiting from 2014 to 2016.
Figure 4-3: Count of Vehicles Entering and Exiting by Location and Time in 2016
Location
7:00 AM -
9:00 AM
9:00 AM -
11:00 AM 11:00 AM -
1:00 PM 1:00 PM -3:00 PM
3:00 PM -5:00 PM
5:00 PM -7:30 PM
1 Holloway Ave & Administration Bldg
24 23 47 23 45 52
2 Holloway Ave & Cardenas
19 15 8 7 8 41
3 Holloway Ave & Arella 14 26 34 37 37 38
4 Holloway Ave & Tapia Dr
111 274 189 184 188 265
5 Font Blvd & Tapia Dr 71 268 194 170 197 281
6 Font Blvd & Mary Wald Hall
23 17 26 31 42 53
7 State Dr. & Lake Merced Blvd
1,061 1,043 951 807 1,090 1,028
8 N. State Dr. & Lake Merced Blvd
169 140 120 112 220 314
9 Winston Dr. & Lot 25 5 13 8 13 15 10
Total 1,497 1,819 1,577 1,384 1,842 2,082
For the entry point at State Drive and Lake Merced Boulevard, which has the largest numbers of
vehicles entering and exiting, there was an increase in the number of vehicles entering and exiting
between 7:00 a.m. – 9:00 a.m., as well as 1:00 p.m. – 7:30 p.m., from 2014 to 2016. This may
suggest that students, faculty, staff, and visitors to campus may be shifting driving behaviors
earlier to secure a parking space at the primary parking facility on campus. This pattern is also
notable at the Holloway Avenue at Tapia Drive and Font Boulevard at Tapia Drive entry and exit
points.
Figure 4-4: Percent Change in the Count of Vehicles Entering and Exiting from 2014 to 2016
Location
7:00 AM -
9:00 AM
9:00 AM -
11:00 AM 11:00 AM -
1:00 PM 1:00 PM -3:00 PM
3:00 PM -5:00 PM
5:00 PM -7:30 PM
1 Holloway Ave & Administration Bldg 41% -18% 194% 15% 400% 117%
2 Holloway Ave & Cardenas -27% 15% 0% 0% 14% 8%
3 Holloway Ave & Arella -30% -19% -15% 76% 12% 100%
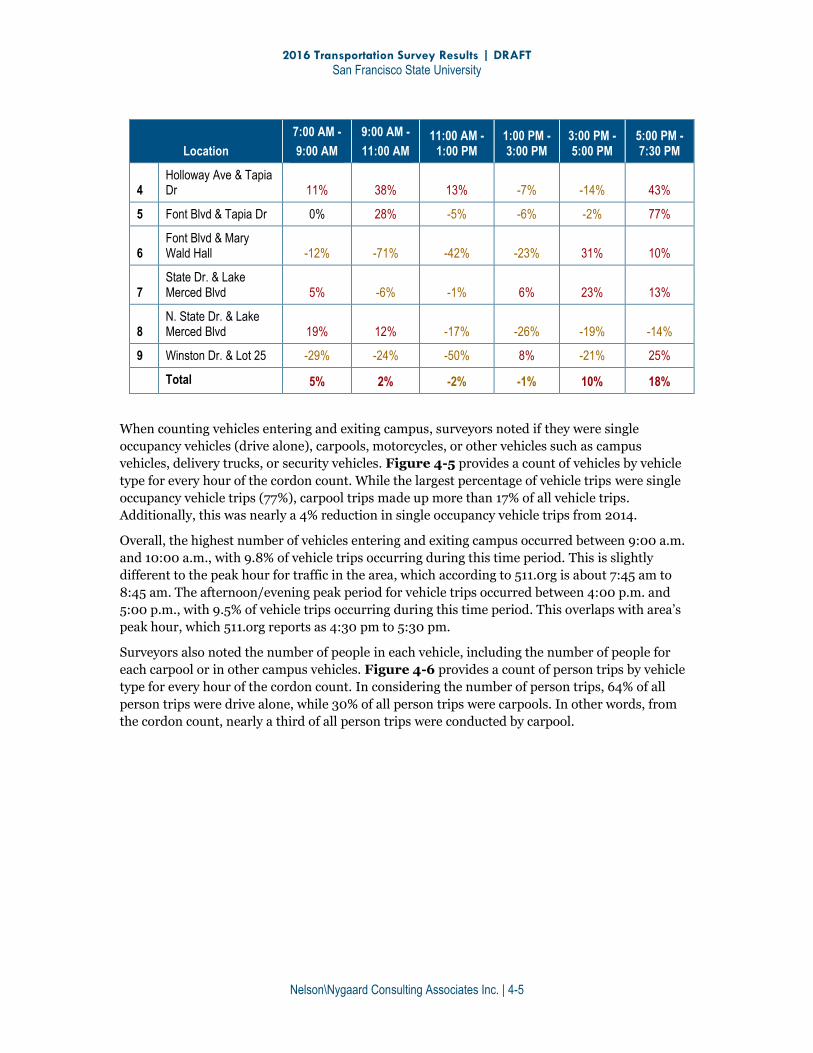
2016 Transportation Survey Results | DRAFT
San Francisco State University
Nelson\Nygaard Consulting Associates Inc. | 4-5
Location
7:00 AM -
9:00 AM
9:00 AM -
11:00 AM 11:00 AM -
1:00 PM 1:00 PM -3:00 PM
3:00 PM -5:00 PM
5:00 PM -7:30 PM
4 Holloway Ave & Tapia Dr 11% 38% 13% -7% -14% 43%
5 Font Blvd & Tapia Dr 0% 28% -5% -6% -2% 77%
6 Font Blvd & Mary Wald Hall -12% -71% -42% -23% 31% 10%
7 State Dr. & Lake Merced Blvd 5% -6% -1% 6% 23% 13%
8 N. State Dr. & Lake Merced Blvd 19% 12% -17% -26% -19% -14%
9 Winston Dr. & Lot 25 -29% -24% -50% 8% -21% 25%
Total 5% 2% -2% -1% 10% 18%
When counting vehicles entering and exiting campus, surveyors noted if they were single
occupancy vehicles (drive alone), carpools, motorcycles, or other vehicles such as campus
vehicles, delivery trucks, or security vehicles. Figure 4-5 provides a count of vehicles by vehicle
type for every hour of the cordon count. While the largest percentage of vehicle trips were single
occupancy vehicle trips (77%), carpool trips made up more than 17% of all vehicle trips.
Additionally, this was nearly a 4% reduction in single occupancy vehicle trips from 2014.
Overall, the highest number of vehicles entering and exiting campus occurred between 9:00 a.m.
and 10:00 a.m., with 9.8% of vehicle trips occurring during this time period. This is slightly
different to the peak hour for traffic in the area, which according to 511.0rg is about 7:45 am to
8:45 am. The afternoon/evening peak period for vehicle trips occurred between 4:00 p.m. and
5:00 p.m., with 9.5% of vehicle trips occurring during this time period. This overlaps with area’s
peak hour, which 511.org reports as 4:30 pm to 5:30 pm.
Surveyors also noted the number of people in each vehicle, including the number of people for
each carpool or in other campus vehicles. Figure 4-6 provides a count of person trips by vehicle
type for every hour of the cordon count. In considering the number of person trips, 64% of all
person trips were drive alone, while 30% of all person trips were carpools. In other words, from
the cordon count, nearly a third of all person trips were conducted by carpool.
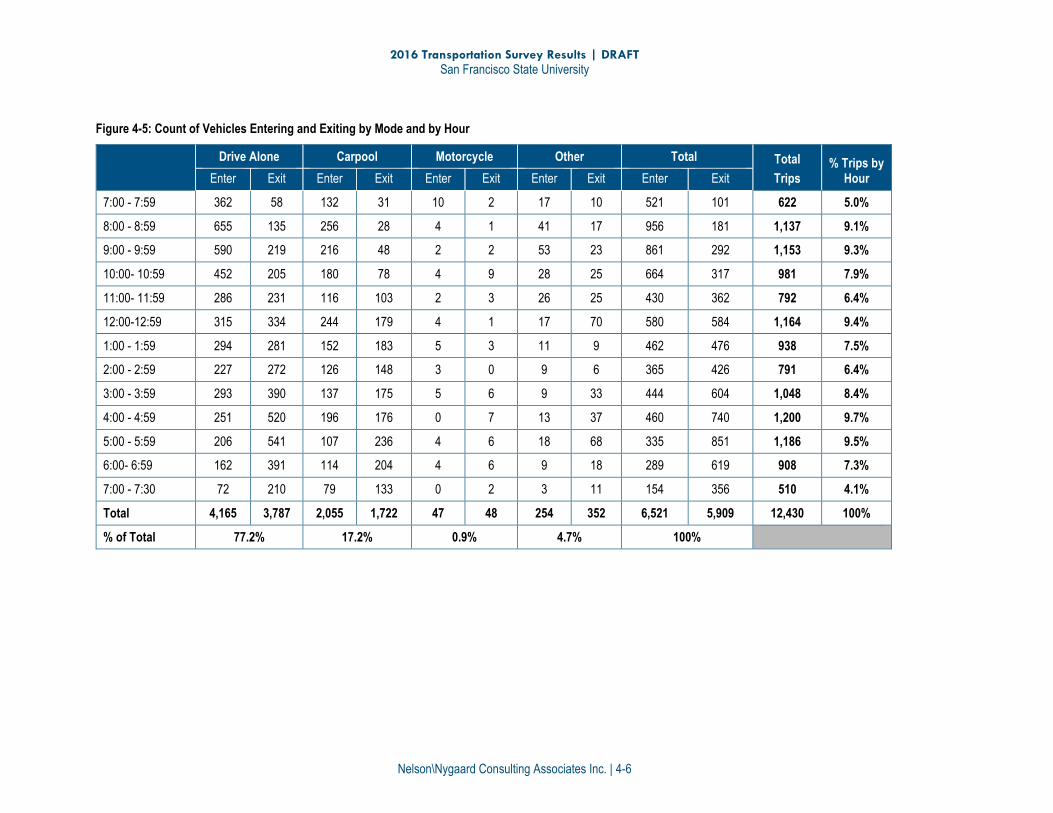
2016 Transportation Survey Results | DRAFT
San Francisco State University
Nelson\Nygaard Consulting Associates Inc. | 4-6
Figure 4-5: Count of Vehicles Entering and Exiting by Mode and by Hour
Drive Alone Carpool Motorcycle Other Total Total
Trips % Trips by
Hour Enter Exit Enter Exit Enter Exit Enter Exit Enter Exit
7:00 - 7:59 362 58 132 31 10 2 17 10 521 101 622 5.0%
8:00 - 8:59 655 135 256 28 4 1 41 17 956 181 1,137 9.1%
9:00 - 9:59 590 219 216 48 2 2 53 23 861 292 1,153 9.3%
10:00- 10:59 452 205 180 78 4 9 28 25 664 317 981 7.9%
11:00- 11:59 286 231 116 103 2 3 26 25 430 362 792 6.4%
12:00-12:59 315 334 244 179 4 1 17 70 580 584 1,164 9.4%
1:00 - 1:59 294 281 152 183 5 3 11 9 462 476 938 7.5%
2:00 - 2:59 227 272 126 148 3 0 9 6 365 426 791 6.4%
3:00 - 3:59 293 390 137 175 5 6 9 33 444 604 1,048 8.4%
4:00 - 4:59 251 520 196 176 0 7 13 37 460 740 1,200 9.7%
5:00 - 5:59 206 541 107 236 4 6 18 68 335 851 1,186 9.5%
6:00- 6:59 162 391 114 204 4 6 9 18 289 619 908 7.3%
7:00 - 7:30 72 210 79 133 0 2 3 11 154 356 510 4.1%
Total 4,165 3,787 2,055 1,722 47 48 254 352 6,521 5,909 12,430 100%
% of Total 77.2% 17.2% 0.9% 4.7% 100%

2016 Transportation Survey Results | DRAFT
San Francisco State University
Nelson\Nygaard Consulting Associates Inc. | 4-7
Figure 4-6: Count of Persons Entering and Exiting by Mode and by Hour
Drive Alone Carpool Motorcycle Other Total Total
Trips % Trips by
Hour Enter Exit Enter Exit Enter Exit Enter Exit Enter Exit
7:00 - 7:59 362 58 132 31 10 2 17 10 521 101 622 5.0%
8:00 - 8:59 655 135 256 28 4 1 41 17 956 181 1,137 9.1%
9:00 - 9:59 590 219 216 48 2 2 53 23 861 292 1,153 9.3%
10:00- 10:59 452 205 180 78 4 9 28 25 664 317 981 7.9%
11:00- 11:59 286 231 116 103 2 3 26 25 430 362 792 6.4%
12:00-12:59 315 334 244 179 4 1 17 70 580 584 1,164 9.4%
1:00 - 1:59 294 281 152 183 5 3 11 9 462 476 938 7.5%
2:00 - 2:59 227 272 126 148 3 0 9 6 365 426 791 6.4%
3:00 - 3:59 293 390 137 175 5 6 9 33 444 604 1,048 8.4%
4:00 - 4:59 251 520 196 176 0 7 13 37 460 740 1,200 9.7%
5:00 - 5:59 206 541 107 236 4 6 18 68 335 851 1,186 9.5%
6:00- 6:59 162 391 114 204 4 6 9 18 289 619 908 7.3%
7:00 - 7:30 72 210 79 133 0 2 3 11 154 356 510 4.1%
Total 4,165 3,787 2,055 1,722 47 48 254 352 6,521 5,909 12,430 100%
% of Total 64.0% 30.4% 0.8% 4.9% 100%

2016 Transportation Survey Results | DRAFT
San Francisco State University
Nelson\Nygaard Consulting Associates Inc. | 4-8
The data collected in April 2008 was used to establish a baseline number of automobile trips for
the entire campus population. Figure 4-7 shows the number of peak hour and total daily auto
trips. The peak hour has changed throughout the years, from 4:00 p.m. to 5:00 p.m. in 2008, to
5:00 p.m. to 6:00 p.m. in 2011, to 3:00 p.m. to 4:00 p.m. in 2014, and back to 4:00 p.m. to 5:00
p.m. in 2016.
The number of peak hour trips decreased by 3% between 2008 and 2016, and the number of
automobile trips per day decreased by 22% between 2008 and 2016.
Figure 4-7: Peak Hour and Total Auto Trips
Time
Peak Hour Auto Trips % of Total Daily Auto Trips Total Daily Auto Trips
2016 2014 2011 2008 2016 2014 2011 2008 2016 2014 2011 2008
3:00 PM – 4:00 PM
1,107 10% 11,073
4:00 PM – 5:00 PM
1,200 1,239 10% 8% 12,430 15,904
5:00 PM – 6:00 PM
1,198 9% 13,983
2016 Transportation Survey Results | DRAFT
San Francisco State University
Nelson\Nygaard Consulting Associates Inc. | 5-1
5 CARBON EMISSIONS
INTRODUCTION
San Francisco State University has committed to pursuing greenhouse gas (GHG) emissions
reductions since 2007, a commitment that was reasserted in August 2012 when President
Les Wong signed the American College & University Presidents Climate Commitment
(ACUPCC).[1] The University created an inventory of greenhouse gas (GHG) emissions from
1990 to 2006 and conducted a second GHG inventory with data through 2008.
The GHG inventory shows that commuting accounts for almost 49% of the total emissions
generated by the campus. After the 2008 GHG emissions inventory, Nelson\Nygaard
analyzed surveys from 1970 and 1992 to compare results to historical patterns. Compared to
the 2008 travel survey commute related emissions had decreased by an estimated 53% from
1990 levels.13 Recognizing the important role that transportation plays in GHG emissions
and the potential for reducing GHG emissions through changes in travel behavior, the online
survey was designed to provide data which could be used to better understand University
affiliates’ travel behavior, and help develop a strategic action plan for reducing GHG
emissions.
Utilizing the data gathered in the online survey, this chapter provides an analysis of GHG
emissions resulting from commute trips to and from campus. GHG emissions were
measured in carbon dioxide equivalents (CO2-e), which is a total of all GHGs converted into
CO2 at a rate based on the gas’ impact on ozone depletion.
METHODOLOGY
The online survey was designed in part to enable the University to calculate the emissions
related to transportation. For each leg of their commute journeys, respondents were asked to
provide both the mode they used and the distance travelled. The average distance traveled by
students and staff on each mode was calculated, and each resulting value was multiplied by
the weighted number of students and staff taking each mode on April 6, 2016. Data from the
survey was scaled to estimate travel behavior for the entire population of students, faculty,
and staff at the university in order to determine distances collectively traveled on each mode.
Carbon intensities (pounds of emissions per vehicle mile traveled measured in pounds of
CO2-e ) were then calculated for each mode (assumptions are listed in the following section).
[1] www.presidentsclimatecommitment.org
13 San Francisco State University Climate Action Plan 2010
2016 Transportation Survey Results | DRAFT
San Francisco State University
Nelson\Nygaard Consulting Associates Inc. | 5-2
The product of distance traveled on each mode and the mode’s carbon intensity provide the
total emissions attributable to the SF State commute for that mode on a given day.
Miles x CO2-e/mile = CO2-e (for each mode)
Using the daily CO2-e inventory, an annual CO2-e inventory was determined.14
The scaling factor used in the previous reports was adjusted this year in order to reflect a per
mode weighted scaling factor. All data from previous years was adjusted under the same
methodology. In addition, the unit of measurement for CO2 emissions was changed in 2014
to metric tons, which is the industry standard. This was maintained in the 2016 analysis. In
previous survey years, short tons was used as the unit of measurement. The 2008 and 2011
numbers shown in this report reflect this change in metrics.
Assumptions
The following assumptions were used in creating the emissions inventory for SF State:
For all modes except BART, only tailpipe emissions are counted. Other emissions,
such as those associated with fuel production and refining, vehicle manufacture,
construction and maintenance of roadway/guideway, etc., are excluded. It should be
noted that, taken together, these add approximately 30% (bus) to 60% (private
motor vehicle) to a mode’s average per-mile emissions (Chester & Horvath, 2008).
In the one exception to this, emissions from the production of electricity used to
power the BART system, including stations, trains, and other facilities, was counted.
Average automobile fuel efficiency in 2016 is 21.6 MPG (Source: US EPA)
Electric vehicle usage is assumed to be integrated into the US EPA MPG average fuel
efficiency.
Average carbon coefficients for a typical passenger vehicle in 2016 is 19.59 lbs CO2
per gallon, respectively (Source: US EPA)
Bus emissions:
Emissions from bus facilities excluded (due to lack of data)
Bus fuel efficiency of 4.5 MPG (typical for a 40-seat bus)
Trolleybus operation is assumed to produce zero emissions due to Muni’s use of
exclusively hydroelectric power (Source: Muni)
Average overall bus ridership is calculated from Muni surveys on routes which
directly serve the SF State campus (calculated per bus average on those lines was
14.4 passengers). Bus emissions divided by average load factor gives per
passenger-mile emissions. It was assumed that the SamTrans line feeding SF
State has similar ridership
Bus emissions were calculated from these assumptions to be 0.30 lbs of CO2-e
per passenger mile (Source: Muni)
BART pounds of CO2-e emissions per passenger mile are 0.11394. These include
facilities energy use. (Source: BART)
14 The annual CO2 emissions inventory is based on 174 days. This includes all regular school days and excludes weekends, holidays, summer break, winter break and spring break.
2016 Transportation Survey Results | DRAFT
San Francisco State University
Nelson\Nygaard Consulting Associates Inc. | 5-3
Caltrain emissions of 0.12018 lbs of CO2-e per passenger mile (Source: Caltrain)
SF State Shuttle buses were upgraded in January 2015 to CNG buses with a capacity
of 60 passengers. Assumptions were made that there are 6,000 daily rides (Source:
SFSU campus shuttle improved bigger better buses), an assumed average of two
miles traveled on the shuttle, a calculated average occupancy of 48 passengers.
Occupancy was calculated by dividing the average daily rides, noted above, by the
number of buses per day (hourly frequency by the number of hours of operation) An
emissions of 8.06 lbs of CO2-e per mile was used for SF State Shuttle was assumed
(Source: US Department of Energy Wells-to-wheels GHG emissions)
2016 Transportation Survey Results | DRAFT
San Francisco State University
Nelson\Nygaard Consulting Associates Inc. | 5-4
RESULTS
On a typical travel day in 2016, University affiliates travelled approximately 201,400 miles
commuting to and from the SF State compared to approximately 203,900 in 2014,
approximately 185,200 miles in 2011, and approximately 204,900 miles in 2008 (Figure 5-
1). This represents a 1.23% decrease in daily passenger miles between 2014 and 2016 and a
1.7% decrease in daily passenger miles between 2008 and 2016.
Of the total miles traveled in 2016, 38% (75,800 miles) were travelled on BART, which is the
same percentage as in 2014. This represents a slight increase in mode share from 2008,
when approximately 37% of daily miles were on BART. Forty-one percent of the average
2016 day’s miles are travelled in private vehicles, slightly more than 2014 and 2008 when
37% of daily miles were travelled in private vehicles. However, the overall numbers of miles
travelled by drive alone vehicles has increased.
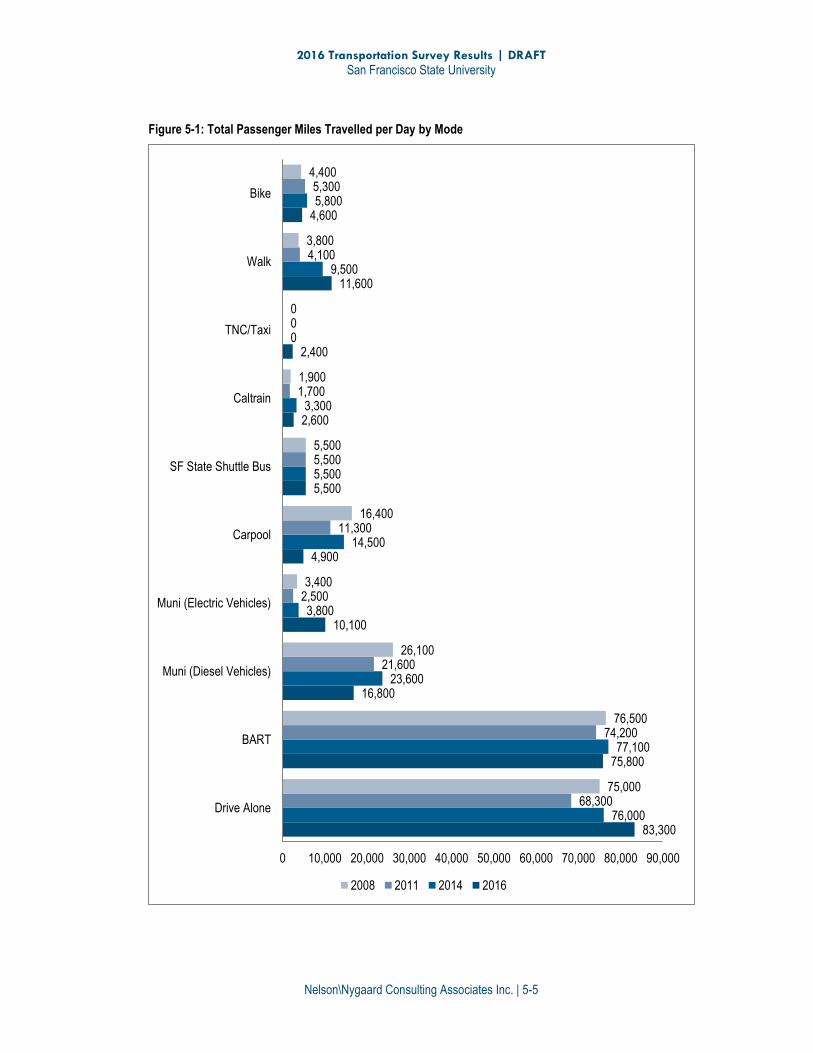
2016 Transportation Survey Results | DRAFT
San Francisco State University
Nelson\Nygaard Consulting Associates Inc. | 5-5
Figure 5-1: Total Passenger Miles Travelled per Day by Mode
83,300
75,800
16,800
10,100
4,900
5,500
2,600
2,400
11,600
4,600
76,000
77,100
23,600
3,800
14,500
5,500
3,300
0
9,500
5,800
68,300
74,200
21,600
2,500
11,300
5,500
1,700
0
4,100
5,300
75,000
76,500
26,100
3,400
16,400
5,500
1,900
0
3,800
4,400
0 10,000 20,000 30,000 40,000 50,000 60,000 70,000 80,000 90,000
Drive Alone
BART
Muni (Diesel Vehicles)
Muni (Electric Vehicles)
Carpool
SF State Shuttle Bus
Caltrain
TNC/Taxi
Walk
Bike
2008 2011 2014 2016
2016 Transportation Survey Results | DRAFT
San Francisco State University
Nelson\Nygaard Consulting Associates Inc. | 5-6
BART commuters to SF State travel about 7,500 fewer miles per day than car drivers, but
each emit only 650 pounds of CO2-e in a day compared to approximately 6,000 pounds of
CO2-e emitted by those who drive alone. There was a decrease of approximately 20 pounds of
CO2-e emitted per day by BART riders between 2008 and 2016, which correlates with a
decrease in BART ridership over the same time period (Figure 5-2).
The SF State Shuttle emits 75 pounds of CO2-e per day, an almost one to 10 relationship to
the number of passenger miles travelled (5,500 miles). The 2016 total represents a decrease
in miles travelled over the last few years and a decrease in emissions. Part of the decrease
could also be attributed due to the University obtaining new 60-passenger CNG buses in
January of 2015. Muni electric vehicles do not produce any CO2-e emissions given that they
use hydroelectric power produced by Hetch Hetchy Dam. CO2-e emissions generated by
Caltrain are about the same as in 2016 as they were in 2008, as daily passenger miles have
increased.
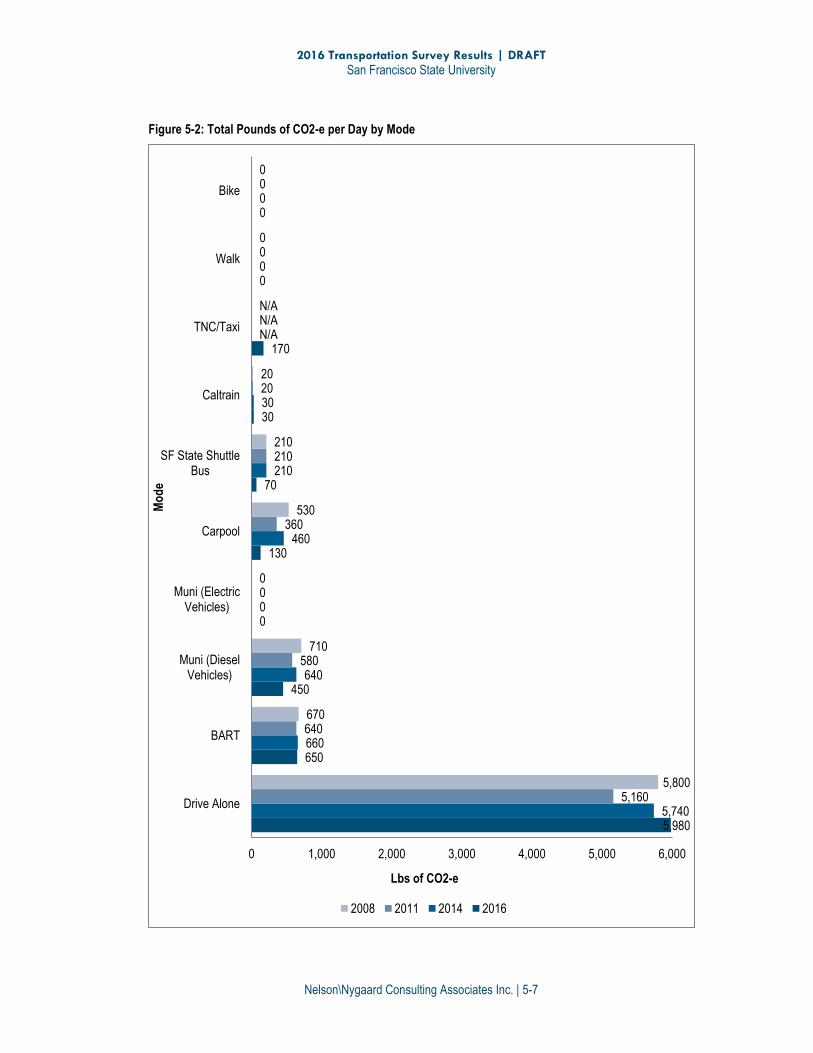
2016 Transportation Survey Results | DRAFT
San Francisco State University
Nelson\Nygaard Consulting Associates Inc. | 5-7
Figure 5-2: Total Pounds of CO2-e per Day by Mode
5,980
650
450
0
130
70
30
170
0
0
5,740
660
640
0
460
210
30
N/A
0
0
5,160
640
580
0
360
210
20
N/A
0
0
5,800
670
710
0
530
210
20
N/A
0
0
0 1,000 2,000 3,000 4,000 5,000 6,000
Drive Alone
BART
Muni (DieselVehicles)
Muni (ElectricVehicles)
Carpool
SF State ShuttleBus
Caltrain
TNC/Taxi
Walk
Bike
Lbs of CO2-e
Mo
de
2008 2011 2014 2016
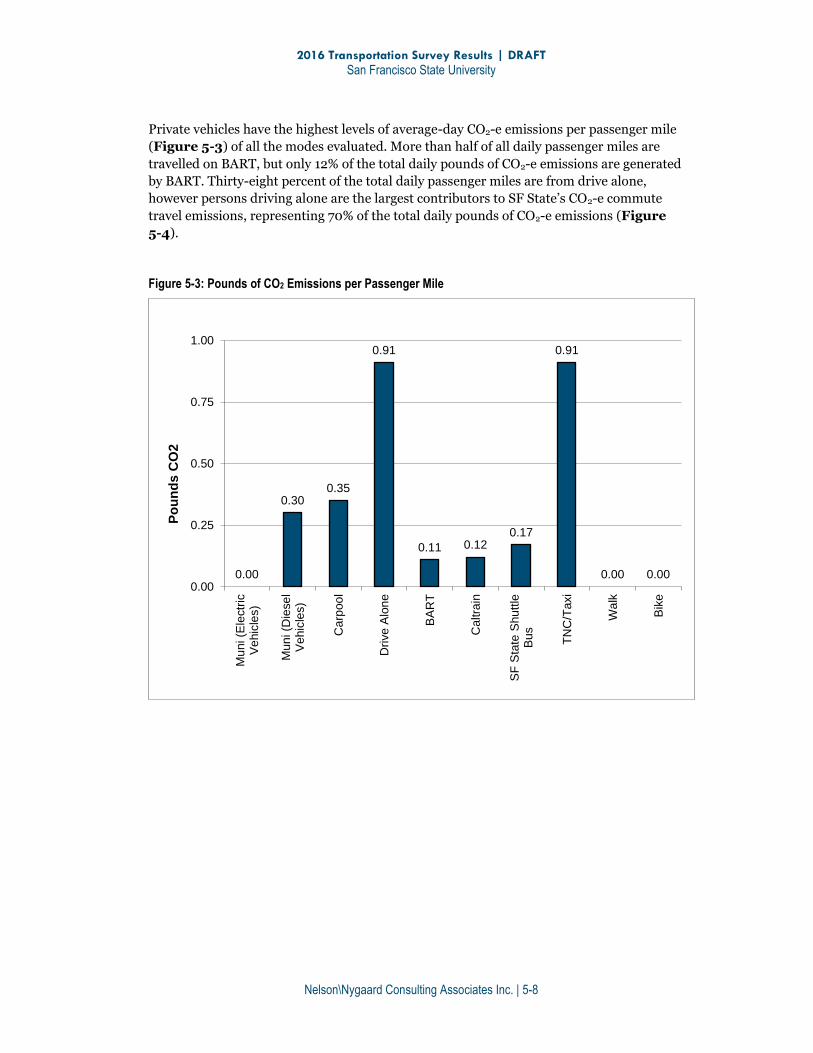
2016 Transportation Survey Results | DRAFT
San Francisco State University
Nelson\Nygaard Consulting Associates Inc. | 5-8
Private vehicles have the highest levels of average-day CO2-e emissions per passenger mile
(Figure 5-3) of all the modes evaluated. More than half of all daily passenger miles are
travelled on BART, but only 12% of the total daily pounds of CO2-e emissions are generated
by BART. Thirty-eight percent of the total daily passenger miles are from drive alone,
however persons driving alone are the largest contributors to SF State’s CO2-e commute
travel emissions, representing 70% of the total daily pounds of CO2-e emissions (Figure
5-4).
Figure 5-3: Pounds of CO2 Emissions per Passenger Mile
0.00
0.300.35
0.91
0.11 0.120.17
0.91
0.00 0.000.00
0.25
0.50
0.75
1.00
Mu
ni (E
lectr
icV
ehic
les)
Mu
ni (D
iese
lV
ehic
les)
Carp
oo
l
Dri
ve
Alo
ne
BA
RT
Caltra
in
SF
Sta
te S
hu
ttle
Bu
s
TN
C/T
axi
Wa
lk
Bik
e
Po
un
ds C
O2

2016 Transportation Survey Results | DRAFT
San Francisco State University
Nelson\Nygaard Consulting Associates Inc. | 5-9
Figure 5-4: Total Miles Travelled and CO2 Emissions per Day 2016
On an annual basis in 2016, University affiliates commute more than 35 million miles, compared to the approximately 35.4 million miles in 2014, 32.2 million miles in 2011, and 35.6 million miles in 2008. This represents a 65% change between 2008 and 2016 (Figure 5-4).
As result, in 2016, a total of 7,500 metric tons of CO2-e were produced by university affiliates’
commutes compared to 7,700 metric tons of CO2-e in 2014, 7,000 metric tons of CO2-e in
2011, and 8,000 metric tons of CO2-e in 2008, a 6% decrease in CO2-e emissions between
2008 and 2016.
With the increase in the population, the raw number of University affiliates driving for some
portion of their journey has increased, though the overall percentage of the population that
drives alone has increased by 11% since 2008. The number of miles travelled by BART
commuters has decreased by approximately 1,000 miles since 2008 but only resulted in a
decrease of approximately 20 metric tons of CO2-e since 2008.
83,300
75,800
16,800
10,100
4,900
5,500
2,600
2,400
11,600
4,600
5,980
650
450
0
130
70
30
170
0
0
0 1,000 2,000 3,000 4,000 5,000 6,000 7,000
0 10,000 20,000 30,000 40,000 50,000 60,000 70,000 80,000 90,000
Drive Alone
BART
Muni (Diesel Vehicles)
Muni (Electric Vehicles)
Carpool
SF State Shuttle Bus
Caltrain
TNC/Taxi
Walk
Bike
Miles
Daily Passenger Miles Total Metric Tons CO2 per Year
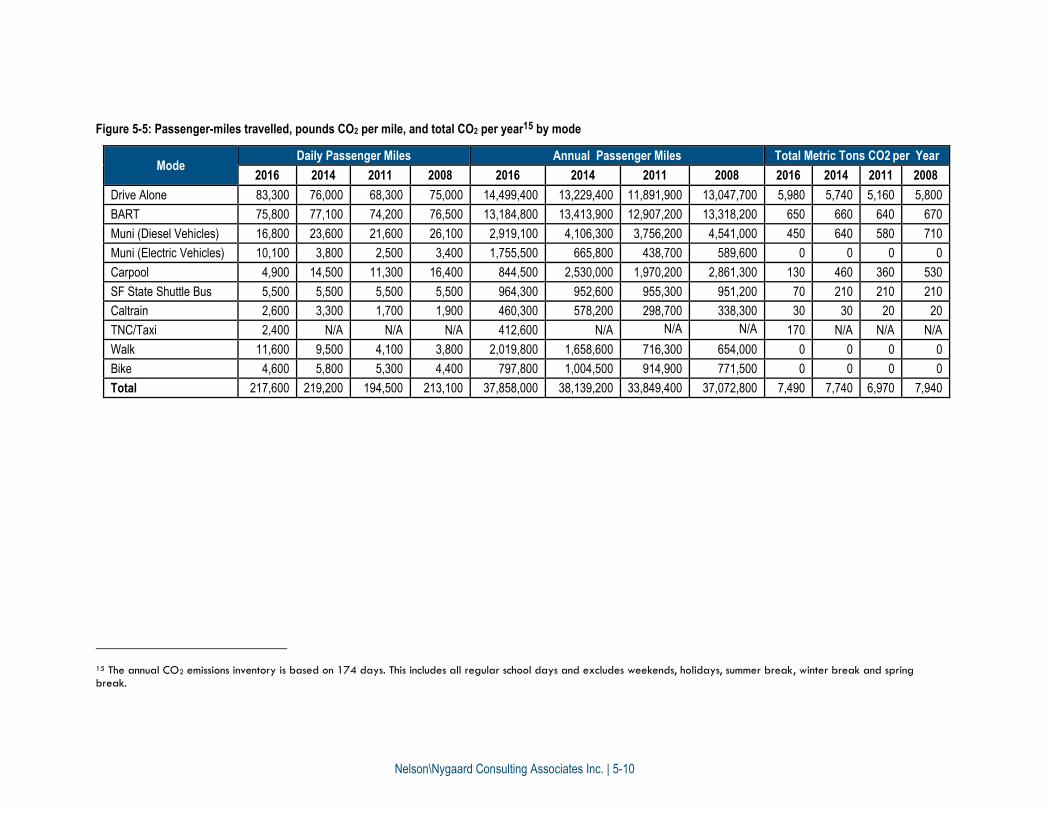
Nelson\Nygaard Consulting Associates Inc. | 5-10
Figure 5-5: Passenger-miles travelled, pounds CO2 per mile, and total CO2 per year15 by mode
Mode Daily Passenger Miles Annual Passenger Miles Total Metric Tons CO2 per Year
2016 2014 2011 2008 2016 2014 2011 2008 2016 2014 2011 2008
Drive Alone 83,300 76,000 68,300 75,000 14,499,400 13,229,400 11,891,900 13,047,700 5,980 5,740 5,160 5,800
BART 75,800 77,100 74,200 76,500 13,184,800 13,413,900 12,907,200 13,318,200 650 660 640 670
Muni (Diesel Vehicles) 16,800 23,600 21,600 26,100 2,919,100 4,106,300 3,756,200 4,541,000 450 640 580 710
Muni (Electric Vehicles) 10,100 3,800 2,500 3,400 1,755,500 665,800 438,700 589,600 0 0 0 0
Carpool 4,900 14,500 11,300 16,400 844,500 2,530,000 1,970,200 2,861,300 130 460 360 530
SF State Shuttle Bus 5,500 5,500 5,500 5,500 964,300 952,600 955,300 951,200 70 210 210 210
Caltrain 2,600 3,300 1,700 1,900 460,300 578,200 298,700 338,300 30 30 20 20
TNC/Taxi 2,400 N/A N/A N/A 412,600 N/A N/A N/A 170 N/A N/A N/A
Walk 11,600 9,500 4,100 3,800 2,019,800 1,658,600 716,300 654,000 0 0 0 0
Bike 4,600 5,800 5,300 4,400 797,800 1,004,500 914,900 771,500 0 0 0 0
Total 217,600 219,200 194,500 213,100 37,858,000 38,139,200 33,849,400 37,072,800 7,490 7,740 6,970 7,940
15 The annual CO2 emissions inventory is based on 174 days. This includes all regular school days and excludes weekends, holidays, summer break, winter break and spring break.

Nelson\Nygaard Consulting Associates Inc. | i
Appendix A Survey Instruments
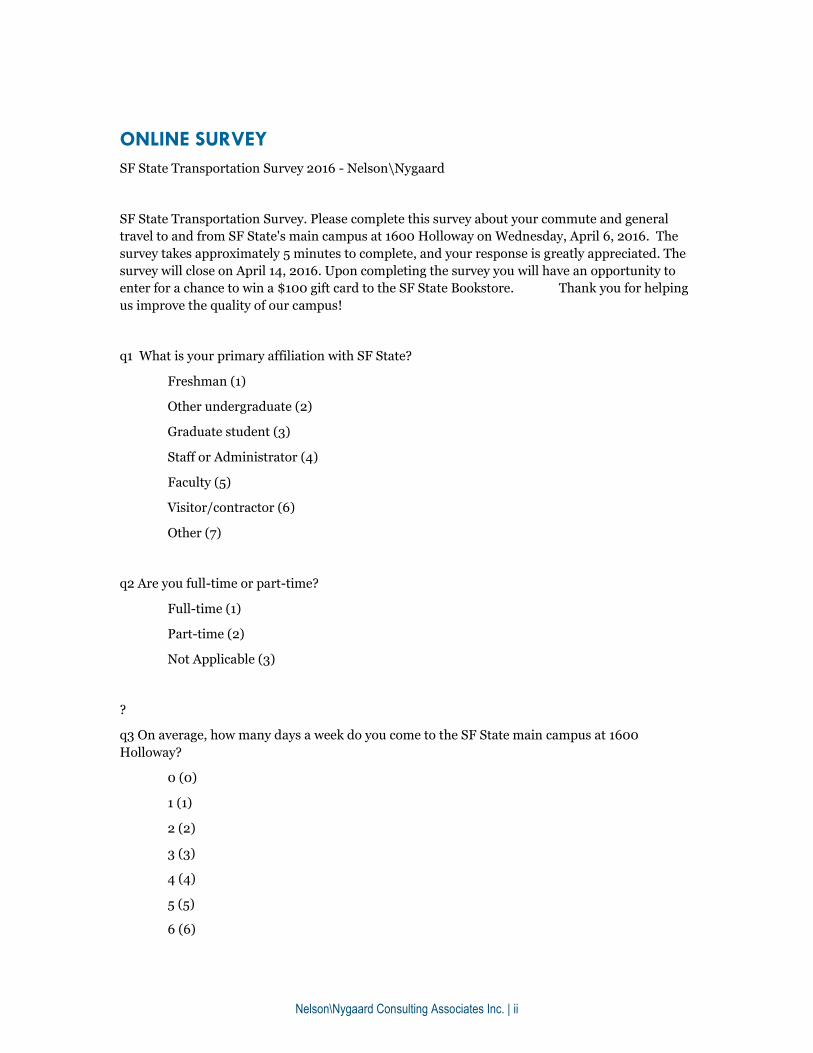
Nelson\Nygaard Consulting Associates Inc. | ii
ONLINE SURVEY
SF State Transportation Survey 2016 - Nelson\Nygaard
SF State Transportation Survey. Please complete this survey about your commute and general
travel to and from SF State's main campus at 1600 Holloway on Wednesday, April 6, 2016. The
survey takes approximately 5 minutes to complete, and your response is greatly appreciated. The
survey will close on April 14, 2016. Upon completing the survey you will have an opportunity to
enter for a chance to win a $100 gift card to the SF State Bookstore. Thank you for helping
us improve the quality of our campus!
q1 What is your primary affiliation with SF State?
Freshman (1)
Other undergraduate (2)
Graduate student (3)
Staff or Administrator (4)
Faculty (5)
Visitor/contractor (6)
Other (7)
q2 Are you full-time or part-time?
Full-time (1)
Part-time (2)
Not Applicable (3)
?
q3 On average, how many days a week do you come to the SF State main campus at 1600
Holloway?
0 (0)
1 (1)
2 (2)
3 (3)
4 (4)
5 (5)
6 (6)
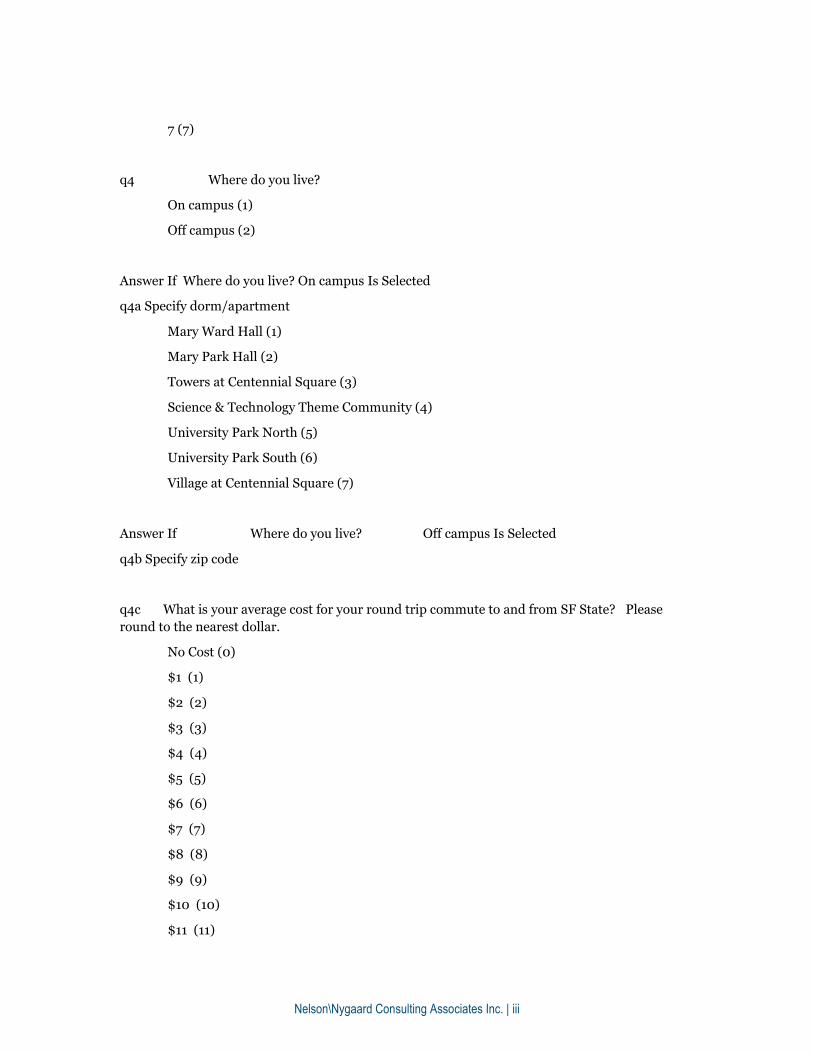
Nelson\Nygaard Consulting Associates Inc. | iii
7 (7)
q4 Where do you live?
On campus (1)
Off campus (2)
Answer If Where do you live? On campus Is Selected
q4a Specify dorm/apartment
Mary Ward Hall (1)
Mary Park Hall (2)
Towers at Centennial Square (3)
Science & Technology Theme Community (4)
University Park North (5)
University Park South (6)
Village at Centennial Square (7)
Answer If Where do you live? Off campus Is Selected
q4b Specify zip code
q4c What is your average cost for your round trip commute to and from SF State? Please
round to the nearest dollar.
No Cost (0)
$1 (1)
$2 (2)
$3 (3)
$4 (4)
$5 (5)
$6 (6)
$7 (7)
$8 (8)
$9 (9)
$10 (10)
$11 (11)
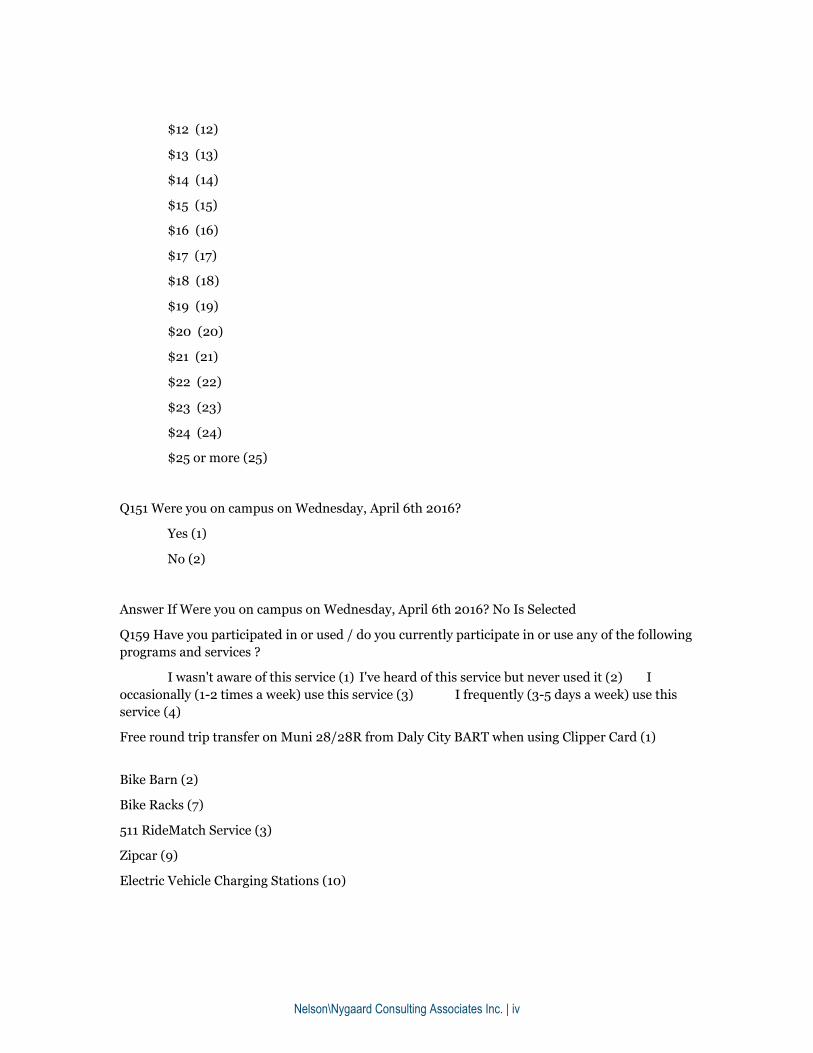
Nelson\Nygaard Consulting Associates Inc. | iv
$12 (12)
$13 (13)
$14 (14)
$15 (15)
$16 (16)
$17 (17)
$18 (18)
$19 (19)
$20 (20)
$21 (21)
$22 (22)
$23 (23)
$24 (24)
$25 or more (25)
Q151 Were you on campus on Wednesday, April 6th 2016?
Yes (1)
No (2)
Answer If Were you on campus on Wednesday, April 6th 2016? No Is Selected
Q159 Have you participated in or used / do you currently participate in or use any of the following
programs and services ?
I wasn't aware of this service (1) I've heard of this service but never used it (2) I
occasionally (1-2 times a week) use this service (3) I frequently (3-5 days a week) use this
service (4)
Free round trip transfer on Muni 28/28R from Daly City BART when using Clipper Card (1)
Bike Barn (2)
Bike Racks (7)
511 RideMatch Service (3)
Zipcar (9)
Electric Vehicle Charging Stations (10)
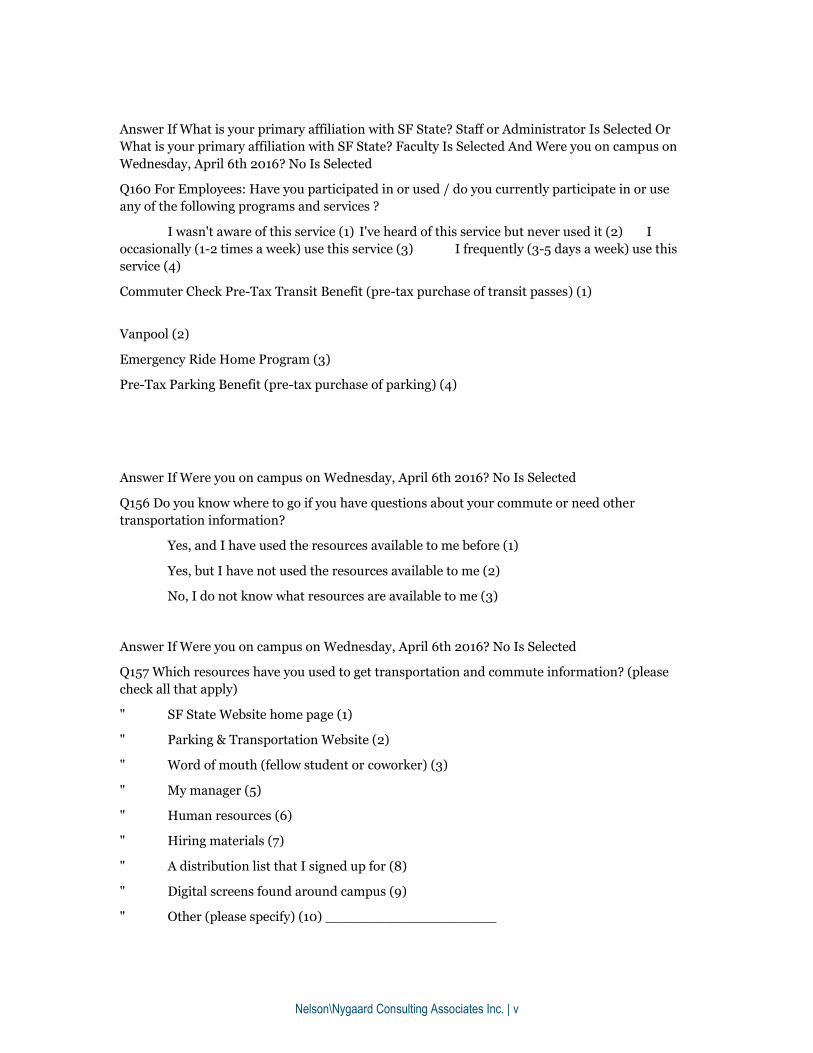
Nelson\Nygaard Consulting Associates Inc. | v
Answer If What is your primary affiliation with SF State? Staff or Administrator Is Selected Or
What is your primary affiliation with SF State? Faculty Is Selected And Were you on campus on
Wednesday, April 6th 2016? No Is Selected
Q160 For Employees: Have you participated in or used / do you currently participate in or use
any of the following programs and services ?
I wasn't aware of this service (1) I've heard of this service but never used it (2) I
occasionally (1-2 times a week) use this service (3) I frequently (3-5 days a week) use this
service (4)
Commuter Check Pre-Tax Transit Benefit (pre-tax purchase of transit passes) (1)
Vanpool (2)
Emergency Ride Home Program (3)
Pre-Tax Parking Benefit (pre-tax purchase of parking) (4)
Answer If Were you on campus on Wednesday, April 6th 2016? No Is Selected
Q156 Do you know where to go if you have questions about your commute or need other
transportation information?
Yes, and I have used the resources available to me before (1)
Yes, but I have not used the resources available to me (2)
No, I do not know what resources are available to me (3)
Answer If Were you on campus on Wednesday, April 6th 2016? No Is Selected
Q157 Which resources have you used to get transportation and commute information? (please
check all that apply)
" SF State Website home page (1)
" Parking & Transportation Website (2)
" Word of mouth (fellow student or coworker) (3)
" My manager (5)
" Human resources (6)
" Hiring materials (7)
" A distribution list that I signed up for (8)
" Digital screens found around campus (9)
" Other (please specify) (10) ____________________
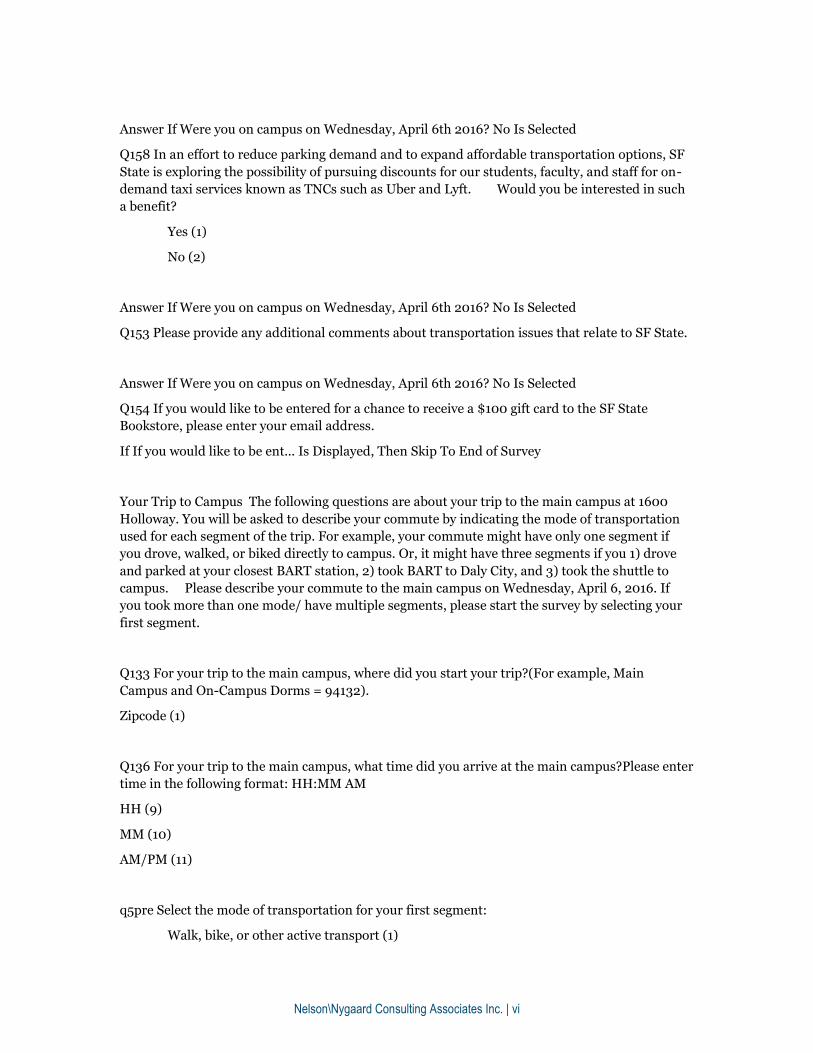
Nelson\Nygaard Consulting Associates Inc. | vi
Answer If Were you on campus on Wednesday, April 6th 2016? No Is Selected
Q158 In an effort to reduce parking demand and to expand affordable transportation options, SF
State is exploring the possibility of pursuing discounts for our students, faculty, and staff for on-
demand taxi services known as TNCs such as Uber and Lyft. Would you be interested in such
a benefit?
Yes (1)
No (2)
Answer If Were you on campus on Wednesday, April 6th 2016? No Is Selected
Q153 Please provide any additional comments about transportation issues that relate to SF State.
Answer If Were you on campus on Wednesday, April 6th 2016? No Is Selected
Q154 If you would like to be entered for a chance to receive a $100 gift card to the SF State
Bookstore, please enter your email address.
If If you would like to be ent... Is Displayed, Then Skip To End of Survey
Your Trip to Campus The following questions are about your trip to the main campus at 1600
Holloway. You will be asked to describe your commute by indicating the mode of transportation
used for each segment of the trip. For example, your commute might have only one segment if
you drove, walked, or biked directly to campus. Or, it might have three segments if you 1) drove
and parked at your closest BART station, 2) took BART to Daly City, and 3) took the shuttle to
campus. Please describe your commute to the main campus on Wednesday, April 6, 2016. If
you took more than one mode/ have multiple segments, please start the survey by selecting your
first segment.
Q133 For your trip to the main campus, where did you start your trip?(For example, Main
Campus and On-Campus Dorms = 94132).
Zipcode (1)
Q136 For your trip to the main campus, what time did you arrive at the main campus?Please enter
time in the following format: HH:MM AM
HH (9)
MM (10)
AM/PM (11)
q5pre Select the mode of transportation for your first segment:
Walk, bike, or other active transport (1)
Nelson\Nygaard Consulting Associates Inc. | vii
Public transportation / shuttle (2)
Private vehicle (cars, carpool, motorcycle, etc.) (3)
Taxi, Uber, Lyft, or other on-demand taxi or real-time ride-sharing services known as
TNCs (4)
q5 Which mode of transportation did you use?
If Select your first mode of transportation: Walk, bike, or other active transport Is Selected
Walk (1)
If Describe your trip to the main campus on Wednesday, April 23, 2014. If you used more than
one mode of transportation, please start with the first mode. 5. Select your first mode of
tran... Walk, Bike, or Other-Self Propelled Is Selected
Bicycle (2)
If Describe your trip to the main campus on Wednesday, April 23, 2014. If you used more than
one mode of transportation, please start with the first mode. 5. Select your first mode of
tran... Walk, Bike, or Other-Self Propelled Is Selected
Other (3)
If Describe your trip to the main campus on Wednesday, April 23, 2014. If you used more than
one mode of transportation, please start with the first mode. 5. Select your first mode of
tran... Public Transportation Is Selected
Muni (4)
If Describe your trip to the main campus on Wednesday, April 23, 2014. If you used
more than one mode of transportation, please start with the first mode. Select your firs...
Public Transportation Is Selected
BART (5)
If Describe your trip to the main campus on Wednesday, April 23, 2014. If you used
more than one mode of transportation, please start with the first mode. Select your firs...
Public Transportation Is Selected
SF State Shuttle (6)
If Describe your trip to the main campus on Wednesday, April 23, 2014. If you used
more than one mode of transportation, please start with the first mode. Select your firs...
Public Transportation Is Selected
Caltrain (7)
If Describe your trip to the main campus on Wednesday, April 23, 2014. If you used
more than one mode of transportation, please start with the first mode. Select your firs...
Public Transportation Is Selected
Other bus provider than Muni (e.g. AC Transit/Golden Gate Transit/SamTrans) (8)
Nelson\Nygaard Consulting Associates Inc. | viii
If Describe your trip to the main campus on Wednesday, April 23, 2014. If you used more than
one mode of transportation, please start with the first mode. 5. Select your first mode of
tran... Private Vehicle Is Selected
Drove Alone (9)
If Describe your trip to the main campus on Wednesday, April 23, 2014. If you used
more than one mode of transportation, please start with the first mode. Select your firs...
Private Vehicle Is Selected
Dropped Off / Picked Up (10)
If Describe your trip to the main campus on Wednesday, April 23, 2014. If you used
more than one mode of transportation, please start with the first mode. Select your firs...
Private Vehicle Is Selected
Motorcycle/Moped (11)
If Describe your trip to the main campus on Wednesday, April 23, 2014. If you used
more than one mode of transportation, please start with the first mode. Select your firs...
Private Vehicle Is Selected
Carpool/Vanpool (12)
If Select your first mode of transportation: Taxi or TNC (Uber, Lyft, etc.) Is Selected
Taxi (19)
If Select your first mode of transportation: Taxi or TNC (Uber, Lyft, etc.) Is Selected
Uber (20)
If Select your first mode of transportation: Taxi or TNC (Uber, Lyft, etc.) Is Selected
Lyft (21)
If Select your first mode of transportation: Taxi or TNC (Uber, Lyft, etc.) Is Selected
Other on-demand taxi or real-time ride-sharing service (22)
Answer If Which mode of transportation did you use? Walk Is Selected Or Which mode of
transportation did you use? Bicycle Is Selected Or Which mode of transportation did you use?
Other Is Selected
q5a Please estimate (in miles) the distance you traveled for this segment of your trip(E.g. If you
traveled 1 1/2 miles, enter 1.5)
Answer If Which mode of transportation did you use? Muni Is Selected
q5b Specify Muni Line
1-California (1)
1AX-California 'A' Express (2)
1BX-California 'B' Express (3)

Nelson\Nygaard Consulting Associates Inc. | ix
2-Clement (4)
3-Jackson (5)
5-Fulton (7)
5R-Fulton Rapid (98)
6-Haight-Parnassus (8)
7-Haight-Noriega (61)
7R-Haight-Noriega Rapid (62)
7X-Noriega Express (75)
8AX Bayshore 'A' Express (90)
8BX Bayshore 'B' Express (91)
8-Bayshore (92)
9-San Bruno (10)
9R-San Bruno Rapid (93)
10-Townsend (14)
12-Folsom/Pacific (15)
14-Mission (16)
14R-Mission Rapid (17)
14X-Mission Express (18)
18-46th Avenue (94)
19-Polk (23)
21-Hayes (25)
22-Fillmore (26)
23-Monterey (27)
24-Divisadero (28)
25-Treasure Island (76)
27-Bryant (30)
28-19th Avenue (77)
28R-19th Avenue Rapid (32)
29-Sunset (78)
30-Stockton (30)
30X-Marina Express (35)
31-Balboa (36)
31AX-Balboa 'A' Express (37)
Nelson\Nygaard Consulting Associates Inc. | x
31BX-Balboa 'B' Express (38)
33-Ashbury-18th (39)
35-Eureka (40)
36-Teresita (41)
37-Corbett (42)
38-Geary (43)
38AX-Geary 'A' Express (44)
38BX-Geary 'B' Express (45)
38R-Geary Rapid (46)
39-Coit Tower (47)
41-Union (48)
43-Masonic (49)
44-O'Shaughnessy (50)
45-Union-Stockton (51)
47-Van Ness (52)
48-24th Street (53)
49-Van Ness-Mission (54)
52-Excelsior (55)
54-Felton (57)
55-16th Street (101)
56-Rutland (58)
57-Parkmerced (12)
66-Quintara (59)
67-Bernal Heights (60)
76X-Marin Headlands Express (63)
81X-Caltrain Express (65)
82X-Levi Plaza Express (66)
83X-Mid-Market Express (99)
88-BART Shuttle (67)
90-San Bruno Owl (69)
91-Owl (70)
108-Treasure Island (73)
F-Market & Wharves (79)
Nelson\Nygaard Consulting Associates Inc. | xi
J-Church (80)
KT-Ingleside/Third Street (100)
L-Taraval (82)
M-Ocean View (74)
N-Judah (84)
California-Cable Car (87)
Powell-Hyde-Cable Car (88)
Powell-Mason-Cable Car (89)
Answer If Which mode of transportation did you use? Muni Is Selected
q5c Please estimate (in miles) the distance you traveled in this segment of your trip (E.g. If you
traveled 1 1/2 miles, enter 1.5)
Answer If Which mode of transportation did you use? BART Is Selected
q5d Specify BART start station
12th St. Oakland City Center (1)
16th St. Mission (2)
19th St. Oakland (3)
24th St. Mission (4)
Ashby (5)
Balboa Park (6)
Bay Fair (7)
Castro Valley (8)
Civic Center (9)
Coliseum/Oakland Airport (10)
Colma (11)
Concord (12)
Daly City (13)
Downtown Berkeley (14)
Dublin/Pleasanton (15)
El Cerrito del Norte (16)
El Cerrito Plaza (17)
Embarcadero (18)
Nelson\Nygaard Consulting Associates Inc. | xii
Fremont (19)
Fruitvale (20)
Glen Park (21)
Hayward (22)
Lafayette (23)
Lake Merritt (24)
MacArthur (25)
Millbrae (26)
Montgomery St. (27)
North Berkeley (28)
North Concord/Martinez (29)
Orinda (30)
Pittsburg/Bay Point (31)
Pleasant Hill/Contra Costa Centre (32)
Powell St. (33)
Richmond (34)
Rockridge (35)
San Bruno (36)
San Francisco Int'l Airport (37)
San Leandro (38)
South Hayward (39)
South San Francisco (40)
Union City (41)
Walnut Creek (42)
West Dublin/Pleasanton (44)
West Oakland (43)
Answer If Which mode of transportation did you use? BART Is Selected
q5e Specify BART end station
12th St. Oakland City Center (1)
16th St. Mission (2)
19th St. Oakland (3)
24th St. Mission (4)
Nelson\Nygaard Consulting Associates Inc. | xiii
Ashby (5)
Balboa Park (6)
Bay Fair (7)
Castro Valley (8)
Civic Center (9)
Coliseum/Oakland Airport (10)
Colma (11)
Concord (12)
Daly City (13)
Downtown Berkeley (14)
Dublin/Pleasanton (15)
El Cerrito del Norte (16)
El Cerrito Plaza (17)
Embarcadero (18)
Fremont (19)
Fruitvale (20)
Glen Park (21)
Hayward (22)
Lafayette (23)
Lake Merritt (24)
MacArthur (25)
Millbrae (26)
Montgomery St. (27)
North Berkeley (28)
North Concord/Martinez (29)
Orinda (30)
Pittsburg/Bay Point (31)
Pleasant Hill/Contra Costa Centre (32)
Powell St. (33)
Richmond (34)
Rockridge (35)
San Bruno (36)
San Francisco Int'l Airport (37)
Nelson\Nygaard Consulting Associates Inc. | xiv
San Leandro (38)
South Hayward (39)
South San Francisco (40)
Union City (41)
Walnut Creek (42)
West Dublin/Pleasanton (44)
West Oakland (43)
Answer If Which mode of transportation did you use? Caltrain Is Selected
q5f Specify Caltrain start station
22nd Street (1)
Atherton (2)
Bayshore (3)
Belmont (4)
Blossom Hill (5)
Broadway (6)
Burlingame (7)
California Ave (8)
Capitol (9)
College Park (10)
Diridon (11)
Gilroy (12)
Hayward Park (13)
Hillsdale (14)
Lawrence (15)
Menlo Park (16)
Millbrae (17)
Morgan Hill (18)
Mountain View (19)
Palo Alto (20)
Redwood City (21)
San Antonio (22)
San Bruno (23)
Nelson\Nygaard Consulting Associates Inc. | xv
San Carlos (24)
San Francisco (25)
San Jose (26)
San Martin (27)
San Mateo (28)
Santa Clara (29)
South San Francisco (30)
Stanford (31)
Sunnyvale (32)
Tamien (33)
Answer If Which mode of transportation did you use? Caltrain Is Selected
q5g Specify Caltrain end station
22nd Street (1)
Atherton (2)
Bayshore (3)
Belmont (4)
Blossom Hill (5)
Broadway (6)
Burlingame (7)
California Ave (8)
Capitol (9)
College Park (10)
Diridon (11)
Gilroy (12)
Hayward Park (13)
Hillsdale (14)
Lawrence (15)
Menlo Park (16)
Millbrae (17)
Morgan Hill (18)
Mountain View (19)
Palo Alto (20)
Nelson\Nygaard Consulting Associates Inc. | xvi
Redwood City (21)
San Antonio (22)
San Bruno (23)
San Carlos (24)
San Francisco (25)
San Jose (26)
San Martin (27)
San Mateo (28)
Santa Clara (29)
South San Francisco (30)
Stanford (31)
Sunnyvale (32)
Tamien (33)
Answer If Which mode of transportation did you use? Other bus provider than Muni (e.g. AC
Transit/Golden Gate Transit/SamTrans) Is Selected
q5h Please estimate (in miles) the distance you traveled for this segment of your trip(E.g. If you
traveled 1 1/2 miles, enter 1.5)
Answer If Which mode of transportation did you use? Carpool/Vanpool Is Selected
q5ii I was the:
Passenger (1)
Driver (2)
Answer If Which mode of transportation did you use? Carpool/Vanpool Is Selected
q5i Number of people in the carpool/vanpool on Wednesday April, 6, 2016:
2 (2)
3 (3)
4 (4)
5 (5)
6 (6)
7 (7)
More than 7 (8)
Nelson\Nygaard Consulting Associates Inc. | xvii
Answer If Select your first mode of transportation: Private vehicle (cars, carpool, motorcycle,
etc.) Is Selected
q5j Please estimate (in miles) the distance you traveled for this segment of your trip(E.g. If you
traveled 1 1/2 miles, enter 1.5)
Answer If Select your first mode of transportation: Taxi, Uber, Lyft, or other on-demand taxi or
real-time ridesharing services known as TNCs Is Selected
Q137 Please estimate (in miles) the distance you traveled for this segment of your trip(E.g. If you
traveled 1 1/2 miles, enter 1.5)
Q230 On your trip to SF State's main campus, what was the mode of transportation for your
second segment? If you used BART previously, please use this question to tell us how you got
from BART to campus.
Walk, bike, or other active transport (1)
Public transportation / shuttle (2)
Private vehicle (cars, carpool, motorcycle, etc.) (3)
Taxi, Uber, Lyft, or other on-demand taxi or real-time ride-sharing services known as
TNCs (4)
None (5)
If None Is Selected, Then Skip To End of Block
Q231 Which mode of transportation did you use?
If On your trip to SF State's main campus, what was your second mode of
transportation? (If your previous segment was via BART please use this question as an
opportunity to tell us how you g... Walk, bike, or other active transport Is Selected
Walk (1)
If On your trip to SF State's main campus, what was your second mode of
transportation? (If your previous segment was via BART please use this question as an
opportunity to tell us how you g... Walk, bike, or other active transport Is Selected
Bicycle (2)
If On your trip to SF State's main campus, what was your second mode of
transportation? (If your previous segment was via BART please use this question as an
opportunity to tell us how you g... Walk, bike, or other active transport Is Selected
Other (3)
If On your trip to SF State's main campus, what was your second mode of
transportation? (If your previous segment was via BART please use this question as an
opportunity to tell us how you g... Public transportation / shuttle Is Selected
Muni (4)

Nelson\Nygaard Consulting Associates Inc. | xviii
If On your trip to SF State's main campus, what was your second mode of
transportation? (If your previous segment was via BART please use this question as an
opportunity to tell us how you g... Public transportation / shuttle Is Selected
BART (5)
If On your trip to SF State's main campus, what was your second mode of
transportation? (If your previous segment was via BART please use this question as an
opportunity to tell us how you g... Public transportation / shuttle Is Selected
SF State Shuttle (6)
If On your trip to SF State's main campus, what was your second mode of
transportation? (If your previous segment was via BART please use this question as an
opportunity to tell us how you g... Public transportation / shuttle Is Selected
Caltrain (7)
If On your trip to SF State's main campus, what was your second mode of
transportation? (If your previous segment was via BART please use this question as an
opportunity to tell us how you g... Public transportation / shuttle Is Selected
Other bus provider than Muni (e.g. AC Transit/Golden Gate Transit/SamTrans) (8)
If On your trip to SF State's main campus, what was your second mode of
transportation? (If your previous segment was via BART please use this question as an
opportunity to tell us how you g... Private vehicle (cars, carpool, motorcycle, etc.) Is Selected
Drove Alone (9)
If On your trip to SF State's main campus, what was your second mode of
transportation? (If your previous segment was via BART please use this question as an
opportunity to tell us how you g... Private vehicle (cars, carpool, motorcycle, etc.) Is Selected
Dropped Off / Picked Up (10)
If On your trip to SF State's main campus, what was your second mode of
transportation? (If your previous segment was via BART please use this question as an
opportunity to tell us how you g... Private vehicle (cars, carpool, motorcycle, etc.) Is Selected
Motorcycle/Moped (11)
If On your trip to SF State's main campus, what was your second mode of
transportation? (If your previous segment was via BART please use this question as an
opportunity to tell us how you g... Private vehicle (cars, carpool, motorcycle, etc.) Is Selected
Carpool/Vanpool (12)
If On your trip to SF State's main campus, what was your second mode of
transportation? (If your previous segment was via BART please use this question as an
opportunity to tell us how you g... Taxi, Uber, Lyft, or other on-demand taxi or real-time ride-
sharing services known as TNCs Is Selected
Taxi (19)
If On your trip to SF State's main campus, what was your second mode of
transportation? (If your previous segment was via BART please use this question as an
Nelson\Nygaard Consulting Associates Inc. | xix
opportunity to tell us how you g... Taxi, Uber, Lyft, or other on-demand taxi or real-time ride-
sharing services known as TNCs Is Selected
Uber (20)
If On your trip to SF State's main campus, what was your second mode of
transportation? (If your previous segment was via BART please use this question as an
opportunity to tell us how you g... Taxi, Uber, Lyft, or other on-demand taxi or real-time ride-
sharing services known as TNCs Is Selected
Lyft (21)
If On your trip to SF State's main campus, what was your second mode of
transportation? (If your previous segment was via BART please use this question as an
opportunity to tell us how you g... Taxi, Uber, Lyft, or other on-demand taxi or real-time ride-
sharing services known as TNCs Is Selected
Other on-demand taxi or real-time ride-sharing service (22)
Answer If Which mode of transportation did you use? Walk Is Selected Or Which mode of
transportation did you use? Bicycle Is Selected Or Which mode of transportation did you use?
Other Is Selected
Q232 Please estimate (in miles) the distance you traveled for this segment of your trip (for
instance if you traveled 1 1/2 miles, enter 1.5)
Answer If Which mode of transportation did you use? Muni Is Selected
Q205 Specify Muni Line
1-California (1)
1AX-California 'A' Express (2)
1BX-California 'B' Express (3)
2-Clement (4)
3-Jackson (5)
5-Fulton (7)
5R-Fulton Rapid (98)
6-Haight-Parnassus (8)
7-Haight-Noriega (61)
7R-Haight-Noriega Rapid (62)
7X-Noriega Express (75)
8AX Bayshore 'A' Express (90)
8BX Bayshore 'B' Express (91)
8-Bayshore (92)

Nelson\Nygaard Consulting Associates Inc. | xx
9-San Bruno (10)
9R-San Bruno Rapid (93)
10-Townsend (14)
12-Folsom/Pacific (15)
14-Mission (16)
14R-Mission Rapid (17)
14X-Mission Express (18)
18-46th Avenue (94)
19-Polk (23)
21-Hayes (25)
22-Fillmore (26)
23-Monterey (27)
24-Divisadero (28)
25-Treasure Island (76)
27-Bryant (30)
28-19th Avenue (77)
28R-19th Avenue Rapid (32)
29-Sunset (78)
30-Stockton (30)
30X-Marina Express (35)
31-Balboa (36)
31AX-Balboa 'A' Express (37)
31BX-Balboa 'B' Express (38)
33-Ashbury-18th (39)
35-Eureka (40)
36-Teresita (41)
37-Corbett (42)
38-Geary (43)
38AX-Geary 'A' Express (44)
38BX-Geary 'B' Express (45)
38R-Geary Rapid (46)
39-Coit Tower (47)
41-Union (48)
Nelson\Nygaard Consulting Associates Inc. | xxi
43-Masonic (49)
44-O'Shaughnessy (50)
45-Union-Stockton (51)
47-Van Ness (52)
48-24th Street (53)
49-Van Ness-Mission (54)
52-Excelsior (55)
54-Felton (57)
55-16th Street (101)
56-Rutland (58)
57-Parkmerced (12)
66-Quintara (59)
67-Bernal Heights (60)
76X-Marin Headlands Express (63)
81X-Caltrain Express (65)
82X-Levi Plaza Express (66)
83X-Mid-Market Express (99)
88-BART Shuttle (67)
90-San Bruno Owl (69)
91-Owl (70)
108-Treasure Island (73)
F-Market & Wharves (79)
J-Church (80)
KT-Ingleside/Third Street (100)
L-Taraval (82)
M-Ocean View (74)
N-Judah (84)
California-Cable Car (87)
Powell-Hyde-Cable Car (88)
Powell-Mason-Cable Car (89)
Answer If Which mode of transportation did you use? Muni Is Selected
Nelson\Nygaard Consulting Associates Inc. | xxii
Q234 Please estimate (in miles) the distance you traveled in this segment of your trip (for
instance if you traveled 1 1/2 miles, enter 1.5)
Answer If Which mode of transportation did you use? BART Is Selected
Q235 Specify BART start station
12th St. Oakland City Center (1)
16th St. Mission (2)
19th St. Oakland (3)
24th St. Mission (4)
Ashby (5)
Balboa Park (6)
Bay Fair (7)
Castro Valley (8)
Civic Center (9)
Coliseum/Oakland Airport (10)
Colma (11)
Concord (12)
Daly City (13)
Downtown Berkeley (14)
Dublin/Pleasanton (15)
El Cerrito del Norte (16)
El Cerrito Plaza (17)
Embarcadero (18)
Fremont (19)
Fruitvale (20)
Glen Park (21)
Hayward (22)
Lafayette (23)
Lake Merritt (24)
MacArthur (25)
Millbrae (26)
Montgomery St. (27)
North Berkeley (28)
Nelson\Nygaard Consulting Associates Inc. | xxiii
North Concord/Martinez (29)
Orinda (30)
Pittsburg/Bay Point (31)
Pleasant Hill/Contra Costa Centre (32)
Powell St. (33)
Richmond (34)
Rockridge (35)
San Bruno (36)
San Francisco Int'l Airport (37)
San Leandro (38)
South Hayward (39)
South San Francisco (40)
Union City (41)
Walnut Creek (42)
West Dublin/Pleasanton (44)
West Oakland (43)
Answer If Which mode of transportation did you use? BART Is Selected
Q236 Specify BART end station
12th St. Oakland City Center (1)
16th St. Mission (2)
19th St. Oakland (3)
24th St. Mission (4)
Ashby (5)
Balboa Park (6)
Bay Fair (7)
Castro Valley (8)
Civic Center (9)
Coliseum/Oakland Airport (10)
Colma (11)
Concord (12)
Daly City (13)
Downtown Berkeley (14)

Nelson\Nygaard Consulting Associates Inc. | xxiv
Dublin/Pleasanton (15)
El Cerrito del Norte (16)
El Cerrito Plaza (17)
Embarcadero (18)
Fremont (19)
Fruitvale (20)
Glen Park (21)
Hayward (22)
Lafayette (23)
Lake Merritt (24)
MacArthur (25)
Millbrae (26)
Montgomery St. (27)
North Berkeley (28)
North Concord/Martinez (29)
Orinda (30)
Pittsburg/Bay Point (31)
Pleasant Hill/Contra Costa Centre (32)
Powell St. (33)
Richmond (34)
Rockridge (35)
San Bruno (36)
San Francisco Int'l Airport (37)
San Leandro (38)
South Hayward (39)
South San Francisco (40)
Union City (41)
Walnut Creek (42)
West Dublin/Pleasanton (44)
West Oakland (43)
Answer If Which mode of transportation did you use? Caltrain Is Selected
Q237 Specify Caltrain start station
Nelson\Nygaard Consulting Associates Inc. | xxv
22nd Street (1)
Atherton (2)
Bayshore (3)
Belmont (4)
Blossom Hill (5)
Broadway (6)
Burlingame (7)
California Ave (8)
Capitol (9)
College Park (10)
Diridon (11)
Gilroy (12)
Hayward Park (13)
Hillsdale (14)
Lawrence (15)
Menlo Park (16)
Millbrae (17)
Morgan Hill (18)
Mountain View (19)
Palo Alto (20)
Redwood City (21)
San Antonio (22)
San Bruno (23)
San Carlos (24)
San Francisco (25)
San Jose (26)
San Martin (27)
San Mateo (28)
Santa Clara (29)
South San Francisco (30)
Stanford (31)
Sunnyvale (32)
Tamien (33)
Nelson\Nygaard Consulting Associates Inc. | xxvi
Answer If Which mode of transportation did you use? Caltrain Is Selected
Q238 Specify Caltrain end station
22nd Street (1)
Atherton (2)
Bayshore (3)
Belmont (4)
Blossom Hill (5)
Broadway (6)
Burlingame (7)
California Ave (8)
Capitol (9)
College Park (10)
Diridon (11)
Gilroy (12)
Hayward Park (13)
Hillsdale (14)
Lawrence (15)
Menlo Park (16)
Millbrae (17)
Morgan Hill (18)
Mountain View (19)
Palo Alto (20)
Redwood City (21)
San Antonio (22)
San Bruno (23)
San Carlos (24)
San Francisco (25)
San Jose (26)
San Martin (27)
San Mateo (28)
Santa Clara (29)
South San Francisco (30)
Nelson\Nygaard Consulting Associates Inc. | xxvii
Stanford (31)
Sunnyvale (32)
Tamien (33)
Answer If Which mode of transportation did you use? Other bus provider than Muni (e.g. AC
Transit/Golden Gate Transit/SamTrans) Is Selected
Q239 Please estimate (in miles) the distance you traveled for this segment of your trip (for
instance if you traveled 1 1/2 miles, enter 1.5)
Answer If Which mode of transportation did you use? Carpool/Vanpool Is Selected
Q240 I was the:
Passenger (1)
Driver (2)
Answer If Which mode of transportation did you use? Carpool/Vanpool Is Selected
Q241 Number of people in the carpool/vanpool on Wednesday April, 6, 2016:
2 (2)
3 (3)
4 (4)
5 (5)
6 (6)
7 (7)
More than 7 (8)
Answer If On your trip to SF State's main campus, what was your second mode of transportation?
(If your las... Private vehicle (cars, carpool, motorcycle, etc.) Is Selected
Q242 Please estimate (in miles) the distance you traveled for this segment of your trip (for
instance if you traveled 1 1/2 miles, enter 1.5)
Answer If On your trip to SF State's main campus, what was your second mode of transportation?
(If your las... Taxi, Uber, Lyft, or other on-demand taxi or real-time ridesharing services known as
TNCs Is Selected
Q243 Please estimate (in miles) the distance you traveled for this segment of your trip (for
instance if you traveled 1 1/2 miles, enter 1.5)
Nelson\Nygaard Consulting Associates Inc. | xxviii
Q122 On your trip to SF State's main campus, what was the mode of transportation for your third
segment? If you used BART previously, please use this question to tell us how you got from BART
to campus.
Walk, bike, or other active transport (1)
Public transportation / shuttle (2)
Private vehicle (cars, carpool, motorcycle, etc.) (3)
Taxi, Uber, Lyft, or other on-demand taxi or real-time ride-sharing services known as
TNCs (4)
None (5)
If None Is Selected, Then Skip To End of Block
Q109 Which mode of transportation did you use?
If On your trip to SF State's main campus, what was your third mode of transportation? (If
your previous segment was via BART please use this question as an opportunity to tell us how you
got fro... Walk, bike, or other active transport Is Selected
Walk (1)
If On your trip to SF State's main campus, what was your third mode of transportation? (If
your previous segment was via BART please use this question as an opportunity to tell us how you
got fro... Walk, bike, or other active transport Is Selected
Bicycle (2)
If On your trip to SF State's main campus, what was your third mode of transportation? (If
your previous segment was via BART please use this question as an opportunity to tell us how you
got fro... Walk, bike, or other active transport Is Selected
Other (3)
If On your trip to SF State's main campus, what was your third mode of transportation? (If your
prev... Public transportation / shuttle Is Selected
Muni (4)
If On your trip to SF State's main campus, what was your third mode of transportation? (If your
prev... Public transportation / shuttle Is Selected
BART (5)
If On your trip to SF State's main campus, what was your third mode of transportation? (If your
prev... Public transportation / shuttle Is Selected
SF State Shuttle (6)
If On your trip to SF State's main campus, what was your third mode of transportation? (If your
prev... Public transportation / shuttle Is Selected
Caltrain (7)
Nelson\Nygaard Consulting Associates Inc. | xxix
If On your trip to SF State's main campus, what was your third mode of transportation? (If your
prev... Public transportation / shuttle Is Selected
Other bus provider than Muni (e.g. AC Transit/Golden Gate Transit/SamTrans) (8)
If On your trip to SF State's main campus, what was your third mode of transportation? (If your
prev... Private vehicle (cars, carpool, motorcycle, etc.) Is Selected
Drove Alone (9)
If On your trip to SF State's main campus, what was your third mode of transportation? (If your
prev... Private vehicle (cars, carpool, motorcycle, etc.) Is Selected
Dropped Off / Picked Up (10)
If On your trip to SF State's main campus, what was your third mode of transportation? (If your
prev... Private vehicle (cars, carpool, motorcycle, etc.) Is Selected
Motorcycle/Moped (11)
If On your trip to SF State's main campus, what was your third mode of transportation? (If your
prev... Private vehicle (cars, carpool, motorcycle, etc.) Is Selected
Carpool/Vanpool (12)
If On your trip to SF State's main campus, what was your third mode of transportation? (If your
prev... Taxi, Uber, Lyft, or other on-demand taxi or real-time ride-sharing services known as
TNCs Is Selected
Taxi (19)
If On your trip to SF State's main campus, what was your third mode of transportation? (If your
prev... Taxi, Uber, Lyft, or other on-demand taxi or real-time ride-sharing services known as
TNCs Is Selected
Uber (20)
If On your trip to SF State's main campus, what was your third mode of transportation? (If your
prev... Taxi, Uber, Lyft, or other on-demand taxi or real-time ride-sharing services known as
TNCs Is Selected
Lyft (21)
If On your trip to SF State's main campus, what was your third mode of transportation? (If your
prev... Taxi, Uber, Lyft, or other on-demand taxi or real-time ride-sharing services known as
TNCs Is Selected
Other on-demand taxi or real-time ride-sharing service (22)
Answer If Which mode of Transportation did you use? Walk Is Selected Or Which mode of
Transportation did you use? Bicycle Is Selected Or Which mode of Transportation did you use?
Other Is Selected
Q110 Please estimate (in miles) the distance you traveled for this segment of your trip (for
instance if you traveled 1 1/2 miles, enter 1.5)
Nelson\Nygaard Consulting Associates Inc. | xxx
Answer If Which mode of Transportation did you use? Muni Is Selected
Q206 Specify Muni Line
1-California (1)
1AX-California 'A' Express (2)
1BX-California 'B' Express (3)
2-Clement (4)
3-Jackson (5)
5-Fulton (7)
5R-Fulton Rapid (98)
6-Haight-Parnassus (8)
7-Haight-Noriega (61)
7R-Haight-Noriega Rapid (62)
7X-Noriega Express (75)
8AX Bayshore 'A' Express (90)
8BX Bayshore 'B' Express (91)
8-Bayshore (92)
9-San Bruno (10)
9R-San Bruno Rapid (93)
10-Townsend (14)
12-Folsom/Pacific (15)
14-Mission (16)
14R-Mission Rapid (17)
14X-Mission Express (18)
18-46th Avenue (94)
19-Polk (23)
21-Hayes (25)
22-Fillmore (26)
23-Monterey (27)
24-Divisadero (28)
25-Treasure Island (76)
27-Bryant (30)
28-19th Avenue (77)
28R-19th Avenue Rapid (32)
Nelson\Nygaard Consulting Associates Inc. | xxxi
29-Sunset (78)
30-Stockton (30)
30X-Marina Express (35)
31-Balboa (36)
31AX-Balboa 'A' Express (37)
31BX-Balboa 'B' Express (38)
33-Ashbury-18th (39)
35-Eureka (40)
36-Teresita (41)
37-Corbett (42)
38-Geary (43)
38AX-Geary 'A' Express (44)
38BX-Geary 'B' Express (45)
38R-Geary Rapid (46)
39-Coit Tower (47)
41-Union (48)
43-Masonic (49)
44-O'Shaughnessy (50)
45-Union-Stockton (51)
47-Van Ness (52)
48-24th Street (53)
49-Van Ness-Mission (54)
52-Excelsior (55)
54-Felton (57)
55-16th Street (101)
56-Rutland (58)
57-Parkmerced (12)
66-Quintara (59)
67-Bernal Heights (60)
76X-Marin Headlands Express (63)
81X-Caltrain Express (65)
82X-Levi Plaza Express (66)
83X-Mid-Market Express (99)
Nelson\Nygaard Consulting Associates Inc. | xxxii
88-BART Shuttle (67)
90-San Bruno Owl (69)
91-Owl (70)
108-Treasure Island (73)
F-Market & Wharves (79)
J-Church (80)
KT-Ingleside/Third Street (100)
L-Taraval (82)
M-Ocean View (74)
N-Judah (84)
California-Cable Car (87)
Powell-Hyde-Cable Car (88)
Powell-Mason-Cable Car (89)
Answer If Which mode of Transportation did you use? Muni Is Selected
Q112 Please estimate (in miles) the distance you traveled in this segment of your trip (for instance
if you traveled 1 1/2 miles, enter 1.5)
Answer If Which mode of Transportation did you use? BART Is Selected
Q113 Specify BART start station
12th St. Oakland City Center (1)
16th St. Mission (2)
19th St. Oakland (3)
24th St. Mission (4)
Ashby (5)
Balboa Park (6)
Bay Fair (7)
Castro Valley (8)
Civic Center (9)
Coliseum/Oakland Airport (10)
Colma (11)
Concord (12)
Daly City (13)

Nelson\Nygaard Consulting Associates Inc. | xxxiii
Downtown Berkeley (14)
Dublin/Pleasanton (15)
El Cerrito del Norte (16)
El Cerrito Plaza (17)
Embarcadero (18)
Fremont (19)
Fruitvale (20)
Glen Park (21)
Hayward (22)
Lafayette (23)
Lake Merritt (24)
MacArthur (25)
Millbrae (26)
Montgomery St. (27)
North Berkeley (28)
North Concord/Martinez (29)
Orinda (30)
Pittsburg/Bay Point (31)
Pleasant Hill/Contra Costa Centre (32)
Powell St. (33)
Richmond (34)
Rockridge (35)
San Bruno (36)
San Francisco Int'l Airport (37)
San Leandro (38)
South Hayward (39)
South San Francisco (40)
Union City (41)
Walnut Creek (42)
West Dublin/Pleasanton (44)
West Oakland (43)
Answer If Which mode of Transportation did you use? BART Is Selected
Nelson\Nygaard Consulting Associates Inc. | xxxiv
Q114 Specify BART end station
12th St. Oakland City Center (1)
16th St. Mission (2)
19th St. Oakland (3)
24th St. Mission (4)
Ashby (5)
Balboa Park (6)
Bay Fair (7)
Castro Valley (8)
Civic Center (9)
Coliseum/Oakland Airport (10)
Colma (11)
Concord (12)
Daly City (13)
Downtown Berkeley (14)
Dublin/Pleasanton (15)
El Cerrito del Norte (16)
El Cerrito Plaza (17)
Embarcadero (18)
Fremont (19)
Fruitvale (20)
Glen Park (21)
Hayward (22)
Lafayette (23)
Lake Merritt (24)
MacArthur (25)
Millbrae (26)
Montgomery St. (27)
North Berkeley (28)
North Concord/Martinez (29)
Orinda (30)
Pittsburg/Bay Point (31)
Pleasant Hill/Contra Costa Centre (32)

Nelson\Nygaard Consulting Associates Inc. | xxxv
Powell St. (33)
Richmond (34)
Rockridge (35)
San Bruno (36)
San Francisco Int'l Airport (37)
San Leandro (38)
South Hayward (39)
South San Francisco (40)
Union City (41)
Walnut Creek (42)
West Dublin/Pleasanton (44)
West Oakland (43)
Answer If Which mode of Transportation did you use? Caltrain Is Selected
Q115 Specify Caltrain start station
22nd Street (1)
Atherton (2)
Bayshore (3)
Belmont (4)
Blossom Hill (5)
Broadway (6)
Burlingame (7)
California Ave (8)
Capitol (9)
College Park (10)
Diridon (11)
Gilroy (12)
Hayward Park (13)
Hillsdale (14)
Lawrence (15)
Menlo Park (16)
Millbrae (17)
Morgan Hill (18)
Nelson\Nygaard Consulting Associates Inc. | xxxvi
Mountain View (19)
Palo Alto (20)
Redwood City (21)
San Antonio (22)
San Bruno (23)
San Carlos (24)
San Francisco (25)
San Jose (26)
San Martin (27)
San Mateo (28)
Santa Clara (29)
South San Francisco (30)
Stanford (31)
Sunnyvale (32)
Tamien (33)
Answer If Which mode of Transportation did you use? Caltrain Is Selected
Q116 Specify Caltrain end station
22nd Street (1)
Atherton (2)
Bayshore (3)
Belmont (4)
Blossom Hill (5)
Broadway (6)
Burlingame (7)
California Ave (8)
Capitol (9)
College Park (10)
Diridon (11)
Gilroy (12)
Hayward Park (13)
Hillsdale (14)
Lawrence (15)
Nelson\Nygaard Consulting Associates Inc. | xxxvii
Menlo Park (16)
Millbrae (17)
Morgan Hill (18)
Mountain View (19)
Palo Alto (20)
Redwood City (21)
San Antonio (22)
San Bruno (23)
San Carlos (24)
San Francisco (25)
San Jose (26)
San Martin (27)
San Mateo (28)
Santa Clara (29)
South San Francisco (30)
Stanford (31)
Sunnyvale (32)
Tamien (33)
Answer If Which mode of Transportation did you use? Other bus provider than Muni (e.g. AC
Transit/Golden Gate Transit/SamTrans) Is Selected
Q117 Please estimate (in miles) the distance you traveled for this segment of your trip (for
instance if you traveled 1 1/2 miles, enter 1.5)
Answer If Which mode of Transportation did you use? Carpool/Vanpool Is Selected
Q118 I was the:
Passenger (1)
Driver (2)
Answer If Which mode of Transportation did you use? Carpool/Vanpool Is Selected
Q119 Number of people in the carpool/vanpool on Wednesday April, 6, 2016:
2 (2)
3 (3)
4 (4)
Nelson\Nygaard Consulting Associates Inc. | xxxviii
5 (5)
6 (6)
7 (7)
More than 7 (8)
Answer If On your trip to SF State's main campus, what was your third mode of transportation?
(If your last... Private vehicle (cars, carpool, motorcycle, etc.) Is Selected
Q120 Please estimate (in miles) the distance you traveled for this segment of your trip (for
instance if you traveled 1 1/2 miles, enter 1.5)
Answer If On your trip to SF State's main campus, what was your third mode of transportation?
(If your last... Taxi, Uber, Lyft, or other on-demand taxi or real-time ridesharing services known
as TNCs Is Selected
Q121 Please estimate (in miles) the distance you traveled for this segment of your trip (for
instance if you traveled 1 1/2 miles, enter 1.5)
Q123 On your trip to SF State's main campus, what was the mode of transportation for your
fourth segment?If you used BART previously, please use this question to tell us how you got from
BART to campus.
Walk, bike, or other active transport (1)
Public transportation / shuttle (2)
Private vehicle (cars, carpool, motorcycle, etc.) (3)
Taxi, Uber, Lyft, or other on-demand taxi or real-time ride-sharing services known as
TNCs (4)
None (5)
If None Is Selected, Then Skip To End of Block
Q124 Which mode of transportation did you use?
If On your trip to SF State's main campus, what was your fourth mode of transportation? (If your
pre... Walk, bike, or other active transport Is Selected
Walk (1)
If On your trip to SF State's main campus, what was your fourth mode of transportation? (If your
pre... Walk, bike, or other active transport Is Selected
Bicycle (2)
If On your trip to SF State's main campus, what was your fourth mode of transportation? (If your
pre... Walk, bike, or other active transport Is Selected
Nelson\Nygaard Consulting Associates Inc. | xxxix
Other (3)
If On your trip to SF State's main campus, what was your fourth mode of transportation? (If your
pre... Public transportation / shuttle Is Selected
Muni (4)
If On your trip to SF State's main campus, what was your fourth mode of transportation? (If your
pre... Public transportation / shuttle Is Selected
BART (5)
If On your trip to SF State's main campus, what was the mode of transportation for your fourth
segme... Public transportation / shuttle Is Selected
SF State Shuttle (6)
If On your trip to SF State's main campus, what was your fourth mode of transportation? (If your
pre... Public transportation / shuttle Is Selected
Caltrain (7)
If On your trip to SF State's main campus, what was your fourth mode of transportation? (If your
pre... Public transportation / shuttle Is Selected
Other bus provider than Muni (e.g. AC Transit/Golden Gate Transit/SamTrans) (8)
If On your trip to SF State's main campus, what was your fourth mode of transportation? (If your
pre... Private vehicle (cars, carpool, motorcycle, etc.) Is Selected
Drove Alone (9)
If On your trip to SF State's main campus, what was your fourth mode of transportation? (If your
pre... Private vehicle (cars, carpool, motorcycle, etc.) Is Selected
Dropped Off / Picked Up (10)
If On your trip to SF State's main campus, what was your fourth mode of transportation? (If your
pre... Private vehicle (cars, carpool, motorcycle, etc.) Is Selected
Motorcycle/Moped (11)
If On your trip to SF State's main campus, what was your fourth mode of transportation? (If your
pre... Private vehicle (cars, carpool, motorcycle, etc.) Is Selected
Carpool/Vanpool (12)
If On your trip to SF State's main campus, what was your fourth mode of transportation? (If your
pre... Taxi, Uber, Lyft, or other on-demand taxi or real-time ride-sharing services known as TNCs
Is Selected
Taxi (19)
If On your trip to SF State's main campus, what was your fourth mode of transportation? (If your
pre... Taxi, Uber, Lyft, or other on-demand taxi or real-time ride-sharing services known as TNCs
Is Selected
Uber (20)
Nelson\Nygaard Consulting Associates Inc. | xl
If On your trip to SF State's main campus, what was your fourth mode of transportation? (If your
pre... Taxi, Uber, Lyft, or other on-demand taxi or real-time ride-sharing services known as TNCs
Is Selected
Lyft (21)
If On your trip to SF State's main campus, what was your fourth mode of transportation? (If your
pre... Taxi, Uber, Lyft, or other on-demand taxi or real-time ride-sharing services known as TNCs
Is Selected
Other on-demand taxi or real-time ride-sharing service (22)
If SF State Shuttle Is Selected, Then Skip To End of Block
Answer If Which mode of transportation did you use? Walk Is Selected Or Which mode of
transportation did you use? Bicycle Is Selected Or Which mode of transportation did you use?
Other Is Selected
Q125 Please estimate (in miles) the distance you traveled for this segment of your trip (for
instance if you traveled 1 1/2 miles, enter 1.5)
Answer If Which mode of transportation did you use? Muni Is Selected
Q207 Specify Muni Line
1-California (1)
1AX-California 'A' Express (2)
1BX-California 'B' Express (3)
2-Clement (4)
3-Jackson (5)
5-Fulton (7)
5R-Fulton Rapid (98)
6-Haight-Parnassus (8)
7-Haight-Noriega (61)
7R-Haight-Noriega Rapid (62)
7X-Noriega Express (75)
8AX Bayshore 'A' Express (90)
8BX Bayshore 'B' Express (91)
8-Bayshore (92)
9-San Bruno (10)
9R-San Bruno Rapid (93)
10-Townsend (14)
Nelson\Nygaard Consulting Associates Inc. | xli
12-Folsom/Pacific (15)
14-Mission (16)
14R-Mission Rapid (17)
14X-Mission Express (18)
18-46th Avenue (94)
19-Polk (23)
21-Hayes (25)
22-Fillmore (26)
23-Monterey (27)
24-Divisadero (28)
25-Treasure Island (76)
27-Bryant (30)
28-19th Avenue (77)
28R-19th Avenue Rapid (32)
29-Sunset (78)
30-Stockton (30)
30X-Marina Express (35)
31-Balboa (36)
31AX-Balboa 'A' Express (37)
31BX-Balboa 'B' Express (38)
33-Ashbury-18th (39)
35-Eureka (40)
36-Teresita (41)
37-Corbett (42)
38-Geary (43)
38AX-Geary 'A' Express (44)
38BX-Geary 'B' Express (45)
38R-Geary Rapid (46)
39-Coit Tower (47)
41-Union (48)
43-Masonic (49)
44-O'Shaughnessy (50)
45-Union-Stockton (51)
Nelson\Nygaard Consulting Associates Inc. | xlii
47-Van Ness (52)
48-24th Street (53)
49-Van Ness-Mission (54)
52-Excelsior (55)
54-Felton (57)
55-16th Street (101)
56-Rutland (58)
57-Parkmerced (12)
66-Quintara (59)
67-Bernal Heights (60)
76X-Marin Headlands Express (63)
81X-Caltrain Express (65)
82X-Levi Plaza Express (66)
83X-Mid-Market Express (99)
88-BART Shuttle (67)
90-San Bruno Owl (69)
91-Owl (70)
108-Treasure Island (73)
F-Market & Wharves (79)
J-Church (80)
KT-Ingleside/Third Street (100)
L-Taraval (82)
M-Ocean View (74)
N-Judah (84)
California-Cable Car (87)
Powell-Hyde-Cable Car (88)
Powell-Mason-Cable Car (89)
Answer If Which mode of transportation did you use? Muni Is Selected
Q127 Please estimate (in miles) the distance you traveled in this segment of your trip (for instance
if you traveled 1 1/2 miles, enter 1.5)
Answer If Which mode of transportation did you use? BART Is Selected
Nelson\Nygaard Consulting Associates Inc. | xliii
Q128 Specify BART start station
12th St. Oakland City Center (1)
16th St. Mission (2)
19th St. Oakland (3)
24th St. Mission (4)
Ashby (5)
Balboa Park (6)
Bay Fair (7)
Castro Valley (8)
Civic Center (9)
Coliseum/Oakland Airport (10)
Colma (11)
Concord (12)
Daly City (13)
Downtown Berkeley (14)
Dublin/Pleasanton (15)
El Cerrito del Norte (16)
El Cerrito Plaza (17)
Embarcadero (18)
Fremont (19)
Fruitvale (20)
Glen Park (21)
Hayward (22)
Lafayette (23)
Lake Merritt (24)
MacArthur (25)
Millbrae (26)
Montgomery St. (27)
North Berkeley (28)
North Concord/Martinez (29)
Orinda (30)
Pittsburg/Bay Point (31)
Pleasant Hill/Contra Costa Centre (32)
Nelson\Nygaard Consulting Associates Inc. | xliv
Powell St. (33)
Richmond (34)
Rockridge (35)
San Bruno (36)
San Francisco Int'l Airport (37)
San Leandro (38)
South Hayward (39)
South San Francisco (40)
Union City (41)
Walnut Creek (42)
West Dublin/Pleasanton (44)
West Oakland (43)
Answer If Which mode of transportation did you use? BART Is Selected
Q129 Specify BART end station
12th St. Oakland City Center (1)
16th St. Mission (2)
19th St. Oakland (3)
24th St. Mission (4)
Ashby (5)
Balboa Park (6)
Bay Fair (7)
Castro Valley (8)
Civic Center (9)
Coliseum/Oakland Airport (10)
Colma (11)
Concord (12)
Daly City (13)
Downtown Berkeley (14)
Dublin/Pleasanton (15)
El Cerrito del Norte (16)
El Cerrito Plaza (17)
Embarcadero (18)
Nelson\Nygaard Consulting Associates Inc. | xlv
Fremont (19)
Fruitvale (20)
Glen Park (21)
Hayward (22)
Lafayette (23)
Lake Merritt (24)
MacArthur (25)
Millbrae (26)
Montgomery St. (27)
North Berkeley (28)
North Concord/Martinez (29)
Orinda (30)
Pittsburg/Bay Point (31)
Pleasant Hill/Contra Costa Centre (32)
Powell St. (33)
Richmond (34)
Rockridge (35)
San Bruno (36)
San Francisco Int'l Airport (37)
San Leandro (38)
South Hayward (39)
South San Francisco (40)
Union City (41)
Walnut Creek (42)
West Dublin/Pleasanton (44)
West Oakland (43)
Answer If Which mode of transportation did you use? Caltrain Is Selected
Q130 Specify Caltrain start station
22nd Street (1)
Atherton (2)
Bayshore (3)
Belmont (4)
Nelson\Nygaard Consulting Associates Inc. | xlvi
Blossom Hill (5)
Broadway (6)
Burlingame (7)
California Ave (8)
Capitol (9)
College Park (10)
Diridon (11)
Gilroy (12)
Hayward Park (13)
Hillsdale (14)
Lawrence (15)
Menlo Park (16)
Millbrae (17)
Morgan Hill (18)
Mountain View (19)
Palo Alto (20)
Redwood City (21)
San Antonio (22)
San Bruno (23)
San Carlos (24)
San Francisco (25)
San Jose (26)
San Martin (27)
San Mateo (28)
Santa Clara (29)
South San Francisco (30)
Stanford (31)
Sunnyvale (32)
Tamien (33)
Answer If Which mode of transportation did you use? Caltrain Is Selected
Q131 Specify Caltrain end station
22nd Street (1)
Nelson\Nygaard Consulting Associates Inc. | xlvii
Atherton (2)
Bayshore (3)
Belmont (4)
Blossom Hill (5)
Broadway (6)
Burlingame (7)
California Ave (8)
Capitol (9)
College Park (10)
Diridon (11)
Gilroy (12)
Hayward Park (13)
Hillsdale (14)
Lawrence (15)
Menlo Park (16)
Millbrae (17)
Morgan Hill (18)
Mountain View (19)
Palo Alto (20)
Redwood City (21)
San Antonio (22)
San Bruno (23)
San Carlos (24)
San Francisco (25)
San Jose (26)
San Martin (27)
San Mateo (28)
Santa Clara (29)
South San Francisco (30)
Stanford (31)
Sunnyvale (32)
Tamien (33)
Nelson\Nygaard Consulting Associates Inc. | xlviii
Answer If Which mode of transportation did you use? Other bus provider than Muni (e.g. AC
Transit/Golden Gate Transit/SamTrans) Is Selected
Q132 Please estimate (in miles) the distance you traveled for this segment of your trip (for
instance if you traveled 1 1/2 miles, enter 1.5)
Answer If Which mode of transportation did you use? Carpool/Vanpool Is Selected
Q133 I was the:
Passenger (1)
Driver (2)
Answer If Which mode of transportation did you use? Carpool/Vanpool Is Selected
Q134 Number of people in the carpool/vanpool on Wednesday April, 6, 2016:
2 (2)
3 (3)
4 (4)
5 (5)
6 (6)
7 (7)
More than 7 (8)
Answer If On your trip to SF State's main campus, what was your fourth mode of transportation?
(If your las... Private vehicle (cars, carpool, motorcycle, etc.) Is Selected
Q135 Please estimate (in miles) the distance you traveled for this segment of your trip (for
instance if you traveled 1 1/2 miles, enter 1.5)
Answer If On your trip to SF State's main campus, what was your fourth mode of transportation?
(If your las... Taxi, Uber, Lyft, or other on-demand taxi or real-time ridesharing services known as
TNCs Is Selected
Q136 Please estimate (in miles) the distance you traveled for this segment of your trip (for
instance if you traveled 1 1/2 miles, enter 1.5)
Answer If Select your first mode of transportation: Private vehicle (cars, carpool, motorcycle,
etc.) Is Selected Or On your trip to SF State's main campus, what was your third mode of
transportation? (If your prev... Private vehicle (cars, carpool, motorcycle, etc.) Is Selected Or On
your trip to SF State's main campus, what was your fourth mode of transportation? (If your pre...
Private vehicle (cars, carpool, motorcycle, etc.) Is Selected Or On your trip to SF State's main

Nelson\Nygaard Consulting Associates Inc. | xlix
campus, what was your second mode of transportation? (If your pre... Private vehicle (cars,
carpool, motorcycle, etc.) Is Selected
q9 Did you park on the street or in a parking lot / garage?
Parking lot / garage (1)
On the street (2)
I did not drive today. (3)
Answer If Did you park on the street or in a parking lot / garage? Parking lot / garage Is Selected
Or Did you park on the street or in a parking lot / garage? On the street Is Selected
q10 Where did you park when you came to the main campus on Wednesday, April 6, 2016?
On Campus (1)
Near Campus (2)
Near Daly City BART station (3)
Near another BART station (4)
Park & Ride lot (5)
Other (6) ____________________
?
Answer If Where did you park when you came to the main campus on Wednesday, April 6, 2016?
On Campus Is Selected Or Where did you park when you came to the main campus on
Wednesday, April 6, 2016? Near Campus Is Selected
q11 Please choose a zone where you parked (map below) Enlarge SF State Parking Zones Image
(New window)
A: Lot 25 (1)
B: SF State Parking Structure (2)
C: SF State Campus, aside from Parking Structure or Lot 25 (3)
D: Buckingham Way (4)
E: Stonestown Galleria Parking Lot (5)
F: Winston Drive (6)
G: Lake Shore / Merced Manor (South of Eucalyptus) (20)
H: Lake Merced Boulevard (8)
I: Holloway Avenue or Font Boulevard (9)
J: 19th Avenue (10)
K: Lakeside (11)
L: Junipero Serra Boulevard (12)
Nelson\Nygaard Consulting Associates Inc. | l
M: Ingleside Terraces / Ingleside / Oceanview / Merced Heights (13)
N: Lakeshore / Merced Manor (North of Eucalyptus) (14)
O: North of Sloat Boulevard (15)
P: Parkmerced (16)
Q: Lake Merced Hill (17)
R: Oceanview / Merced Heights (18)
S: University Park South (19)
?
Answer If Where did you park when you came to the main campus on Wednesday, April 6, 2016?
On Campus Is Selected Or Where did you park when you came to the main campus on
Wednesday, April 6, 2016? Near Campus Is Selected
q12 How much did it cost you to park on Wednesday, April 6, 2016?
Free (1)
Less than $1 (2)
$1-$2 (3)
$2-$4 (4)
$4-$7 (5)
$7-$10 (6)
More than $10 (7)
I have a SF State Semester / Yearly Parking Pass (8)
?
q12a1 Which of the following programs, if any, would encourage you to commute to campus via a
mode of travel other than driving alone?Please rank your first, second, and third choices.First
choice:
Rideshare or carpool with someone who lives near me (1)
Reduced transit fare pass for MUNI and BART (2)
Emergency guaranteed ride home program (3)
Improved bicycle amenities (4)
Improved pedestrian amenities (5)
Improved shuttle service from BART to the university (6)
None (7)
Nelson\Nygaard Consulting Associates Inc. | li
q12a2 Second choice:
Rideshare or carpool with someone who lives near me (1)
Reduced transit fare pass for MUNI and BART (2)
Emergency guaranteed ride home program (3)
Improved bicycle amenities (4)
Improved pedestrian amenities (5)
Improved shuttle service from BART to the university (6)
None (7)
q12a3 Third choice:
Rideshare or carpool with someone who lives near me (1)
Reduced transit fare pass for MUNI and BART (2)
Emergency guaranteed ride home program (3)
Improved bicycle amenities (4)
Improved pedestrian amenities (5)
Improved shuttle service from BART to the university (6)
None (7)
Q155 Your Trip from Campus The following questions are about your trip from the main campus
at 1600 Holloway. You will be asked to describe your commute away from campus by indicating
the mode of transportation used for each segment of your trip.For example, your trip might have
only one segment if you drove, walked, or biked directly from campus. Or, it might have three
segments if you 1) took the shuttle to BART, 2) took BART to the East Bay and 3) walked
home.Please describe your trip from campus on Wednesday, April 6, 2016. If you took more than
one mode/ have multiple segments, please start the survey by selecting your first segment.
Q279 For your trip from the main campus, what time did you depart from the main
campus?Please enter time in the following format: HH:MM AM
HH (1)
MM (2)
AM/PM (3)
Q156 Did you use the exact same means of transportation when you left the campus on
Wednesday, April 6, 2016 as you did when coming to campus? If any segment of your trip from
campus was different from your trip to campus, please select No.
Yes (1)
Nelson\Nygaard Consulting Associates Inc. | lii
No (2)
If Yes Is Selected, Then Skip To End of Block
Q277 For your trip from the main campus, where did you end your trip?
Zipcode (1)
Q280 Select the mode of transportation for your first segment:If your next segment is via BART,
please use this question to tell us how you got from campus to the BART station.
Walk, bike, or other active transport (1)
Public transportation / shuttle (2)
Private vehicle (cars, carpool, motorcycle, etc.) (3)
Taxi, Uber, Lyft, or other on-demand taxi or real-time ride-sharing services known as
TNCs (4)
Q281 Which mode of transportation did you use?
If Select your first mode of transportation: (If your next segment is via BART please use this
ques... Walk, bike, or other active transport Is Selected
Walk (1)
If Select your first mode of transportation: (If your next segment is via BART please use this
ques... Walk, bike, or other active transport Is Selected
Bicycle (2)
If Select your first mode of transportation: (If your next segment is via BART please use this
ques... Walk, bike, or other active transport Is Selected
Other (3)
If Select your first mode of transportation: (If your next segment is via BART please use this
ques... Public transportation / shuttle Is Selected
Muni (4)
If Select your first mode of transportation: (If your next segment is via BART please use this
ques... Public transportation / shuttle Is Selected
BART (5)
If Select your first mode of transportation: (If your next segment is via BART please use this
ques... Public transportation / shuttle Is Selected
SF State Shuttle (6)
If Select your first mode of transportation: (If your next segment is via BART please use this
ques... Public transportation / shuttle Is Selected
Caltrain (7)

Nelson\Nygaard Consulting Associates Inc. | liii
If Select your first mode of transportation: (If your next segment is via BART please use this
ques... Public transportation / shuttle Is Selected
Other bus provider than Muni (e.g. AC Transit/Golden Gate Transit/SamTrans) (8)
If Select your first mode of transportation: (If your next segment is via BART please use this
ques... Private vehicle (cars, carpool, motorcycle, etc.) Is Selected
Drove Alone (9)
If Select your first mode of transportation: (If your next segment is via BART please use this
ques... Private vehicle (cars, carpool, motorcycle, etc.) Is Selected
Dropped Off / Picked Up (10)
If Select your first mode of transportation: (If your next segment is via BART please use this
ques... Private vehicle (cars, carpool, motorcycle, etc.) Is Selected
Motorcycle/Moped (11)
If Select your first mode of transportation: (If your next segment is via BART please use this
ques... Private vehicle (cars, carpool, motorcycle, etc.) Is Selected
Carpool/Vanpool (12)
If Select your first mode of transportation: (If your next segment is via BART please use this
ques... Taxi, Uber, Lyft, or other on-demand taxi or real-time ride-sharing services known as
TNCs Is Selected
Taxi (19)
If Select your first mode of transportation: (If your next segment is via BART please use this
ques... Taxi, Uber, Lyft, or other on-demand taxi or real-time ride-sharing services known as
TNCs Is Selected
Uber (20)
If Select your first mode of transportation: (If your next segment is via BART please use this
ques... Taxi, Uber, Lyft, or other on-demand taxi or real-time ride-sharing services known as
TNCs Is Selected
Lyft (21)
If Select your first mode of transportation: (If your next segment is via BART please use this
ques... Taxi, Uber, Lyft, or other on-demand taxi or real-time ride-sharing services known as
TNCs Is Selected
Other TNC (22)
Answer If Which mode of transportation did you use? Walk Is Selected Or Which mode of
transportation did you use? Bicycle Is Selected Or Which mode of transportation did you use?
Other Is Selected
Q282 Please estimate (in miles) the distance you traveled for this segment of your trip (for
instance if you traveled 1 1/2 miles, enter 1.5)

Nelson\Nygaard Consulting Associates Inc. | liv
Answer If Which mode of transportation did you use? Muni Is Selected
Q208 Specify Muni Line
1-California (1)
1AX-California 'A' Express (2)
1BX-California 'B' Express (3)
2-Clement (4)
3-Jackson (5)
5-Fulton (7)
5R-Fulton Rapid (98)
6-Haight-Parnassus (8)
7-Haight-Noriega (61)
7R-Haight-Noriega Rapid (62)
7X-Noriega Express (75)
8AX Bayshore 'A' Express (90)
8BX Bayshore 'B' Express (91)
8-Bayshore (92)
9-San Bruno (10)
9R-San Bruno Rapid (93)
10-Townsend (14)
12-Folsom/Pacific (15)
14-Mission (16)
14R-Mission Rapid (17)
14X-Mission Express (18)
18-46th Avenue (94)
19-Polk (23)
21-Hayes (25)
22-Fillmore (26)
23-Monterey (27)
24-Divisadero (28)
25-Treasure Island (76)
27-Bryant (30)
28-19th Avenue (77)
28R-19th Avenue Rapid (32)

Nelson\Nygaard Consulting Associates Inc. | lv
29-Sunset (78)
30-Stockton (30)
30X-Marina Express (35)
31-Balboa (36)
31AX-Balboa 'A' Express (37)
31BX-Balboa 'B' Express (38)
33-Ashbury-18th (39)
35-Eureka (40)
36-Teresita (41)
37-Corbett (42)
38-Geary (43)
38AX-Geary 'A' Express (44)
38BX-Geary 'B' Express (45)
38R-Geary Rapid (46)
39-Coit Tower (47)
41-Union (48)
43-Masonic (49)
44-O'Shaughnessy (50)
45-Union-Stockton (51)
47-Van Ness (52)
48-24th Street (53)
49-Van Ness-Mission (54)
52-Excelsior (55)
54-Felton (57)
55-16th Street (101)
56-Rutland (58)
57-Parkmerced (12)
66-Quintara (59)
67-Bernal Heights (60)
76X-Marin Headlands Express (63)
81X-Caltrain Express (65)
82X-Levi Plaza Express (66)
83X-Mid-Market Express (99)
Nelson\Nygaard Consulting Associates Inc. | lvi
88-BART Shuttle (67)
90-San Bruno Owl (69)
91-Owl (70)
108-Treasure Island (73)
F-Market & Wharves (79)
J-Church (80)
KT-Ingleside/Third Street (100)
L-Taraval (82)
M-Ocean View (74)
N-Judah (84)
California-Cable Car (87)
Powell-Hyde-Cable Car (88)
Powell-Mason-Cable Car (89)
Answer If Which mode of transportation did you use? Muni Is Selected
Q284 Please estimate (in miles) the distance you traveled in this segment of your trip (for
instance if you traveled 1 1/2 miles, enter 1.5)
Answer If Which mode of transportation did you use? BART Is Selected
Q285 Specify BART start station
12th St. Oakland City Center (1)
16th St. Mission (2)
19th St. Oakland (3)
24th St. Mission (4)
Ashby (5)
Balboa Park (6)
Bay Fair (7)
Castro Valley (8)
Civic Center (9)
Coliseum/Oakland Airport (10)
Colma (11)
Concord (12)
Daly City (13)
Nelson\Nygaard Consulting Associates Inc. | lvii
Downtown Berkeley (14)
Dublin/Pleasanton (15)
El Cerrito del Norte (16)
El Cerrito Plaza (17)
Embarcadero (18)
Fremont (19)
Fruitvale (20)
Glen Park (21)
Hayward (22)
Lafayette (23)
Lake Merritt (24)
MacArthur (25)
Millbrae (26)
Montgomery St. (27)
North Berkeley (28)
North Concord/Martinez (29)
Orinda (30)
Pittsburg/Bay Point (31)
Pleasant Hill/Contra Costa Centre (32)
Powell St. (33)
Richmond (34)
Rockridge (35)
San Bruno (36)
San Francisco Int'l Airport (37)
San Leandro (38)
South Hayward (39)
South San Francisco (40)
Union City (41)
Walnut Creek (42)
West Dublin/Pleasanton (44)
West Oakland (43)
Answer If Which mode of transportation did you use? BART Is Selected

Nelson\Nygaard Consulting Associates Inc. | lviii
Q286 Specify BART end station
12th St. Oakland City Center (1)
16th St. Mission (2)
19th St. Oakland (3)
24th St. Mission (4)
Ashby (5)
Balboa Park (6)
Bay Fair (7)
Castro Valley (8)
Civic Center (9)
Coliseum/Oakland Airport (10)
Colma (11)
Concord (12)
Daly City (13)
Downtown Berkeley (14)
Dublin/Pleasanton (15)
El Cerrito del Norte (16)
El Cerrito Plaza (17)
Embarcadero (18)
Fremont (19)
Fruitvale (20)
Glen Park (21)
Hayward (22)
Lafayette (23)
Lake Merritt (24)
MacArthur (25)
Millbrae (26)
Montgomery St. (27)
North Berkeley (28)
North Concord/Martinez (29)
Orinda (30)
Pittsburg/Bay Point (31)
Pleasant Hill/Contra Costa Centre (32)

Nelson\Nygaard Consulting Associates Inc. | lix
Powell St. (33)
Richmond (34)
Rockridge (35)
San Bruno (36)
San Francisco Int'l Airport (37)
San Leandro (38)
South Hayward (39)
South San Francisco (40)
Union City (41)
Walnut Creek (42)
West Dublin/Pleasanton (44)
West Oakland (43)
Answer If Which mode of transportation did you use? Caltrain Is Selected
Q287 Specify Caltrain start station
22nd Street (1)
Atherton (2)
Bayshore (3)
Belmont (4)
Blossom Hill (5)
Broadway (6)
Burlingame (7)
California Ave (8)
Capitol (9)
College Park (10)
Diridon (11)
Gilroy (12)
Hayward Park (13)
Hillsdale (14)
Lawrence (15)
Menlo Park (16)
Millbrae (17)
Morgan Hill (18)

Nelson\Nygaard Consulting Associates Inc. | lx
Mountain View (19)
Palo Alto (20)
Redwood City (21)
San Antonio (22)
San Bruno (23)
San Carlos (24)
San Francisco (25)
San Jose (26)
San Martin (27)
San Mateo (28)
Santa Clara (29)
South San Francisco (30)
Stanford (31)
Sunnyvale (32)
Tamien (33)
Answer If Which mode of transportation did you use? Caltrain Is Selected
Q288 Specify Caltrain end station
22nd Street (1)
Atherton (2)
Bayshore (3)
Belmont (4)
Blossom Hill (5)
Broadway (6)
Burlingame (7)
California Ave (8)
Capitol (9)
College Park (10)
Diridon (11)
Gilroy (12)
Hayward Park (13)
Hillsdale (14)
Lawrence (15)

Nelson\Nygaard Consulting Associates Inc. | lxi
Menlo Park (16)
Millbrae (17)
Morgan Hill (18)
Mountain View (19)
Palo Alto (20)
Redwood City (21)
San Antonio (22)
San Bruno (23)
San Carlos (24)
San Francisco (25)
San Jose (26)
San Martin (27)
San Mateo (28)
Santa Clara (29)
South San Francisco (30)
Stanford (31)
Sunnyvale (32)
Tamien (33)
Answer If Which mode of transportation did you use? Other bus provider than Muni (e.g. AC
Transit/Golden Gate Transit/SamTrans) Is Selected
Q289 Please estimate (in miles) the distance you traveled for this segment of your trip (for
instance if you traveled 1 1/2 miles, enter 1.5)
Answer If Which mode of transportation did you use? Carpool/Vanpool Is Selected
Q290 I was the:
Passenger (1)
Driver (2)
Answer If Which mode of transportation did you use? Carpool/Vanpool Is Selected
Q291 Number of people in the carpool/vanpool on Wednesday, April, 6, 2016:
2 (2)
3 (3)
4 (4)
Nelson\Nygaard Consulting Associates Inc. | lxii
5 (5)
6 (6)
7 (7)
More than 7 (8)
Answer If Select your first mode of transportation: (If your next segment is via BART please use
this ques... Private vehicle (cars, carpool, motorcycle, etc.) Is Selected
Q292 Please estimate (in miles) the distance you traveled for this segment of your trip (for
instance if you traveled 1 1/2 miles, enter 1.5)
Answer If Select your first mode of transportation: Taxi or TNC (Uber, Lyft, etc.) Is Selected
Q293 Please estimate (in miles) the distance you traveled for this segment of your trip (for
instance if you traveled 1 1/2 miles, enter 1.5)
Q296 On your trip from SF State's main campus, what was the mode of transportation for your
second segment? If your next segment is via BART, please use this question to tell us how you got
from campus to the BART station.
Walk, bike, or other active transport (1)
Public transportation / shuttle (2)
Private vehicle (cars, carpool, motorcycle, etc.) (3)
Taxi, Uber, Lyft, or other on-demand taxi or real-time ride-sharing services known as
TNCs (4)
None (5)
If None Is Selected, Then Skip To End of Block
Q297 Which mode of transportation did you use?
If On your trip from SF State's main campus, what was your second mode of transportation? (If
your l... Walk, bike, or other active transport Is Selected
Walk (1)
If On your trip from SF State's main campus, what was your second mode of transportation? (If
your l... Walk, bike, or other active transport Is Selected
Bicycle (2)
If On your trip from SF State's main campus, what was your second mode of transportation? (If
your l... Walk, bike, or other active transport Is Selected
Other (3)
Nelson\Nygaard Consulting Associates Inc. | lxiii
If On your trip from SF State's main campus, what was your second mode of transportation? (If
your l... Public transportation / shuttle Is Selected
Muni (4)
If On your trip from SF State's main campus, what was your second mode of transportation? (If
your l... Public transportation / shuttle Is Selected
BART (5)
If Select your first mode of transportation: (If your next segment is via BART please use this
ques... Public transportation / shuttle Is Selected
SF State Shuttle (6)
If On your trip from SF State's main campus, what was your second mode of transportation? (If
your l... Public transportation / shuttle Is Selected
Caltrain (7)
If On your trip from SF State's main campus, what was your second mode of transportation? (If
your l... Public transportation / shuttle Is Selected
Other bus provider than Muni (e.g. AC Transit/Golden Gate Transit/SamTrans) (8)
If On your trip from SF State's main campus, what was your second mode of transportation? (If
your l... Private vehicle (cars, carpool, motorcycle, etc.) Is Selected
Drove Alone (9)
If On your trip from SF State's main campus, what was your second mode of transportation? (If
your l... Private vehicle (cars, carpool, motorcycle, etc.) Is Selected
Dropped Off / Picked Up (10)
If On your trip from SF State's main campus, what was your second mode of transportation? (If
your l... Private vehicle (cars, carpool, motorcycle, etc.) Is Selected
Motorcycle/Moped (11)
If On your trip from SF State's main campus, what was your second mode of transportation? (If
your l... Private vehicle (cars, carpool, motorcycle, etc.) Is Selected
Carpool/Vanpool (12)
If On your trip from SF State's main campus, what was your second mode of transportation? (If
your l... Taxi, Uber, Lyft, or other on-demand taxi or real-time ride-sharing services known as
TNCs Is Selected
Taxi (19)
If On your trip from SF State's main campus, what was your second mode of transportation? (If
your l... Taxi, Uber, Lyft, or other on-demand taxi or real-time ride-sharing services known as
TNCs Is Selected
Uber (20)
If On your trip from SF State's main campus, what was your second mode of transportation? (If
your l... Taxi, Uber, Lyft, or other on-demand taxi or real-time ride-sharing services known as
TNCs Is Selected
Nelson\Nygaard Consulting Associates Inc. | lxiv
Lyft (21)
If On your trip from SF State's main campus, what was your second mode of transportation? (If
your l... Taxi, Uber, Lyft, or other on-demand taxi or real-time ride-sharing services known as
TNCs Is Selected
Other TNC (22)
Answer If Which mode of ${q://QID296/ChoiceGroup/SelectedChoices} did you use? Walk Is
Selected Or Which mode of ${q://QID296/ChoiceGroup/SelectedChoices} did you use? Bicycle Is
Selected Or Which mode of ${q://QID296/ChoiceGroup/SelectedChoices} did you use? Other Is
Selected
Q298 Please estimate (in miles) the distance you traveled for this segment of your trip (for
instance if you traveled 1 1/2 miles, enter 1.5)
Answer If Which mode of transportation did you use? Muni Is Selected
Q209 Specify Muni Line
1-California (1)
1AX-California 'A' Express (2)
1BX-California 'B' Express (3)
2-Clement (4)
3-Jackson (5)
5-Fulton (7)
5R-Fulton Rapid (98)
6-Haight-Parnassus (8)
7-Haight-Noriega (61)
7R-Haight-Noriega Rapid (62)
7X-Noriega Express (75)
8AX Bayshore 'A' Express (90)
8BX Bayshore 'B' Express (91)
8-Bayshore (92)
9-San Bruno (10)
9R-San Bruno Rapid (93)
10-Townsend (14)
12-Folsom/Pacific (15)
14-Mission (16)
14R-Mission Rapid (17)
Nelson\Nygaard Consulting Associates Inc. | lxv
14X-Mission Express (18)
18-46th Avenue (94)
19-Polk (23)
21-Hayes (25)
22-Fillmore (26)
23-Monterey (27)
24-Divisadero (28)
25-Treasure Island (76)
27-Bryant (30)
28-19th Avenue (77)
28R-19th Avenue Rapid (32)
29-Sunset (78)
30-Stockton (30)
30X-Marina Express (35)
31-Balboa (36)
31AX-Balboa 'A' Express (37)
31BX-Balboa 'B' Express (38)
33-Ashbury-18th (39)
35-Eureka (40)
36-Teresita (41)
37-Corbett (42)
38-Geary (43)
38AX-Geary 'A' Express (44)
38BX-Geary 'B' Express (45)
38R-Geary Rapid (46)
39-Coit Tower (47)
41-Union (48)
43-Masonic (49)
44-O'Shaughnessy (50)
45-Union-Stockton (51)
47-Van Ness (52)
48-24th Street (53)
49-Van Ness-Mission (54)

Nelson\Nygaard Consulting Associates Inc. | lxvi
52-Excelsior (55)
54-Felton (57)
55-16th Street (101)
56-Rutland (58)
57-Parkmerced (12)
66-Quintara (59)
67-Bernal Heights (60)
76X-Marin Headlands Express (63)
81X-Caltrain Express (65)
82X-Levi Plaza Express (66)
83X-Mid-Market Express (99)
88-BART Shuttle (67)
90-San Bruno Owl (69)
91-Owl (70)
108-Treasure Island (73)
F-Market & Wharves (79)
J-Church (80)
KT-Ingleside/Third Street (100)
L-Taraval (82)
M-Ocean View (74)
N-Judah (84)
California-Cable Car (87)
Powell-Hyde-Cable Car (88)
Powell-Mason-Cable Car (89)
Answer If Which mode of ${q://QID296/ChoiceGroup/SelectedChoices} did you use? Muni Is
Selected
Q300 Please estimate (in miles) the distance you traveled in this segment of your trip (for
instance if you traveled 1 1/2 miles, enter 1.5)
Answer If Which mode of ${q://QID296/ChoiceGroup/SelectedChoices} did you use? BART Is
Selected
Q301 Specify BART start station
12th St. Oakland City Center (1)
Nelson\Nygaard Consulting Associates Inc. | lxvii
16th St. Mission (2)
19th St. Oakland (3)
24th St. Mission (4)
Ashby (5)
Balboa Park (6)
Bay Fair (7)
Castro Valley (8)
Civic Center (9)
Coliseum/Oakland Airport (10)
Colma (11)
Concord (12)
Daly City (13)
Downtown Berkeley (14)
Dublin/Pleasanton (15)
El Cerrito del Norte (16)
El Cerrito Plaza (17)
Embarcadero (18)
Fremont (19)
Fruitvale (20)
Glen Park (21)
Hayward (22)
Lafayette (23)
Lake Merritt (24)
MacArthur (25)
Millbrae (26)
Montgomery St. (27)
North Berkeley (28)
North Concord/Martinez (29)
Orinda (30)
Pittsburg/Bay Point (31)
Pleasant Hill/Contra Costa Centre (32)
Powell St. (33)
Richmond (34)
Nelson\Nygaard Consulting Associates Inc. | lxviii
Rockridge (35)
San Bruno (36)
San Francisco Int'l Airport (37)
San Leandro (38)
South Hayward (39)
South San Francisco (40)
Union City (41)
Walnut Creek (42)
West Dublin/Pleasanton (44)
West Oakland (43)
Answer If Which mode of ${q://QID296/ChoiceGroup/SelectedChoices} did you use? BART Is
Selected
Q302 Specify BART end station
12th St. Oakland City Center (1)
16th St. Mission (2)
19th St. Oakland (3)
24th St. Mission (4)
Ashby (5)
Balboa Park (6)
Bay Fair (7)
Castro Valley (8)
Civic Center (9)
Coliseum/Oakland Airport (10)
Colma (11)
Concord (12)
Daly City (13)
Downtown Berkeley (14)
Dublin/Pleasanton (15)
El Cerrito del Norte (16)
El Cerrito Plaza (17)
Embarcadero (18)
Fremont (19)
Nelson\Nygaard Consulting Associates Inc. | lxix
Fruitvale (20)
Glen Park (21)
Hayward (22)
Lafayette (23)
Lake Merritt (24)
MacArthur (25)
Millbrae (26)
Montgomery St. (27)
North Berkeley (28)
North Concord/Martinez (29)
Orinda (30)
Pittsburg/Bay Point (31)
Pleasant Hill/Contra Costa Centre (32)
Powell St. (33)
Richmond (34)
Rockridge (35)
San Bruno (36)
San Francisco Int'l Airport (37)
San Leandro (38)
South Hayward (39)
South San Francisco (40)
Union City (41)
Walnut Creek (42)
West Dublin/Pleasanton (44)
West Oakland (43)
Answer If Which mode of ${q://QID296/ChoiceGroup/SelectedChoices} did you use? Caltrain Is
Selected
Q303 Specify Caltrain start station
22nd Street (1)
Atherton (2)
Bayshore (3)
Belmont (4)
Nelson\Nygaard Consulting Associates Inc. | lxx
Blossom Hill (5)
Broadway (6)
Burlingame (7)
California Ave (8)
Capitol (9)
College Park (10)
Diridon (11)
Gilroy (12)
Hayward Park (13)
Hillsdale (14)
Lawrence (15)
Menlo Park (16)
Millbrae (17)
Morgan Hill (18)
Mountain View (19)
Palo Alto (20)
Redwood City (21)
San Antonio (22)
San Bruno (23)
San Carlos (24)
San Francisco (25)
San Jose (26)
San Martin (27)
San Mateo (28)
Santa Clara (29)
South San Francisco (30)
Stanford (31)
Sunnyvale (32)
Tamien (33)
Answer If Which mode of ${q://QID296/ChoiceGroup/SelectedChoices} did you use? Caltrain Is
Selected
Q304 Specify Caltrain end station

Nelson\Nygaard Consulting Associates Inc. | lxxi
22nd Street (1)
Atherton (2)
Bayshore (3)
Belmont (4)
Blossom Hill (5)
Broadway (6)
Burlingame (7)
California Ave (8)
Capitol (9)
College Park (10)
Diridon (11)
Gilroy (12)
Hayward Park (13)
Hillsdale (14)
Lawrence (15)
Menlo Park (16)
Millbrae (17)
Morgan Hill (18)
Mountain View (19)
Palo Alto (20)
Redwood City (21)
San Antonio (22)
San Bruno (23)
San Carlos (24)
San Francisco (25)
San Jose (26)
San Martin (27)
San Mateo (28)
Santa Clara (29)
South San Francisco (30)
Stanford (31)
Sunnyvale (32)
Tamien (33)
Nelson\Nygaard Consulting Associates Inc. | lxxii
Answer If Which mode of ${q://QID296/ChoiceGroup/SelectedChoices} did you use? Other bus
provider than Muni (e.g. AC Transit/Golden Gate Transit/SamTrans) Is Selected
Q305 Please estimate (in miles) the distance you traveled for this segment of your trip (for
instance if you traveled 1 1/2 miles, enter 1.5)
Answer If Which mode of ${q://QID296/ChoiceGroup/SelectedChoices} did you use?
Carpool/Vanpool Is Selected
Q306 I was the:
Passenger (1)
Driver (2)
Answer If Which mode of ${q://QID296/ChoiceGroup/SelectedChoices} did you use?
Carpool/Vanpool Is Selected
Q307 Number of people in the carpool/vanpool on Wednesday, April, 6, 2016:
2 (2)
3 (3)
4 (4)
5 (5)
6 (6)
7 (7)
More than 7 (8)
Answer If On your trip from SF State's main campus, what was your second mode of
transportation? (If your l... Private vehicle (cars, carpool, motorcycle, etc.) Is Selected
Q308 Please estimate (in miles) the distance you traveled for this segment of your trip (for
instance if you traveled 1 1/2 miles, enter 1.5)
Answer If On your trip from SF State's main campus, what was your second mode of
transportation? (If your l... Taxi, Uber, Lyft, or other on-demand taxi or real-time ridesharing
services known as TNCs Is Selected
Q309 Please estimate (in miles) the distance you traveled for this segment of your trip (for
instance if you traveled 1 1/2 miles, enter 1.5)
Nelson\Nygaard Consulting Associates Inc. | lxxiii
Q310 On your trip from SF State's main campus, what was the mode of transportation for your
third segment?If your next segment is via BART, please use this question to tell us how you got
from campus to the BART station.
Walk, bike, or other active transport (1)
Public transportation / shuttle (2)
Private vehicle (cars, carpool, motorcycle, etc.) (3)
Taxi, Uber, Lyft, or other on-demand taxi or real-time ride-sharing services known as
TNCs (4)
None (5)
If None Is Selected, Then Skip To End of Block
Q311 Which mode of transportation did you use?
If On your trip from SF State's main campus, what was your third mode of transportation? (If
your la... Walk, bike, or other active transport Is Selected
Walk (1)
If On your trip from SF State's main campus, what was your third mode of transportation? (If
your la... Walk, bike, or other active transport Is Selected
Bicycle (2)
If On your trip from SF State's main campus, what was your third mode of transportation? (If
your la... Walk, bike, or other active transport Is Selected
Other (3)
If On your trip from SF State's main campus, what was your third mode of transportation? (If
your la... Public transportation / shuttle Is Selected
Muni (4)
If On your trip from SF State's main campus, what was your third mode of transportation? (If
your la... Public transportation / shuttle Is Selected
BART (5)
If On your trip from SF State's main campus, what was your third mode of transportation? (If
your la... Public transportation / shuttle Is Selected
SF State Shuttle (6)
If On your trip from SF State's main campus, what was your third mode of transportation? (If
your la... Public transportation / shuttle Is Selected
Caltrain (7)
If On your trip from SF State's main campus, what was your third mode of transportation? (If
your la... Public transportation / shuttle Is Selected
Other bus provider than Muni (e.g. AC Transit/Golden Gate Transit/SamTrans) (8)
Nelson\Nygaard Consulting Associates Inc. | lxxiv
If On your trip from SF State's main campus, what was your third mode of transportation? (If
your la... Private vehicle (cars, carpool, motorcycle, etc.) Is Selected
Drove Alone (9)
If On your trip from SF State's main campus, what was your third mode of transportation? (If
your la... Private vehicle (cars, carpool, motorcycle, etc.) Is Selected
Dropped Off / Picked Up (10)
If On your trip from SF State's main campus, what was your third mode of transportation? (If
your la... Private vehicle (cars, carpool, motorcycle, etc.) Is Selected
Motorcycle/Moped (11)
If On your trip from SF State's main campus, what was your third mode of transportation? (If
your la... Private vehicle (cars, carpool, motorcycle, etc.) Is Selected
Carpool/Vanpool (12)
If On your trip from SF State's main campus, what was your third mode of transportation? (If
your la... Taxi, Uber, Lyft, or other on-demand taxi or real-time ride-sharing services known as
TNCs Is Selected
Taxi (19)
If On your trip from SF State's main campus, what was your third mode of transportation? (If
your la... Taxi, Uber, Lyft, or other on-demand taxi or real-time ride-sharing services known as
TNCs Is Selected
Uber (20)
If On your trip from SF State's main campus, what was your third mode of transportation? (If
your la... Taxi, Uber, Lyft, or other on-demand taxi or real-time ride-sharing services known as
TNCs Is Selected
Lyft (21)
If On your trip from SF State's main campus, what was your third mode of transportation? (If
your la... Taxi, Uber, Lyft, or other on-demand taxi or real-time ride-sharing services known as
TNCs Is Selected
Other on-demand taxi or real-time ride-sharing service (22)
Answer If Which mode of transportation did you use? Walk Is Selected Or Which mode of
transportation did you use? Bicycle Is Selected Or Which mode of transportation did you use?
Other Is Selected
Q312 Please estimate (in miles) the distance you traveled for this segment of your trip (for
instance if you traveled 1 1/2 miles, enter 1.5)
Answer If Which mode of transportation did you use? Muni Is Selected
Q210 Specify Muni Line
1-California (1)
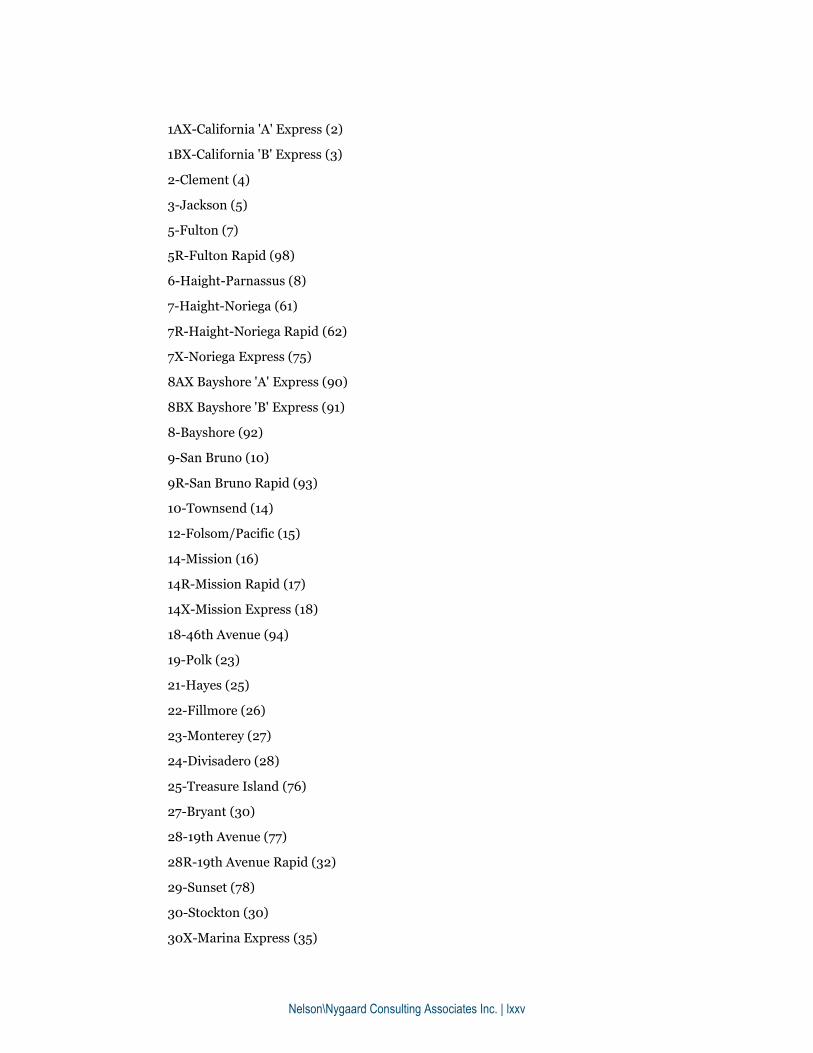
Nelson\Nygaard Consulting Associates Inc. | lxxv
1AX-California 'A' Express (2)
1BX-California 'B' Express (3)
2-Clement (4)
3-Jackson (5)
5-Fulton (7)
5R-Fulton Rapid (98)
6-Haight-Parnassus (8)
7-Haight-Noriega (61)
7R-Haight-Noriega Rapid (62)
7X-Noriega Express (75)
8AX Bayshore 'A' Express (90)
8BX Bayshore 'B' Express (91)
8-Bayshore (92)
9-San Bruno (10)
9R-San Bruno Rapid (93)
10-Townsend (14)
12-Folsom/Pacific (15)
14-Mission (16)
14R-Mission Rapid (17)
14X-Mission Express (18)
18-46th Avenue (94)
19-Polk (23)
21-Hayes (25)
22-Fillmore (26)
23-Monterey (27)
24-Divisadero (28)
25-Treasure Island (76)
27-Bryant (30)
28-19th Avenue (77)
28R-19th Avenue Rapid (32)
29-Sunset (78)
30-Stockton (30)
30X-Marina Express (35)
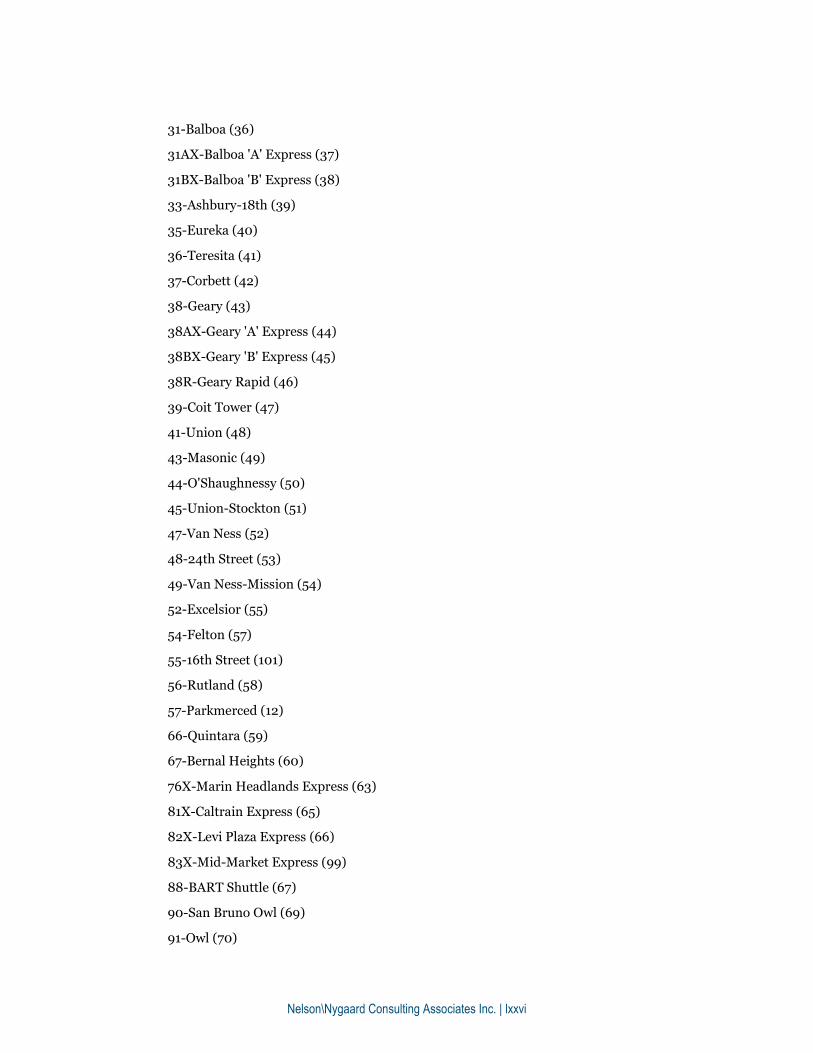
Nelson\Nygaard Consulting Associates Inc. | lxxvi
31-Balboa (36)
31AX-Balboa 'A' Express (37)
31BX-Balboa 'B' Express (38)
33-Ashbury-18th (39)
35-Eureka (40)
36-Teresita (41)
37-Corbett (42)
38-Geary (43)
38AX-Geary 'A' Express (44)
38BX-Geary 'B' Express (45)
38R-Geary Rapid (46)
39-Coit Tower (47)
41-Union (48)
43-Masonic (49)
44-O'Shaughnessy (50)
45-Union-Stockton (51)
47-Van Ness (52)
48-24th Street (53)
49-Van Ness-Mission (54)
52-Excelsior (55)
54-Felton (57)
55-16th Street (101)
56-Rutland (58)
57-Parkmerced (12)
66-Quintara (59)
67-Bernal Heights (60)
76X-Marin Headlands Express (63)
81X-Caltrain Express (65)
82X-Levi Plaza Express (66)
83X-Mid-Market Express (99)
88-BART Shuttle (67)
90-San Bruno Owl (69)
91-Owl (70)

Nelson\Nygaard Consulting Associates Inc. | lxxvii
108-Treasure Island (73)
F-Market & Wharves (79)
J-Church (80)
KT-Ingleside/Third Street (100)
L-Taraval (82)
M-Ocean View (74)
N-Judah (84)
California-Cable Car (87)
Powell-Hyde-Cable Car (88)
Powell-Mason-Cable Car (89)
Answer If Which mode of transportation did you use? Muni Is Selected
Q314 Please estimate (in miles) the distance you traveled in this segment of your trip (for instance
if you traveled 1 1/2 miles, enter 1.5)
Answer If Which mode of transportation did you use? BART Is Selected
Q315 Specify BART start station
12th St. Oakland City Center (1)
16th St. Mission (2)
19th St. Oakland (3)
24th St. Mission (4)
Ashby (5)
Balboa Park (6)
Bay Fair (7)
Castro Valley (8)
Civic Center (9)
Coliseum/Oakland Airport (10)
Colma (11)
Concord (12)
Daly City (13)
Downtown Berkeley (14)
Dublin/Pleasanton (15)
El Cerrito del Norte (16)
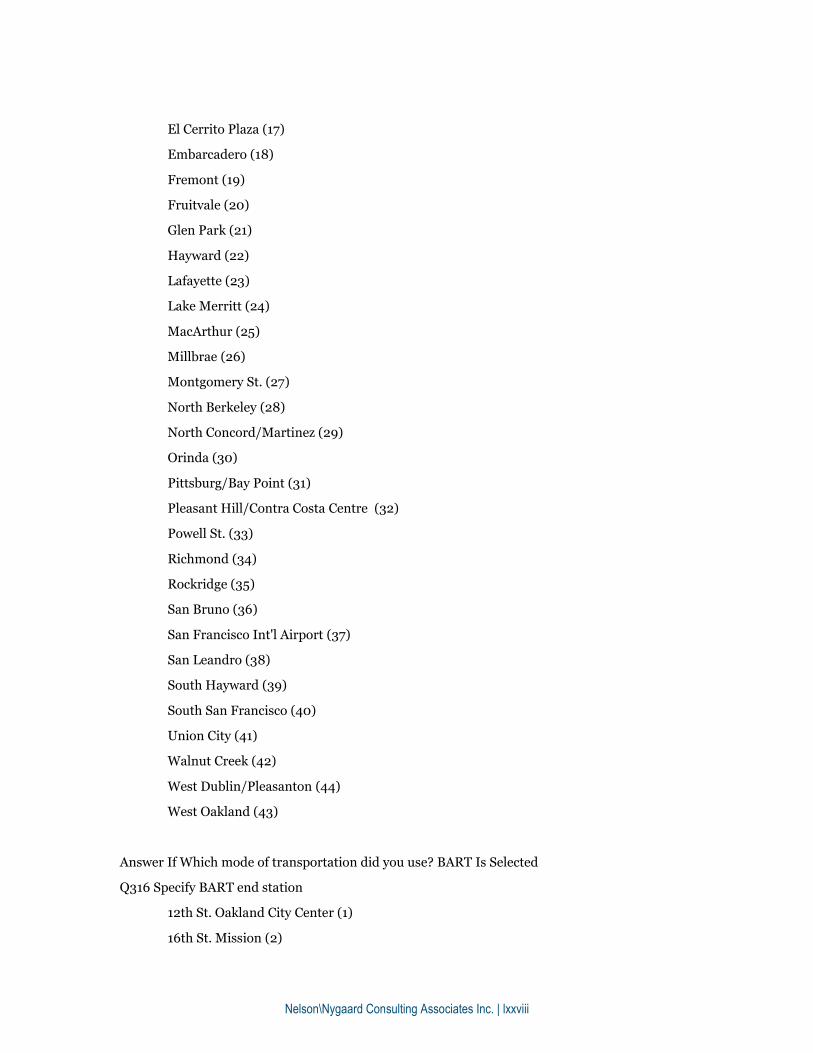
Nelson\Nygaard Consulting Associates Inc. | lxxviii
El Cerrito Plaza (17)
Embarcadero (18)
Fremont (19)
Fruitvale (20)
Glen Park (21)
Hayward (22)
Lafayette (23)
Lake Merritt (24)
MacArthur (25)
Millbrae (26)
Montgomery St. (27)
North Berkeley (28)
North Concord/Martinez (29)
Orinda (30)
Pittsburg/Bay Point (31)
Pleasant Hill/Contra Costa Centre (32)
Powell St. (33)
Richmond (34)
Rockridge (35)
San Bruno (36)
San Francisco Int'l Airport (37)
San Leandro (38)
South Hayward (39)
South San Francisco (40)
Union City (41)
Walnut Creek (42)
West Dublin/Pleasanton (44)
West Oakland (43)
Answer If Which mode of transportation did you use? BART Is Selected
Q316 Specify BART end station
12th St. Oakland City Center (1)
16th St. Mission (2)
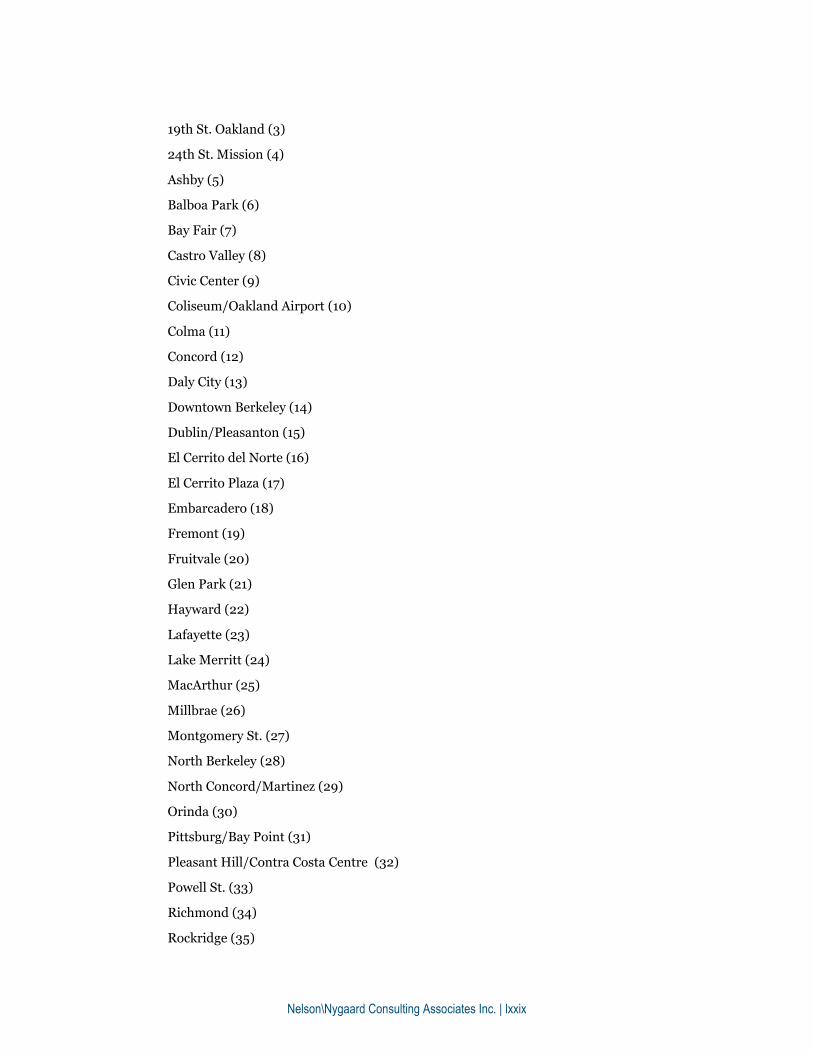
Nelson\Nygaard Consulting Associates Inc. | lxxix
19th St. Oakland (3)
24th St. Mission (4)
Ashby (5)
Balboa Park (6)
Bay Fair (7)
Castro Valley (8)
Civic Center (9)
Coliseum/Oakland Airport (10)
Colma (11)
Concord (12)
Daly City (13)
Downtown Berkeley (14)
Dublin/Pleasanton (15)
El Cerrito del Norte (16)
El Cerrito Plaza (17)
Embarcadero (18)
Fremont (19)
Fruitvale (20)
Glen Park (21)
Hayward (22)
Lafayette (23)
Lake Merritt (24)
MacArthur (25)
Millbrae (26)
Montgomery St. (27)
North Berkeley (28)
North Concord/Martinez (29)
Orinda (30)
Pittsburg/Bay Point (31)
Pleasant Hill/Contra Costa Centre (32)
Powell St. (33)
Richmond (34)
Rockridge (35)
Nelson\Nygaard Consulting Associates Inc. | lxxx
San Bruno (36)
San Francisco Int'l Airport (37)
San Leandro (38)
South Hayward (39)
South San Francisco (40)
Union City (41)
Walnut Creek (42)
West Dublin/Pleasanton (44)
West Oakland (43)
Answer If Which mode of transportation did you use? Caltrain Is Selected
Q317 Specify Caltrain start station
22nd Street (1)
Atherton (2)
Bayshore (3)
Belmont (4)
Blossom Hill (5)
Broadway (6)
Burlingame (7)
California Ave (8)
Capitol (9)
College Park (10)
Diridon (11)
Gilroy (12)
Hayward Park (13)
Hillsdale (14)
Lawrence (15)
Menlo Park (16)
Millbrae (17)
Morgan Hill (18)
Mountain View (19)
Palo Alto (20)
Redwood City (21)

Nelson\Nygaard Consulting Associates Inc. | lxxxi
San Antonio (22)
San Bruno (23)
San Carlos (24)
San Francisco (25)
San Jose (26)
San Martin (27)
San Mateo (28)
Santa Clara (29)
South San Francisco (30)
Stanford (31)
Sunnyvale (32)
Tamien (33)
Answer If Which mode of transportation did you use? Caltrain Is Selected
Q318 Specify Caltrain end station
22nd Street (1)
Atherton (2)
Bayshore (3)
Belmont (4)
Blossom Hill (5)
Broadway (6)
Burlingame (7)
California Ave (8)
Capitol (9)
College Park (10)
Diridon (11)
Gilroy (12)
Hayward Park (13)
Hillsdale (14)
Lawrence (15)
Menlo Park (16)
Millbrae (17)
Morgan Hill (18)
Nelson\Nygaard Consulting Associates Inc. | lxxxii
Mountain View (19)
Palo Alto (20)
Redwood City (21)
San Antonio (22)
San Bruno (23)
San Carlos (24)
San Francisco (25)
San Jose (26)
San Martin (27)
San Mateo (28)
Santa Clara (29)
South San Francisco (30)
Stanford (31)
Sunnyvale (32)
Tamien (33)
Answer If Which mode of transportation did you use? Other bus provider than Muni (e.g. AC
Transit/Golden Gate Transit/SamTrans) Is Selected
Q319 Please estimate (in miles) the distance you traveled for this segment of your trip (for
instance if you traveled 1 1/2 miles, enter 1.5)
Answer If Which mode of transportation did you use? Carpool/Vanpool Is Selected
Q320 I was the:
Passenger (1)
Driver (2)
Answer If Which mode of transportation did you use? Carpool/Vanpool Is Selected
Q321 Number of people in the carpool/vanpool on Wednesday, April, 6, 2016:
2 (2)
3 (3)
4 (4)
5 (5)
6 (6)
7 (7)

Nelson\Nygaard Consulting Associates Inc. | lxxxiii
More than 7 (8)
Answer If On your trip from SF State's main campus, what was your third mode of
transportation? (If your la... Private vehicle (cars, carpool, motorcycle, etc.) Is Selected
Q322 Please estimate (in miles) the distance you traveled for this segment of your trip (for
instance if you traveled 1 1/2 miles, enter 1.5)
Answer If On your trip from SF State's main campus, what was your third mode of
transportation? (If your la... Taxi, Uber, Lyft, or other on-demand taxi or real-time ridesharing
services known as TNCs Is Selected
Q323 Please estimate (in miles) the distance you traveled for this segment of your trip (for
instance if you traveled 1 1/2 miles, enter 1.5)
Q324 On your trip from SF State's main campus, what was the mode of transportation for your
fourth segment? If your next segment is via BART, please use this question to tell us how you got
from campus to the BART station.
Walk, bike, or other active transport (1)
Public transportation / shuttle (2)
Private vehicle (cars, carpool, motorcycle, etc.) (3)
Taxi, Uber, Lyft, or other on-demand taxi or real-time ride-sharing services known as
TNCs (4)
None (5)
If None Is Selected, Then Skip To End of Block
Q325 Which mode of transportation did you use?
If On your trip from SF State's main campus, what was your fourth mode of transportation? (If
your p... Walk, bike, or other active transport Is Selected
Walk (1)
If On your trip from SF State's main campus, what was your fourth mode of transportation? (If
your p... Walk, bike, or other active transport Is Selected
Bicycle (2)
If On your trip from SF State's main campus, what was your fourth mode of transportation? (If
your p... Walk, bike, or other active transport Is Selected
Other (3)
If On your trip from SF State's main campus, what was your fourth mode of transportation? (If
your p... Public transportation / shuttle Is Selected
Muni (4)
Nelson\Nygaard Consulting Associates Inc. | lxxxiv
If On your trip from SF State's main campus, what was your fourth mode of transportation? (If
your p... Public transportation / shuttle Is Selected
BART (5)
If On your trip from SF State's main campus, what was your fourth mode of transportation? (If
your p... Public transportation / shuttle Is Selected
SF State Shuttle (6)
If On your trip from SF State's main campus, what was your fourth mode of transportation? (If
your p... Public transportation / shuttle Is Selected
Caltrain (7)
If On your trip from SF State's main campus, what was your fourth mode of transportation? (If
your p... Public transportation / shuttle Is Selected
Other bus provider than Muni (e.g. AC Transit/Golden Gate Transit/SamTrans) (8)
If On your trip from SF State's main campus, what was your fourth mode of transportation? (If
your p... Private vehicle (cars, carpool, motorcycle, etc.) Is Selected
Drove Alone (9)
If On your trip from SF State's main campus, what was your fourth mode of transportation? (If
your p... Private vehicle (cars, carpool, motorcycle, etc.) Is Selected
Dropped Off / Picked Up (10)
If On your trip from SF State's main campus, what was your fourth mode of transportation? (If
your p... Private vehicle (cars, carpool, motorcycle, etc.) Is Selected
Motorcycle/Moped (11)
If On your trip from SF State's main campus, what was your fourth mode of transportation? (If
your p... Private vehicle (cars, carpool, motorcycle, etc.) Is Selected
Carpool/Vanpool (12)
If On your trip from SF State's main campus, what was your fourth mode of transportation? (If
your p... Taxi, Uber, Lyft, or other on-demand taxi or real-time ride-sharing services known as
TNCs Is Selected
Taxi (19)
If On your trip from SF State's main campus, what was your fourth mode of transportation? (If
your p... Taxi, Uber, Lyft, or other on-demand taxi or real-time ride-sharing services known as
TNCs Is Selected
Uber (20)
If On your trip from SF State's main campus, what was your fourth mode of transportation? (If
your p... Taxi, Uber, Lyft, or other on-demand taxi or real-time ride-sharing services known as
TNCs Is Selected
Lyft (21)

Nelson\Nygaard Consulting Associates Inc. | lxxxv
If On your trip from SF State's main campus, what was your fourth mode of transportation? (If
your p... Taxi, Uber, Lyft, or other on-demand taxi or real-time ride-sharing services known as
TNCs Is Selected
Other on-demand taxi or real-time ride-sharing service (22)
Answer If Which mode of ${q://QID296/ChoiceGroup/SelectedChoices} did you use? Walk Is
Selected Or Which mode of ${q://QID296/ChoiceGroup/SelectedChoices} did you use? Bicycle Is
Selected Or Which mode of ${q://QID296/ChoiceGroup/SelectedChoices} did you use? Other Is
Selected
Q326 Please estimate (in miles) the distance you traveled for this segment of your trip (for
instance if you traveled 1 1/2 miles, enter 1.5)
Answer If Which mode of ${q://QID296/ChoiceGroup/SelectedChoices} did you use? Muni Is
Selected
Q211 Specify Muni Line
1-California (1)
1AX-California 'A' Express (2)
1BX-California 'B' Express (3)
2-Clement (4)
3-Jackson (5)
5-Fulton (7)
5R-Fulton Rapid (98)
6-Haight-Parnassus (8)
7-Haight-Noriega (61)
7R-Haight-Noriega Rapid (62)
7X-Noriega Express (75)
8AX Bayshore 'A' Express (90)
8BX Bayshore 'B' Express (91)
8-Bayshore (92)
9-San Bruno (10)
9R-San Bruno Rapid (93)
10-Townsend (14)
12-Folsom/Pacific (15)
14-Mission (16)
14R-Mission Rapid (17)

Nelson\Nygaard Consulting Associates Inc. | lxxxvi
14X-Mission Express (18)
18-46th Avenue (94)
19-Polk (23)
21-Hayes (25)
22-Fillmore (26)
23-Monterey (27)
24-Divisadero (28)
25-Treasure Island (76)
27-Bryant (30)
28-19th Avenue (77)
28R-19th Avenue Rapid (32)
29-Sunset (78)
30-Stockton (30)
30X-Marina Express (35)
31-Balboa (36)
31AX-Balboa 'A' Express (37)
31BX-Balboa 'B' Express (38)
33-Ashbury-18th (39)
35-Eureka (40)
36-Teresita (41)
37-Corbett (42)
38-Geary (43)
38AX-Geary 'A' Express (44)
38BX-Geary 'B' Express (45)
38R-Geary Rapid (46)
39-Coit Tower (47)
41-Union (48)
43-Masonic (49)
44-O'Shaughnessy (50)
45-Union-Stockton (51)
47-Van Ness (52)
48-24th Street (53)
49-Van Ness-Mission (54)
Nelson\Nygaard Consulting Associates Inc. | lxxxvii
52-Excelsior (55)
54-Felton (57)
55-16th Street (101)
56-Rutland (58)
57-Parkmerced (12)
66-Quintara (59)
67-Bernal Heights (60)
76X-Marin Headlands Express (63)
81X-Caltrain Express (65)
82X-Levi Plaza Express (66)
83X-Mid-Market Express (99)
88-BART Shuttle (67)
90-San Bruno Owl (69)
91-Owl (70)
108-Treasure Island (73)
F-Market & Wharves (79)
J-Church (80)
KT-Ingleside/Third Street (100)
L-Taraval (82)
M-Ocean View (74)
N-Judah (84)
California-Cable Car (87)
Powell-Hyde-Cable Car (88)
Powell-Mason-Cable Car (89)
Answer If Which mode of ${q://QID296/ChoiceGroup/SelectedChoices} did you use? Muni Is
Selected
Q328 Please estimate (in miles) the distance you traveled in this segment of your trip (for
instance if you traveled 1 1/2 miles, enter 1.5)
Answer If Which mode of ${q://QID296/ChoiceGroup/SelectedChoices} did you use? BART Is
Selected
Q329 Specify BART start station
12th St. Oakland City Center (1)

Nelson\Nygaard Consulting Associates Inc. | lxxxviii
16th St. Mission (2)
19th St. Oakland (3)
24th St. Mission (4)
Ashby (5)
Balboa Park (6)
Bay Fair (7)
Castro Valley (8)
Civic Center (9)
Coliseum/Oakland Airport (10)
Colma (11)
Concord (12)
Daly City (13)
Downtown Berkeley (14)
Dublin/Pleasanton (15)
El Cerrito del Norte (16)
El Cerrito Plaza (17)
Embarcadero (18)
Fremont (19)
Fruitvale (20)
Glen Park (21)
Hayward (22)
Lafayette (23)
Lake Merritt (24)
MacArthur (25)
Millbrae (26)
Montgomery St. (27)
North Berkeley (28)
North Concord/Martinez (29)
Orinda (30)
Pittsburg/Bay Point (31)
Pleasant Hill/Contra Costa Centre (32)
Powell St. (33)
Richmond (34)

Nelson\Nygaard Consulting Associates Inc. | lxxxix
Rockridge (35)
San Bruno (36)
San Francisco Int'l Airport (37)
San Leandro (38)
South Hayward (39)
South San Francisco (40)
Union City (41)
Walnut Creek (42)
West Dublin/Pleasanton (44)
West Oakland (43)
Answer If Which mode of ${q://QID296/ChoiceGroup/SelectedChoices} did you use? BART Is
Selected
Q330 Specify BART end station
12th St. Oakland City Center (1)
16th St. Mission (2)
19th St. Oakland (3)
24th St. Mission (4)
Ashby (5)
Balboa Park (6)
Bay Fair (7)
Castro Valley (8)
Civic Center (9)
Coliseum/Oakland Airport (10)
Colma (11)
Concord (12)
Daly City (13)
Downtown Berkeley (14)
Dublin/Pleasanton (15)
El Cerrito del Norte (16)
El Cerrito Plaza (17)
Embarcadero (18)
Fremont (19)

Nelson\Nygaard Consulting Associates Inc. | xc
Fruitvale (20)
Glen Park (21)
Hayward (22)
Lafayette (23)
Lake Merritt (24)
MacArthur (25)
Millbrae (26)
Montgomery St. (27)
North Berkeley (28)
North Concord/Martinez (29)
Orinda (30)
Pittsburg/Bay Point (31)
Pleasant Hill/Contra Costa Centre (32)
Powell St. (33)
Richmond (34)
Rockridge (35)
San Bruno (36)
San Francisco Int'l Airport (37)
San Leandro (38)
South Hayward (39)
South San Francisco (40)
Union City (41)
Walnut Creek (42)
West Dublin/Pleasanton (44)
West Oakland (43)
Answer If Which mode of ${q://QID296/ChoiceGroup/SelectedChoices} did you use? Caltrain Is
Selected
Q331 Specify Caltrain start station
22nd Street (1)
Atherton (2)
Bayshore (3)
Belmont (4)
Nelson\Nygaard Consulting Associates Inc. | xci
Blossom Hill (5)
Broadway (6)
Burlingame (7)
California Ave (8)
Capitol (9)
College Park (10)
Diridon (11)
Gilroy (12)
Hayward Park (13)
Hillsdale (14)
Lawrence (15)
Menlo Park (16)
Millbrae (17)
Morgan Hill (18)
Mountain View (19)
Palo Alto (20)
Redwood City (21)
San Antonio (22)
San Bruno (23)
San Carlos (24)
San Francisco (25)
San Jose (26)
San Martin (27)
San Mateo (28)
Santa Clara (29)
South San Francisco (30)
Stanford (31)
Sunnyvale (32)
Tamien (33)
Answer If Which mode of ${q://QID296/ChoiceGroup/SelectedChoices} did you use? Caltrain Is
Selected
Q332 Specify Caltrain end station

Nelson\Nygaard Consulting Associates Inc. | xcii
22nd Street (1)
Atherton (2)
Bayshore (3)
Belmont (4)
Blossom Hill (5)
Broadway (6)
Burlingame (7)
California Ave (8)
Capitol (9)
College Park (10)
Diridon (11)
Gilroy (12)
Hayward Park (13)
Hillsdale (14)
Lawrence (15)
Menlo Park (16)
Millbrae (17)
Morgan Hill (18)
Mountain View (19)
Palo Alto (20)
Redwood City (21)
San Antonio (22)
San Bruno (23)
San Carlos (24)
San Francisco (25)
San Jose (26)
San Martin (27)
San Mateo (28)
Santa Clara (29)
South San Francisco (30)
Stanford (31)
Sunnyvale (32)
Tamien (33)
Nelson\Nygaard Consulting Associates Inc. | xciii
Answer If Which mode of ${q://QID296/ChoiceGroup/SelectedChoices} did you use? Other bus
provider than Muni (e.g. AC Transit/Golden Gate Transit/SamTrans) Is Selected
Q333 Please estimate (in miles) the distance you traveled for this segment of your trip (for
instance if you traveled 1 1/2 miles, enter 1.5)
Answer If Which mode of ${q://QID296/ChoiceGroup/SelectedChoices} did you use?
Carpool/Vanpool Is Selected
Q334 I was the:
Passenger (1)
Driver (2)
Answer If Which mode of ${q://QID296/ChoiceGroup/SelectedChoices} did you use?
Carpool/Vanpool Is Selected
Q335 Number of people in the carpool/vanpool on Wednesday, April, 6, 2016:
2 (2)
3 (3)
4 (4)
5 (5)
6 (6)
7 (7)
More than 7 (8)
Answer If On your trip from SF State's main campus, what was your fourth mode of
transportation? <o:p></o:p>(If your previous segment was via BART please use this
question as an opportunity to tell us h... Private vehicle (cars, carpool, motorcycle, etc.) Is
Selected
Q336 Please estimate (in miles) the distance you traveled for this segment of your trip (for
instance if you traveled 1 1/2 miles, enter 1.5)
Answer If On your trip from SF State's main campus, what was your fourth mode of
transportation? <o:p></o:p>(If your previous segment was via BART please use this
question as an opportunity to tell us h... Taxi, Uber, Lyft, or other on-demand taxi or real-time
ridesharing services known as TNCs Is Selected
Q337 Please estimate (in miles) the distance you traveled for this segment of your trip (for
instance if you traveled 1 1/2 miles, enter 1.5)
Nelson\Nygaard Consulting Associates Inc. | xciv
Q199 How many round trips, other than those already reported in this survey, did you take
to/from campus (or home for on-campus residents) on Wednesday, April 6, 2016? Please do not
include trips taken within campus.
0 (No other trips made other than my commute to/from campus). (13)
1 (1)
2 (4)
3 (5)
4 (6)
5 (7)
6 (8)
7 (9)
8 (10)
9 (11)
10 or more (12)
If 0 (No other trips made othe... Is Selected, Then Skip To Have you participated in or used / do...
Q200 What was you primary mode of travel for these trips? If this includes an auto trip for any
segment, please select that option.
Walk, bike, or other active transport (4)
Public transportation / shuttle (5)
Private vehicle (cars, carpool, motorcycle, etc.) (6)
Taxi, Uber, Lyft, or other on-demand taxi services known as TNCs (7)
Q201 How many of these trips occurred (arrived or departed campus) between the hours of 7-9
AM?
0 (12)
1 (1)
2 (2)
3 (3)
4 (4)
5 (5)
6 (6)
7 (7)
8 (8)
Nelson\Nygaard Consulting Associates Inc. | xcv
9 (9)
10 or more (11)
Q202 How many of these trips occurred (arrived or departed campus) between the hours of 4-6
PM?
0 (11)
1 (1)
2 (2)
3 (3)
4 (4)
5 (5)
6 (6)
7 (7)
8 (8)
9 (9)
10 or more (10)
q26 Have you participated in or used / do you currently participate in or use any of the following
programs and services ?
I wasn't aware of this service (1) I've heard of this service but never used it (2) I
occasionally (1-2 times a week) use this service (3) I frequently (3-5 days a week) use this
service (4)
Free round trip transfer on Muni 28/28R from Daly City BART when using Clipper Card (1)
Bike Barn (2)
Bike Racks (7)
511 RideMatch Service (3)
Zipcar (9)
Electric Vehicle Charging Stations (10)
Answer If What is your primary affiliation with SF State? Staff or Administrator Is Selected Or
What is your primary affiliation with SF State? Faculty Is Selected
Q146 For Employees: Have you participated in or used / do you currently participate in or use any
of the following programs and services ?
Nelson\Nygaard Consulting Associates Inc. | xcvi
I wasn't aware of this service (1) I've heard of this service but never used it (2) I
occasionally (1-2 times a week) use this service (3) I frequently (3-5 days a week) use this
service (4)
Commuter Check Pre-Tax Transit Benefit (pre-tax purchase of transit passes) (1)
Vanpool (2)
Emergency Ride Home Program (3)
Pre-Tax Parking Benefit (pre-tax purchase of parking) (4)
q27 Do you know where to go if you have questions about your commute or need other
transportation information?
Yes, and I have used the resources available to me before (1)
Yes, but I have not used the resources available to me (2)
No, I do not know what resources are available to me (3)
Q147 Which resources have you used to get transportation and commute information? (please
check all that apply)
" SF State Website home page (1)
" Parking & Transportation Website (2)
" Word of mouth (Fellow student or Coworker) (3)
" My manager (5)
" Human Resources (6)
" Hiring Materials (7)
" A distribution list that I signed up for (8)
" Digital Screens found around campus (9)
" Other (please specify) (10) ____________________
Q116 In an effort to reduce parking demand and to expand affordable transportation options, SF
State is exploring the possibility of pursuing discounts for our students, faculty, and staff for on-
demand taxi services known as TNCs such as Uber and Lyft. Would you be interested in such
a benefit?
Yes (1)
No (2)

Nelson\Nygaard Consulting Associates Inc. | xcvii
?
Q212 Please provide any additional comments about transportation issues that relate to SF State.
q31 If you would like to be entered for a chance to receive a $100 gift card to the SF State
Bookstore, please enter your email address.

Nelson\Nygaard Consulting Associates Inc. | xcvi
I wasn't aware of this service (1) I've heard of this service but never used it (2) I
occasionally (1-2 times a week) use this service (3) I frequently (3-5 days a week) use this
service (4)
Commuter Check Pre-Tax Transit Benefit (pre-tax purchase of transit passes) (1)
Vanpool (2)
Emergency Ride Home Program (3)
Pre-Tax Parking Benefit (pre-tax purchase of parking) (4)
q27 Do you know where to go if you have questions about your commute or need other
transportation information?
Yes, and I have used the resources available to me before (1)
Yes, but I have not used the resources available to me (2)
No, I do not know what resources are available to me (3)
Q147 Which resources have you used to get transportation and commute information? (please
check all that apply)
" SF State Website home page (1)
" Parking & Transportation Website (2)
" Word of mouth (Fellow student or Coworker) (3)
" My manager (5)
" Human Resources (6)
" Hiring Materials (7)
" A distribution list that I signed up for (8)
" Digital Screens found around campus (9)
" Other (please specify) (10) ____________________
Q116 In an effort to reduce parking demand and to expand affordable transportation options, SF
State is exploring the possibility of pursuing discounts for our students, faculty, and staff for on-
demand taxi services known as TNCs such as Uber and Lyft. Would you be interested in such
a benefit?
Yes (1)
No (2)
Nelson\Nygaard Consulting Associates Inc. | xcvii
?
Q212 Please provide any additional comments about transportation issues that relate to SF State.
q31 If you would like to be entered for a chance to receive a $100 gift card to the SF State
Bookstore, please enter your email address.
Recommended