Appendix 21
Wastewater Quality Assessment of
the Biological Trickling Filter
Page 1
ENVIROKNOWLEDGE® 3 Dunrobin Street, Dunedin 9013 Phone 03 4776111
www.enviroknowledge.co.nz
ENVIROKNOWLEDGE® and NKnowledge® are registered trademarks.
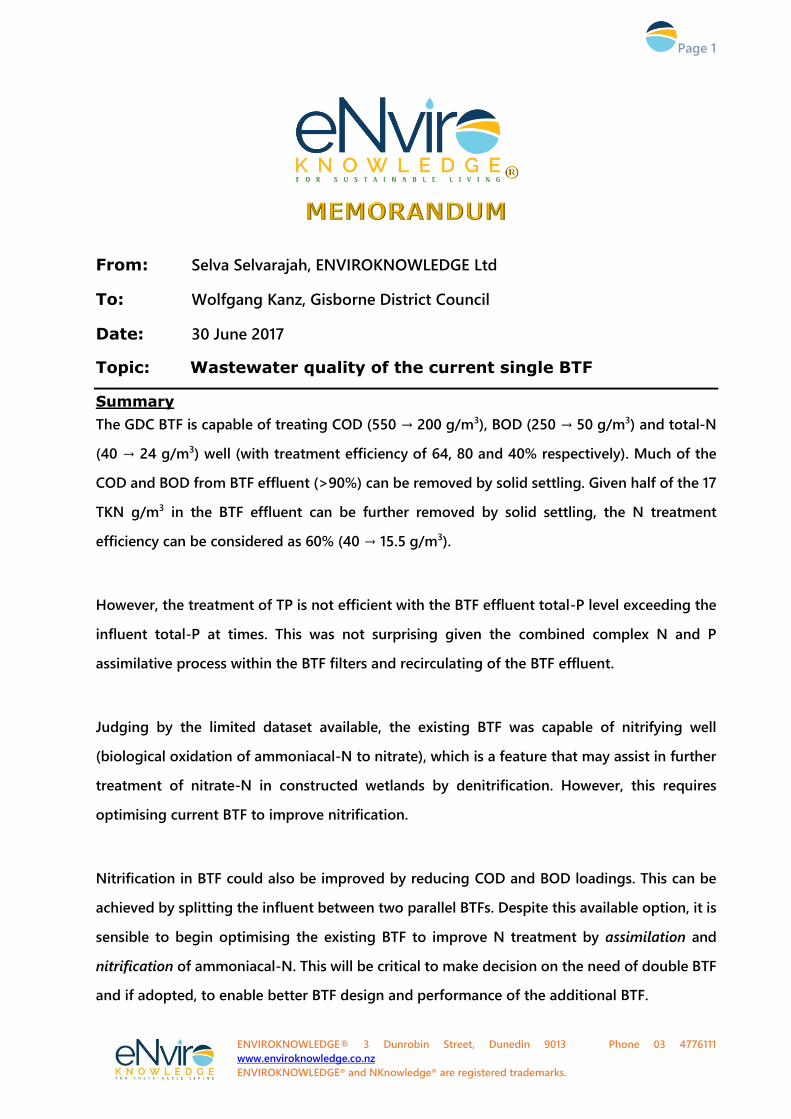
From: Selva Selvarajah, ENVIROKNOWLEDGE Ltd
To: Wolfgang Kanz, Gisborne District Council
Date: 30 June 2017
Topic: Wastewater quality of the current single BTF
Summary
The GDC BTF is capable of treating COD (550 → 200 g/m3), BOD (250 → 50 g/m3) and total-N
(40 → 24 g/m3) well (with treatment efficiency of 64, 80 and 40% respectively). Much of the
COD and BOD from BTF effluent (>90%) can be removed by solid settling. Given half of the 17
TKN g/m3 in the BTF effluent can be further removed by solid settling, the N treatment
efficiency can be considered as 60% (40 → 15.5 g/m3).
However, the treatment of TP is not efficient with the BTF effluent total-P level exceeding the
influent total-P at times. This was not surprising given the combined complex N and P
assimilative process within the BTF filters and recirculating of the BTF effluent.
Judging by the limited dataset available, the existing BTF was capable of nitrifying well
(biological oxidation of ammoniacal-N to nitrate), which is a feature that may assist in further
treatment of nitrate-N in constructed wetlands by denitrification. However, this requires
optimising current BTF to improve nitrification.
Nitrification in BTF could also be improved by reducing COD and BOD loadings. This can be
achieved by splitting the influent between two parallel BTFs. Despite this available option, it is
sensible to begin optimising the existing BTF to improve N treatment by assimilation and
nitrification of ammoniacal-N. This will be critical to make decision on the need of double BTF
and if adopted, to enable better BTF design and performance of the additional BTF.
Page 2
ENVIROKNOWLEDGE® 3 Dunrobin Street, Dunedin 9013 Phone 03 4776111
www.enviroknowledge.co.nz
ENVIROKNOWLEDGE® and NKnowledge® are registered trademarks.
GDC information assessed:
NIWA Wetland trial spreadsheet SP1 which has BTF effluent data from 23 Feb 2016 to 2
August 2016 following solid removal by NIWA conical method
GDC BTF wastewater quality data collected during NIWA wetland trials from 22 May
2013 to 10 August 2016
GDC BTF data spreadsheet for BTF before and after wastewater quality from 6 January
2011 to 27 December 2016
Biological Trickling Filters
Biological trickling filters (BTFs) are well known for their stable aerobic wastewater treatment
processes. The old conventional BTFs contain rocks as filters without active aeration of media.
Wastewater is sprinkled by rotating arms which feed aerated wastewater to rock media.
Wastewater trickling down the media creates biofilms and bio-growth around the media which
act as micro-treatment systems, with concurrent aerobic and anaerobic bacterial activities.
When solid growths are mature, they fall off naturally (sloughing) or by wastewater flushing.
Most BTFs have been designed primarily to treat carbonaceous materials (BOD and COD).
However, BTFs are also capable of treating nitrogen (N) by bacterial assimilation of
ammoniacal-N (NH4-N + NH3-N) into dead bacterial cells (organic-N) and nitrifying
ammoniacal-N into nitrate-N (NO3-N) by biological oxidation process, followed by
denitrification of nitrate-N (NO3-N). Bio-growth on filters provide both aerobic and anaerobic
conditions to promote nitrification and denitrification simultaneously. Of the above processes,
N assimilation is the most predominant N treatment process in BTFs. However, more
nitrification can be promoted by reducing BOD and COD loadings or by splitting wastewater
into two BTFs.
The modern BTFs are sophisticated with active aeration of the media, with media containing
large surface area with greater wettability for bio-growth. For example a 60o crossflow plastic
filters can contain larger specific surface area and void ratio. BTF filters are extensively
researched for their high specific surface area, void ratio, uniformity of bio-growth, filter flies
Page 3
ENVIROKNOWLEDGE® 3 Dunrobin Street, Dunedin 9013 Phone 03 4776111
www.enviroknowledge.co.nz
ENVIROKNOWLEDGE® and NKnowledge® are registered trademarks.
(which could occur if filters have dry areas), plugging (potential for solids to bridge voids) and
oxygen transfer characteristics.
Purpose of this memo
The main purpose of this memo is to assess all available GDC BTF wastewater data and provide
as much useful information as possible to GDC.
Observations from GDC data:
GDC BTF Specifications
Table 1 contains few basic specifications for the existing single BTF. Judging by the wetting
rate of 39 m3/m2/d and the current high summer average BOD loading of 0.82 kg/m3/d this
BTF can be classified as a high rate trickling filter. Such BTFs can be expected to reduce BOD
by 65-85%. The polypropylene filter is 60o crossflow type which has a very high specific surface
area of 125 m2/m3. In comparison, rock media filter has only 50 m2/m3. Crossflow filters tend
to have superior wetting characteristics and are able to nitrify better under low BOD loadings.
Table 1. BTF specifications (data supplied by CH2M Beca)
Components Dimensions
Diameter (centre column 1.2 m) 32.5 m
Depth 6 m
Area 828 m2
Total volume 4977 m3
Media (60o crossflow polypropylene) volume
Media total area (calculated from 125 m2/m3)
4971 m3
621,375 m2
Minimum flow to BTF to maintain required wetting 32400 m3/d
375 L/s
Wetting rate 39 m3/m2/d
BOD load
Original design
Current annual average
Current summer average
Current summer 95th percentile
Current winter average
Current winter 95th percentile
3780 m3/d (0.76 kg/m3/d)
3489 m3/d (0.70 kg/m3/d)
4096 m3/d (0.82 kg/m3/d)
6261 m3/d (1.26 kg/m3/d)
2889 m3/d (0.58 kg/m3/d)
4490 m3/d (0.90 kg/m3/d)
Aeration by 3 fan aerator with positive pressure 3470 L/s per fan
Page 4
ENVIROKNOWLEDGE® 3 Dunrobin Street, Dunedin 9013 Phone 03 4776111
www.enviroknowledge.co.nz
ENVIROKNOWLEDGE® and NKnowledge® are registered trademarks.
As shown Table 1, the minimum BTF flow rate to keep filters wet is 32,400 m3/d (375 L/s). If the
inflow drops below 375 L/s, a proportion of the treated BTF effluent is fed to the Feed Pump
Station where raw effluent has been screened and brought in to make up for 375 L/s. If the
inflow remains between 375 and 450 L/s, the BTF effluent is not recirculated. However, if it
exceeds 450 L/s, any excess inflow wastewater will be directed to the Outfall Pump Station.
The recirculating feature is also critical to the quality of the BTF effluent, with high recirculation
resulting in high quality effluent.
Data quality
Conventional wastewater engineering practices require BTF (biological trickling filter) designs
and operations be based mainly on BOD, COD and hydraulic loadings. For the above reason,
the performance of the BTF has often been measured on the basis of BTF’s ability to treat BOD
or COD.
As stated, modern BTFs with efficient plastic filter media and sophisticated aeration are not
only efficient in treating COD and BOD, but excellent in promoting N mineralisation and
assimilation (ammoniacal-N → organic-N) and nitrification-denitrification processes. Modern
BTFs are capable of treating N as a contaminant effectively. Unfortunately, the above feature
is not monitored or operated proactively.
In New Zealand, much of the wastewater treatment plant N treatment performance monitoring
is based on regional council compliance monitoring requirements. If the performance is
monitored outside consent conditions, it is monitored during the commissioning of the plant
or during any troubleshooting. The best way to monitor for BTF N treatment efficiency is to
monitor for influent TKN (which contains organic-N and ammoniacal-N) and, ammoniacal-N
and effluent TKN, ammoniacal-N and nitrate-N.
In the case of the GDC BTF, much of the effluent-N monitoring has been from NIWA’s
wastewater trial conducted between 2013 and 2016. Without such data, it is difficult to
recognise the existing BTF’s capability of treating N as one of the primary contaminants. Much
of the GDC BTF effluent-N output data had been collected between May 2013 and April 2014
Page 5
ENVIROKNOWLEDGE® 3 Dunrobin Street, Dunedin 9013 Phone 03 4776111
www.enviroknowledge.co.nz
ENVIROKNOWLEDGE® and NKnowledge® are registered trademarks.
and after a long pause another set of data were collected between November 2015 and August
2016. Given the high wetting rate of the BTF and the high potential for BTF effluent
recirculation, accurate estimates of contaminant loadings can only be possible with access to
actual daily BTF dosing volume data. Such data were not available at the time of preparing this
memo.
Raw wastewater Volume
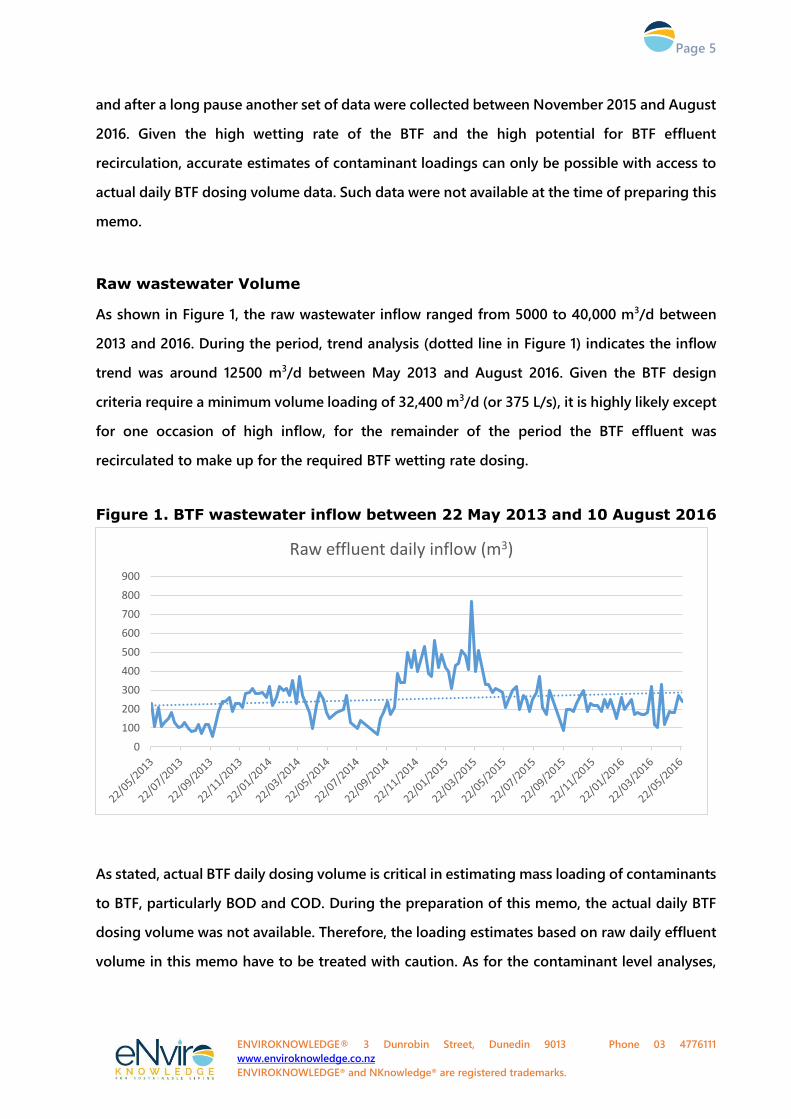
As shown in Figure 1, the raw wastewater inflow ranged from 5000 to 40,000 m3/d between
2013 and 2016. During the period, trend analysis (dotted line in Figure 1) indicates the inflow
trend was around 12500 m3/d between May 2013 and August 2016. Given the BTF design
criteria require a minimum volume loading of 32,400 m3/d (or 375 L/s), it is highly likely except
for one occasion of high inflow, for the remainder of the period the BTF effluent was
recirculated to make up for the required BTF wetting rate dosing.
Figure 1. BTF wastewater inflow between 22 May 2013 and 10 August 2016
As stated, actual BTF daily dosing volume is critical in estimating mass loading of contaminants
to BTF, particularly BOD and COD. During the preparation of this memo, the actual daily BTF
dosing volume was not available. Therefore, the loading estimates based on raw daily effluent
volume in this memo have to be treated with caution. As for the contaminant level analyses,
0
100
200
300
400
500
600
700
800
900
Raw effluent daily inflow (m3)
Page 6
ENVIROKNOWLEDGE® 3 Dunrobin Street, Dunedin 9013 Phone 03 4776111
www.enviroknowledge.co.nz
ENVIROKNOWLEDGE® and NKnowledge® are registered trademarks.
the dosing volume is not critical. For this reason, the data analyses on contaminant levels can
be considered as reasonably accurate.
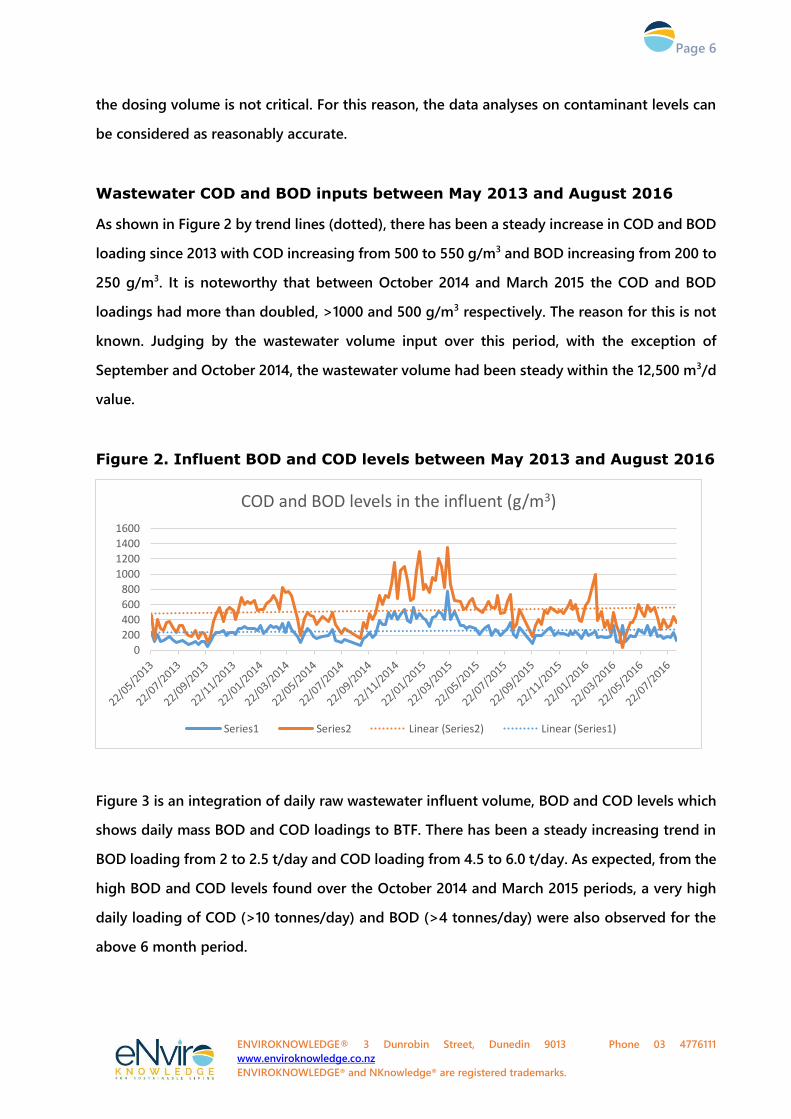
Wastewater COD and BOD inputs between May 2013 and August 2016
As shown in Figure 2 by trend lines (dotted), there has been a steady increase in COD and BOD
loading since 2013 with COD increasing from 500 to 550 g/m3 and BOD increasing from 200 to
250 g/m3. It is noteworthy that between October 2014 and March 2015 the COD and BOD
loadings had more than doubled, >1000 and 500 g/m3 respectively. The reason for this is not
known. Judging by the wastewater volume input over this period, with the exception of
September and October 2014, the wastewater volume had been steady within the 12,500 m3/d
value.
Figure 2. Influent BOD and COD levels between May 2013 and August 2016
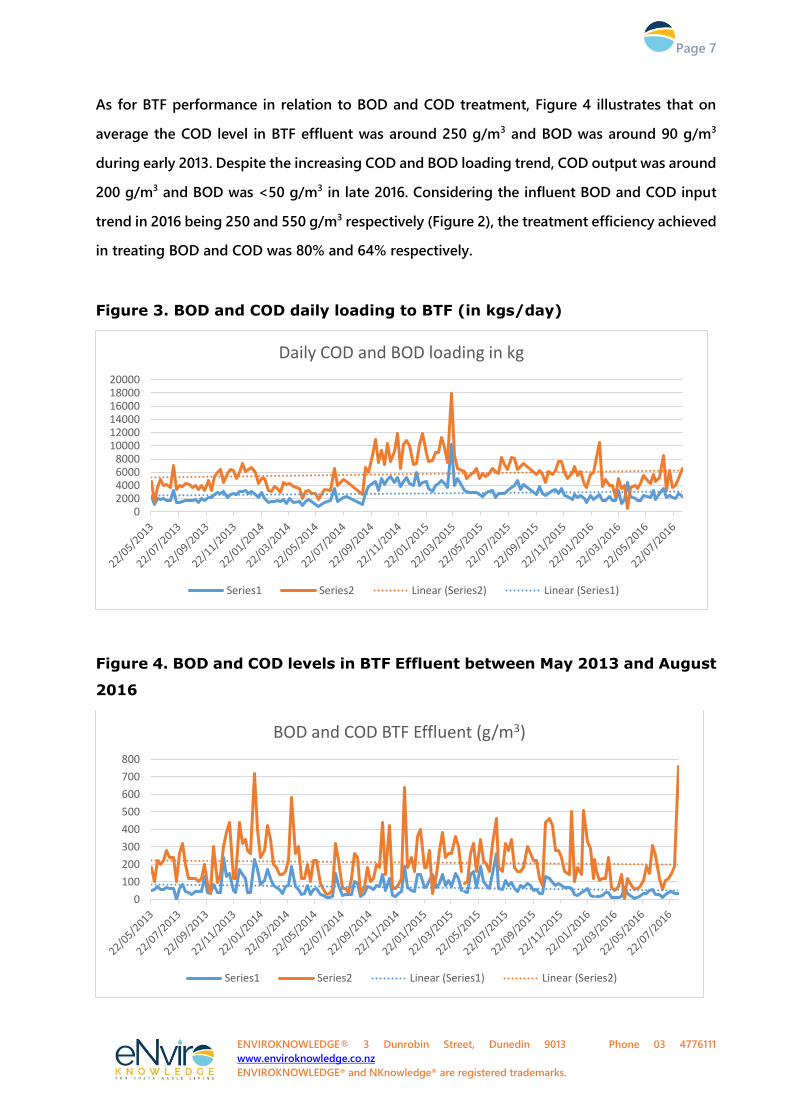
Figure 3 is an integration of daily raw wastewater influent volume, BOD and COD levels which
shows daily mass BOD and COD loadings to BTF. There has been a steady increasing trend in
BOD loading from 2 to 2.5 t/day and COD loading from 4.5 to 6.0 t/day. As expected, from the
high BOD and COD levels found over the October 2014 and March 2015 periods, a very high
daily loading of COD (>10 tonnes/day) and BOD (>4 tonnes/day) were also observed for the
above 6 month period.
0
200
400
600
800
1000
1200
1400
1600
COD and BOD levels in the influent (g/m3)
Series1 Series2 Linear (Series2) Linear (Series1)
Page 7
ENVIROKNOWLEDGE® 3 Dunrobin Street, Dunedin 9013 Phone 03 4776111
www.enviroknowledge.co.nz
ENVIROKNOWLEDGE® and NKnowledge® are registered trademarks.
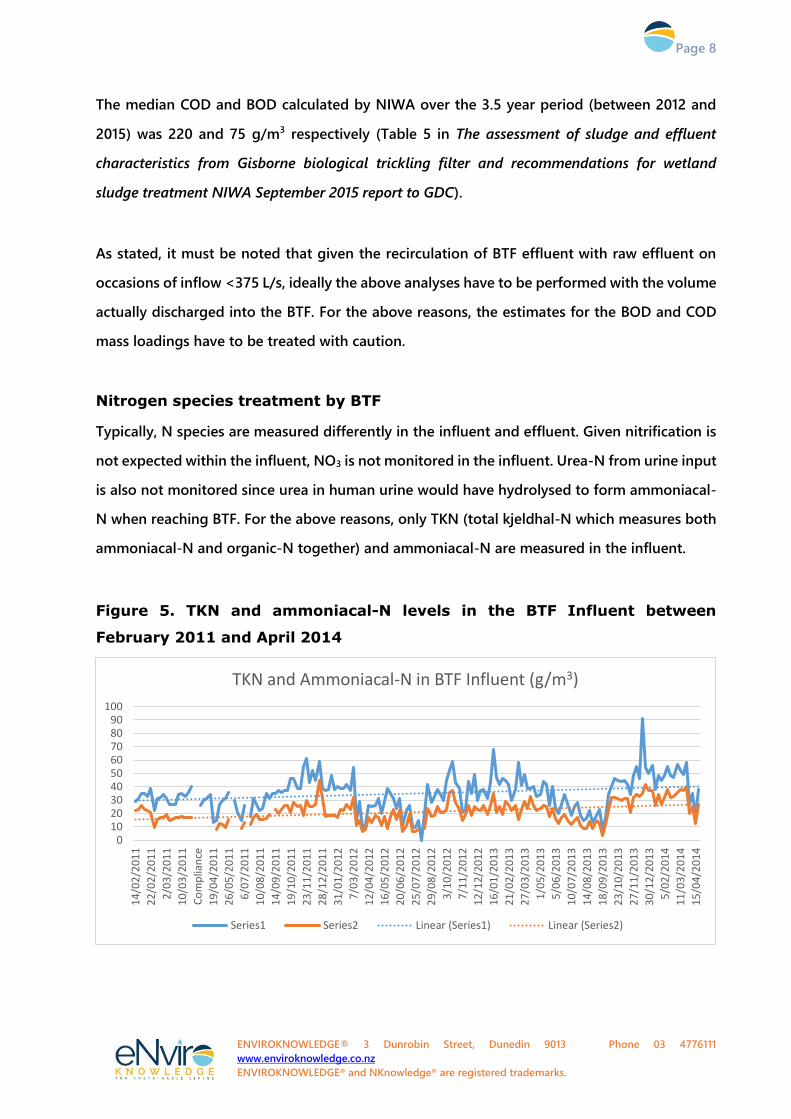
As for BTF performance in relation to BOD and COD treatment, Figure 4 illustrates that on
average the COD level in BTF effluent was around 250 g/m3 and BOD was around 90 g/m3
during early 2013. Despite the increasing COD and BOD loading trend, COD output was around
200 g/m3 and BOD was <50 g/m3 in late 2016. Considering the influent BOD and COD input
trend in 2016 being 250 and 550 g/m3 respectively (Figure 2), the treatment efficiency achieved
in treating BOD and COD was 80% and 64% respectively.
Figure 3. BOD and COD daily loading to BTF (in kgs/day)
Figure 4. BOD and COD levels in BTF Effluent between May 2013 and August
2016
02000400060008000
100001200014000160001800020000
Daily COD and BOD loading in kg
Series1 Series2 Linear (Series2) Linear (Series1)
0
100
200
300
400
500
600
700
800
BOD and COD BTF Effluent (g/m3)
Series1 Series2 Linear (Series1) Linear (Series2)
Page 8
ENVIROKNOWLEDGE® 3 Dunrobin Street, Dunedin 9013 Phone 03 4776111
www.enviroknowledge.co.nz
ENVIROKNOWLEDGE® and NKnowledge® are registered trademarks.
The median COD and BOD calculated by NIWA over the 3.5 year period (between 2012 and
2015) was 220 and 75 g/m3 respectively (Table 5 in The assessment of sludge and effluent
characteristics from Gisborne biological trickling filter and recommendations for wetland
sludge treatment NIWA September 2015 report to GDC).
As stated, it must be noted that given the recirculation of BTF effluent with raw effluent on
occasions of inflow <375 L/s, ideally the above analyses have to be performed with the volume
actually discharged into the BTF. For the above reasons, the estimates for the BOD and COD
mass loadings have to be treated with caution.
Nitrogen species treatment by BTF
Typically, N species are measured differently in the influent and effluent. Given nitrification is
not expected within the influent, NO3 is not monitored in the influent. Urea-N from urine input
is also not monitored since urea in human urine would have hydrolysed to form ammoniacal-
N when reaching BTF. For the above reasons, only TKN (total kjeldhal-N which measures both
ammoniacal-N and organic-N together) and ammoniacal-N are measured in the influent.
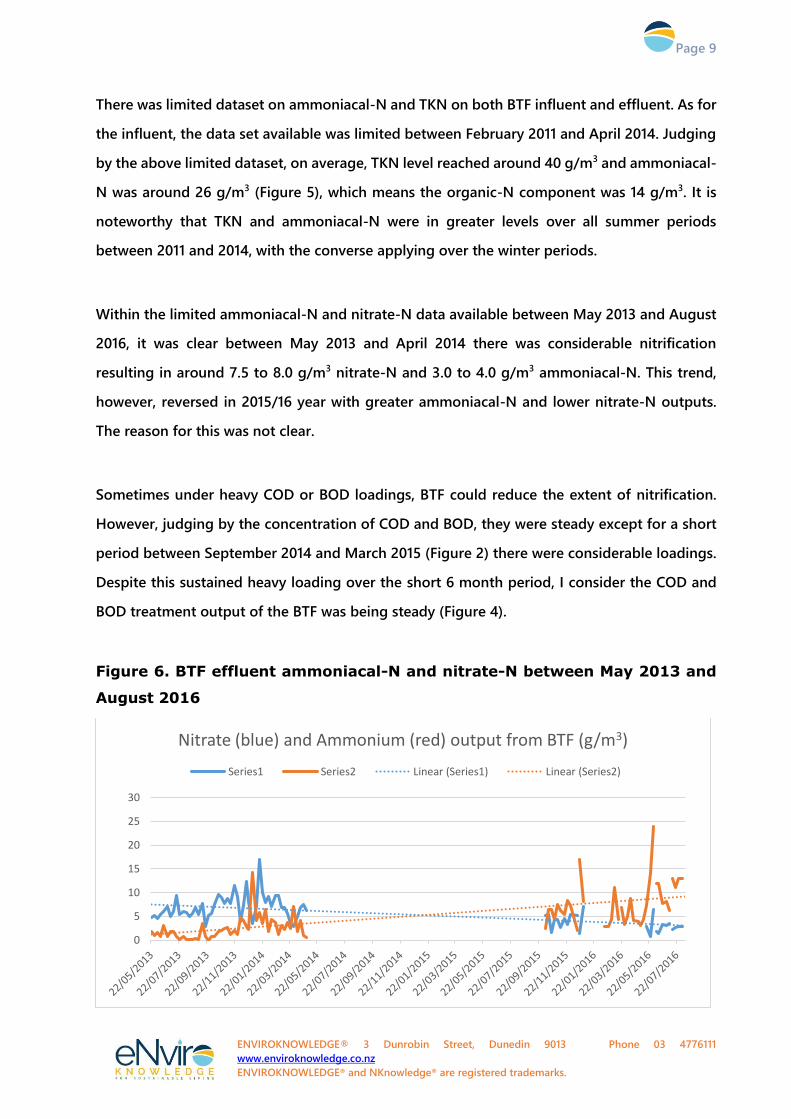
Figure 5. TKN and ammoniacal-N levels in the BTF Influent between
February 2011 and April 2014
0102030405060708090
100
14
/02
/20
11
22
/02
/20
11
2/0
3/2
01
1
10
/03
/20
11
Co
mp
lian
ce
19
/04
/20
11
26
/05
/20
11
6/0
7/2
01
1
10
/08
/20
11
14
/09
/20
11
19
/10
/20
11
23
/11
/20
11
28
/12
/20
11
31
/01
/20
12
7/0
3/2
01
2
12
/04
/20
12
16
/05
/20
12
20
/06
/20
12
25
/07
/20
12
29
/08
/20
12
3/1
0/2
01
2
7/1
1/2
01
2
12
/12
/20
12
16
/01
/20
13
21
/02
/20
13
27
/03
/20
13
1/0
5/2
01
3
5/0
6/2
01
3
10
/07
/20
13
14
/08
/20
13
18
/09
/20
13
23
/10
/20
13
27
/11
/20
13
30
/12
/20
13
5/0
2/2
01
4
11
/03
/20
14
15
/04
/20
14
TKN and Ammoniacal-N in BTF Influent (g/m3)
Series1 Series2 Linear (Series1) Linear (Series2)
Page 9
ENVIROKNOWLEDGE® 3 Dunrobin Street, Dunedin 9013 Phone 03 4776111
www.enviroknowledge.co.nz
ENVIROKNOWLEDGE® and NKnowledge® are registered trademarks.
There was limited dataset on ammoniacal-N and TKN on both BTF influent and effluent. As for
the influent, the data set available was limited between February 2011 and April 2014. Judging
by the above limited dataset, on average, TKN level reached around 40 g/m3 and ammoniacal-
N was around 26 g/m3 (Figure 5), which means the organic-N component was 14 g/m3. It is
noteworthy that TKN and ammoniacal-N were in greater levels over all summer periods
between 2011 and 2014, with the converse applying over the winter periods.
Within the limited ammoniacal-N and nitrate-N data available between May 2013 and August
2016, it was clear between May 2013 and April 2014 there was considerable nitrification
resulting in around 7.5 to 8.0 g/m3 nitrate-N and 3.0 to 4.0 g/m3 ammoniacal-N. This trend,
however, reversed in 2015/16 year with greater ammoniacal-N and lower nitrate-N outputs.
The reason for this was not clear.
Sometimes under heavy COD or BOD loadings, BTF could reduce the extent of nitrification.
However, judging by the concentration of COD and BOD, they were steady except for a short
period between September 2014 and March 2015 (Figure 2) there were considerable loadings.
Despite this sustained heavy loading over the short 6 month period, I consider the COD and
BOD treatment output of the BTF was being steady (Figure 4).
Figure 6. BTF effluent ammoniacal-N and nitrate-N between May 2013 and
August 2016
0
5
10
15
20
25
30
Nitrate (blue) and Ammonium (red) output from BTF (g/m3)
Series1 Series2 Linear (Series1) Linear (Series2)
Page 10
ENVIROKNOWLEDGE® 3 Dunrobin Street, Dunedin 9013 Phone 03 4776111
www.enviroknowledge.co.nz
ENVIROKNOWLEDGE® and NKnowledge® are registered trademarks.
Unless more details of BTF operation over such periods were known (e.g. extent and timing of
filter aeration and actual dosing volumes), it is difficult to identify the reasons for the reversing
BTF nitrification trend. What is very clear is that judging by the May 2013 to April 2014 dataset,
BTF was very capable of nitrifying ammoniacal-N. Whilst, the overall combined ammoniacal-N
and nitrate-N (dissolved inorganic-N) levels remained similar at around 10-11 g/m3 over both
nitrifying and non-nitrifying periods, from a tertiary treatment viewpoint, having greater
nitrate-N levels is considered as an advantage to further treat N by denitrification (e.g. using
constructed wetlands).
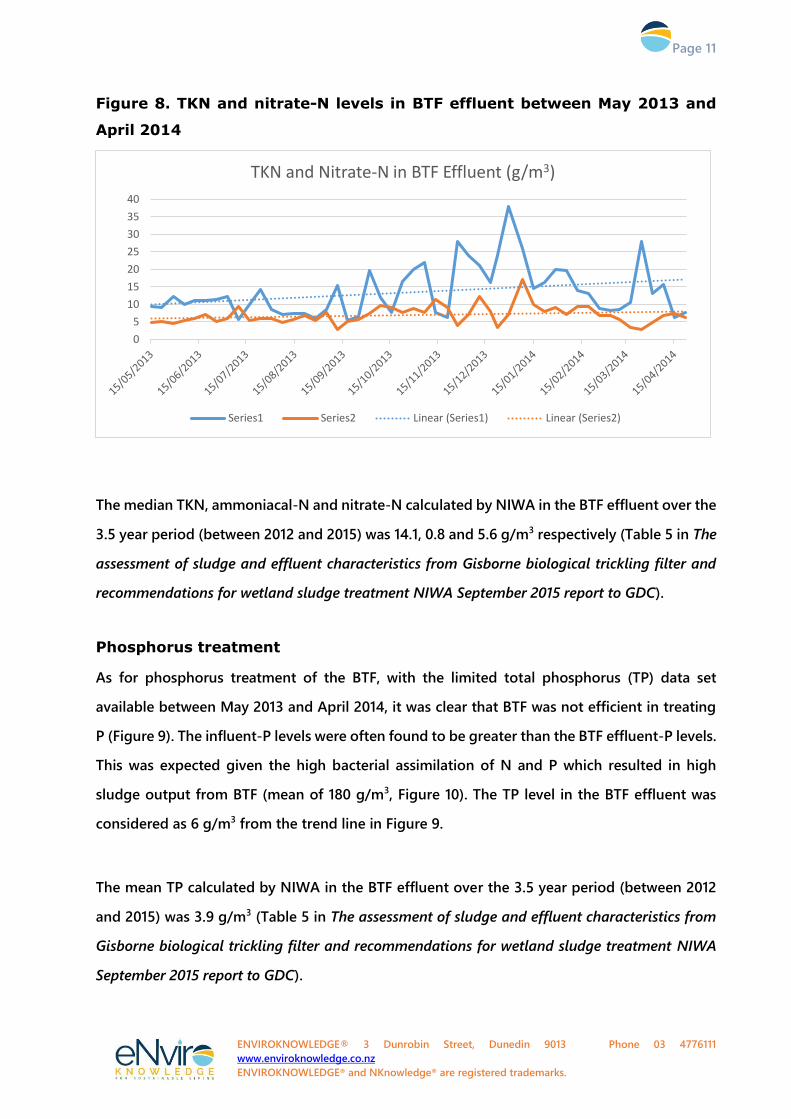
The BTF total-N treatment efficiency can be assessed by the difference between BTF influent
TKN (since no nitrate-N is found in the influent, TKN can be considered as total-N) and BTF
effluent nitrate-N + TKN.
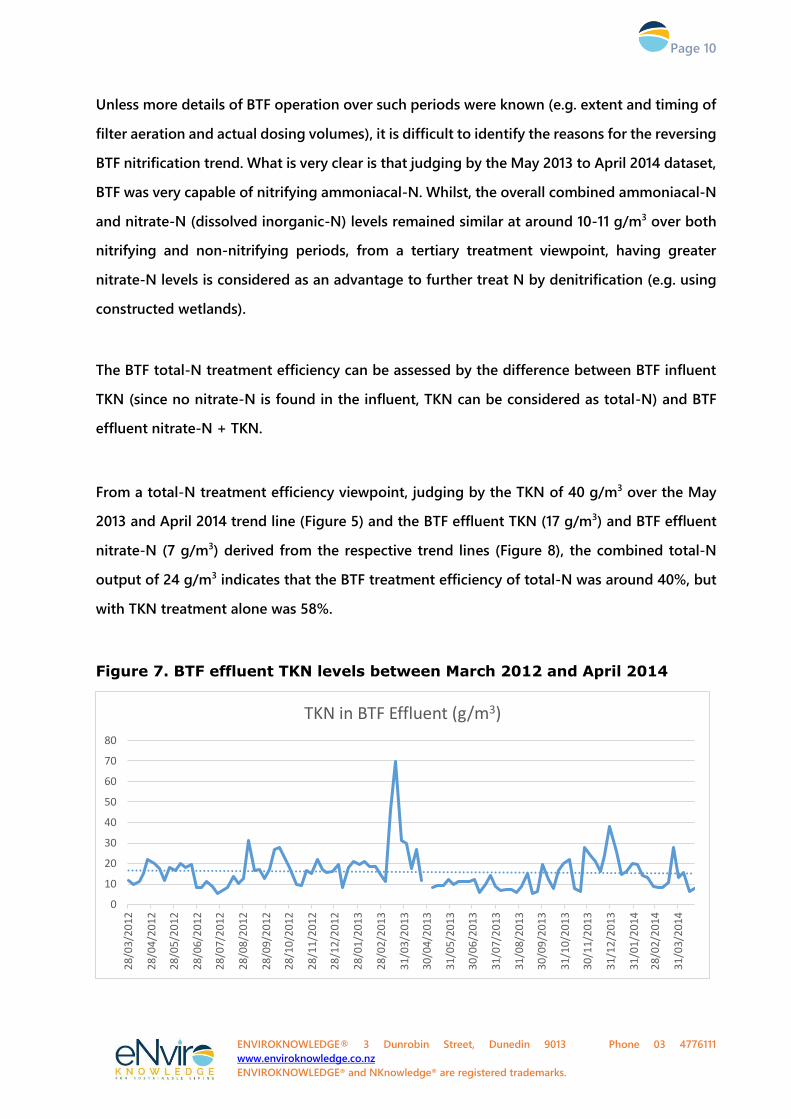
From a total-N treatment efficiency viewpoint, judging by the TKN of 40 g/m3 over the May
2013 and April 2014 trend line (Figure 5) and the BTF effluent TKN (17 g/m3) and BTF effluent
nitrate-N (7 g/m3) derived from the respective trend lines (Figure 8), the combined total-N
output of 24 g/m3 indicates that the BTF treatment efficiency of total-N was around 40%, but
with TKN treatment alone was 58%.
Figure 7. BTF effluent TKN levels between March 2012 and April 2014
0
10
20
30
40
50
60
70
80
28
/03
/20
12
28
/04
/20
12
28
/05
/20
12
28
/06
/20
12
28
/07
/20
12
28
/08
/20
12
28
/09
/20
12
28
/10
/20
12
28
/11
/20
12
28
/12
/20
12
28
/01
/20
13
28
/02
/20
13
31
/03
/20
13
30
/04
/20
13
31
/05
/20
13
30
/06
/20
13
31
/07
/20
13
31
/08
/20
13
30
/09
/20
13
31
/10
/20
13
30
/11
/20
13
31
/12
/20
13
31
/01
/20
14
28
/02
/20
14
31
/03
/20
14
TKN in BTF Effluent (g/m3)
Page 11
ENVIROKNOWLEDGE® 3 Dunrobin Street, Dunedin 9013 Phone 03 4776111
www.enviroknowledge.co.nz
ENVIROKNOWLEDGE® and NKnowledge® are registered trademarks.
Figure 8. TKN and nitrate-N levels in BTF effluent between May 2013 and
April 2014
The median TKN, ammoniacal-N and nitrate-N calculated by NIWA in the BTF effluent over the
3.5 year period (between 2012 and 2015) was 14.1, 0.8 and 5.6 g/m3 respectively (Table 5 in The
assessment of sludge and effluent characteristics from Gisborne biological trickling filter and
recommendations for wetland sludge treatment NIWA September 2015 report to GDC).
Phosphorus treatment
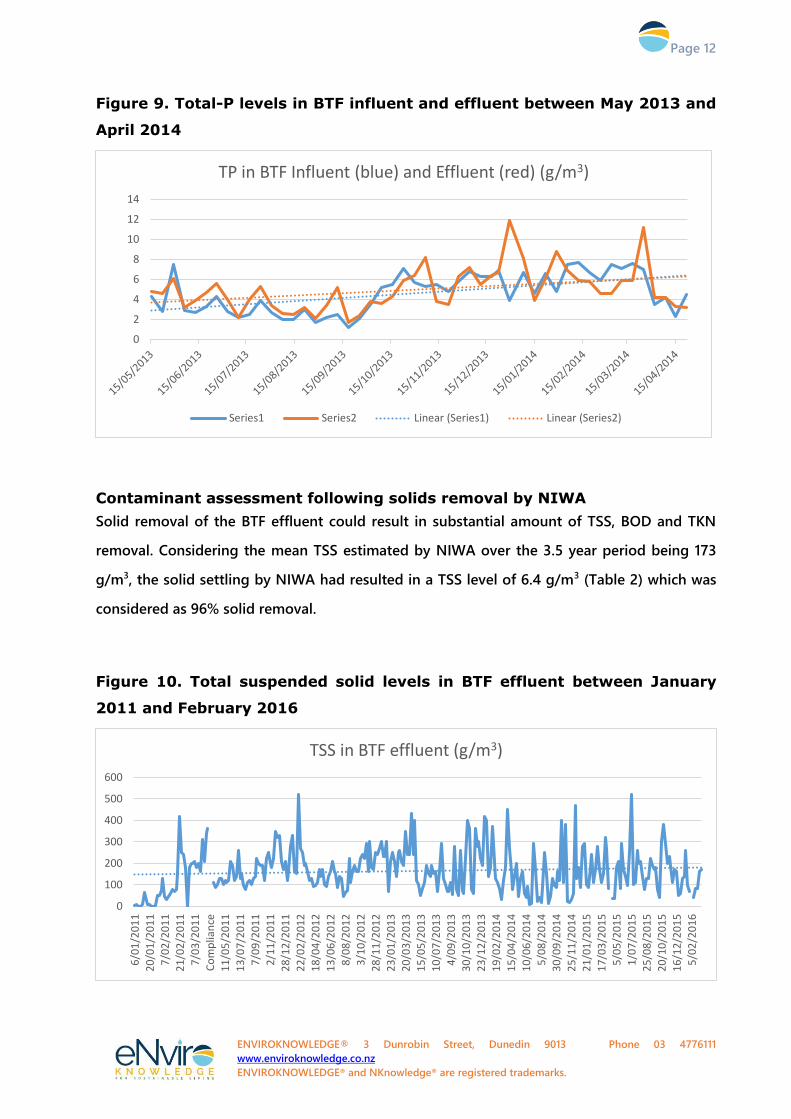
As for phosphorus treatment of the BTF, with the limited total phosphorus (TP) data set
available between May 2013 and April 2014, it was clear that BTF was not efficient in treating
P (Figure 9). The influent-P levels were often found to be greater than the BTF effluent-P levels.
This was expected given the high bacterial assimilation of N and P which resulted in high
sludge output from BTF (mean of 180 g/m3, Figure 10). The TP level in the BTF effluent was
considered as 6 g/m3 from the trend line in Figure 9.
The mean TP calculated by NIWA in the BTF effluent over the 3.5 year period (between 2012
and 2015) was 3.9 g/m3 (Table 5 in The assessment of sludge and effluent characteristics from
Gisborne biological trickling filter and recommendations for wetland sludge treatment NIWA
September 2015 report to GDC).
0
5
10
15
20
25
30
35
40
TKN and Nitrate-N in BTF Effluent (g/m3)
Series1 Series2 Linear (Series1) Linear (Series2)
Page 12
ENVIROKNOWLEDGE® 3 Dunrobin Street, Dunedin 9013 Phone 03 4776111
www.enviroknowledge.co.nz
ENVIROKNOWLEDGE® and NKnowledge® are registered trademarks.
Figure 9. Total-P levels in BTF influent and effluent between May 2013 and
April 2014
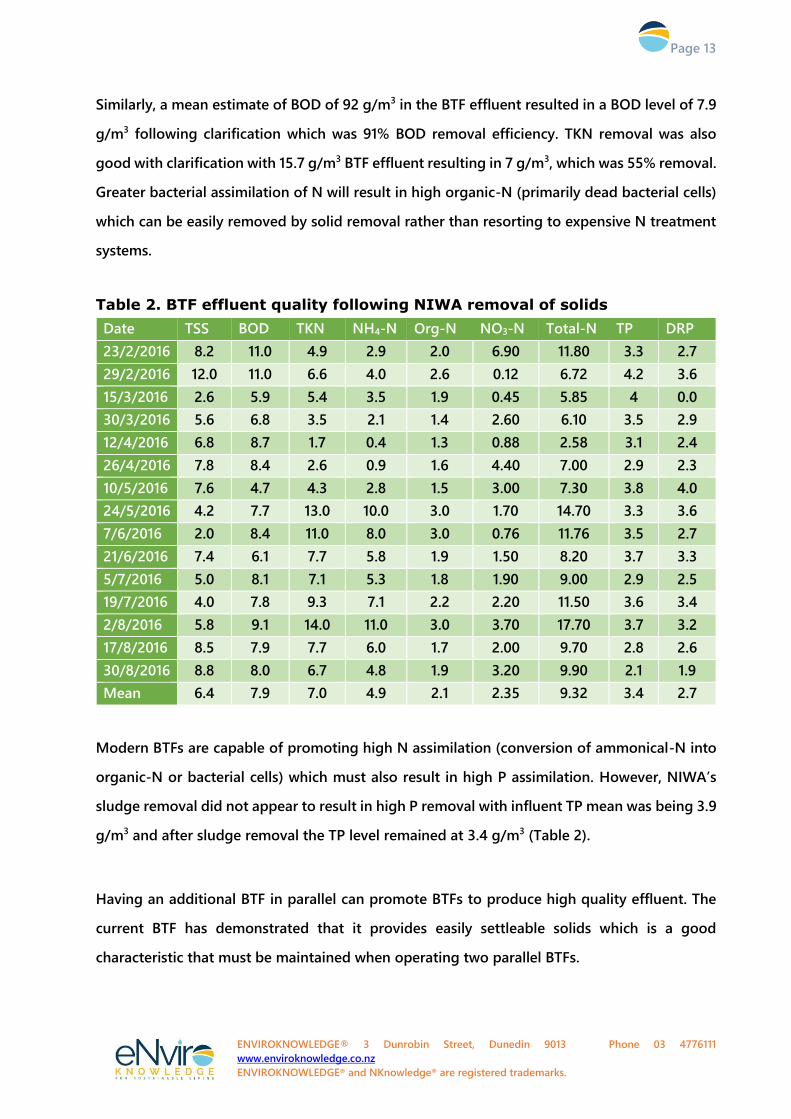
Contaminant assessment following solids removal by NIWA
Solid removal of the BTF effluent could result in substantial amount of TSS, BOD and TKN
removal. Considering the mean TSS estimated by NIWA over the 3.5 year period being 173
g/m3, the solid settling by NIWA had resulted in a TSS level of 6.4 g/m3 (Table 2) which was
considered as 96% solid removal.
Figure 10. Total suspended solid levels in BTF effluent between January
2011 and February 2016
0
2
4
6
8
10
12
14
TP in BTF Influent (blue) and Effluent (red) (g/m3)
Series1 Series2 Linear (Series1) Linear (Series2)
0
100
200
300
400
500
600
6/0
1/2
01
1
20
/01
/20
11
7/0
2/2
01
1
21
/02
/20
11
7/0
3/2
01
1
Co
mp
lian
ce
11
/05
/20
11
13
/07
/20
11
7/0
9/2
01
1
2/1
1/2
01
1
28
/12
/20
11
22
/02
/20
12
18
/04
/20
12
13
/06
/20
12
8/0
8/2
01
2
3/1
0/2
01
2
28
/11
/20
12
23
/01
/20
13
20
/03
/20
13
15
/05
/20
13
10
/07
/20
13
4/0
9/2
01
3
30
/10
/20
13
23
/12
/20
13
19
/02
/20
14
15
/04
/20
14
10
/06
/20
14
5/0
8/2
01
4
30
/09
/20
14
25
/11
/20
14
21
/01
/20
15
17
/03
/20
15
5/0
5/2
01
5
1/0
7/2
01
5
25
/08
/20
15
20
/10
/20
15
16
/12
/20
15
5/0
2/2
01
6
TSS in BTF effluent (g/m3)
Page 13
ENVIROKNOWLEDGE® 3 Dunrobin Street, Dunedin 9013 Phone 03 4776111
www.enviroknowledge.co.nz
ENVIROKNOWLEDGE® and NKnowledge® are registered trademarks.
Similarly, a mean estimate of BOD of 92 g/m3 in the BTF effluent resulted in a BOD level of 7.9
g/m3 following clarification which was 91% BOD removal efficiency. TKN removal was also
good with clarification with 15.7 g/m3 BTF effluent resulting in 7 g/m3, which was 55% removal.
Greater bacterial assimilation of N will result in high organic-N (primarily dead bacterial cells)
which can be easily removed by solid removal rather than resorting to expensive N treatment
systems.
Table 2. BTF effluent quality following NIWA removal of solids
Date TSS BOD TKN NH4-N Org-N NO3-N Total-N TP DRP
23/2/2016 8.2 11.0 4.9 2.9 2.0 6.90 11.80 3.3 2.7
29/2/2016 12.0 11.0 6.6 4.0 2.6 0.12 6.72 4.2 3.6
15/3/2016 2.6 5.9 5.4 3.5 1.9 0.45 5.85 4 0.0
30/3/2016 5.6 6.8 3.5 2.1 1.4 2.60 6.10 3.5 2.9
12/4/2016 6.8 8.7 1.7 0.4 1.3 0.88 2.58 3.1 2.4
26/4/2016 7.8 8.4 2.6 0.9 1.6 4.40 7.00 2.9 2.3
10/5/2016 7.6 4.7 4.3 2.8 1.5 3.00 7.30 3.8 4.0
24/5/2016 4.2 7.7 13.0 10.0 3.0 1.70 14.70 3.3 3.6
7/6/2016 2.0 8.4 11.0 8.0 3.0 0.76 11.76 3.5 2.7
21/6/2016 7.4 6.1 7.7 5.8 1.9 1.50 8.20 3.7 3.3
5/7/2016 5.0 8.1 7.1 5.3 1.8 1.90 9.00 2.9 2.5
19/7/2016 4.0 7.8 9.3 7.1 2.2 2.20 11.50 3.6 3.4
2/8/2016 5.8 9.1 14.0 11.0 3.0 3.70 17.70 3.7 3.2
17/8/2016 8.5 7.9 7.7 6.0 1.7 2.00 9.70 2.8 2.6
30/8/2016 8.8 8.0 6.7 4.8 1.9 3.20 9.90 2.1 1.9
Mean 6.4 7.9 7.0 4.9 2.1 2.35 9.32 3.4 2.7
Modern BTFs are capable of promoting high N assimilation (conversion of ammonical-N into
organic-N or bacterial cells) which must also result in high P assimilation. However, NIWA’s
sludge removal did not appear to result in high P removal with influent TP mean was being 3.9
g/m3 and after sludge removal the TP level remained at 3.4 g/m3 (Table 2).
Having an additional BTF in parallel can promote BTFs to produce high quality effluent. The
current BTF has demonstrated that it provides easily settleable solids which is a good
characteristic that must be maintained when operating two parallel BTFs.
Page 14
ENVIROKNOWLEDGE® 3 Dunrobin Street, Dunedin 9013 Phone 03 4776111
www.enviroknowledge.co.nz
ENVIROKNOWLEDGE® and NKnowledge® are registered trademarks.
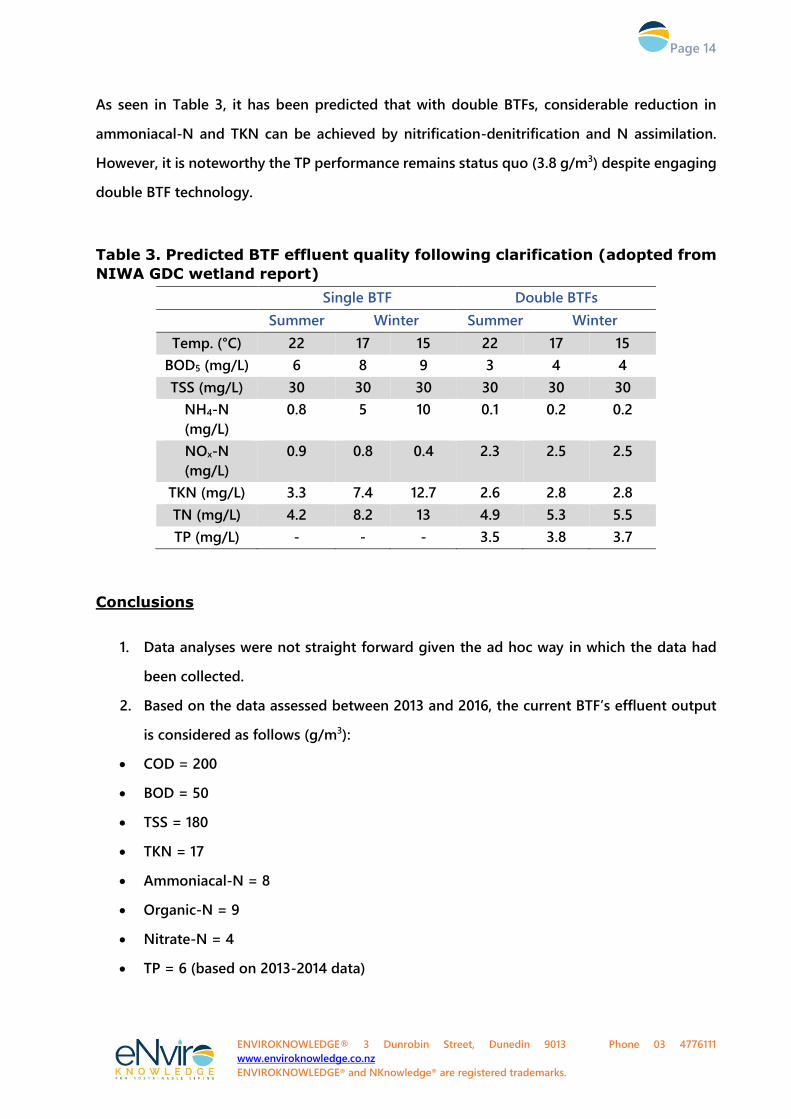
As seen in Table 3, it has been predicted that with double BTFs, considerable reduction in
ammoniacal-N and TKN can be achieved by nitrification-denitrification and N assimilation.
However, it is noteworthy the TP performance remains status quo (3.8 g/m3) despite engaging
double BTF technology.
Table 3. Predicted BTF effluent quality following clarification (adopted from
NIWA GDC wetland report)
Single BTF Double BTFs
Summer Winter Summer Winter
Temp. (°C) 22 17 15 22 17 15
BOD5 (mg/L) 6 8 9 3 4 4
TSS (mg/L) 30 30 30 30 30 30
NH4-N
(mg/L)
0.8 5 10 0.1 0.2 0.2
NOx-N
(mg/L)
0.9 0.8 0.4 2.3 2.5 2.5
TKN (mg/L) 3.3 7.4 12.7 2.6 2.8 2.8
TN (mg/L) 4.2 8.2 13 4.9 5.3 5.5
TP (mg/L) - - - 3.5 3.8 3.7
Conclusions
1. Data analyses were not straight forward given the ad hoc way in which the data had
been collected.
2. Based on the data assessed between 2013 and 2016, the current BTF’s effluent output
is considered as follows (g/m3):
COD = 200
BOD = 50
TSS = 180
TKN = 17
Ammoniacal-N = 8
Organic-N = 9
Nitrate-N = 4
TP = 6 (based on 2013-2014 data)
Page 15
ENVIROKNOWLEDGE® 3 Dunrobin Street, Dunedin 9013 Phone 03 4776111
www.enviroknowledge.co.nz
ENVIROKNOWLEDGE® and NKnowledge® are registered trademarks.
3. The current BTF treatment performance can be further optimised to improve N
treatment efficiency, mainly by N assimilation (conversion of ammoniacal-N to sludge-
N) and by promoting conditions conducive to nitrification. This would require data
collection on key contaminants such as SS, BOD, TKN, ammononiacal-N and nitrate-N
and aeration, raw influent volume, recirculation of BTF effluent, BTF or effluent
temperature and influent and effluent pH at least during the optimisation period.
4. The above step is critical in the decision making process in designing and implementing
the additional parallel BTF to improve the overall N output to be further treated by
methods such as constructed wetlands or for maintaining single BTF with constructed
wetland.
Recommended