Risk Management Division Property and Casualty Program Annual Report State Fiscal Year 2011
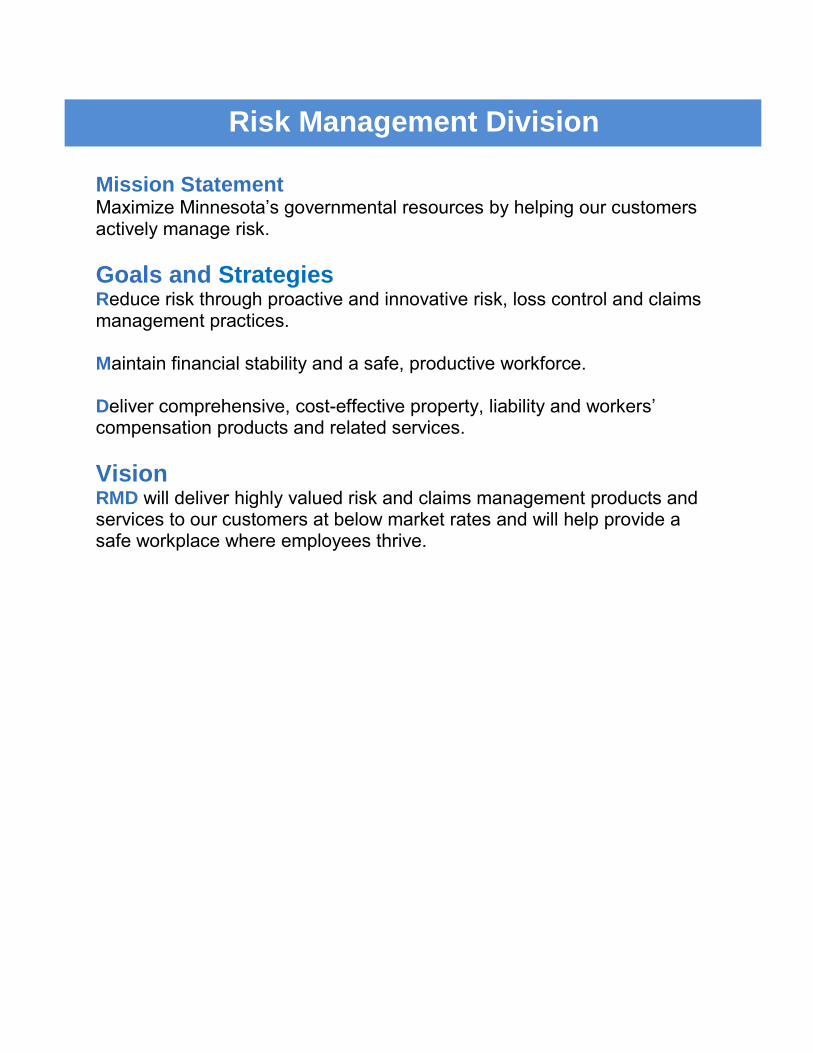
Mission Statement Maximize Minnesota’s governmental resources by helping our customers actively manage risk. Goals and Strategies Reduce risk through proactive and innovative risk, loss control and claims management practices. Maintain financial stability and a safe, productive workforce. Deliver comprehensive, cost-effective property, liability and workers’ compensation products and related services. Vision RMD will deliver highly valued risk and claims management products and services to our customers at below market rates and will help provide a safe workplace where employees thrive.
Risk Management Division
Executive Summary...………………………………………………………………1
Property and Casualty Program Staff…………………………………………….2
Risk Management Advisory Committee………………………………………….2
Customer Agencies and Political Subdivisions…………….……………..…3 - 4
The Year in Review…………………………………………………….…..…. 5 - 6
Safety and Loss Control Programs………………………………….……………7
Dividends....................................................................................................8 - 9
Division Summary of Operations………………………………….…….……….10
Underwriting Results…………………………….……………………........……..11
Financial Position Description………………….…..……………………….…....12
Risk Management Fund Performance………………………………...………...13
Financials……………………………………………………..……….………14 - 17
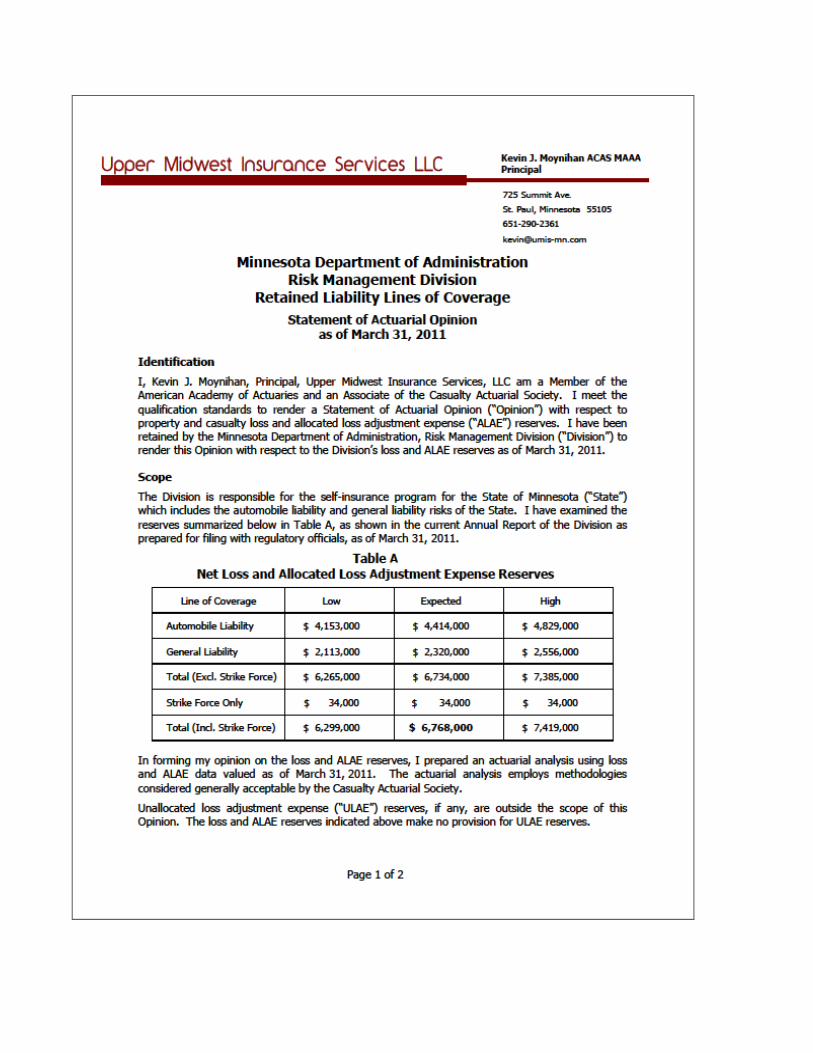
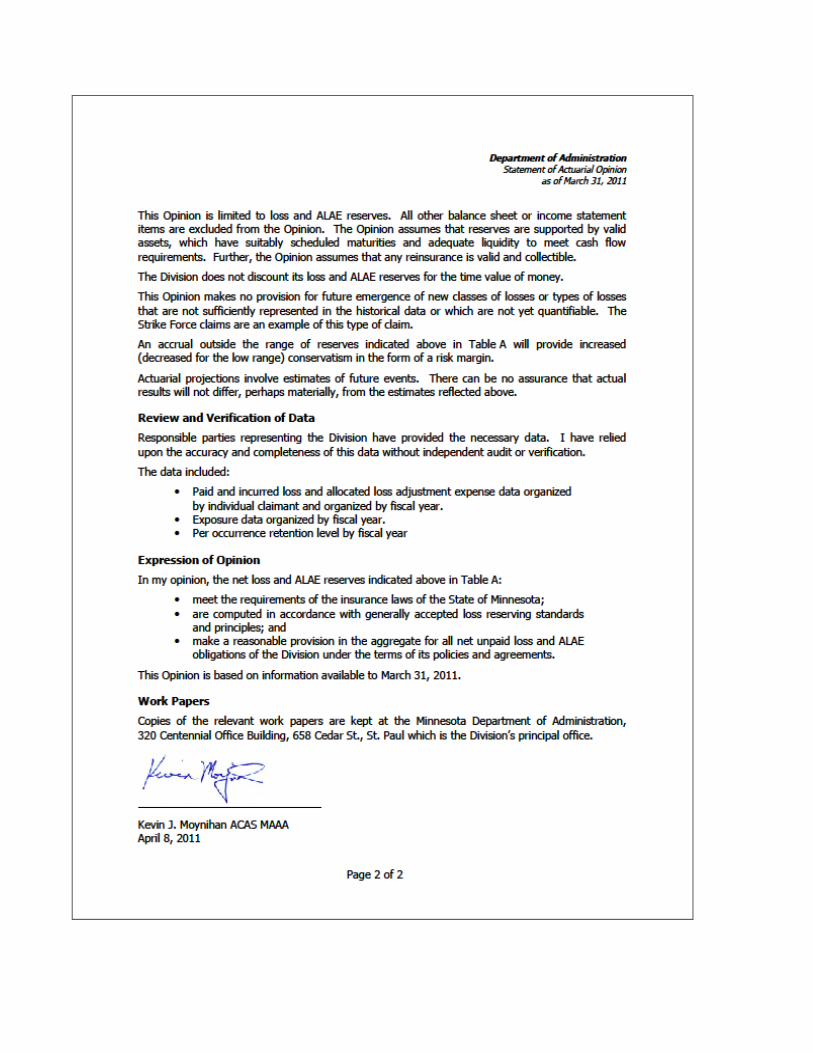
Statement of Actuarial Opinion………………………………...……………18 - 19
Table of Contents
FY2011 marked a year of new developments for the Risk Management Division (RMD):
• On July 1, RMD went “live” with a new website, consolidating information and useful tools into one package from our property and casualty, workers’ compensation, and safety programs. Easy access to forms, publications, and programs is a key feature of the new website, and customers are already finding that information is much more intuitive.
• The Risk Management Fund (RMF) proudly welcomed its 100th customer, Minnesota State Retirement System. Comprehensive coverage for their property and general liability exposures is now in place. The RMD is looking forward to the day when all state agencies are insured for property and casualty coverages.
• Liz Houlding, formerly the Workers’ Compensation Division Manager became the RMD Director. Liz’s first priority was to continue to work with RMD staff and AON eSolutions on the development of the new Risk Management Information System (RMIS). Once implemented, the new RMIS will be able to provide more meaningful claim feedback to customers, and drive down operating costs for the division by reducing the number of legacy systems into a more comprehensive system.
After several years of total incurred losses ranging from $2.6 million to a daunting $4.4 million, FY2011 took a turn in the right direction, with total incurred losses dropping to $1.1 million – the lowest since FY2007. We are optimistic that the progress made on the loss control front is paying off. A FY2011 fourth quarter combined loss ratio of less than 100 percent was achieved for all lines of business – auto liability, auto physical damage, general liability, and property. Additionally, the claim count has seen marked improvement over the past five years, which is also a positive sign. Next year marks a notable occasion - RMD’s 25th anniversary! As we move from one era to the next, we envision even more new developments to better serve our customers and to assist them in reducing risk through proactive and innovative risk, loss control, and claims management practices.
Executive Summary
Property and Casualty Program Staff David Agren Property and Casualty Manager 651.201.2594 [email protected] Tom Chukel Claims Manager 651.201.2592 [email protected] Bryan Freeman Senior Claim Representative 651.201.2586 [email protected] Carol Morgan Underwriting Risk Specialist
Erica Richards Claim Representative 651.201.2590 [email protected] Lea Shedlock Senior Claim Representative 651.201.2589 [email protected] Marlys Williamson Underwriting and Marketing Manager 651.201.2591 [email protected]
651.201.2593 [email protected]
Risk Management Fund Advisory Committee Katherine Barondeau Minnesota Management and Budget Larry Freund Department of Public Safety Fiscal and Administrative Services Todd Haglin Department of Transportation Wendy Hearn Best Buy Corporation Mary Lou Houde Department of Commerce Registration and Insurance Elizabeth Houlding Department of Administration Risk Management Division Bill Hoyt Metropolitan Airports Commission
Keswic Joiner Minnesota State Colleges and Universities John King Department of Corrections Tim Morse Department of Administration Fleet and Surplus Services Mary Pittelko State Agriculture Society (State Fair) Billi Sanders Department of Administration Financial Management and Reporting Dave Schiller Department of Natural Resources Andrew Whitman University of Minnesota
Customer Agencies and Political Subdivisions Agriculture, Department of
Amateur Sports Commission
Animal Health, Board of
Attorney General
Barber Examiners, Board of
Behavioral Health & Therapy, Board of
Chino Latino Affairs Council
Chiropractic Examiners, Board of
Commissioner’s Office, Dept of Administration
Corrections, Department of
Cosmetologist Examiners, Board of
Council on Black Minnesotans
Dentistry, Board of
Developmental Disabilities, Dept of
Administration
Dietetics & Nutrition Practice, Board of
Education, Department of
Emergency Medical Services Regulatory Board
Employment and Economic Development,
Department of
Enterprise Minnesota
Enterprise Technology, Office of
Explore Minnesota Tourism
Firefighter Training and Education, Board of
Fleet & Surplus Services, Dept of Administration
Gambling Control Board
Governor’s Office
Health, Department of
Higher Education Facilities Authority
Higher Education, Office of
Housing Finance Agency
Human Rights, Department of
Human Resources, Dept of Administration
Human Services, Department of
Indian Affairs Council
Information Policy Analysis Division, Dept of
Administration
Insurance Fraud Prevention Division, Dept of
Commerce
Investment Board
Iron Range Resources Agency
Judicial Standards, Board of
Labor & Industry, Department of
Lawyers Professional Responsibility Board
Management Analysis and Development,
Minnesota Management and Budget
Marriage & Family Therapy, Board of
Materials Management Division - Bookstore
& State Register, Dept of Administration
Mediation Services, Board of
Medical Practices, Board of
Metropolitan Airports Commission
Metropolitan Council
Metropolitan Emergency Services Board
Military Affairs, Department of
Minnesota Historical Society
Minnesota Judicial District Courts (Trial Courts)
Minnesota Racing Commission
Minnesota Sentencing Guidelines Commission
Minnesota State Academies
Minnesota State Council on Disability
Minnesota State Retirement System
MN Legislature – Office of the Revisor of
Statutes
MN State Lottery
MN State Colleges and Universities – all facilities
Natural Resources, Department of
Nursing, Board of
Nursing Home Administrators, Board of
Examiners for
Ombudsman for Mental Health and
Developmental Disabilities
Ombudsperson for Families, Office of
Optometry, Board of
Pennington County
Perpich Center for Arts Education
Pharmacy (ASU), Board of
Physical Therapy, Board of
Plant Management Division & Central Mail,
Dept of Administration
Podiatric Medicine, Board of
Pollution Control Agency
Port Authority of the City of Saint Paul
Psychology, Board of
Public Defense, Board of
Public Employees Retirement Association
Public Safety, Department of
Public Services, Weights & Measures
Public Utilities Commission
Real Estate & Construction Svs, Dept of
Administration
Revenue, Department of
Risk Management, Dept of Administration
Secretary of State
Social Work, Board of
STAR Program, Dept of Adminsitration
State Agricultural Society (Minnesota State Fair)
State Arts Board
State Armory Building Commission
State Auditor
Supreme Court – State Court Administration/
Law Library/Court of Appeals
Supreme Court – Board of Law Examiners
Teachers Retirement Association
Transportation, Department of
Veterans Affairs – Central Office
Veterans Homes, Veterans Affairs
Veterinary Medicine, Board of
Water and Soil Resources, Board of
Zoological Gardens
The Year in Review Reinsurance The property program, covering close to $12 billion in real and personal property, saw a 2 percent rate increase for the FY2011 term. Although there were no program enhancements for FY2011, there have been periodic improvements in terms and conditions throughout the eight years that the program has been in effect, which have afforded greater protection for the RMF. The excess casualty program sustained a modest premium increase of less than 1 percent. This was due to a reduction in the retention (deductible), from $1.5 million to $1 million, for the separate excess auto liability policy for MN State Colleges and Universities (MnSCU). Additionally, since the RMF received the direct benefit from the retention reduction on the MnSCU policy, the RMF funded the premium for this policy amendment (approximately $20,000). Purchased Insurance After receiving a 35 percent rate reduction in FY2009, the renewal rate for the state’s aviation program remained flat for FY2010 and FY2011. All indications are that the current aviation program rate is still about as low as the current insurance marketplace will bear. Public Project
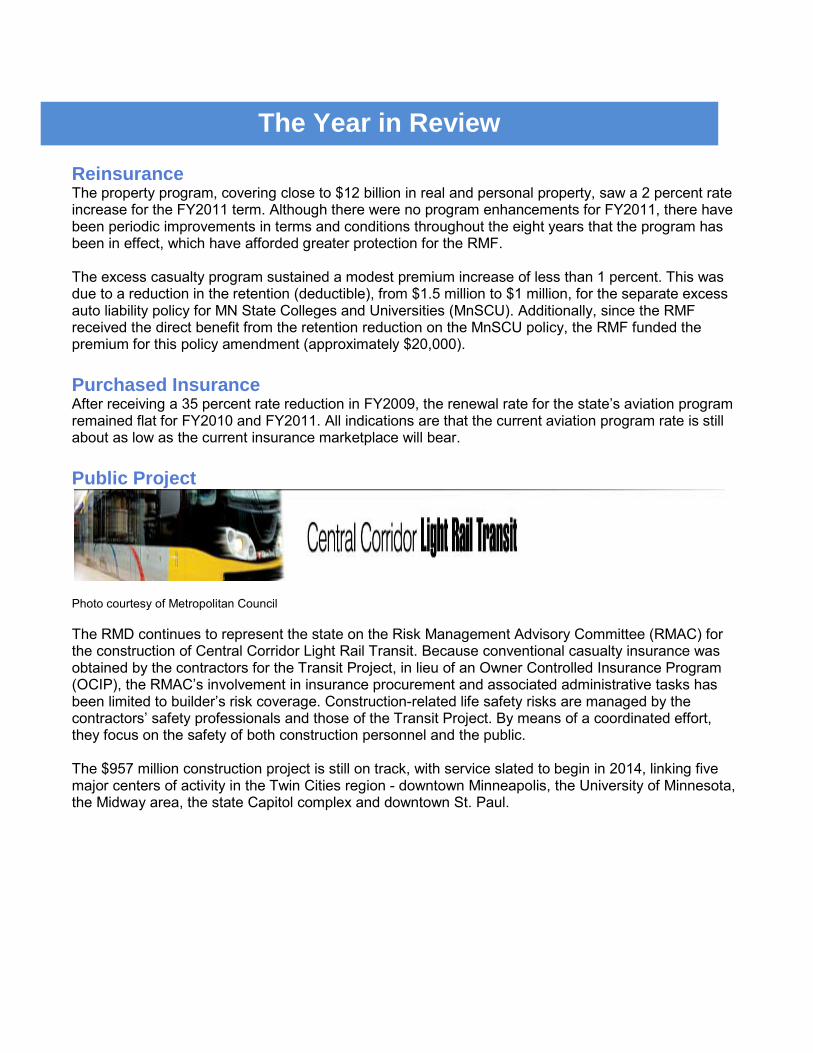
Photo courtesy of Metropolitan Council The RMD continues to represent the state on the Risk Management Advisory Committee (RMAC) for the construction of Central Corridor Light Rail Transit. Because conventional casualty insurance was obtained by the contractors for the Transit Project, in lieu of an Owner Controlled Insurance Program (OCIP), the RMAC’s involvement in insurance procurement and associated administrative tasks has been limited to builder’s risk coverage. Construction-related life safety risks are managed by the contractors’ safety professionals and those of the Transit Project. By means of a coordinated effort, they focus on the safety of both construction personnel and the public. The $957 million construction project is still on track, with service slated to begin in 2014, linking five major centers of activity in the Twin Cities region - downtown Minneapolis, the University of Minnesota, the Midway area, the state Capitol complex and downtown St. Paul.
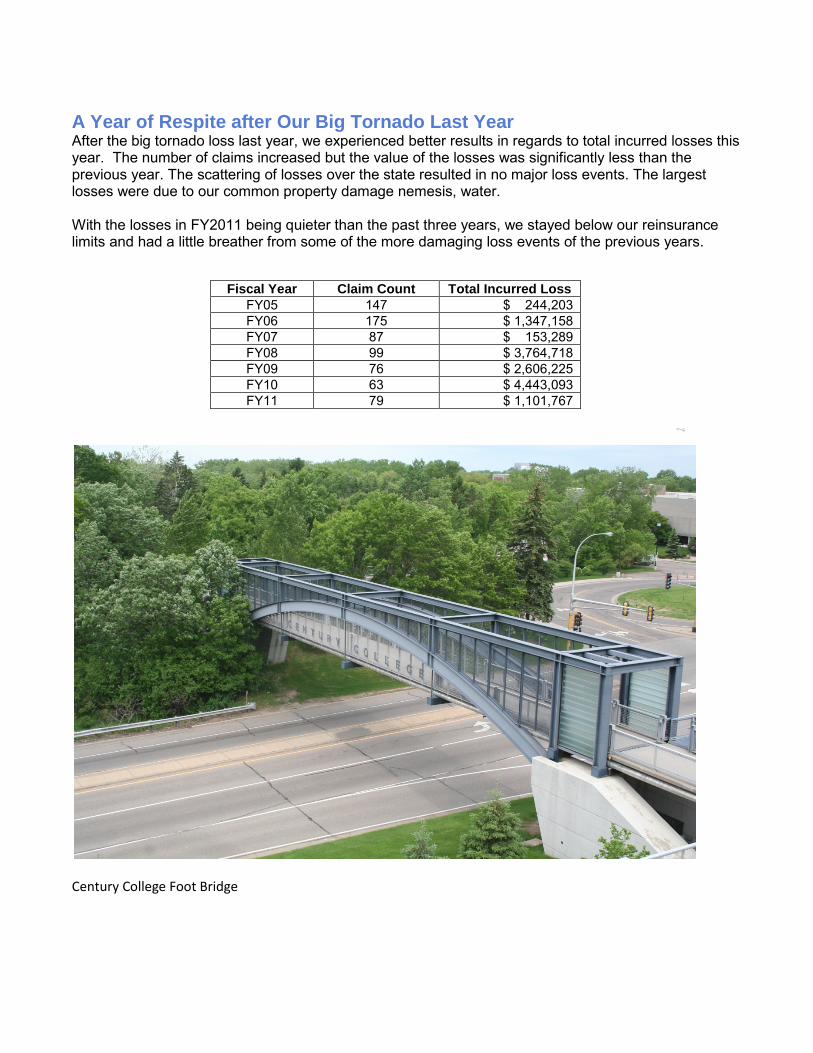
A Year of Respite after Our Big Tornado Last Year After the big tornado loss last year, we experienced better results in regards to total incurred losses this year. The number of claims increased but the value of the losses was significantly less than the previous year. The scattering of losses over the state resulted in no major loss events. The largest losses were due to our common property damage nemesis, water. With the losses in FY2011 being quieter than the past three years, we stayed below our reinsurance limits and had a little breather from some of the more damaging loss events of the previous years.
Fiscal Year Claim Count Total Incurred Loss FY05 147 $ 244,203 FY06 175 $ 1,347,158 FY07 87 $ 153,289 FY08 99 $ 3,764,718 FY09 76 $ 2,606,225 FY10 63 $ 4,443,093 FY11 79 $ 1,101,767
Century College Foot Bridge
Fundamental to the mission of RMD is reducing risk through proactive and innovative risk, loss control and claims management practices. Toward this goal, the division provides policyholders with several gratis loss prevention services. These loss control programs assist policyholders in identifying property protection deficiencies and addressing life safety issues while achieving the ultimate goal of protecting public assets. COPE COPE, an acronym for construction, occupancy, protection and exposure, helps to make sure that state properties insured by the RMF are in compliance with fire and life safety requirements. The building-specific program features the COPE survey, which includes an examination of sprinkler and alarm systems, fire pumps, flammable liquid storage and other property exposures. Infrared Electrical Systems Survey An Infrared Electrical Systems Survey involves the use of thermal imaging equipment to locate and identify anomalies within the electrical distribution system of a building. Electrical distribution components are designed to operate within a specific temperature range. When the operating temperature exceeds the designed level, damage or failure may occur. Anomalies include faulty connections, overloaded circuits, or other problems that have the potential for unscheduled shutdown, serious equipment damage, or to be a fire source. Appraisals Accurate and current appraisals are important for maintaining an effective, efficient insurance program. With over $9 billion in state-owned real property under coverage by the RMF, it is critical that the monetary values of each property are an accurate reflection of the cost of replacing the building in the event of a catastrophic event. RMD utilizes the services of an independent, nationally recognized firm to physically survey state buildings and provide a formal property appraisal. Automobile Fleet Safety With approximately 10,900 on-road vehicles – from highway snowplow trucks to compact passenger cars – under coverage, automobile fleet safety is of paramount concern for the state. Minnesota’s Model Fleet Safety Standards, introduced in 2006 and developed by RMD and its state agency partners, provide guidance for the safe use of state fleet assets. As a further step toward ensuring safe fleet operations, the state implemented a policy on drivers’ license and record checks for state employees who drive state vehicles. The RMD provides state agencies with the record-check process at no additional charge.
Safety and Loss Control Programs
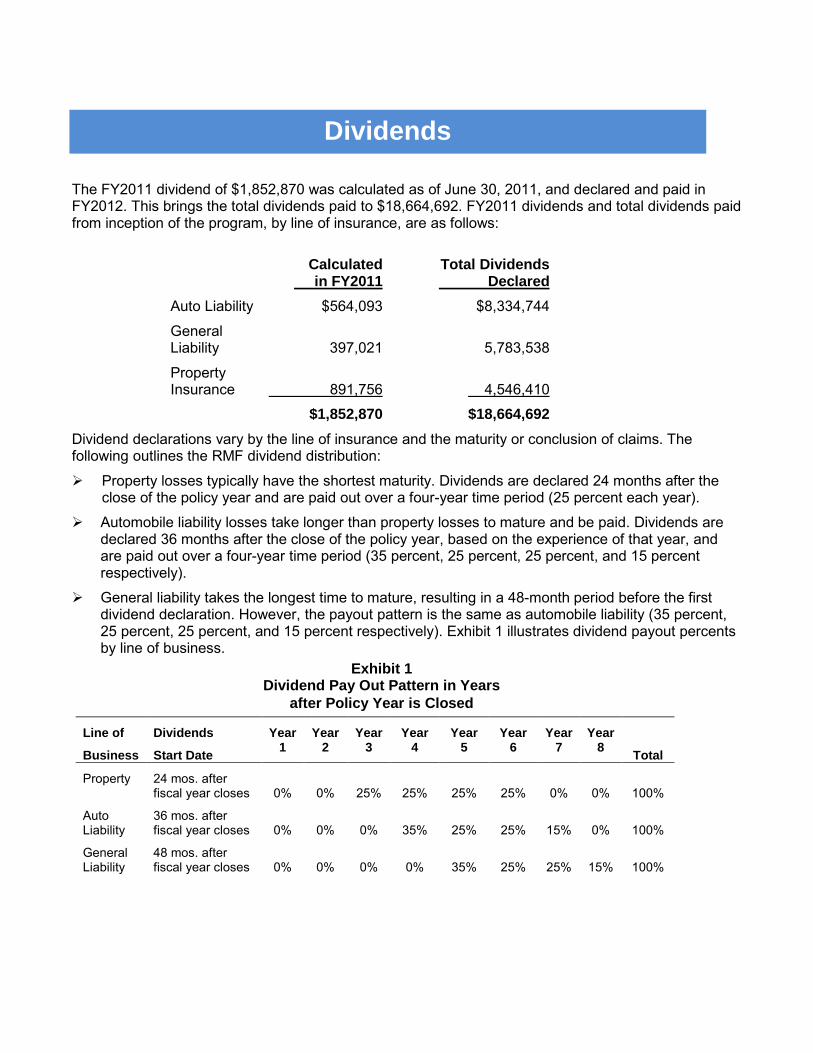
The FY2011 dividend of $1,852,870 was calculated as of June 30, 2011, and declared and paid in FY2012. This brings the total dividends paid to $18,664,692. FY2011 dividends and total dividends paid from inception of the program, by line of insurance, are as follows:
Calculated Total Dividends in FY2011 Declared
Auto Liability $564,093 $8,334,744
General Liability 397,021 5,783,538
Property Insurance 891,756 4,546,410
$1,852,870 $18,664,692
Dividend declarations vary by the line of insurance and the maturity or conclusion of claims. The following outlines the RMF dividend distribution:
Property losses typically have the shortest maturity. Dividends are declared 24 months after the close of the policy year and are paid out over a four-year time period (25 percent each year).
Automobile liability losses take longer than property losses to mature and be paid. Dividends are declared 36 months after the close of the policy year, based on the experience of that year, and are paid out over a four-year time period (35 percent, 25 percent, 25 percent, and 15 percent respectively).
General liability takes the longest time to mature, resulting in a 48-month period before the first dividend declaration. However, the payout pattern is the same as automobile liability (35 percent, 25 percent, 25 percent, and 15 percent respectively). Exhibit 1 illustrates dividend payout percents by line of business.
Line of
Business
Dividends
Start Date
Year 1
Year 2
Year 3
Year 4
Year 5
Year 6
Year 7
Year 8
Total
Property 24 mos. after fiscal year closes
0%
0%
25%
25%
25%
25%
0%
0%
100%
Auto Liability
36 mos. after fiscal year closes
0%
0%
0%
35%
25%
25%
15%
0%
100%
General Liability
48 mos. after fiscal year closes
0%
0%
0%
0%
35%
25%
25%
15%
100%
Exhibit 1 Dividend Pay Out Pattern in Years
after Policy Year is Closed
Dividends
Dividends represent the return of premium for superior loss and expense experience. Premium funds collected are invested by the state’s Board of Investment. The difference between premium and investment income, less deductions for incurred losses and loss adjustment expenses, administrative expenses, and reinsurance costs, equals the amount of funds that are eligible for dividend declaration. The evaluation process to determine how much, if any, dividends will be paid involves the analysis of each line of insurance. This analysis takes into account the RMF’s performance for each line of business for each policy year. If there is a positive balance and sufficient development time has elapsed, a dividend is determined for that year and line of business.
In the event of unsatisfactory experience, it is possible that no dividend will be declared or a favorable year’s dividend will be used to offset the poor experience. This approach creates a more level dividend over time, and also minimizes the possibility of a premium assessment, which can be very disruptive to an agency’s budget.
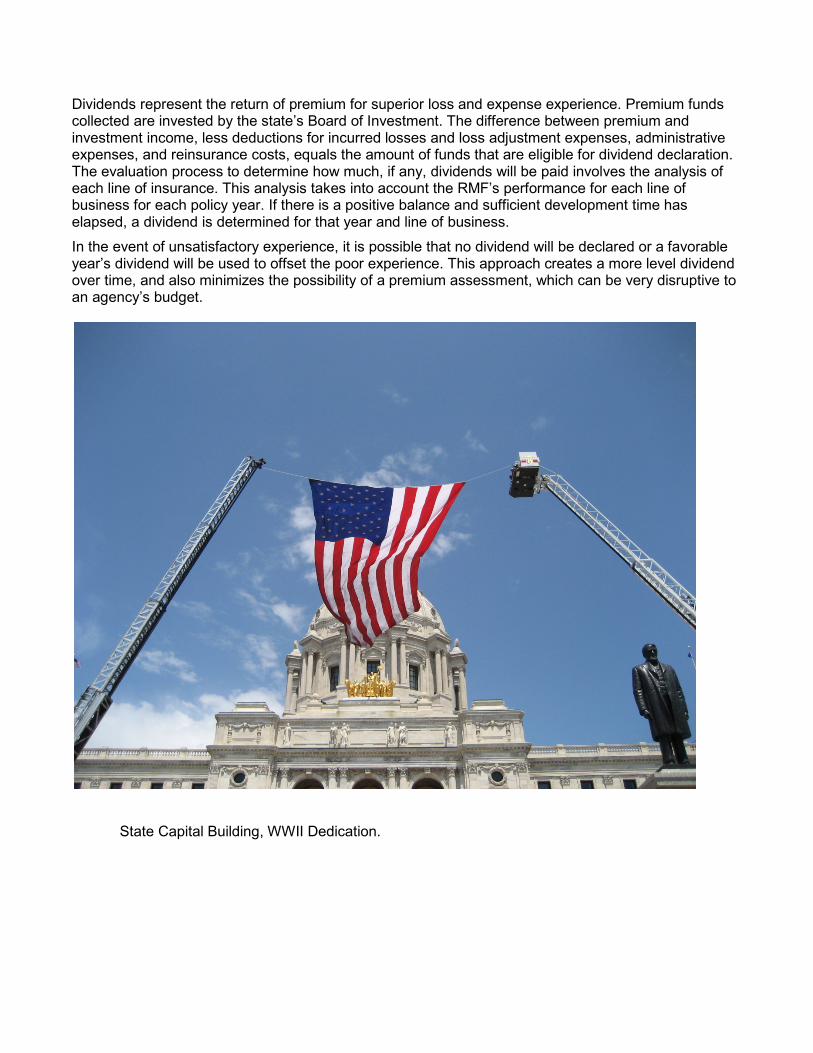
State Capital Building, WWII Dedication.
In FY2011, the RMD continued to provide four major areas of service to state departments, boards, bureaus, commissions, and component units of the state of Minnesota, as well as political subdivisions. Key services include:
♦ Managing the RMF, which operates as the state’s internal insurance company. The fund provides property and casualty insurance coverage’s that are tailored to meet the needs of customers.
♦ Purchasing commercial insurance to meet customers’ needs when the placement of insurance coverage in the RMF may not be appropriate or cost effective.
♦ Providing risk management consulting and training services for customers on a wide variety of safety, loss control, insurance and other issues.
♦ Providing internal underwriting, loss control, and claims expertise that best serves the unique needs of customers.
The RMD annually develops a business plan for each line of insurance underwritten by the RMF. Each line of insurance is evaluated for the development of losses, adjusting expenses, reinsurance expenses, and administrative expenses.
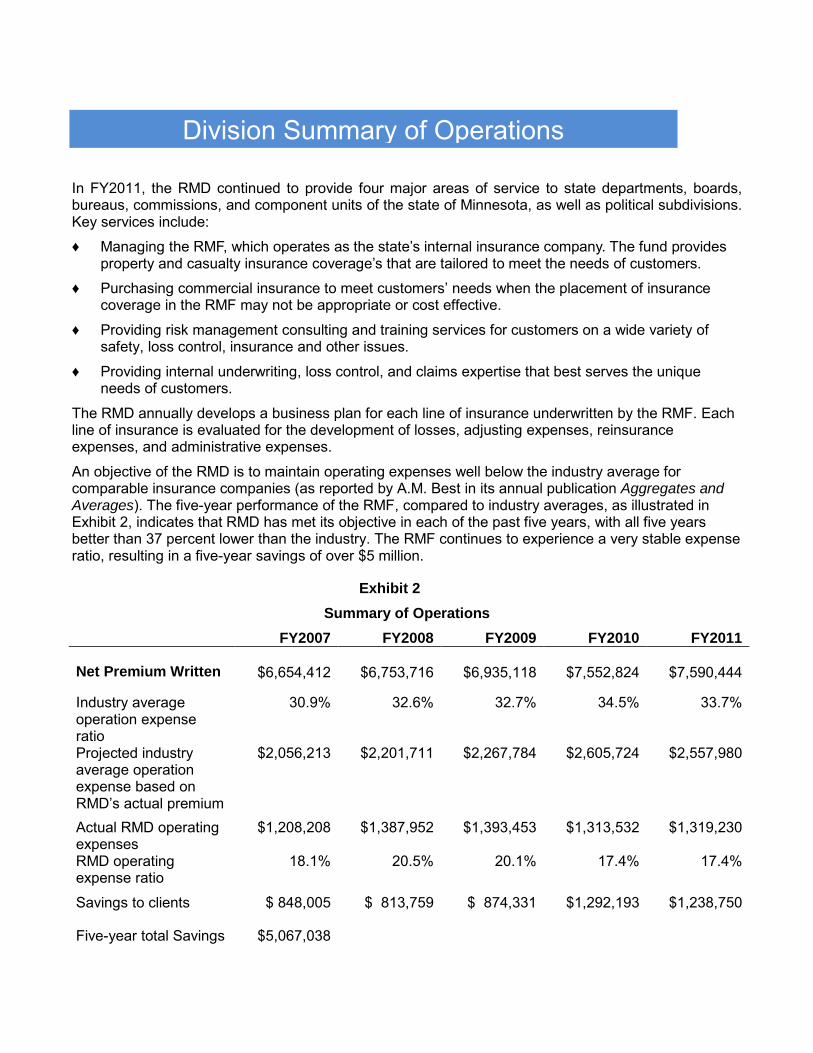
An objective of the RMD is to maintain operating expenses well below the industry average for comparable insurance companies (as reported by A.M. Best in its annual publication Aggregates and Averages). The five-year performance of the RMF, compared to industry averages, as illustrated in Exhibit 2, indicates that RMD has met its objective in each of the past five years, with all five years better than 37 percent lower than the industry. The RMF continues to experience a very stable expense ratio, resulting in a five-year savings of over $5 million.
Exhibit 2 Summary of Operations
FY2007 FY2008 FY2009 FY2010 FY2011
Net Premium Written
$6,654,412
$6,753,716
$6,935,118
$7,552,824
$7,590,444
Industry average operation expense ratio
30.9% 32.6% 32.7% 34.5% 33.7%
Projected industry average operation expense based on RMD’s actual premium
$2,056,213 $2,201,711 $2,267,784 $2,605,724
$2,557,980
Actual RMD operating expenses
$1,208,208
$1,387,952 $1,393,453 $1,313,532 $1,319,230
RMD operating expense ratio
18.1% 20.5% 20.1% 17.4% 17.4%
Savings to clients $ 848,005 $ 813,759 $ 874,331 $1,292,193 $1,238,750
Five-year total Savings $5,067,038
Division Summary of Operations
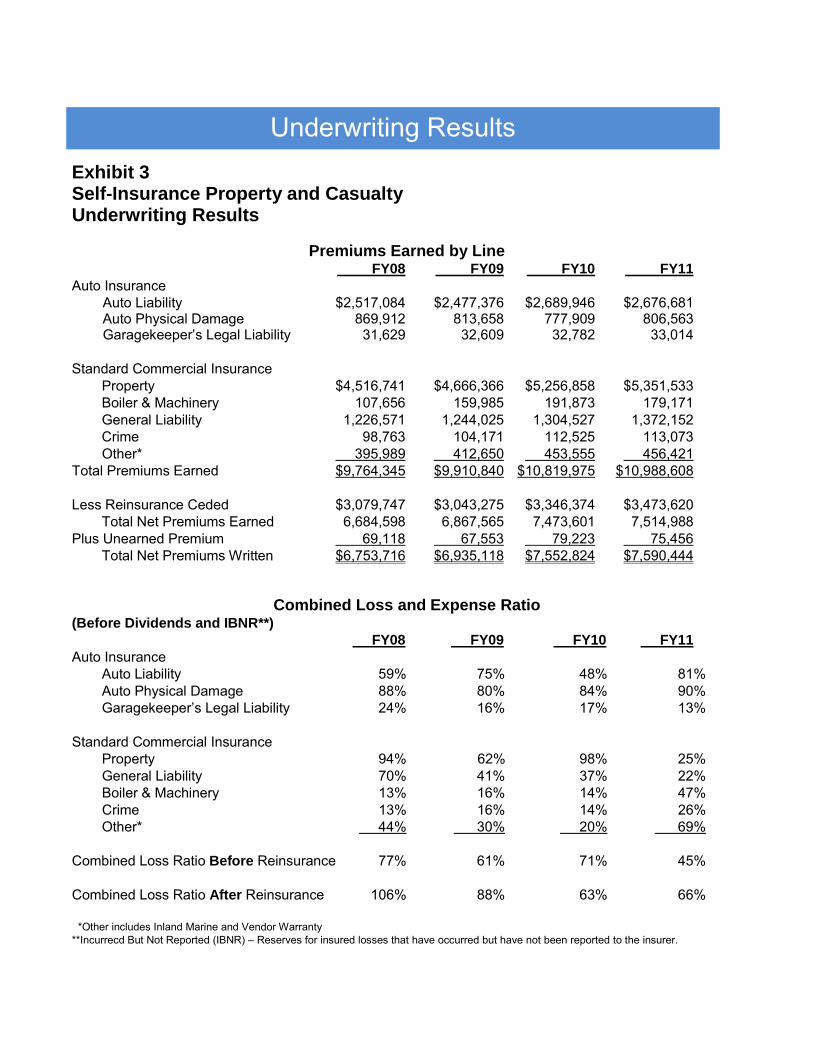
Exhibit 3 Self-Insurance Property and Casualty Underwriting Results
Premiums Earned by Line FY08 FY09 FY10 FY11 Auto Insurance Auto Liability $2,517,084 $2,477,376 $2,689,946 $2,676,681 Auto Physical Damage 869,912 813,658 777,909 806,563 Garagekeeper’s Legal Liability 31,629 32,609 32,782 33,014 Standard Commercial Insurance Property $4,516,741 $4,666,366 $5,256,858 $5,351,533 Boiler & Machinery 107,656 159,985 191,873 179,171 General Liability 1,226,571 1,244,025 1,304,527 1,372,152 Crime 98,763 104,171 112,525 113,073 Other* 395,989 412,650 453,555 456,421 Total Premiums Earned $9,764,345 $9,910,840 $10,819,975 $10,988,608 Less Reinsurance Ceded $3,079,747 $3,043,275 $3,346,374 $3,473,620 Total Net Premiums Earned 6,684,598 6,867,565 7,473,601 7,514,988 Plus Unearned Premium 69,118 67,553 79,223 75,456 Total Net Premiums Written $6,753,716 $6,935,118 $7,552,824 $7,590,444
Combined Loss and Expense Ratio (Before Dividends and IBNR**) FY08 FY09 FY10 FY11 Auto Insurance Auto Liability 59% 75% 48% 81% Auto Physical Damage 88% 80% 84% 90% Garagekeeper’s Legal Liability 24% 16% 17% 13% Standard Commercial Insurance Property 94% 62% 98% 25% General Liability 70% 41% 37% 22% Boiler & Machinery 13% 16% 14% 47% Crime 13% 16% 14% 26% Other* 44% 30% 20% 69% Combined Loss Ratio Before Reinsurance 77% 61% 71% 45% Combined Loss Ratio After Reinsurance 106% 88% 63% 66% *Other includes Inland Marine and Vendor Warranty **Incurrecd But Not Reported (IBNR) – Reserves for insured losses that have occurred but have not been reported to the insurer.
Underwriting Results
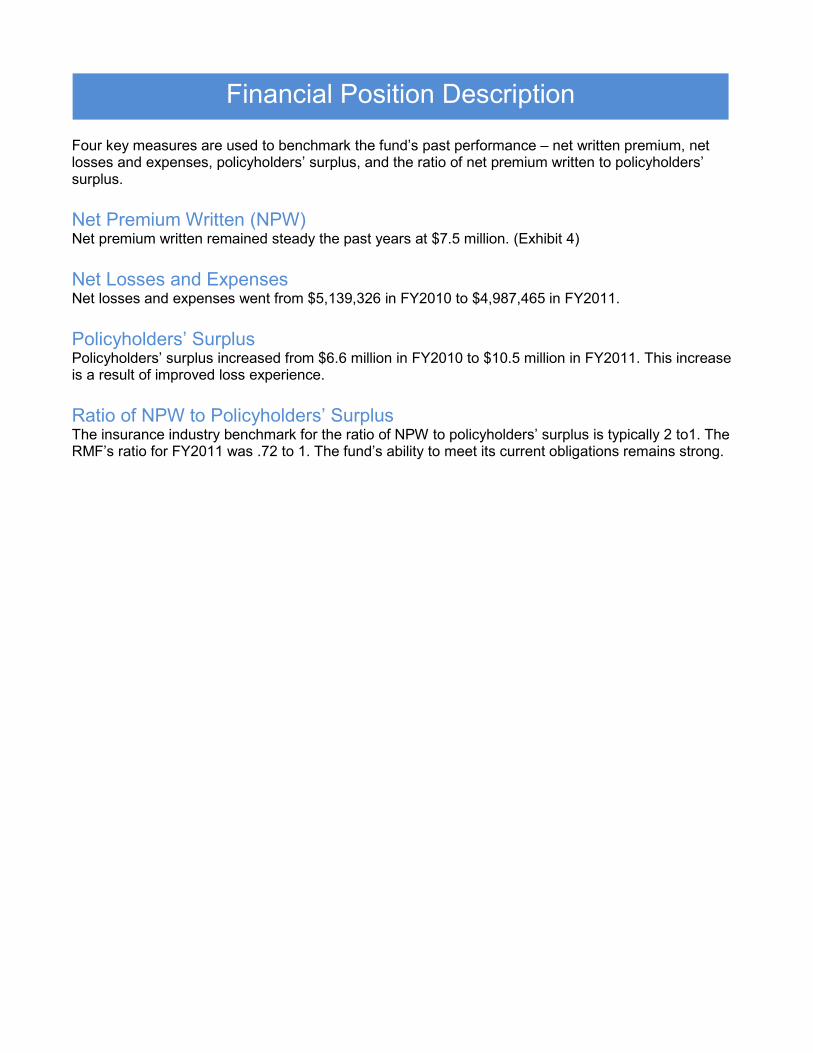
Four key measures are used to benchmark the fund’s past performance – net written premium, net losses and expenses, policyholders’ surplus, and the ratio of net premium written to policyholders’ surplus. Net Premium Written (NPW) Net premium written remained steady the past years at $7.5 million. (Exhibit 4) Net Losses and Expenses Net losses and expenses went from $5,139,326 in FY2010 to $4,987,465 in FY2011. Policyholders’ Surplus Policyholders’ surplus increased from $6.6 million in FY2010 to $10.5 million in FY2011. This increase is a result of improved loss experience. Ratio of NPW to Policyholders’ Surplus The insurance industry benchmark for the ratio of NPW to policyholders’ surplus is typically 2 to1. The RMF’s ratio for FY2011 was .72 to 1. The fund’s ability to meet its current obligations remains strong.
Financial Position Description
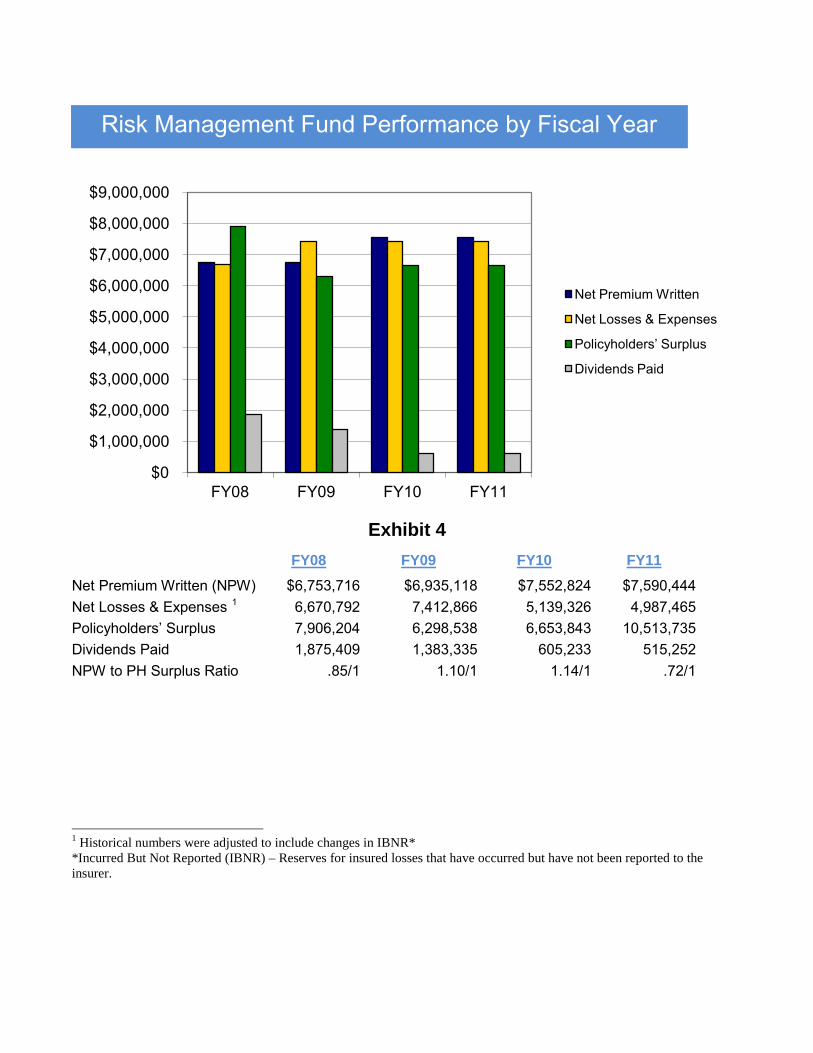
Exhibit 4
FY08 FY09 FY10 FY11 Net Premium Written (NPW) $6,753,716 $6,935,118 $7,552,824 $7,590,444 Net Losses & Expenses 1 6,670,792 7,412,866 5,139,326 4,987,465 Policyholders’ Surplus 7,906,204 6,298,538 6,653,843 10,513,735 Dividends Paid 1,875,409 1,383,335 605,233 515,252 NPW to PH Surplus Ratio .85/1 1.10/1 1.14/1 .72/1 1 Historical numbers were adjusted to include changes in IBNR* *Incurred But Not Reported (IBNR) – Reserves for insured losses that have occurred but have not been reported to the insurer.
$0
$1,000,000
$2,000,000
$3,000,000
$4,000,000
$5,000,000
$6,000,000
$7,000,000
$8,000,000
$9,000,000
FY08 FY09 FY10 FY11
Net Premium Written
Net Losses & Expenses
Policyholders’ Surplus
Dividends Paid
Risk Management Fund Performance by Fiscal Year
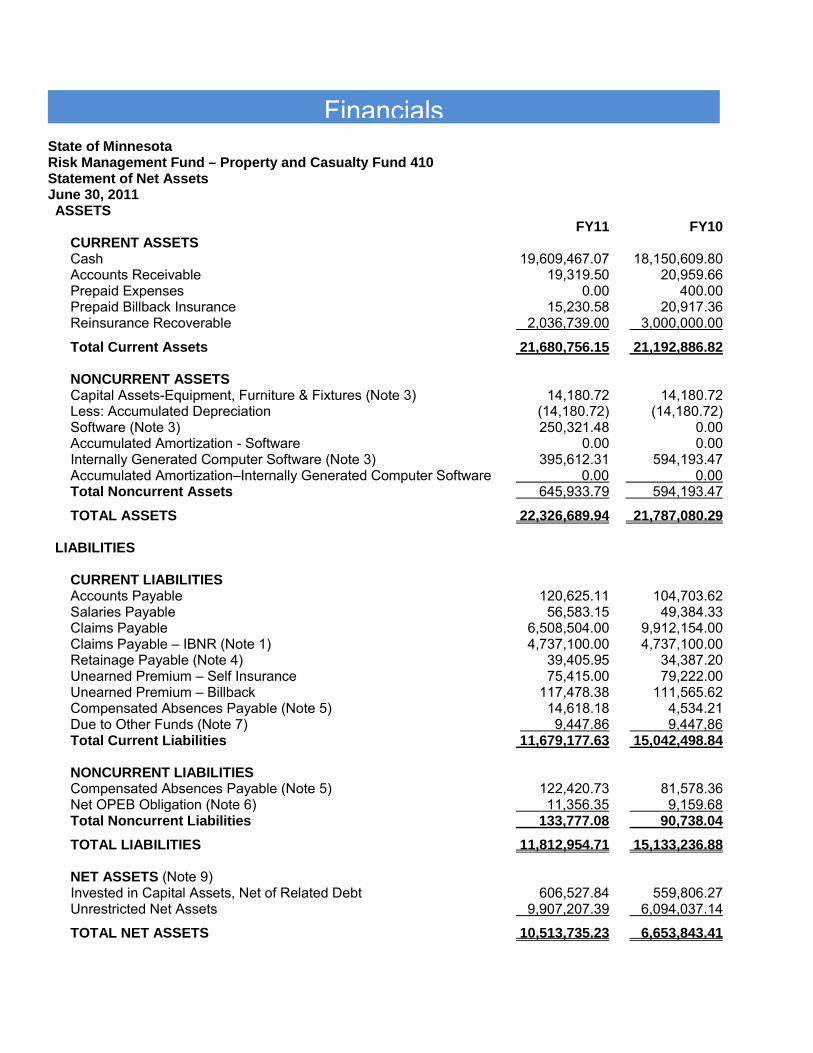
State of Minnesota Risk Management Fund – Property and Casualty Fund 410 Statement of Net Assets June 30, 2011 ASSETS FY11 FY10 CURRENT ASSETS Cash 19,609,467.07 18,150,609.80 Accounts Receivable 19,319.50 20,959.66 Prepaid Expenses 0.00 400.00 Prepaid Billback Insurance 15,230.58 20,917.36 Reinsurance Recoverable 2,036,739.00 3,000,000.00
Total Current Assets 21,680,756.15 21,192,886.82 NONCURRENT ASSETS Capital Assets-Equipment, Furniture & Fixtures (Note 3) 14,180.72 14,180.72 Less: Accumulated Depreciation (14,180.72) (14,180.72) Software (Note 3) 250,321.48 0.00 Accumulated Amortization - Software 0.00 0.00 Internally Generated Computer Software (Note 3) 395,612.31 594,193.47 Accumulated Amortization–Internally Generated Computer Software 0.00 0.00 Total Noncurrent Assets 645,933.79 594,193.47
TOTAL ASSETS 22,326,689.94 21,787,080.29 LIABILITIES CURRENT LIABILITIES Accounts Payable 120,625.11 104,703.62 Salaries Payable 56,583.15 49,384.33 Claims Payable 6,508,504.00 9,912,154.00 Claims Payable – IBNR (Note 1) 4,737,100.00 4,737,100.00 Retainage Payable (Note 4) 39,405.95 34,387.20 Unearned Premium – Self Insurance 75,415.00 79,222.00 Unearned Premium – Billback 117,478.38 111,565.62 Compensated Absences Payable (Note 5) 14,618.18 4,534.21 Due to Other Funds (Note 7) 9,447.86 9,447,86 Total Current Liabilities 11,679,177.63 15,042,498.84 NONCURRENT LIABILITIES Compensated Absences Payable (Note 5) 122,420.73 81,578.36 Net OPEB Obligation (Note 6) 11,356.35 9,159.68 Total Noncurrent Liabilities 133,777.08 90,738.04 TOTAL LIABILITIES 11,812,954.71 15,133,236.88 NET ASSETS (Note 9) Invested in Capital Assets, Net of Related Debt 606,527.84 559,806.27 Unrestricted Net Assets 9,907,207.39 6,094,037.14
TOTAL NET ASSETS 10,513,735.23 6,653,843.41
Financials
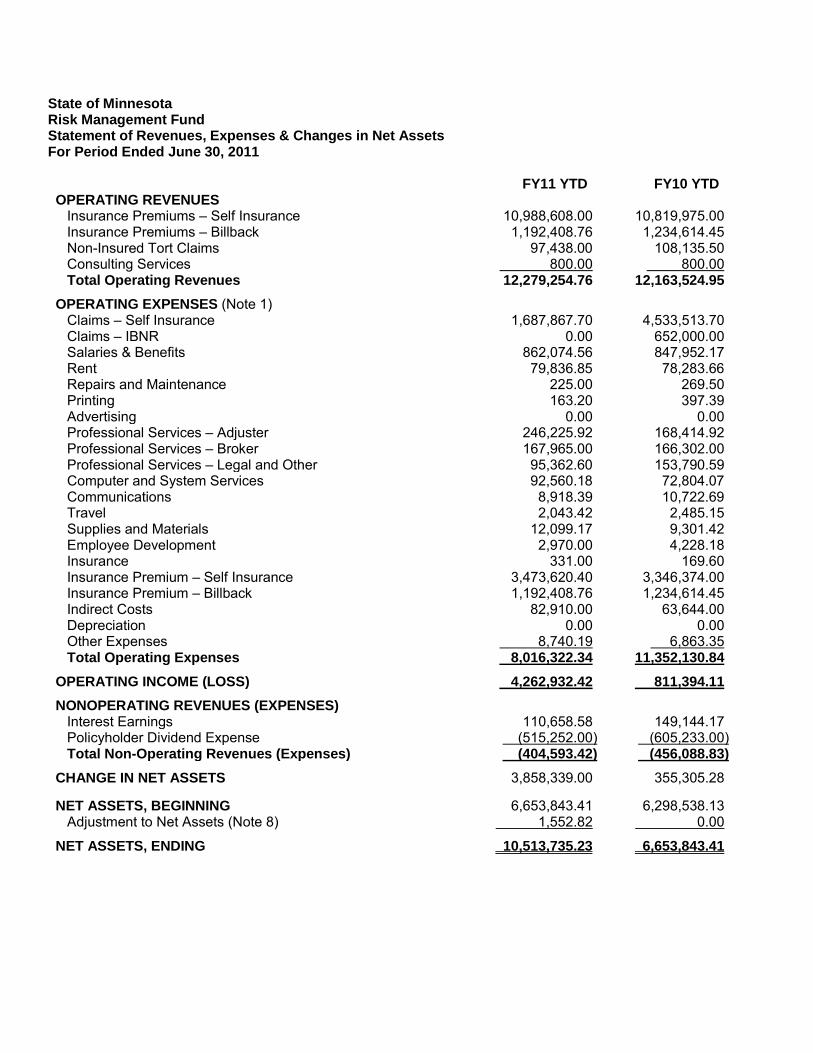
State of Minnesota Risk Management Fund Statement of Revenues, Expenses & Changes in Net Assets For Period Ended June 30, 2011
FY11 YTD FY10 YTD OPERATING REVENUES Insurance Premiums – Self Insurance 10,988,608.00 10,819,975.00 Insurance Premiums – Billback 1,192,408.76 1,234,614.45 Non-Insured Tort Claims 97,438.00 108,135.50 Consulting Services 800.00 800.00 Total Operating Revenues 12,279,254.76 12,163,524.95 OPERATING EXPENSES (Note 1) Claims – Self Insurance 1,687,867.70 4,533,513.70 Claims – IBNR 0.00 652,000.00 Salaries & Benefits 862,074.56 847,952.17 Rent 79,836.85 78,283.66 Repairs and Maintenance 225.00 269.50 Printing 163.20 397.39 Advertising 0.00 0.00 Professional Services – Adjuster 246,225.92 168,414.92 Professional Services – Broker 167,965.00 166,302.00 Professional Services – Legal and Other 95,362.60 153,790.59 Computer and System Services 92,560.18 72,804.07 Communications 8,918.39 10,722.69 Travel 2,043.42 2,485.15 Supplies and Materials 12,099.17 9,301.42 Employee Development 2,970.00 4,228.18 Insurance 331.00 169.60 Insurance Premium – Self Insurance 3,473,620.40 3,346,374.00 Insurance Premium – Billback 1,192,408.76 1,234,614.45 Indirect Costs 82,910.00 63,644.00 Depreciation 0.00 0.00 Other Expenses 8,740.19 6,863.35 Total Operating Expenses 8,016,322.34 11,352,130.84 OPERATING INCOME (LOSS) 4,262,932.42 811,394.11 NONOPERATING REVENUES (EXPENSES) Interest Earnings 110,658.58 149,144.17 Policyholder Dividend Expense (515,252.00) (605,233.00) Total Non-Operating Revenues (Expenses) (404,593.42) (456,088.83) CHANGE IN NET ASSETS 3,858,339.00 355,305.28
NET ASSETS, BEGINNING 6,653,843.41 6,298,538.13 Adjustment to Net Assets (Note 8) 1,552.82 0.00
NET ASSETS, ENDING 10,513,735.23 6,653,843.41
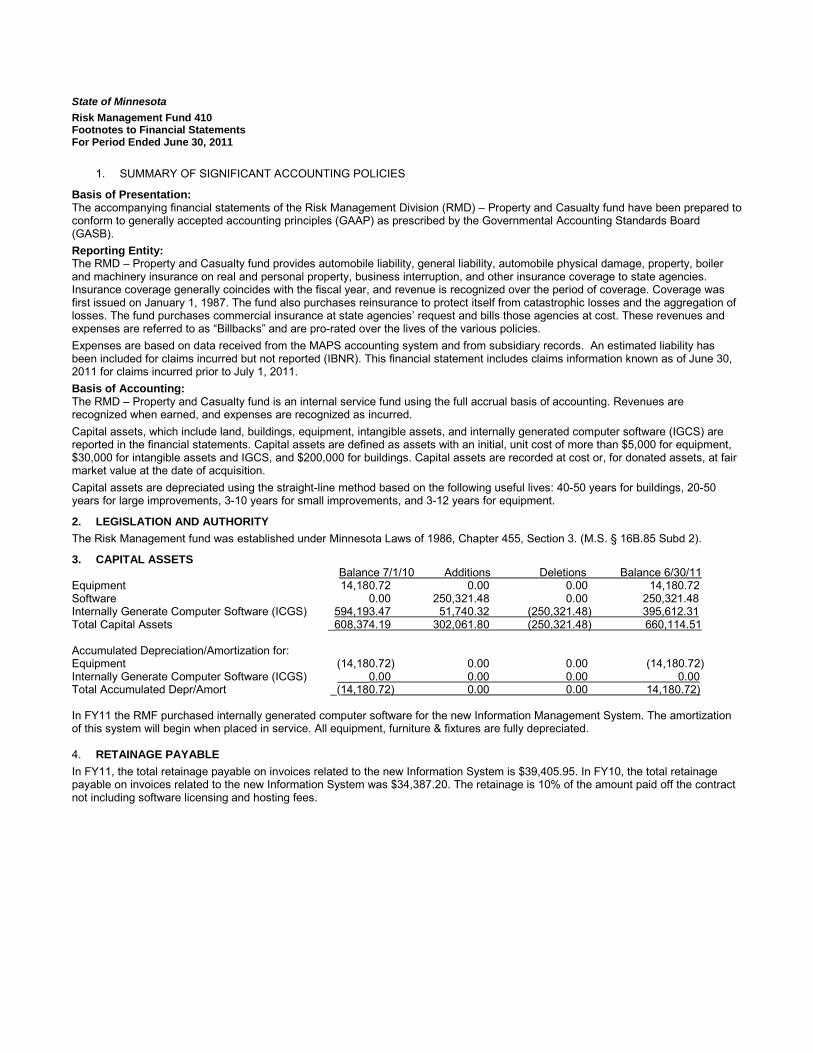
State of Minnesota Risk Management Fund 410 Footnotes to Financial Statements For Period Ended June 30, 2011
1. SUMMARY OF SIGNIFICANT ACCOUNTING POLICIES
Basis of Presentation: The accompanying financial statements of the Risk Management Division (RMD) – Property and Casualty fund have been prepared to conform to generally accepted accounting principles (GAAP) as prescribed by the Governmental Accounting Standards Board (GASB). Reporting Entity: The RMD – Property and Casualty fund provides automobile liability, general liability, automobile physical damage, property, boiler and machinery insurance on real and personal property, business interruption, and other insurance coverage to state agencies. Insurance coverage generally coincides with the fiscal year, and revenue is recognized over the period of coverage. Coverage was first issued on January 1, 1987. The fund also purchases reinsurance to protect itself from catastrophic losses and the aggregation of losses. The fund purchases commercial insurance at state agencies’ request and bills those agencies at cost. These revenues and expenses are referred to as “Billbacks” and are pro-rated over the lives of the various policies. Expenses are based on data received from the MAPS accounting system and from subsidiary records. An estimated liability has been included for claims incurred but not reported (IBNR). This financial statement includes claims information known as of June 30, 2011 for claims incurred prior to July 1, 2011. Basis of Accounting: The RMD – Property and Casualty fund is an internal service fund using the full accrual basis of accounting. Revenues are recognized when earned, and expenses are recognized as incurred. Capital assets, which include land, buildings, equipment, intangible assets, and internally generated computer software (IGCS) are reported in the financial statements. Capital assets are defined as assets with an initial, unit cost of more than $5,000 for equipment, $30,000 for intangible assets and IGCS, and $200,000 for buildings. Capital assets are recorded at cost or, for donated assets, at fair market value at the date of acquisition. Capital assets are depreciated using the straight-line method based on the following useful lives: 40-50 years for buildings, 20-50 years for large improvements, 3-10 years for small improvements, and 3-12 years for equipment.
2. LEGISLATION AND AUTHORITY The Risk Management fund was established under Minnesota Laws of 1986, Chapter 455, Section 3. (M.S. § 16B.85 Subd 2).
3. CAPITAL ASSETS Balance 7/1/10 Additions Deletions Balance 6/30/11 Equipment 14,180.72 0.00 0.00 14,180.72 Software 0.00 250,321.48 0.00 250,321.48 Internally Generate Computer Software (ICGS) 594,193.47 51,740.32 (250,321.48) 395,612.31 Total Capital Assets _608,374.19 302,061.80 (250,321.48) 660,114.51 Accumulated Depreciation/Amortization for: Equipment (14,180.72) 0.00 0.00 (14,180.72) Internally Generate Computer Software (ICGS) _____0.00 0.00 0.00 0.00 Total Accumulated Depr/Amort _(14,180.72) 0.00 0.00 14,180.72) In FY11 the RMF purchased internally generated computer software for the new Information Management System. The amortization of this system will begin when placed in service. All equipment, furniture & fixtures are fully depreciated. 4. RETAINAGE PAYABLE In FY11, the total retainage payable on invoices related to the new Information System is $39,405.95. In FY10, the total retainage payable on invoices related to the new Information System was $34,387.20. The retainage is 10% of the amount paid off the contract not including software licensing and hosting fees.
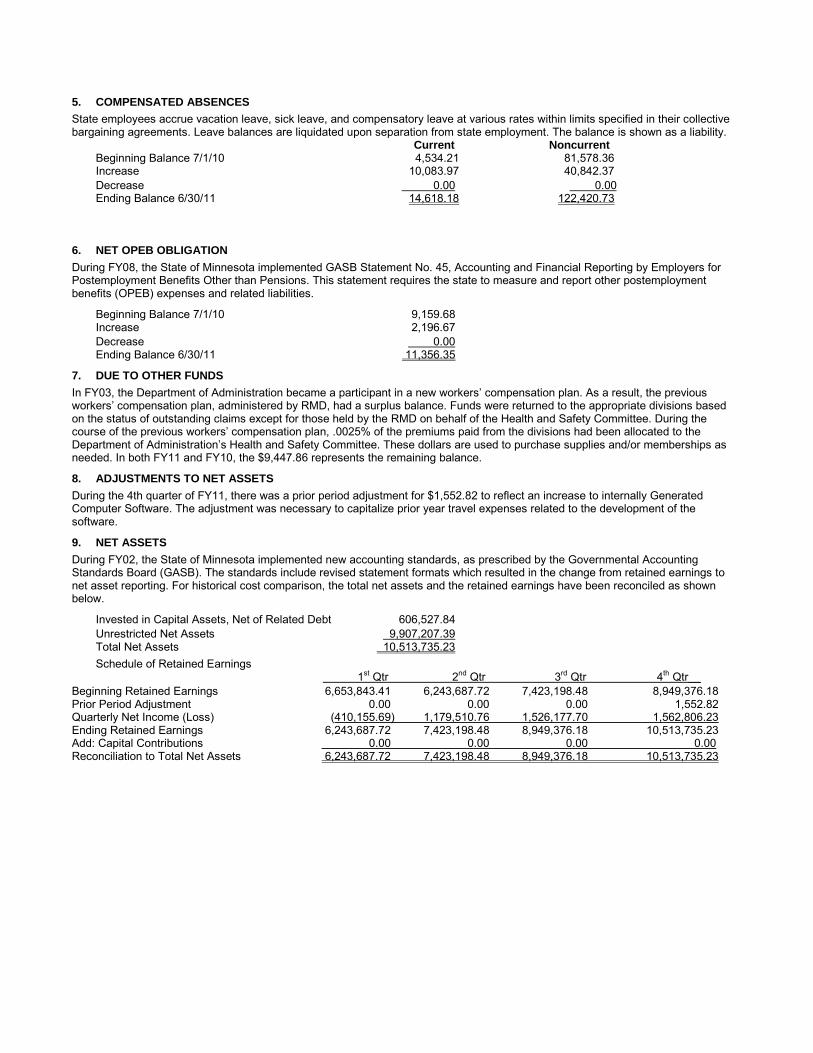
5. COMPENSATED ABSENCES State employees accrue vacation leave, sick leave, and compensatory leave at various rates within limits specified in their collective bargaining agreements. Leave balances are liquidated upon separation from state employment. The balance is shown as a liability. Current Noncurrent Beginning Balance 7/1/10 4,534.21 81,578.36 Increase 10,083.97 40,842.37 Decrease 0.00 0.00 Ending Balance 6/30/11 14,618.18 122,420.73 6. NET OPEB OBLIGATION During FY08, the State of Minnesota implemented GASB Statement No. 45, Accounting and Financial Reporting by Employers for Postemployment Benefits Other than Pensions. This statement requires the state to measure and report other postemployment benefits (OPEB) expenses and related liabilities.
Beginning Balance 7/1/10 9,159.68 Increase 2,196.67 Decrease 0.00 Ending Balance 6/30/11 11,356.35
7. DUE TO OTHER FUNDS In FY03, the Department of Administration became a participant in a new workers’ compensation plan. As a result, the previous workers’ compensation plan, administered by RMD, had a surplus balance. Funds were returned to the appropriate divisions based on the status of outstanding claims except for those held by the RMD on behalf of the Health and Safety Committee. During the course of the previous workers’ compensation plan, .0025% of the premiums paid from the divisions had been allocated to the Department of Administration’s Health and Safety Committee. These dollars are used to purchase supplies and/or memberships as needed. In both FY11 and FY10, the $9,447.86 represents the remaining balance.
8. ADJUSTMENTS TO NET ASSETS During the 4th quarter of FY11, there was a prior period adjustment for $1,552.82 to reflect an increase to internally Generated Computer Software. The adjustment was necessary to capitalize prior year travel expenses related to the development of the software.
9. NET ASSETS During FY02, the State of Minnesota implemented new accounting standards, as prescribed by the Governmental Accounting Standards Board (GASB). The standards include revised statement formats which resulted in the change from retained earnings to net asset reporting. For historical cost comparison, the total net assets and the retained earnings have been reconciled as shown below.
Invested in Capital Assets, Net of Related Debt 606,527.84 Unrestricted Net Assets 9,907,207.39 Total Net Assets 10,513,735.23 Schedule of Retained Earnings 1st Qtr 2nd Qtr 3rd Qtr 4th Qtr__ Beginning Retained Earnings 6,653,843.41 6,243,687.72 7,423,198.48 8,949,376.18 Prior Period Adjustment 0.00 0.00 0.00 1,552.82 Quarterly Net Income (Loss) (410,155.69) 1,179,510.76 1,526,177.70 1,562,806.23 Ending Retained Earnings 6,243,687.72 7,423,198.48 8,949,376.18 10,513,735.23 Add: Capital Contributions 0.00 0.00 0.00 0.00 Reconciliation to Total Net Assets 6,243,687.72 7,423,198.48 8,949,376.18 10,513,735.23
This report is a product of the Department of Administration Risk Management Division, which is solely responsible for its content. For additional information, please contact RMD. This document can be made available in alternative formats, such as large print, Braille, or audio tape or disk by calling 651.201.2588. Consumers with a hearing or speech disability may call us through the Minnesota Relay Service at 711 or 800-627-3529, or via email ([email protected]). Cover photos courtesy of the Minnesota Historical Society, Minnesota State Colleges and Universities and various state agencies and offices.
310 Centennial Office Building 658 Cedar Street
St. Paul, MN 55155 http://www.admin.state.mn.us/risk/
Recommended