Annual Report2003Year ended March 31,2003
ProfileTeijin Seiki Co., Ltd. was originally established as TeijinKoku Kogyo Co., Ltd., in 1944, as a spin-off from TeikokuRayon Co., Ltd. (presently TEIJIN Limited). The Companyassumed its current name in 1945.
Since our establishment, we have continued to respond to awide range of industry needs by developing highlyinnovative technologies. Beginning our operations with thedevelopment and manufacture of textile machinery, wehave steadily increased the depth and breadth of ourtechnology and product lines. In 1955, we startedmanufacturing aircraft equipment. In 1959, we addedindustrial machinery. Manufacturing of oil hydraulicequipment began in 1961. In response to the growingsophistication of “mechatronics” technology, wecommenced developing precision reduction gears forindustrial robots and began manufacturing them in 1985. Attheir introduction, the precision movement and non-backlash characteristics of these gears reached levels notpreviously achieved in the market.
Moreover, with the aim of developing our business in Japanand overseas, we have continued to strengthen TEIJINSEIKI Group by establishing additional new companies withhighly specialized technologies and by investing in andacquiring companies with original technologies. Today, inaddition to TEIJIN SEIKI as the parent company, the Groupcurrently comprises 22 companies: 12 domesticsubsidiaries, 8 overseas subsidiaries, and 2 domesticaffiliates accounted for using the equity method.
Currently, TEIJIN SEIKI Group organizes its globaloperations in three major segments - Precision Equipmentand New Business, Aircraft and Oil Hydraulic Equipment,and Textile and Industrial Machinery. With a view tomaximizing its corporate value and ensuring ever-continuinggrowth, the Group has agreed to combine operations withNABCO Ltd., a long established and highly respectedmanufacturer of braking and other motion control systemsfor transportation, building and other applications. Aholding company is being established jointly with NABCOLtd. The holding company will assume ownership ofequity stock in the two groups and bring them, as equals,under its single management (presently scheduled forSeptember, 2003). To mark the special nature of thisoccasion in our company’s history, Teijin Seiki Co., Ltd. willrename itself TS Corporation (presently scheduled forOctober 1, 2003) as part of an overall program of morestrongly projecting the company’s image into worldmarkets.
TEIJIN SEIKI Group is aggressively implementing itsManagement Strategy aiming at generating consistent futuregrowth. Integration with NABCO Ltd. is the most importantaction taken as a part of this growth strategy. As it hasdone throughout its history, TEIJIN SEIKI Group, and now inits new combination with NABCO, will continue to focusever more closely on the shifting requirements of itscustomers worldwide and stay in the vanguard oftechnological innovation as the Group and its customersevolve in the 21st century.
Contents
CONSOLIDATED FINANCIAL HIGHLIGHTS.............................................................. 01
TO OUR SHAREHOLDERS.............................................................. 02
MANAGEMENT STRATEGY.............................................................. 03
INTRODUCTION OF NABTESCO CORPORATION.............................................................. 07
TEIJIN SEIKI AT A GLANCE.............................................................. 08
REVIEW OF OPERATIONS.............................................................. 10
CONSOLIDATED FINANCIAL REVIEW.............................................................. 12
CORPORATE DATA.............................................................. 37
01
For the Year:
Net sales ・・・・・・・・・・・・・・・・・・・・・・・・・・・・・・・・・・・・・・・・・・・・・・・・・・・・・・・・・・・・・・
Operating income ・・・・・・・・・・・・・・・・・・・・・・・・・・・・・・・・・・・・・・
Net income (loss) ・・・・・・・・・・・・・・・・・・・・・・・・・・・・・・・・・・・・・・・・・・・・・・・・・
Net income (loss) per share (Yen) ・・・・・・・・・・・・・・・・・・・・・・
Overseas net sales ・・・・・・・・・・・・・・・・・・・・・・・・・・・・・・・・・・・・・・・・・・・・・
Share of overseas net sales ・・・・・・・・・・・・・・・・・・・・・・・・・・・・・・・
At Year-end:
Total shareholders’ equity ・・・・・・・・・・・・・・・・・・・・・・・・・・・・・・・・・・
Total assets ・・・・・・・・・・・・・・・・・・・・・・・・・・・・・・・・・・・・・・・・・・・・・・・・・・・・・・・・・
Equity ratio ・・・・・・・・・・・・・・・・・・・・・・・・・・・・・・・・・・・・・・・・・・・・・・・・・・・・・・・・・・・
Return on equity (ROE) ・・・・・・・・・・・・・・・・・・・・・・・・・・・・・・・・・・・・・・・
¥ 66,707
2,134
96
1.22
30,953
46.4%
22,015
79,822
27.6%
0.4%
¥ 54,708
504
(4,252)
(54.10)
18,041
33.0%
16,654
74,020
22.5%
(22.0%)
¥ 67,865
2,509
687
9.74
26,992
39.8%
17,689
66,301
26.7%
4.0%
¥ 62,168
1,706
(307)
(3.90)
25,214
40.6%
17,627
57,120
30.9%
(1.7%)
¥ 66,222
3,842
1,570
19.56
26,551
40.1%
18,346
60,433
30.4%
8.7%
Millions of yen
1999 2000 2001 2002 2003
Net sales
90
80
70
60
50
40
30
20
10
0
¥ Billion
■ Precision Equipment and New Business
■ Aircraft and Oil Hydraulic Equipment
■ Textile and Industrial Machinery
Net income (loss) ROE
66.7
54.7
62.266.2
1999 2000 2001 2002 2003
¥ Billion
3.0
2.0
1.0
0.0
-1.0
-2.0
-3.0
-4.0
-5.01999 2000 2001 2002 2003
0.1
-0.3
0.7
1.6
%
15.0
10.0
5.0
0.0
-5.0
-10.0
-15.0
-20.0
-25.01999 2000 2001 2002 2003
-22.0
4.0
8.7
-1.7
CONSOLIDATED FINANCIAL HIGHLIGHTSYears ended March 31
0.4
-4.3
67.9
02
During FY2002, TEIJIN SEIKI Group increased its revenues over the previous year, chiefly due to continuedstrong demand for precision equipment and growth in China’s markets for hydraulic equipment and textilemachinery. Also because the Group’s ongoing efforts, initiated during the preceding year, to streamline itsoperations and to optimize its earning structure became fruitful, the Group increased its earningssignificantly, with all business segments maintaining or returning to profitability. TEIJIN SEIKI Group’s netsales in FY2002 were up by 6.5%, compared with the preceding year, to ¥66,222 million, and its operatingincome was up 125.3% to ¥3,842 million. Accordingly, the Group posted net income of ¥1,570 million andsucceeded in returning to overall profitability.
If we review our group operations segment by segment, the “Precision Equipment and New Business”segment was again profitable, thanks primarily to strong business in domestic and overseas robotics-manufacturing industries. The “Aircraft and Oil Hydraulic Equipment” segment experienced some reducedrevenues and earnings, mainly due to weaker Aircraft Equipment business following the aftereffects of the9.11 terrorist attacks in the United States which depressed the commercial airline industry’s business. Inthe “Textile and Industrial Machinery” segment, sales were lower in Industrial Machinery business, whereasTextile Machinery business enjoyed stronger sales, reflecting textile manufacturers’ continued enthusiasmespecially in China for investing in equipment and machinery. Overall, the Group achieved positive netincome across all of our business segments.
In line with our Corporate Philosophy – “We will make unceasing efforts to win the trust of the public bycontributing to world progress through our technology and by respecting people and nature” – TEIJIN SEIKIGroup has established the following Fundamental Management Policies:
・Pursuit of Profitable Growth・Enhancement of Group-Oriented Management・Investing in Technological Progress and Innovation・Pursuing and Strengthening Globalization
Driven by these policies, the Group is reforming its management structure, improving its profitability andincreasing its asset utilization efficiency, while pursuing growth opportunities. Our ultimate goal is toperpetuate growth in the “Corporate Value” of the Group as a whole as existing business grows and newbusinesses are undertaken.
In November 2002, TEIJIN SEIKI agreed with NABCO Ltd. (President Shigeo Iwatare, headquartered in Kobe,Hyogo Prefecture) to jointly establish a holding company and to come together as equals under the holdingcompany’s single management. Nabtesco Corporation, the new holding company scheduled to be formallyorganized in September 2003, will inherit all equity stock in these two groups, and make them its whollyowned subsidiaries.
TEIJIN SEIKI and NABCO are both manufacturers of complex and technologically advanced motion controlsystems. Our companies are of approximately equal size. They have maintained their leadership positionsin a number of specialized fields both in Japan and overseas. Finding themselves facing ever increasingglobal competition, the two groups have concluded that teaming up under integrated management is the mosteffective way of maximizing their combined corporate value and guaranteeing their long-term growth. Weare going to work tirelessly to maximize the synergies of corporate integration, and ensure that theintegration process proceeds as smoothly as possible.
Together with NABCO senior management in the new holding company, TEIJIN SEIKI Group is now quiteready to steer itself towards a new period of consistent growth. Our efforts are being dedicated in thatdirection and as we enter this new era in the history of TEIJIN SEIKI, we are working hard to earn the fulltrust and satisfaction of our customers, employees and shareholders.
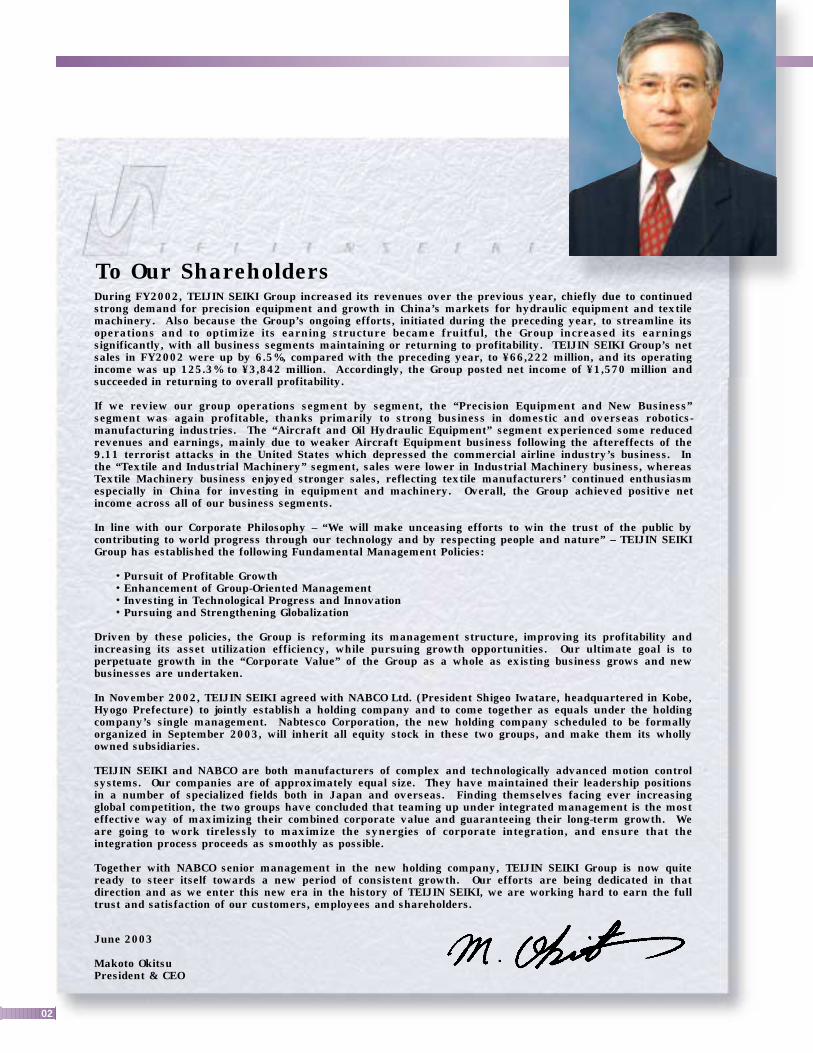
June 2003
Makoto OkitsuPresident & CEO
To Our Shareholders
03
Management Strategy
Firmly based upon the TEIJIN SEIKI Group Vision to “Become a Leading and Highly ProfitableCorporate Group that Actively Performs Business on a Global Basis”, our Group continues to pursuethe Management Strategy developed in recent years aiming specifically at increasing overallcorporate value for our shareholders –– today and into the future.
As a major step toward increasing corporate value, TEIJIN SEIKI has concluded an agreement withNABCO Ltd., to join forces under a business integration agreement. Through this new combination,the Group is working to maximize synergies within the two companies and pursuing long-termdevelopment programs aiming at further increasing the combined companies’ value.
At this time TEIJIN SEIKI Group is focusing on“enhancing the stable revenue base” and “promotingdevelopment of new products and businesses.” TheGroup is promoting a process of “selectivity andconcentration” whereby resources are allocatedpreferentially to business areas that enjoy the
strongest competitive positions or offer the greatestpromise for the future. Within this element of ourStrategy, the Group is moving to improve theefficiency and production capabilities of theseselected areas so that their dominance in themarketplace can be increased. Through these and
TEIJIN SEIKI Group consists of three main businesssegments: “Precision Equipment and New Business”,“Aircraft and Oil Hydraulic Equipment” and “Textileand Industrial Machinery”. Conditions vary in the markets for each of thesebusiness segments but in overall terms, weakness inthe Japanese economy continued impactingoperations in each segment. Weaknesscharacterized important segments of the internationalmarket served by the Group. The worldwide slumpin semiconductors and more importantly for us,semiconductor capital equipment continued.Uncertain outlook for air travel (due to the effects ofthe 9.11 terrorist attacks, the war in Iraq, and SARS)extended the impact of the overall economic slumpon orders for aircraft, aircraft parts and supportservices.
We are very proud that in this difficult businessenvironment, all of the Group’s business segmentswere profitable and a significant increase in overallprofits was generated. Even the PrecisionEquipment business (specifically industrial robotsales), which struggled in the previous period,recovered strongly because of the increase in capitalinvestments by domestic and internationalautomakers. The Oil Hydraulic Equipment businessenjoyed the effects of a construction boom in Chinawhile sales of textile machinery especially in Chinagrew as business owners increased capitalinvestments. Furthermore, the Group’s efforts tooptimize operations and improve profit structure,which began in the previous period, contributed tothe profitability achieved by all of the businesssegments.
Under this severe business environment, the Group’s ManagementStrategy has led to a significant increase in profits in which allsegments participated
A Major Element of the Strategy is to Aggressively Develop the MostPromising Areas in Each Business Segment
04
other actions we look to achieve the desired overallstrengthening of our stable revenue base.Within “Precision Equipment and New Business”, theCompany is steadily expanding applications for itscore precision reduction gears into new areas for ussuch as semiconductor manufacturing and elevatorhoisting machines. In addition, new products arebeing developed to broaden our penetration in ourmain application areas which are industrial robotsand machine tools. The Group is pursuingdevelopment of a new series of reduction gears withhigher levels of precision and stiffness. A projectteam has also been formed to determine ways inwhich to minimize lead times and to reduce costs forthis product. Furthermore, the Group is planning tointroduce new products, such as wafer transfer unitsand dry vacuum pumps for semiconductormanufacturing and improved reduction gears forelevator hoisting machines so that its domestic andinternational customer base can be expanded.Finally, in 1999 and 2000, the Group establishedthree new business areas (heat control devices,digital logging systems and optical molding systems)with the hope that they will become major newcompanies within the Group. Significant progresshas already been made in digital logging systemsbusiness which has achieved profitability. Within “Aircraft and Oil Hydraulic Equipment”, therapid succession of negative news such as the 9.11terrorist attacks, the war in Iraq, and the SARSoutbreak took a toll on the Aircraft Equipmentbusiness. However, it is thought that the medium tolong-term outlook for this field remains stable andpositive. The world is shrinking and air travel has avery strong long-term growth trend. With this in mind,TEIJIN SEIKI Group is working hard to secure orderson new aircraft projects currently under developmentboth in Japan and overseas. Success in these effortswill generate stable profits for many years into thefuture. The Oil Hydraulic Equipment business wasalso hampered by the continued slump in thedomestic construction machinery market. However,this business area was buoyed by the steady growthof the hydraulic excavator market in China. Thistrend is expected to continue as the need increasefor construction machinery with preparations for the
2008 Olympics in Beijing. TEIJIN SEIKI Group hadthe foresight to establish a production base in Chinain 1996 and since then the strong local reputationand sales network that we have nurtured hasincreased sales in the region. The Group is workingto further strengthen its production base in China.Steps are being taken to further rationalize thedivision of production between the Group’s plants inJapan and China. An important new productcategory is TEIJIN SEIKI’s actuation units for windturbines where sales are increasing. We plan to enterboth the European and US markets where the use ofwind power is more prevalent. Plans are underwayto develop initial sales organizations in thesemarkets. In April 2003, the Group transferred its synthetic fibermachinery business to TMT Machinery, Inc. As aresult, reported revenues for “Textile and IndustrialMachinery” will decrease by approximately ¥8 billionin the coming period. In order to cover this drop inrevenues, TEIJIN SEIKI Group is aggressivelydeveloping new strategies for the industrialmachinery side of the business. The Group’sautomatic packaging machines have seen anincrease in overseas sales and in particular, the newhigh-speed pouch filler/sealer machines have beenhighly successful in the European pet food industry.In order to build on this success, the Group plans toexpand its overseas sales organization. In addition,the Group is working to develop new packagingmachines that incorporate greater functionality (suchas sterilization) and introduce new higher-speedmodels. The shift from cans and bottles to pouchesis a major trend in food and beverage packaging inmany parts of the world. TEIJIN SEIKI is focusingsignificant efforts on exploiting this trend. In the fieldof multi-forming machines, the Group has an ongoingprogram of cost reductions and is exploring a rangeof alternative strategies to grow the business andimprove its profitability. In a related product area, theGroup plans to supply Teijin Ltd.’s Home CareDivision with the principal components for its oxygenconcentrators.
05
Management Strategy
In November 2002, TEIJIN SEIKI Group executed aletter of intent for a business integration agreementwith NABCO Ltd. (Head Office: Kobe, HyogoPrefecture, Japan; President & CEO: Shigeo Iwatare).This agreement called for formation of a holdingcompany with both companies agreeing to integrateon an equal footing.TEIJIN SEIKI Group and NABCO Ltd. are bothmachinery system and component makers withsimilar business portfolios. In addition, bothcompanies are leaders in multiple domestic and/orinternational markets with long established and well-respected product lines. However, both companiesrecognized that fierce competition in the globalmarketplace will only intensify in the future. For thisreason, the companies determined that the mosteffective way to increase corporate value and toachieve long-term growth is to integrate.In order to ensure that integration goes smoothly andpositive effects of the integration are maximized, atwo-phase approach is being taken. First, a purelyshare-holding company named NabtescoCorporation will be established in September, 2003.Under this agreement, TEIJIN SEIKI and NABCO willbecome wholly owned subsidiaries operating directlyunder the holding company. In approximately oneyear, Phase II will begin and actual restructuring willoccur with the objective of transitioning to a“ business holding company.” This step will includesignificant integration activities. The reason for thistwo-phased approach is so that during Phase I, eachcompany’s strengths, strategies and corporate culture
can be understood mutually. In this way, overallinvestment efficiency within the group can beoptimized and positive effects of the integration canbe maximized during the second stage.The management structure in Phase I is comprised ofthe holding company owning all the shares of bothcompanies and functioning as the strategicheadquarters for both the NABTESCO Group and itssubsidiaries. In addition, the holding company willbe responsible for overall risk management, investor,government and other external relations andresponsibilities of the Group. At the same time, theholding company will have responsibility forprograms to create new businesses and productsthat take advantage of existing technologicalsynergies. The board of directors of the holdingcompany will appoint corporate officers to holdboard of director posts at the separate businessentities, including TEIJIN SEIKI, NABCO and theirsubsidiaries. These corporate officers will beresponsible for carrying out the day-to-day operationsof the subsidiary entities. Ultimate decision-makingauthority will be maintained by the board of directorsof the holding company on important issues but anappropriate level of authority will be delegated tosuch corporate officers. Through this, amanagement style that ensures both efficientdecision-making and necessary independence willbe implemented.
Efforts are already underway to identify and pursueprofit opportunities even before the integration takesplace.
For example in the Oil Hydraulic Equipmentbusiness, various efforts relating to procurement,mutual product supply and sales cooperation have
Carefully Planned Integration with NABCO is a Major Element ofManagement Strategy Aimed at Long-Term Development andIncreased Corporate Value
Management Strategy for Integration Calls for Immediate Pursuit ofProfit Opportunities and Identification of Technological Synergies
06
Management Strategy
The Oil Hydraulic Equipment’s joint development withNABCO has been mentioned. Pursuing “technologicalsynergies” will be a major element in the success ofTEIJIN SEIKI’s combination with NABCO. We mustquickly establish a management system that canfuse together each company’s core technologies andfacilitate development of highly competitive newproducts for new markets and business areas usingthis expanded technological base.To accomplish this, during Phase I, NABTESCOGroup will consolidate the technological oversightfunctions now present in both companies in order topromote maximum potential technological synergies.
There is a close fit between the technologies of thetwo companies. TEIJIN SEIKI supplies high-performance components that are borne out of ourcore “motion control technologies” including precisionreduction gears, aircraft equipment and oil hydraulicequipment. At NABCO, “control systemtechnologies” is one of their core technologies.These two core technologies are mutuallycomplementary and when combined correctly, willachieve accelerated development of next-generationproducts and entry into both new business areas andmarkets.
been carried out as a result of the businesscooperation agreement that was finalized in April2002 between TEIJIN SEIKI and NABCO. Already,several million yen worth of cost savings have beenachieved because of joint procurement activitiesperformed during the current period. The Grouphopes to achieve this sort of success throughoutother business segments as integration proceeds.
In the area of identifying technological synergies, theOil Hydraulic Equipment business plans to introducea new model, jointly developed with NABCO, ontothe market ahead of other divisions and optimize theglobal division-of-labor structure (including productionbases in China). Through these and other efforts, thedivision hopes to maximize positive benefits from theintegration.
As described above, tight integration with NABCOwill be a cornerstone of our future ManagementStrategy. Combining our two companies creates amuch larger entity with greater resources, broaderproduct lines and technological capabilities and alarger customer base. Taking maximum advantageof this unique opportunity is the challenge for ourcombined management teams. As part of thisimportant step in TEIJIN SEIKI’s history, we will bechanging our company name to “TS Corporation” onOctober 1, 2003. New logo designs and otherelements of a revitalized corporate image program
will be undertaken as part of the introduction ofNABTESCO. This new beginning will allow theCompany as a whole to aggressively implement theStrategy described above including focusing on ourmost promising opportunities whether they bemarkets such as China or products/technologiessuch as our packaging machines and continuing topursue promising new business areas. We believethat you can look forward with positive anticipationas TEIJIN SEIKI soon to be TS Corporation joins withNABCO and together as NABTESCO responds tonew challenges and opportunities.
Combining the Core Technologies of Both Companies is a MajorElement of Management Strategy in Order to Accelerate New ProductDevelopment and Entry into New Business Areas
Management Strategy for the Future
07
Our Goal is to become the world’slargest manufacturer of motion controlsystem equipment for air, land andmarine transportation through thefusion of TEIJIN SEIKI and NABCO’soutstanding core technologies.
●To become a highly profitable corporate group, active in the global market place
●To maintain a leading edge in R&D capability in motion control technology
●To establish flexible management system to cope with environmental fluctuations
●To develop/maintain strong financial position
●To maintain high corporate ethics and disclosure of management information
Creation of new products/business through the integration of core technologies
Sales target for FY2007 : ¥10 billion increase
Introduction of (Scheduled for establishment in September, 2003)
Management Policies
■Company Name:Nabtesco Corporation
■Capital:¥10 billion
■Chairman:Shigeo Iwatare (Currently President & CEO of NABCO Ltd.)
■President & CEO:Makoto Okitsu (Currently President & CEO of Teijin Seiki Co., Ltd.)
■Business Segments:
Precision EquipmentPrecision Reduction GearsElevator Hoisting MachinesWafer Transfer UnitsVacuum PumpsOptical Molding SystemsHeat Control DevicesDigital Logging Systems
Transport EquipmentAir Brake Systems and Automatic
Doors for Railway CarsWedge Brake Chambers for Heavy-Duty Trucks and Buses
DPFs (Diesel Particulate Filters)Engine Control Devices for Vessels
Aircraft and Oil Hyadaulic EquipmentFlight Control System Actuators,Traveling Motors and Hydraulic Valves for Construction Machines
Actuation Units for Wind Turbine
Industrial EquipmentAutomatic DoorsAutomatic Packaging MachinesMulti-Forming MachinesCVJ Processing MachinesWelfare/Medical Equipments
Corporate Data
Pursuit of Technical Synergy
ComponentTechnology
● Next Generation Construction Machinery System
●Actuation System for Wind Turbine
●Environment-related Equipment
●Personal Aid/Medical Equipment
SystemTechnology
08
Teijin Seiki at a GlanceOutline of BusinessPrecision Equipment and New Business
1999~Actuator for Semiconductor
Heat Lane
Logging System
1994~ Rapid Prototyping System
1971~ Vacuum Pump and Equipment
1985~ Precision Reduction Gear / Servo Actuator
2002~ Actuation Unit for Wind Turbine
1976~ Hydraulic Motor with Reduction Gear
1944~ Aircraft Equipment
1975~ Automotive Parts
1966~ Automatic Packaging Equipment
1959~ Forming Machine / Machine Tool
1945~ Textile Machinery
Precision Equipment and New Business
Aircraft and Oil Hydraulic EquipmentAircraft and Oil Hydraulic Equipment
Textile and Industrial MachineryTextile and Industrial Machinery
●Precision Equipment and New Business
In this business segment, our most important products are precision reduction gearsand servo actuators which integrate servomotors and precision reduction gears.TEIJIN SEIKI’s highly regarded reduction gears and servo actuators feature smallsize, light weight, high precision, high stiffness and achieve high levels of efficiency.They are used by some of the world’s leading manufacturers of industrial robotics,machine tools and general industrial machinery.
New Business activities are concentrated in three companies originally organized bythe corporation’s New Business Development Department. The business areas ofthese three companies are: optical molding systems which can form complex shapeswithout the use of metal dies, high-performance heat control devices equipped withmeandering capillary tube heat pipes which possess unique heat transfertechnology, and digital logging systems that are finding broad applications such ascall centers in financial institutions.
●Aircraft and Oil Hydraulic Equipment
In the Aircraft Equipment sector, TEIJIN SEIKI supplies major aircraft manufacturerssuch as Boeing and Cessna with a range of high precision products especially oilhydraulic actuators for flight control systems. Through long established technicalassistance and joint venture agreements with leading American companies in thefield of aerospace systems and components, TEIJIN SEIKI has become an importantsupplier of aircraft and aerospace electrical power generating systems, fuel pumps,valves and other critical components. TEIJIN SEIKI is an important supplier toJapanese aircraft and aerospace companies and a key partner in internationalaircraft development projects.
In the Oil Hydraulic Equipment sector, traveling motors powering the drive sprocketsof crawler mounted hydraulic excavators and other construction equipment are theprincipal products of this business sector. TEIJIN SEIKI maintains a high marketshare earned through superior compact design and the high evaluation and solidtrust it has earned from the market.
Recently TEIJIN SEIKI began supplying actuation units for wind turbines. We areexpanding our business in this important energy saving and environmentally friendlyapplication. Wind turbine use is expected to grow significantly as technologyimproves and the need for clean energy increases.
●Textile and Industrial Machinery
TEIJIN SEIKI supplies an integrated line of high performance equipment andsystems for the production of man made filament yarns including: spinningmachines, high speed take up winders and draw texturing machines. In thisbusiness sector, TEIJIN SEIKI is established as one of the world’s leadingcompanies. Long a major supplier in both Japan and throughout Asia, we havebroadened our markets to include Oceania, Europe and North America. In April2003, TEIJIN SEIKI transferred its Synthetic-Fiber Machinery Business to TMTMachinery, a new company jointly established with two of Japan’s leading textilemachinery manufacturers.
In the Industrial Machinery sector, TEIJIN SEIKI has developed and supplies highlyoriginal industrial machinery designed to address automation, labor-savings, andmechanization for a variety of production lines in different industries. We have beenenjoying an extremely large share of the market for certain types automatic foodindustry filling/packaging machines. This product line is being broadened with thedevelopment of machinery for the detergent and the pharmaceutical industries.
09
Market Condition and Key-Stratesies Major Companies
●Domestic
Teijin Seiki Co., Ltd.Diavac LimitedTS Heatronics Co., Ltd.LogIT CorporationCMET INC.
●Overseas
TEIJIN SEIKI BOSTON, INC.TEIJIN SEIKI EUROPE GmbHTeijin Seiki Advanced Technologies, Inc.
●Domestic
Teijin Seiki Co., Ltd.
STS Corporation
●Overseas
TEIJIN SEIKI AMERICA, INC.
Shanghai Teijin Seiki Co., Ltd.
●Domestic
Toyo Jidoki Co., Ltd.
Teijin Seiki Precision Co., Ltd.
TSTM Co., Ltd.
TMT MACHINERY, INC.
●Overseas
P.T.PAMINDO TIGA T
Shanghai Teijin Seiki Textile machinery Co., Ltd.
●Precision Equipment and New Business
The Group has long supplied precision reduction gears to many of the world’s leading industrial-robotics manufacturers. In order to maintain and strengthen its competitive position, the Group hasaccelerated the introduction of next-generation models. Broadly based efforts to improve cost-competitiveness are continuing. The Group is investing further in developing markets forsemiconductor-manufacturing and elevator-hoisting applications both based on its proprietarytechnologies.
The Group is working to improve the market position of its optical molding systems (CMET Inc.) bydeveloping and marketing new products with ever higher levels of performance. The uniqueness of theGroup’s high-performance "meandering capillary heat pipe" thermal-control devices (TS HeatronicsCo., Ltd.) is gaining greater customer recognition in target markets. Greater investments are beingmade to realize the full commercial potential of this unique and proprietary technology. The Group willexpand its digital logging systems (LogIT Corporation) business by vigorously offering a greater rangeof integrated solutions combining enhanced technological capabilities and related products offeringgreater functionality.
●Aircraft and Oil Hydraulic Equipment
The aftereffects of the 9.11 terrorist attacks in the United States have depressed business in thecommercial airline industry and aircraft manufacturers’ production is not expected to begin recoveringbefore 2005. New programs for aircraft development have been initiated both domestically andinternationally. The Group is working hard to secure contracts from these new aircraft developmentprograms. Long lead times characterize the development of major new aircraft. Success in havingGroup components and systems specified on these new aircraft will prepare a strong foundation for thisbusiness to continue operating briskly over the next ten years and beyond. Flight control actuators areexpected to continue as the group’s most important product but today’s product line is much broaderthan in earlier years giving the Group greater future potential.
In the Oil Hydraulic Equipment sector, the Group’s most important market, construction-machinery,remains weak in Japan but is growing overseas, particularly in China where very large infrastructureinvestments are being made. TEIJIN SEIKI’s combination with NABCO Ltd. will provide significantsynergies for the Group in product development, manufacturing and sales. These synergies will beenhanced further using the Group’s China based manufacturing facility and its supplier network. Next-generation construction-machinery applications are currently being designed to provide a strongfoundation for the Group’s future market position.
As the global market for wind turbines is expected to grow at an annual rate of roughly 20%, the Groupis focusing considerable attention on this area with particular emphasis on actuator units for windturbines.
●Textile and Industrial Machinery
In April 2003 the Group completed the transfer of all functions related to its synthetic-fiber machinerybusiness, into TMT Machinery Inc., a joint venture with two of Japan’s leading textile machinerymanufacturers. Because of weak conditions in its industry, TMT Machinery will focus primarily onimproving the profitability of its combined operations. However, work is already underway to developits first machine incorporating the combined technical strengths of its three equity partners. Togetherthe three partners possess a world-leading base of textile machinery technology and TMT Machineryshould become a powerful force in world markets.
The Group projects growing demand for its automatic filling/packaging machines for food and chemicalproducts (Toyo Jidoki Co., Ltd.). The Japanese food industry’s increased awareness of the need forconserving resources, food safety and improved sanitation are major drivers for this expected growth.Overseas, too, applications using Group filling/packaging machines for pet food, retorted foods,beverages, and other products, are expected to become increasingly popular.
In the highlypromising area of home medical care, the Group is working with Teijin Limited tomanufacture key components for oxygen concentrators (Teijin Seiki Precision Co., Ltd.) utilizing itsextensive design, production, and processing/manufacturing skills.
10
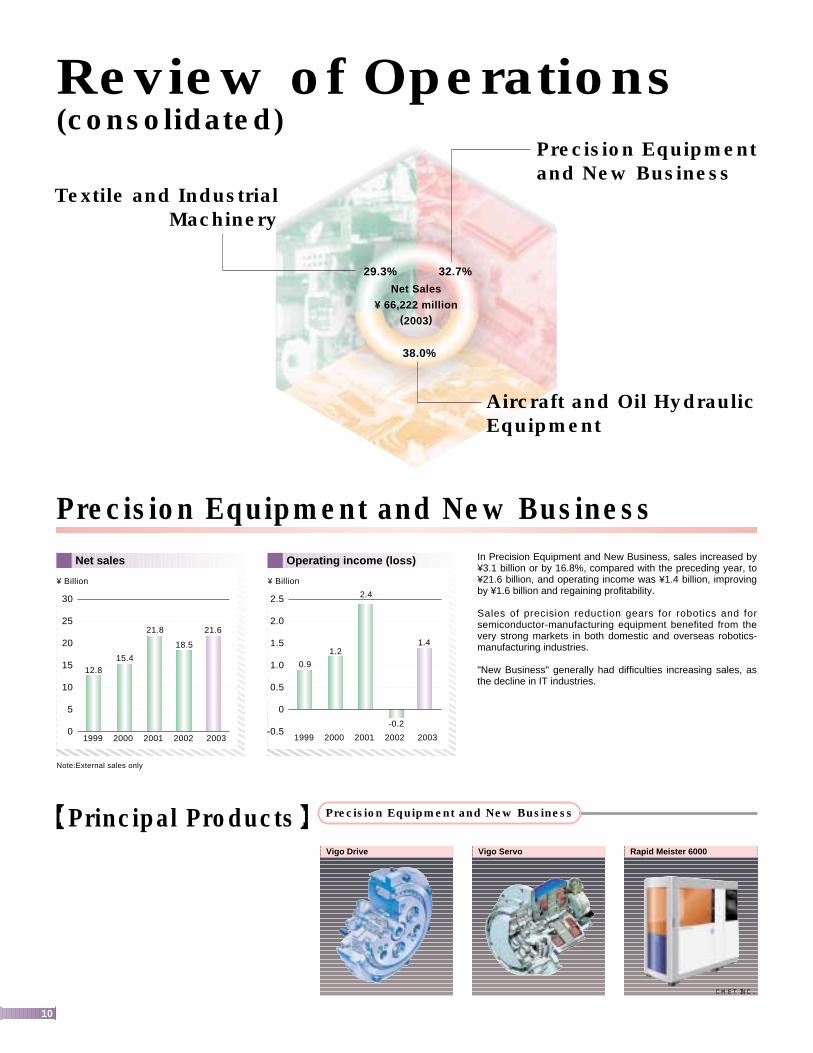
Review of Operations(consolidated)
Textile and IndustrialMachinery
Aircraft and Oil HydraulicEquipment
Precision Equipment and New Business
Net Sales
¥ 66,222 million(2003)
32.7%
38.0%
29.3%
Precision Equipment and New Business
【Principal Products】
Operating income (loss)
¥ Billion
2.5
2.0
1.5
1.0
0.5
0
-0.51999 2000 2001 2002 2003
Net sales
¥ Billion
30
25
20
15
10
5
01999 2000 2001 2002 2003
12.8
18.5
21.621.8
15.40.9
1.2
2.4
1.4
-0.2
Note:External sales only
In Precision Equipment and New Business, sales increased by¥3.1 billion or by 16.8%, compared with the preceding year, to¥21.6 billion, and operating income was ¥1.4 billion, improvingby ¥1.6 billion and regaining profitability.
Sales of precision reduction gears for robotics and forsemiconductor-manufacturing equipment benefited from thevery strong markets in both domestic and overseas robotics-manufacturing industries.
"New Business" generally had difficulties increasing sales, asthe decline in IT industries.
Precision Equipment and New Business
Vigo Drive Vigo Servo Rapid Meister 6000
CMET INC.
11
Aircraft and Oil Hydraulic Equipment Textile and Industrial Machinery
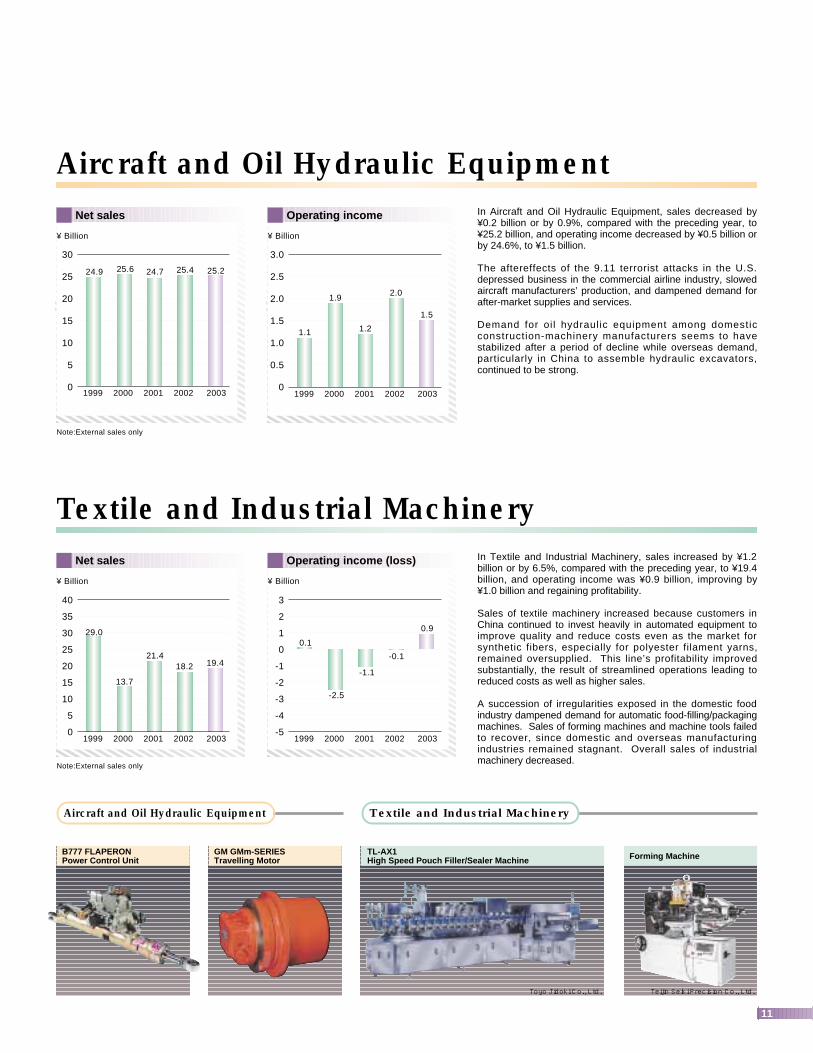
In Aircraft and Oil Hydraulic Equipment, sales decreased by¥0.2 billion or by 0.9%, compared with the preceding year, to¥25.2 billion, and operating income decreased by ¥0.5 billion orby 24.6%, to ¥1.5 billion.
The aftereffects of the 9.11 terrorist attacks in the U.S.depressed business in the commercial airline industry, slowedaircraft manufacturers’ production, and dampened demand forafter-market supplies and services.
Demand for oi l hydraulic equipment among domesticconstruction-machinery manufacturers seems to havestabilized after a period of decline while overseas demand,particularly in China to assemble hydraulic excavators,continued to be strong.
In Textile and Industrial Machinery, sales increased by ¥1.2billion or by 6.5%, compared with the preceding year, to ¥19.4billion, and operating income was ¥0.9 billion, improving by¥1.0 billion and regaining profitability.
Sales of textile machinery increased because customers inChina continued to invest heavily in automated equipment toimprove quality and reduce costs even as the market forsynthetic fibers, especially for polyester filament yarns,remained oversupplied. This line’s profitability improvedsubstantially, the result of streamlined operations leading toreduced costs as well as higher sales.
A succession of irregularities exposed in the domestic foodindustry dampened demand for automatic food-filling/packagingmachines. Sales of forming machines and machine tools failedto recover, since domestic and overseas manufacturingindustries remained stagnant. Overall sales of industrialmachinery decreased.
Aircraft and Oil Hydraulic EquipmentOperating income
¥ Billion
3.0
2.5
2.0
1.5
1.0
0.5
01999 2000 2001 2002 2003
1.1
1.9
1.2
2.0
Net sales
¥ Billion
30
25
20
15
10
5
01999 2000 2001 2002 2003
24.9 24.725.6 25.4 25.2
1.5
Note:External sales only
Textile and Industrial MachineryOperating income (loss)
¥ Billion
3
2
1
0
-1
-2
-3
-4
-51999 2000 2001 2002 2003
0.1
-2.5
-1.1
-0.1
0.9
Net sales
¥ Billion
40
35
30
25
20
15
10
5
01999 2000 2001 2002 2003
29.0
13.7
21.418.2 19.4
Note:External sales only
TL-AX1High Speed Pouch Filler/Sealer Machine Forming MachineB777 FLAPERON
Power Control UnitGM GMm-SERIESTravelling Motor
Toyo Jidoki Co., Ltd. Teijin Seiki Precision Co., Ltd.
12
Consolidated Financial Review
In FY2002, the strength of markets supplied by the Group varied greatly, varying depending on customers andindustries both in Japan and overseas. Demand has turned brisk for precision reduction gears used withrobotics, which is the main product line of Precision Equipment, in both domestic and overseas markets sincethe summer. Recovery of the commercial aircraft market remains less certain, due to the aftereffects of the9.11 terrorist attacks in the United States and compounded by the recent Iraq war. Demand for hydraulicequipment for construction machinery picked up visibly due to continuing strength in China but also at least astabilizing of the market in Japan since the second half of the year.
In this environment, the Group’s net sales in FY2002 increased by 6.5% to ¥66,222 million, thanks to strongerdemand for Precision Equipment and continued growth in China’s markets for Hydraulic Equipment andTextile Machinery. The restructuring efforts initiated in FY2001 have taken effect as well.
Net Sales
Selling, general and administrative expenses in FY2002 decreased by ¥108 million to ¥10,124 million. SG&Aexpense as a percentage of net sales decreased to 15.3%, an improvement of 1.2 points compared with thepreceding year. This benefited from the effects of ongoing efforts, initiated in FY2001, to streamlineoperations and to improve the Group’s earning structure.
Accordingly, operating income in FY2002 increased substantially by ¥2,136 million to ¥3,842 million, as allsegments stayed or turned profitable.
SG&A Expense and Operating Income
While an extraordinary charge of ¥953 million was recorded for restructuring the textile machinery business,the benefits of various steps taken to improve the Group’s earning structure also emerged.
Reflecting all these, the Group in FY2002 posted a net profit of ¥1,570 million, a substantial improvement of¥1,876 million, compared with the net loss it had suffered in the preceding year.
Other Expense and Net Income
In FY2002, net cash generated by the Group’s operating activities, which included a reduction in inventoryassets, was ¥5,637 million, a decrease of ¥1,636 million compared with the preceding year. Net cash usedfor investing activities was ¥772 million, a decrease of ¥1,846 million, because capital investment, to acquiretangible fixed assets, which amounted to ¥2,320 million, was offset by proceeds from sale of idle land andstock holdings.
Accordingly, the Group’s free cash flow (as generated from operating and investing activities combined)amounted to ¥4,865 million in FY2002.
This cash generation was used to fund debt repayments and dividend payments, and net cash used infinancing activities amounted to ¥2,718 million, a decrease of ¥2,488 million compared with the precedingyear.
Reflecting the above, the Group’s cash and cash equivalents at the end of FY2002 increased by ¥2,140million, compared with the end of FY2001, to ¥3,511 million.
Cash Flows
The Group’s total assets at the end of FY2002 increased by ¥3,313 million, compared with the end of FY2001,to ¥60,433 million. This chiefly reflected an increase of ¥2,140 million in liquidity at hand (including moneydeposited) and growth in accounts receivable from increased sales.
In FY2002, as in the preceding year, the Group continued efforts to reduce interest-carrying debt, in order tofurther strengthen its financial health. Accordingly, interest-carrying debt at the end of FY2002 decreased by¥2,343 million, compared with the end of FY2001, to ¥14,804 million.
Shareholders’ equity increased by ¥718 million to ¥18,346 million, but the shareholders’ equity ratio declinedby 0.5 point to 30.4%.
Total Assets and Shareholders’ Equity
13
Consolidated Financial StatementsTeijin Seiki Company Limited
Years ended March 31, 2003 and 2002
Contents
Consolidated Balance Sheets.............................................................. 14
Consolidated Statements of Operations.............................................................. 16
Consolidated Statements of Shareholders’ Equity.............................................................. 17
Consolidated Statements of Cash Flows.............................................................. 18
Notes to Consolidated Financial Statements.............................................................. 19
Report of Independent Public Accountants.............................................................. 35
14
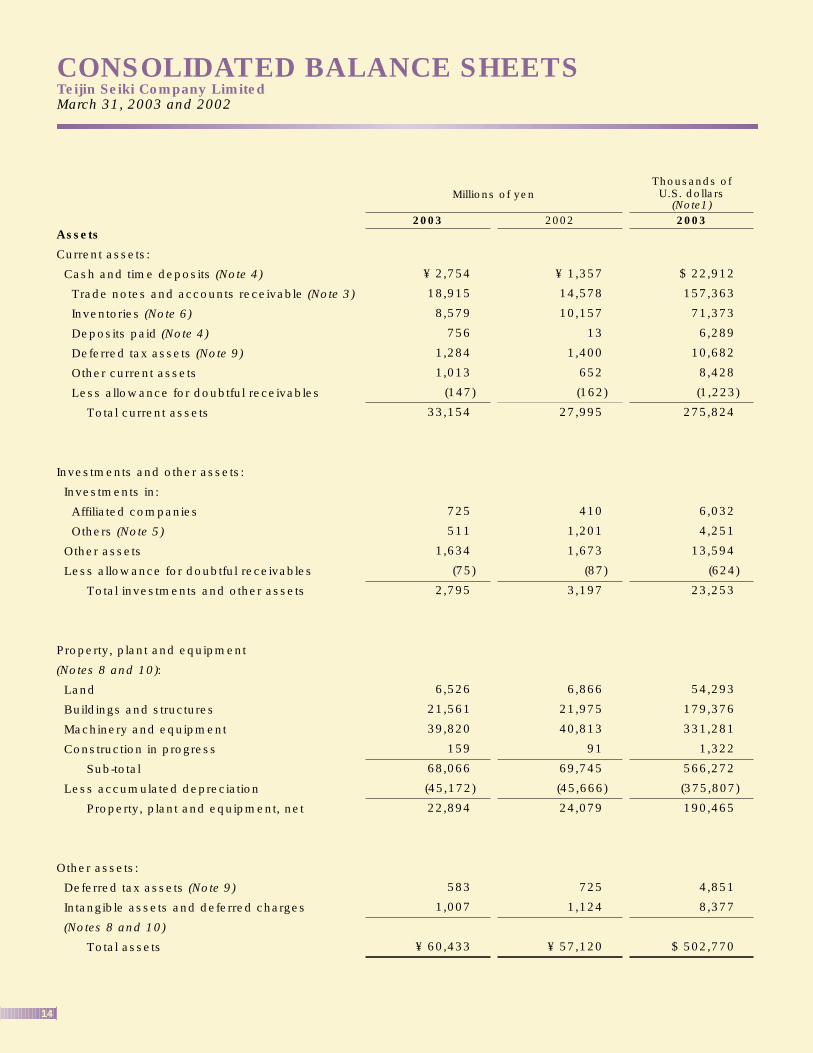
CONSOLIDATED BALANCE SHEETSTeijin Seiki Company Limited March 31, 2003 and 2002
Millions of yen
2003
Thousands ofU.S. dollars
(Note1)2002 2003
¥ 2,754
18,915
8,579
756
1,284
1,013
(147)
33,154
725
511
1,634
(75)
2,795
6,526
21,561
39,820
159
68,066
(45,172)
22,894
583
1,007
¥ 60,433
¥ 1,357
14,578
10,157
13
1,400
652
(162)
27,995
410
1,201
1,673
(87)
3,197
6,866
21,975
40,813
91
69,745
(45,666)
24,079
725
1,124
¥ 57,120
$ 22,912
157,363
71,373
6,289
10,682
8,428
(1,223)
275,824
6,032
4,251
13,594
(624)
23,253
54,293
179,376
331,281
1,322
566,272
(375,807)
190,465
4,851
8,377
$ 502,770
Assets
Current assets:
Cash and time deposits (Note 4)
Trade notes and accounts receivable (Note 3)
Inventories (Note 6)
Deposits paid (Note 4)
Deferred tax assets (Note 9)
Other current assets
Less allowance for doubtful receivables
Total current assets
Investments and other assets:
Investments in:
Affiliated companies
Others (Note 5)
Other assets
Less allowance for doubtful receivables
Total investments and other assets
Property, plant and equipment
(Notes 8 and 10):
Land
Buildings and structures
Machinery and equipment
Construction in progress
Sub-total
Less accumulated depreciation
Property, plant and equipment, net
Other assets:
Deferred tax assets (Note 9)
Intangible assets and deferred charges
(Notes 8 and 10)
Total assets
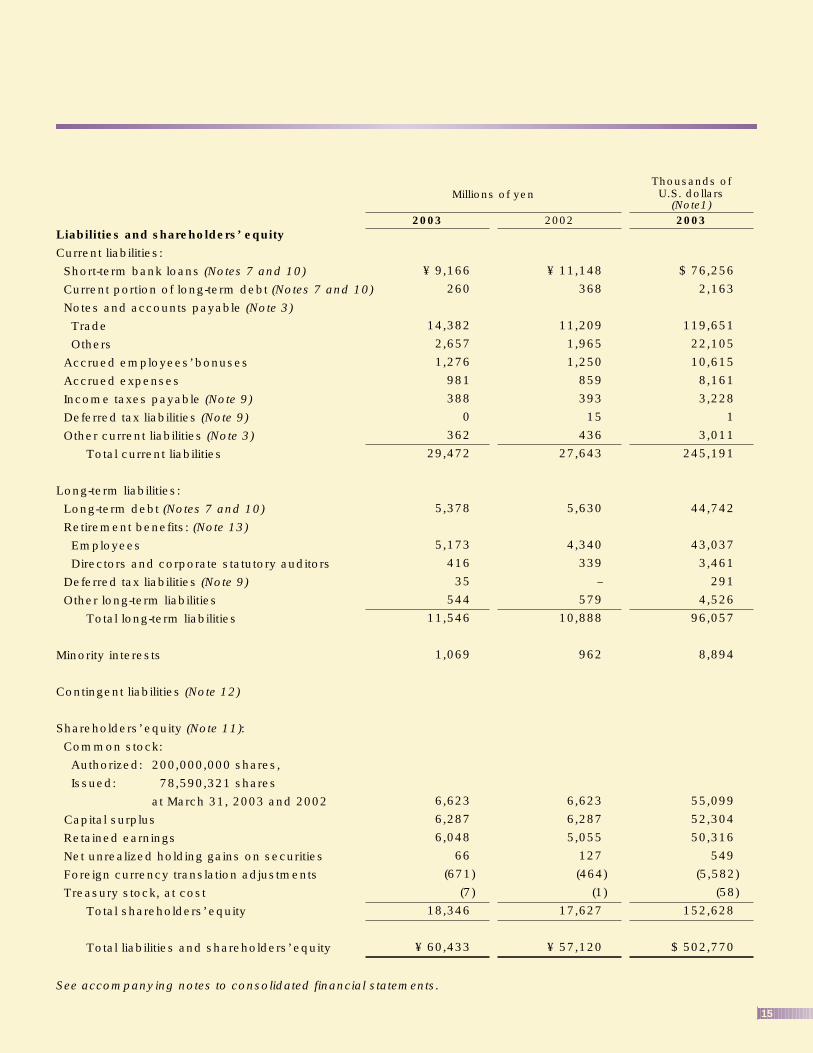
15
Liabilities and shareholders’ equity
Current liabilities:
Short-term bank loans (Notes 7 and 10)
Current portion of long-term debt (Notes 7 and 10)
Notes and accounts payable (Note 3)
Trade
Others
Accrued employees’ bonuses
Accrued expenses
Income taxes payable (Note 9)
Deferred tax liabilities (Note 9)
Other current liabilities (Note 3)
Total current liabilities
Long-term liabilities:
Long-term debt (Notes 7 and 10)
Retirement benefits: (Note 13)
Employees
Directors and corporate statutory auditors
Deferred tax liabilities (Note 9)
Other long-term liabilities
Total long-term liabilities
Minority interests
Contingent liabilities (Note 12)
Shareholders’ equity (Note 11):
Common stock:
Authorized: 200,000,000 shares,
Issued: 78,590,321 shares
at March 31, 2003 and 2002
Capital surplus
Retained earnings
Net unrealized holding gains on securities
Foreign currency translation adjustments
Treasury stock, at cost
Total shareholders’ equity
Total liabilities and shareholders’ equity
See accompanying notes to consolidated financial statements.
¥ 9,166
260
14,382
2,657
1,276
981
388
0
362
29,472
5,378
5,173
416
35
544
11,546
1,069
6,623
6,287
6,048
66
(671)
(7)
18,346
¥ 60,433
Millions of yen
2003
Thousands ofU.S. dollars
(Note1)2002 2003
¥ 11,148
368
11,209
1,965
1,250
859
393
15
436
27,643
5,630
4,340
339
–
579
10,888
962
6,623
6,287
5,055
127
(464)
(1)
17,627
¥ 57,120
$ 76,256
2,163
119,651
22,105
10,615
8,161
3,228
1
3,011
245,191
44,742
43,037
3,461
291
4,526
96,057
8,894
55,099
52,304
50,316
549
(5,582)
(58)
152,628
$ 502,770
16
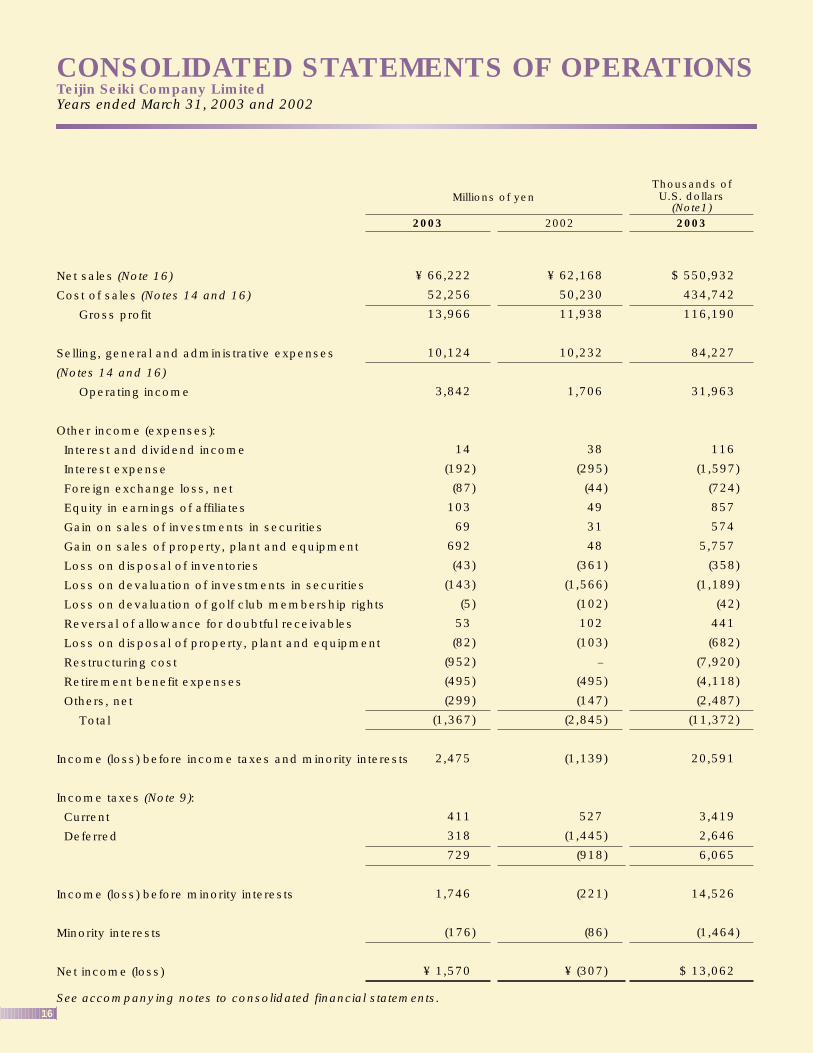
CONSOLIDATED STATEMENTS OF OPERATIONSTeijin Seiki Company LimitedYears ended March 31, 2003 and 2002
Net sales (Note 16)
Cost of sales (Notes 14 and 16)
Gross profit
Selling, general and administrative expenses
(Notes 14 and 16)
Operating income
Other income (expenses):
Interest and dividend income
Interest expense
Foreign exchange loss, net
Equity in earnings of affiliates
Gain on sales of investments in securities
Gain on sales of property, plant and equipment
Loss on disposal of inventories
Loss on devaluation of investments in securities
Loss on devaluation of golf club membership rights
Reversal of allowance for doubtful receivables
Loss on disposal of property, plant and equipment
Restructuring cost
Retirement benefit expenses
Others, net
Total
Income (loss) before income taxes and minority interests
Income taxes (Note 9):
Current
Deferred
Income (loss) before minority interests
Minority interests
Net income (loss)
See accompanying notes to consolidated financial statements.
Millions of yen
2003
Thousands ofU.S. dollars
(Note1)2002 2003
¥ 62,168
50,230
11,938
10,232
1,706
38
(295)
(44)
49
31
48
(361)
(1,566)
(102)
102
(103)
–
(495)
(147)
(2,845)
(1,139)
527
(1,445)
(918)
(221)
(86)
¥ (307)
$ 550,932
434,742
116,190
84,227
31,963
116
(1,597)
(724)
857
574
5,757
(358)
(1,189)
(42)
441
(682)
(7,920)
(4,118)
(2,487)
(11,372)
20,591
3,419
2,646
6,065
14,526
(1,464)
$ 13,062
¥ 66,222
52,256
13,966
10,124
3,842
14
(192)
(87)
103
69
692
(43)
(143)
(5)
53
(82)
(952)
(495)
(299)
(1,367)
2,475
411
318
729
1,746
(176)
¥ 1,570
17
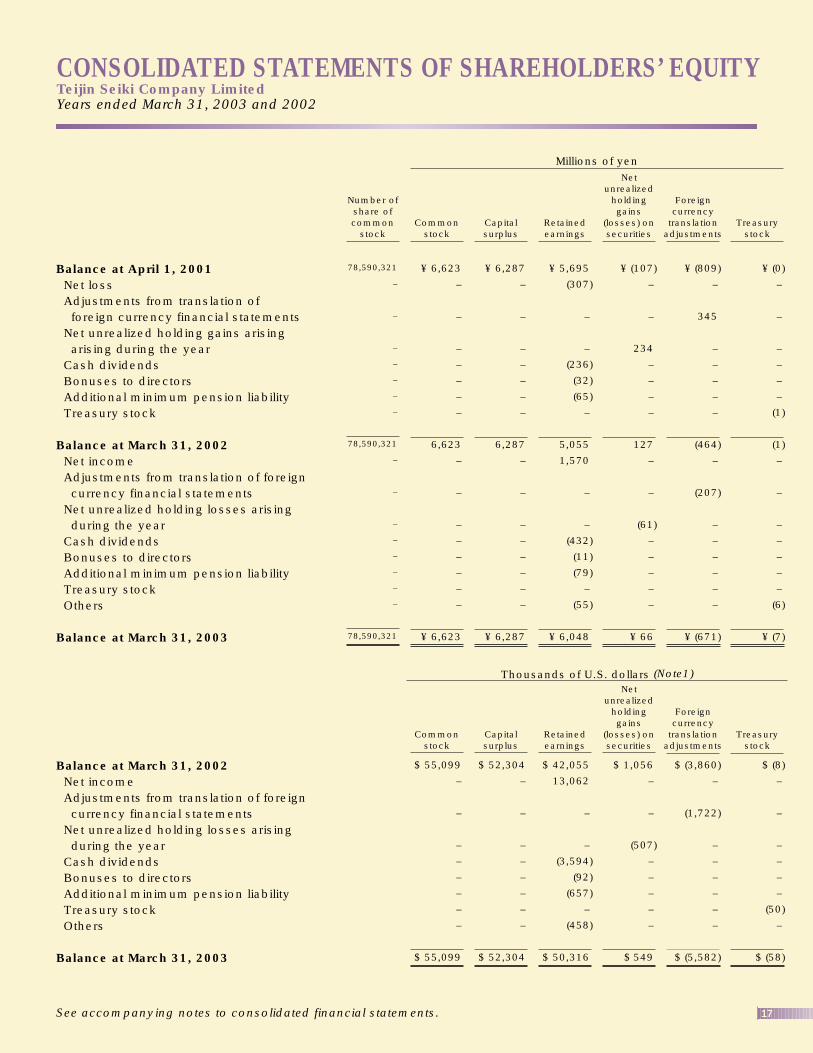
CONSOLIDATED STATEMENTS OF SHAREHOLDERS’ EQUITYTeijin Seiki Company LimitedYears ended March 31, 2003 and 2002
Balance at April 1, 2001Net lossAdjustments from translation offoreign currency financial statements
Net unrealized holding gains arising arising during the year
Cash dividendsBonuses to directorsAdditional minimum pension liabilityTreasury stock
Balance at March 31, 2002Net incomeAdjustments from translation of foreign currency financial statements
Net unrealized holding losses arising during the year
Cash dividendsBonuses to directorsAdditional minimum pension liabilityTreasury stockOthers
Balance at March 31, 2003
Balance at March 31, 2002Net incomeAdjustments from translation of foreigncurrency financial statements
Net unrealized holding losses arising during the year
Cash dividendsBonuses to directorsAdditional minimum pension liabilityTreasury stockOthers
Balance at March 31, 2003
See accompanying notes to consolidated financial statements.
Millions of yen
Number ofshare ofcommon
stock
78,590,321
–
–
–
–
–
–
–
78,590,321
–
–
–
–
–
–
–
–
78,590,321
Commonstock
¥ 6,623
–
–
–
–
–
–
–
6,623
–
–
–
–
–
–
–
–
¥ 6,623
$ 55,099
–
–
–
–
–
–
–
–
$ 55,099
Capitalsurplus
¥ 6,287
–
–
–
–
–
–
–
6,287
–
–
–
–
–
–
–
–
¥ 6,287
$ 52,304
–
–
–
–
–
–
–
–
$ 52,304
Retainedearnings
¥ 5,695
(307)
–
–
(236)
(32)
(65)
–
5,055
1,570
–
–
(432)
(11)
(79)
–
(55)
¥ 6,048
$ 42,055
13,062
–
–
(3,594)
(92)
(657)
–
(458)
$ 50,316
Netunrealized
holdinggains
(losses) onsecurities
¥ (107)
–
–
234
–
–
–
–
127
–
–
(61)
–
–
–
–
–
¥ 66
$ 1,056
–
–
(507)
–
–
–
–
–
$ 549
Foreigncurrency
translationadjustments
¥ (809)
–
345
–
–
–
–
–
(464)
–
(207)
–
–
–
–
–
–
¥ (671)
$ (3,860)
–
(1,722)
–
–
–
–
–
–
$ (5,582)
Treasurystock
¥ (0)
–
–
–
–
–
–
(1)
(1)
–
–
–
–
–
–
–
(6)
¥ (7)
$ (8)
–
–
–
–
–
–
(50)
–
$ (58)
Thousands of U.S. dollars (Note1)
Commonstock
Capitalsurplus
Retainedearnings
Netunrealized
holdinggains
(losses) onsecurities
Foreigncurrency
translationadjustments
Treasurystock
18
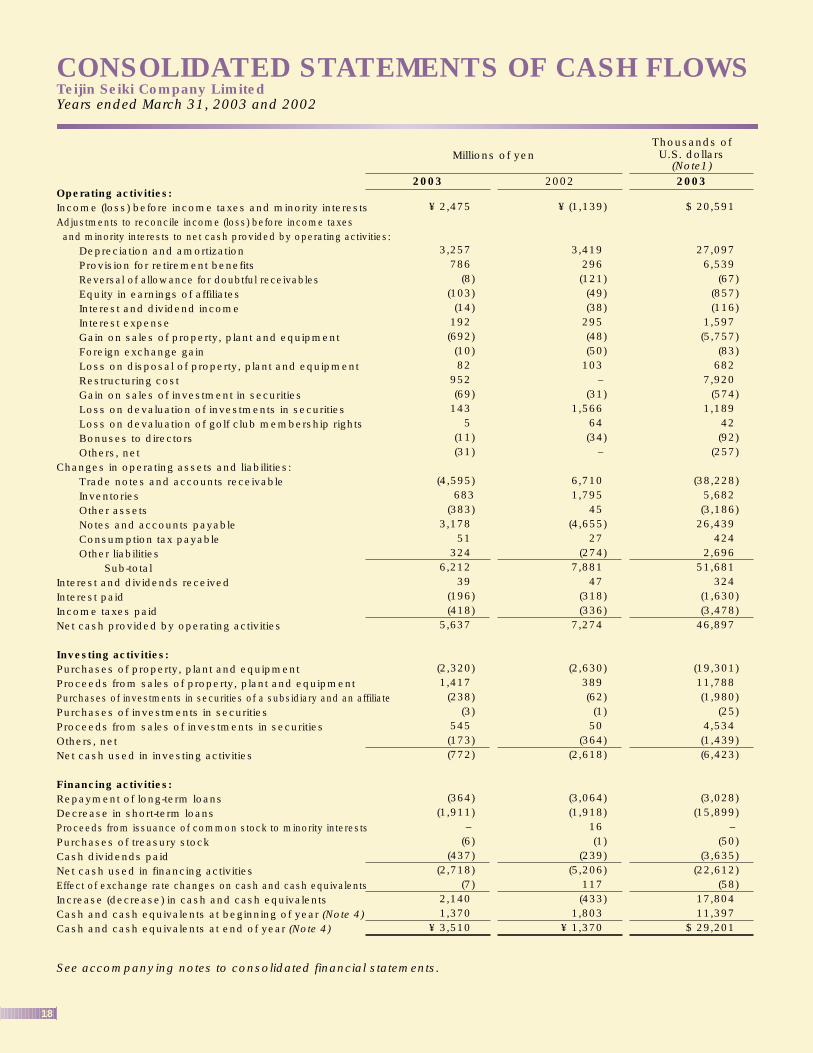
Operating activities:Income (loss) before income taxes and minority interestsAdjustments to reconcile income (loss) before income taxes and minority interests to net cash provided by operating activities:
Depreciation and amortizationProvision for retirement benefitsReversal of allowance for doubtful receivablesEquity in earnings of affiliatesInterest and dividend incomeInterest expenseGain on sales of property, plant and equipmentForeign exchange gainLoss on disposal of property, plant and equipmentRestructuring costGain on sales of investment in securitiesLoss on devaluation of investments in securitiesLoss on devaluation of golf club membership rightsBonuses to directorsOthers, net
Changes in operating assets and liabilities:Trade notes and accounts receivableInventoriesOther assetsNotes and accounts payableConsumption tax payableOther liabilities
Sub-totalInterest and dividends receivedInterest paidIncome taxes paidNet cash provided by operating activities
Investing activities:Purchases of property, plant and equipmentProceeds from sales of property, plant and equipmentPurchases of investments in securities of a subsidiary and an affiliatePurchases of investments in securitiesProceeds from sales of investments in securitiesOthers, netNet cash used in investing activities
Financing activities:Repayment of long-term loansDecrease in short-term loansProceeds from issuance of common stock to minority interestsPurchases of treasury stockCash dividends paidNet cash used in financing activitiesEffect of exchange rate changes on cash and cash equivalentsIncrease (decrease) in cash and cash equivalentsCash and cash equivalents at beginning of year (Note 4)Cash and cash equivalents at end of year (Note 4)
See accompanying notes to consolidated financial statements.
¥ 2,475
3,257786
(8)(103)(14)
192(692)(10)82
952(69)
1435
(11)(31)
(4,595)683
(383)3,178
51324
6,21239
(196)(418)
5,637
(2,320)1,417
(238)(3)
545(173)(772)
(364)(1,911)
–(6)
(437)(2,718)
(7)2,1401,370
¥ 3,510
Millions of yen
2003
Thousands ofU.S. dollars
(Note1)2002 2003
¥ (1,139)
3,419296(121)(49)(38)
295(48)(50)
103–
(31)1,566
64(34)
–
6,7101,795
45(4,655)
27(274)
7,88147
(318)(336)
7,274
(2,630)389(62)(1)
50(364)
(2,618)
(3,064)(1,918)
16(1)
(239)(5,206)
117(433)
1,803¥ 1,370
$ 20,591
27,0976,539
(67)(857)(116)
1,597(5,757)
(83)682
7,920(574)
1,18942(92)
(257)
(38,228)5,682(3,186)
26,439424
2,69651,681
324(1,630)(3,478)
46,897
(19,301)11,788(1,980)
(25)4,534(1,439)(6,423)
(3,028)(15,899)
–(50)
(3,635) (22,612)
(58)17,80411,397
$ 29,201
CONSOLIDATED STATEMENTS OF CASH FLOWSTeijin Seiki Company LimitedYears ended March 31, 2003 and 2002
19
NOTES TO CONSOLIDATED FINANCIAL STATEMENTSTeijin Seiki Company LimitedYears ended March 31, 2003 and 2002
1. Description of Business and Basis of Presenting Consolidated Financial Statements
(1) Description of business
Teijin Seiki Company Limited (the “Company”), a Japanese
corporation, is a majority-owned subsidiary of Teijin Limited.
The main products of the Company and its consolidated
subsidiaries (the “Companies”) include precision equipment,
aircraft and oil hydraulic equipment, and textile and industrial
machinery.
The Company will change its name to “TS Corporation” on
October 1, 2003, based on approval of general shareholders’
meeting held on June 24, 2003.
(2) Basis of presenting consolidated financial statements
The Company and its consolidated domestic subsidiaries
maintain their official accounting records in Japanese yen in
accordance with the provisions set forth in the Japanese
Commercial Code and accounting principles and practices
generally accepted in Japan (“Japanese GAAP”). The accounts
of consolidated foreign subsidiaries are based on their
accounting records maintained in conformity with generally
accepted accounting principles and practices prevailing in the
respective countries of domicile. Certain accounting
principles and practices generally accepted in Japan are
different from International Accounting Standards and
standards in other countries in certain respects as to
application and disclosure requirements. Accordingly, the
accompanying financial statements are intended for use by
those who are informed about Japanese accounting
principles and practices.
The accompanying consolidated financial statements have
been restructured and translated into English (with some
expanded descriptions and the inclusion of statements of
shareholders’ equity) from the consolidated financial
statements of the Company prepared in accordance with
Japanese GAAP and filed with the appropriate Local Finance
Bureau of the Ministry of Finance as required by the
Securities and Exchange Law. Some supplementary
information included in the statutory Japanese language
consolidated financial statements, but not required for fair
presentation is not presented in the accompanying financial
statements.
The translation of the Japanese yen amounts into U.S. dollars
are included solely for the convenience of readers, using the
prevailing exchange rate at March 31, 2003, which was
¥120.20 to U.S.$1. The convenience translations should not
be construed as representations that the Japanese yen
amounts have been, could have been, or could in the future
be, converted into U.S. dollars at this or any other rate of
exchange.
2. Summary of Significant Accounting Policies
(1) Principles of consolidation
The accompanying consolidated financial statements include
the accounts of the Company and all subsidiaries which are
controlled through substantial ownership of majority voting
rights or existence of certain conditions. All significant inter-
company transactions, account balances and unrealized
profits are eliminated in consolidation.
In the elimination of investments in subsidiaries, the assets
and liabilities of the subsidiaries, including the portion
attributable to minority shareholders, are evaluated using the
fair value at the time the Company acquired control of the
respective subsidiaries.
The difference between the cost of investments in
subsidiaries and the equity in their net assets at the date of
acquisition is amortized over a period of five years on a
straight-line basis.
(2) Equity method
Investments in two affiliated companies, which include all of
20% to 50% owned companies are accounted for by the
equity method. The Company has no unconsolidated
subsidiary, nor affiliated company which is not accounted for
by the equity method.
(3) Cash and cash equivalents
For the purpose of the consolidated statements of cash
flows, cash and cash equivalents consist of cash on hand,
deposits with banks drawable on demand and short-term
investments which are readily convertible to cash subject to
an insignificant risk of changes in value and which were
purchased with an original maturity of three months or less.
See Note 4 as to reconciliation to cash and time deposits on
the balance sheets.
(4) Allowance for doubtful receivables
The allowance for doubtful receivables is provided in
amounts management considers sufficient to cover possible
losses on collection. The allowance is based on past
collection experience and management estimate of the
collectibility of individual receivables.
20
2. Summary of Significant Accounting Policies(continued)
(5) Securities
The companies are required to examine the intent of holding
each security and classify those securities as (a) securities
held for trading purposes (hereafter, “trading securities”), (b)
debt securities intended to be held to maturity (hereafter,
“held-to-maturity debt securities”), (c) equity securities issued
by subsidiaries and affiliated companies, and (d) for all other
securities that are not classified in any of the above
categories (hereafter, “available-for-sale securities”) The
Company had no trading securities and held-to-maturity debt
securities at March 31, 2003 and 2002.
As mentioned in (1) and (2), all equity securities issued by
subsidiaries and affiliated companies are consolidated or
accounted for using the equity method. Available-for-sale
securities with available fair market values are stated at fair
market value. Unrealized gains and losses on these securities
are reported, net of applicable income taxes, as a separate
component of shareholders’ equity. Realized gains and
losses on sale of such securities are computed using
moving-average cost method. Other securities with no
available fair market value are stated at moving-average cost.
If the market value of available-for-sale securities declines
significantly, such securities are stated at fair market value
and the difference between fair market value and the carrying
amount is recognized as loss in the period of the decline. For
equity securities with no available fair market value, if the net
asset value of the investee declines significantly, such
securities should be written down to net asset value with a
corresponding charge in the income statement in the period
of decline. In these cases, such fair market value or the net
asset value will be the carrying amount of the securities at the
beginning of the next year.
(6) Inventories
Inventories of the Company and its consolidated domestic
subsidiaries are stated at cost. The cost of finished goods
and work in process are principally determined by the
specific identification method and the cost of raw materials is
determined by either the moving average method or the
periodic weighted average method. Inventories of
consolidated foreign subsidiaries are principally stated at the
lower of cost, which is determined by the first-in, first-out
method, or market.
(7) Property, plant and equipment
Property, plant and equipment are stated at cost. The
Company and its consolidated domestic subsidiaries
calculate depreciation principally by the declining-balance
method over the estimated useful lives of the respective
assets, except for buildings acquired on or after April 1, 1998,
which are depreciated by the straight-line method over the
estimated useful lives of the respective assets. Machinery
and equipment, whose acquisition cost is ¥100 thousand or
more but less than ¥200 thousand, are depreciated over a
period of three years on a straight-line basis. The
consolidated foreign subsidiaries calculate depreciation
principally by the straight-line method over the estimated
useful lives of the respective assets.
(8) Leases
Non-cancelable leases are accounted for in the same manner
as operating leases (whether such leases are classified as
operating or finance leases) except that lease agreements
which stipulate the transfer of ownership of the leased assets
to the lessee are accounted for as finance leases. Certain
consolidated foreign subsidiaries capitalize their assets
leased under finance lease contracts in accordance with local
accounting principles.
(9) Derivative financial instruments and hedging transactions
The Companies use forward foreign exchange contracts and
forward foreign currency options as derivative financial
instruments only for the purpose of mitigating future risks of
fluctuation of foreign currency exchange rates with respect to
foreign currency receivables and payables.
The basic policies for executing the derivative transactions
are managed by the Board of Directors of the Company.
Based on such policies, the finance departments of each
company establish the internal regulations which prescribe
the specified limits and procedures on the derivative
transactions. After execution, each finance department has
to report the certain information on derivative transactions to
the Board of Directors of the Company.
The following summarizes hedging derivative financial
instruments used by the Companies and items hedged:
Hedging instruments: Hedged items:
Forward foreign Foreign currency trade
exchange contracts receivables and trade payables
Forward foreign currency Foreign currency trade
option contracts receivables and trade payables
21
NOTES TO CONSOLIDATED FINANCIAL STATEMENTS
The Companies evaluate hedge effectiveness semi-annually
by comparing the cumulative changes in cash flows from or
the changes in fair value of hedged items and the
corresponding changes in the hedging derivative
instruments.
The companies are required to state derivative financial
instruments at fair value and to recognize changes in the fair
value as gains or losses unless derivative financial
instruments are used for hedging purposes.
If derivative financial instruments are used as hedges and
meet certain hedging criteria, the companies defer
recognition of gains or losses resulting from changes in fair
value of derivative financial instruments until the related
losses or gains on the hedged items are recognized.
However, in cases where forward foreign exchange
contracts or forward foreign currency option contracts are
used as hedges and meet certain hedging criteria, hedging
instruments and hedged items are accounted for in the
following manner:
1. If a forward foreign exchange contract or a forward foreign
currency option contract is executed to hedge an existing
foreign currency receivable or payable,
(a) the difference, if any, between the Japanese yen amount
of the hedged foreign currency receivable or payable
translated using the spot rate at the inception date of the
contract and the book value of the receivable or payable is
recognized in the income statement in the period which
includes the inception date, and
(b) the discount or premium on the contract (that is, the
difference between the Japanese yen amount of the contract
translated using the contracted forward rate and that
translated using the spot rate at the inception date of the
contract) is recognized over the term of the contract
2. If a forward foreign exchange contract or a forward foreign
currency option contract is executed to hedge a future
transaction denominated in a foreign currency, the future
transaction will be recorded using the contracted forward
rate, and no gains or losses on the forward foreign exchange
contract or the forward foreign currency options are
recognized.
(10) Amortization
Amortization of intangible assets is computed using the
straight-line method, principally over five years. Software is
included in intangible assets and amortized using the straight-
line method over the estimated useful lives (five years).
(11) Research and development costs
Research and development costs are charged to income
when incurred.
(12) Income taxes
The Companies recognize tax effects of timing differences
between the carrying amounts of assets and liabilities for
financial reporting purposes and the amounts for tax
reporting purpose. Income taxes comprise of corporation
tax, enterprise tax and prefectural and municipal inhabitants
taxes.
(13) Accrued employees’ bonuses
Accrued employees’ bonuses are accounted for at the
amount of the estimated bonuses to be paid and allocated to
the current fiscal year.
(14) Translation of foreign currencies
Monetary assets and liabilities denominated in foreign
currencies are translated into Japanese yen at the year-end
rates.
Financial statements of consolidated foreign subsidiaries are
translated into Japanese yen at the year-end rates, except
that shareholders’ equity accounts are translated at historical
rates and income statement items resulting from transactions
with the Company at the rates used by the Company. The
Company and its domestic subsidiaries report foreign
currency translation adjustments in the shareholders’ equity
and minority interests.
(15) Appropriation of retained earnings
Under the Commercial Code of Japan, the appropriation of
retained earnings with respect to a given financial period is
made by resolution of the shareholders at a general meeting
held subsequent to the close of such financial period. The
accounts for that period do not, therefore, reflect such
appropriations. (See Note 18).
(16) Employees’ severance and retirement benefits
The Company and its certain consolidated subsidiaries
provide two types of post-employment benefit plans,
unfunded lump-sum payment plans and funded non-
contributory pension plans, under which all eligible
employees are entitled to benefits based on the level of
wages and salaries at the time of retirement or termination,
length of service and certain other factors.
22
2. Summary of Significant Accounting Policies (continued)
(16) Employees’ severance and retirement benefits
(continued)
The Companies provided allowance for employees’
severance and retirement benefits at the end of years based
on the estimated amounts of projected benefit obligation,
actuarially calculated using certain assumptions and the fair
value of the plan assets at that dates.
The net transition obligation of ¥2,474 million (the excess of
the projected benefit obligation over the total of the fair value
of pension assets and the liabilities for severance and
retirement benefits) has been recognized in expenses in
equal amounts primarily over five years commencing with
the year ended March 31, 2001. Prior service costs are
recognized in expenses when incurred, and actuarial gains
and losses are recognized in expenses using the straight-line
method over the average of the estimated remaining service
lives commencing with the following period.
In addition, subject to the shareholders’ approval, directors
and corporate statutory auditors of the Company and its
consolidated domestic subsidiaries are customarily entitled
to lump-sum payments under unfunded retirement benefits
plans. The provision for retirement allowances for these
officers has been made at estimated amounts based on each
company’s internal rule.
(17) Treasury stock and statutory reserves
Effective April 1, 2002, the Company and consolidated
domestic subsidiaries adopted the new accounting standard
for treasury stock and reversal of statutory reserves
(Accounting Standards Board Statement No. 1, "Accounting
Standard for Treasury Stock and Reduction of Statutory
Reserves", issued by the Accounting Standards Board of
Japan on February 21, 2002).
The adoption of the new accounting standard had no impact
on the financial statements.
(18) Earning per share
Effective April 1, 2002, the Company adopted the new
accounting standard for earnings per share and related
guidance (Accounting Standards Board Statement No. 2,
"Accounting Standard for Earnings Per Share" and Financial
Standards Implementation Guidance No. 4, "Implementation
Guidance for Accounting Standard for Earnings Per Share",
issued by the Accounting Standards Board of Japan on
September 25, 2002).
The effect of adopting of the new standard and guidance is
disclosed in the Note 17.
(19) Reclassifications
Certain prior year amounts have been reclassified to conform
to the year 2003 presentation. These changes had no impact
on previously reported results of operations or shareholders’
equity.
5. Securities
The information on securities for the Companies at March 31, 2003 and 2002 is shown below.
The following tables summarize acquisition costs, book values and fair values of securities with available fair values as of March
31, 2003 and 2002:
(Available-for-sale securities)
(1) Securities with book values exceeding acquisition costs:
Equity securities
Bonds
Others
Total
Millions of yen
2003
Thousands ofU.S. dollars
2002 2003
$ 965
–
–
$ 965
DifferenceBook valueAcquisition
costDifferenceBook valueAcquisition
costDifferenceBook valueAcquisition
costType
$ 3,062
–
–
$ 3,062
$ 2,097
–
–
$ 2,097
¥ 220
–
–
¥ 220
¥ 1,149
–
–
¥ 1,149
¥ 929
–
–
¥ 929
¥ 116
–
–
¥ 116
¥ 368
–
–
¥ 368
¥ 252
–
–
¥ 252
23
NOTES TO CONSOLIDATED FINANCIAL STATEMENTS
3. Effect of Bank Holiday
As financial institutions in Japan were closed on March 31, 2002, amounts that would normally be settled on March 31 were
collected or paid on the following business day, April 1. The effect of the settlements on April 1 and April 2 instead of March 31,
2002 included the following:
Trade notes receivable
Notes payable - trade
Note payable - other
4. Cash and Cash Equivalents
Reconciliation of cash and time deposits shown in the consolidated balance sheets and cash and cash equivalents shown in the
consolidated statements of cash flows as of March 31, 2003 and 2002 are as follows:
Cash and time deposits
Deposits paid
Total
¥ 2,754
756
¥ 3,510
Millions of yen
2003
Thousands ofU.S. dollars
2002 2003
¥ 1,357
13
¥ 1,370
$ 22,912
6,289
$ 29,201
¥ 151
110
1
Millions of yen
2002
5. Securities (continued)
(2) Securities with book values not exceeding acquisition costs :
Equity securities
Bonds
Others
Total
The Companies recognized impairment loss for the securities, whose available fair values declined more than 50% of the carrying
amount, based on the Japanese accounting standard for financial instruments and guidelines concerning the accounting for
financial instruments. The amounts of impairment loss for the years ended March 31, 2003 and 2002 were ¥143 million ($1,189
thousand) and ¥1,566 million, respectively. As impairment losses were recognized in the statements of operations, the above lists
of available-for-sale securities exclude such securities written down to fair values.
The following tables summarize book values of securities with no available fair values as of March 31, 2003 and 2002:
(Available-for-sale securities)
Non-listed equity securities
Non-listed foreign equity securities
Money market fund
Total
Total sales of available-for-sale securities sold and the related gains and losses in the years ended March 31, 2003 and 2002
were as follows:
Sales of available-for-sale securities
Gains on sales of available-for-sale securities
Losses on sales of available-for-sale securities
24
¥ 545
69
–
Millions of yen
2003
Thousands ofU.S. dollars
2002 2003
¥ 50
31
0
$ 4,534
574
–
¥ 34
–
–
¥ 34
Millions of yen
2003
Thousands ofU.S. dollars
2002 2003
¥ 32
–
–
¥ 32
$ 282
–
–
$ 282
Millions of yen
2003
Thousands ofU.S. dollars
2002 2003
$ (58)
–
–
$ (58)
DifferenceBook valueAcquisition
costDifferenceBook valueAcquisition
costDifferenceBook valueAcquisition
cost
$ 907
–
–
$ 907
$ 965
–
–
$ 965
¥ (8)
–
–
¥ (8)
¥ 20
–
–
¥ 20
¥ 28
–
–
¥ 28
¥ (7)
–
–
¥ (7)
¥ 109
–
–
¥ 109
¥ 116
–
–
¥ 116
Type
Type Book value
Year ending March 31,
7. Short-term Bank Loans and Long-term Debt
Short-term bank loans at March 31, 2003 and 2002 represented bank notes at interest rates ranging from 0.29% to 16.25% and from
0.26%to 19.00% per annum, respectively.
Long-term debt at March 31, 2003 and 2002 consisted of the following:
1.38% bonds, payable in Japanese yen, due 2004
(guaranteed by Teijin Limited)
Loans, principally from banks at interest rates
from 0% to 5.5%, due through 2008
Total
Less current portion
Long-term debt, net
The aggregate annual maturities of long-term debt subsequent to March 31, 2003 are summarized as follows:
2004
2005
2006
2007
2008
2009 and thereafter
Total
The Companies’ assets pledged as collateral to secure bank loans in the aggregate amount of ¥ 375 million ($ 3,120 thousand)
and ¥ 886 million at March 31, 2003 and 2002, respectively, are summarized in Note 10.
Millions of yenThousands ofU.S. dollars
¥ 260
5,143
104
92
35
4
¥ 5,638
$ 2,163
42,788
865
765
291
33
$ 46,905
¥ 5,000
638
5,638
(260)
¥ 5,378
Millions of yen
2003
Thousands ofU.S. dollars
2002 2003
¥ 5,000
998
5,998
(368)
¥ 5,630
$ 41,597
5,308
46,905
(2,163)
$ 44,742
25
NOTES TO CONSOLIDATED FINANCIAL STATEMENTS
6. Inventories
Inventories at March 31, 2003 and 2002 consisted of the following:
Finished goods
Works in process
Raw materials
Supplies
Total inventories
¥ 692
4,562
3,042
283
¥ 8,579
Millions of yen
2003
Thousands ofU.S. dollars
2002 2003
¥ 979
4,771
4,137
270
¥ 10,157
$ 5,758
37,953
25,308
2,354
$ 71,373
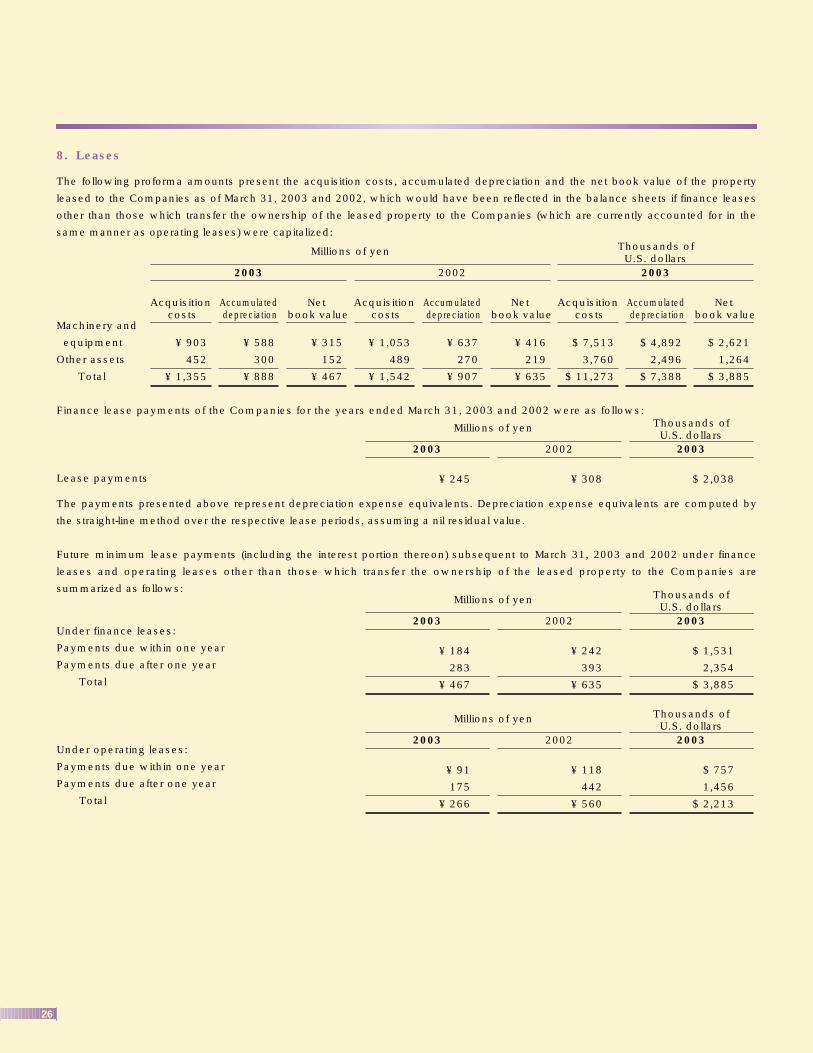
26
8. Leases
The following proforma amounts present the acquisition costs, accumulated depreciation and the net book value of the property
leased to the Companies as of March 31, 2003 and 2002, which would have been reflected in the balance sheets if finance leases
other than those which transfer the ownership of the leased property to the Companies (which are currently accounted for in the
same manner as operating leases) were capitalized:
Machinery and
equipment
Other assets
Total
Finance lease payments of the Companies for the years ended March 31, 2003 and 2002 were as follows:
Lease payments
The payments presented above represent depreciation expense equivalents. Depreciation expense equivalents are computed by
the straight-line method over the respective lease periods, assuming a nil residual value.
Future minimum lease payments (including the interest portion thereon) subsequent to March 31, 2003 and 2002 under finance
leases and operating leases other than those which transfer the ownership of the leased property to the Companies are
summarized as follows:
Under finance leases:
Payments due within one year
Payments due after one year
Total
Under operating leases:
Payments due within one year
Payments due after one year
Total
Millions of yen
2003
Thousands ofU.S. dollars
2002 2003
$ 2,621
1,264
$ 3,885
Netbook value
Accumulated depreciation
Acquisition costs
Netbook value
Accumulated depreciation
Acquisition costs
Netbook value
Accumulated depreciation
Acquisition costs
$ 4,892
2,496
$ 7,388
$ 7,513
3,760
$ 11,273
¥ 416
219
¥ 635
¥ 637
270
¥ 907
¥ 1,053
489
¥ 1,542
¥ 315
152
¥ 467
¥ 588
300
¥ 888
¥ 903
452
¥ 1,355
¥ 245
Millions of yen
2003
Thousands ofU.S. dollars
2002 2003
¥ 308 $ 2,038
¥ 184
283
¥ 467
Millions of yen
2003
Thousands ofU.S. dollars
2002 2003
¥ 242
393
¥ 635
$ 1,531
2,354
$ 3,885
¥ 91
175
¥ 266
Millions of yen
2003
Thousands ofU.S. dollars
2002 2003
¥ 118
442
¥ 560
$ 757
1,456
$ 2,213
27
NOTES TO CONSOLIDATED FINANCIAL STATEMENTS
9. Income Taxes
The Company and its domestic subsidiaries are subject to a number of taxes based on income which, in the aggregate, resulted instatutory tax rates of approximately 42% for the years ended March 31, 2003 and 2002. The effective tax rates in theaccompanying consolidated statements of operations differ from the statutory tax rates primarily due to permanently non-deductibleexpenses and timing differences in the recognition of certain income and expense items for financial and tax reporting purposes.
The following table summarizes the significant differences between the statutory tax rate and the effective tax rate for financialstatement purposes for the year ended March 31, 2003:
Statutory tax rate 42.0%Deficits of some consolidated subsidiaries 12.1%Future tax expense arising from loss on investments in subsidiaries (27.5%)Permanent non-deductible expenses 2.2%Others 0.7%Effective tax rate 29.5%
The above information is not presented for the year ended March 31, 2002, because such information is not required to disclose inthe case of occurrence of net loss.
The effective tax rate used for calculation of deferred taxes assets and liabilities was 42.0% for the year ended March 31, 2002.Effective for the year commencing on April 1, 2004 or later, according to the revised local tax law, income tax rates for enterprisetaxes will be reduced as a result of introducing the assessment by estimation on the basis of the size of business. Based on thechange of income tax rates, for calculation of deferred taxes assets and liabilities, the Company and consolidated domesticsubsidiaries used the effective tax rates of 42.0% and 40.7% for current items and non-current items, respectively, for the year endedMarch 31, 2003.
As the result of the change in the effective tax rates, deferred taxes assets decreased by ¥21million ($175 thousand) and incometaxes-deferred increased by ¥22 million ($183 thousand) compared with what would have been recorded under the previous localtax law.
The tax effects of temporary differences which give rise to a significant portion of the deferred tax assets and liabilities at March 31,2003 and 2002 are summarized as follows:
Deferred tax assets:Carried-forward net lossRetirement benefitsAccrued employees’ bonusesOther accrued expensesLoss on devaluation of inventoriesLoss on devaluation of investments in securities Allowance for doubtful receivablesOthers
Less valuation allowanceTotal deferred tax assets
Deferred tax liabilities:Deferred taxation on government contributions for acquisition of property, plant and equipment
Effect of differences between tax rates in Japan and in other countries on accumulated retained earnings of foreign subsidiaries
OthersTotal deferred tax liabilities
Deferred tax assets, net
¥ 2,6161,384
491160240
0613270
5,774(2,794)2,980
(946)
(146)(56)
(1,148)
¥ 1,832
Millions of yen
2003
Thousands ofU.S. dollars
2002 2003
¥ 2,73180736413826
65830
3805,134(2,082)3,052
(749)
(52)(141)(942)
¥ 2,110
$ 21,76411,5144,0851,3311,997
15,1002,245
48,037(23,245)24,792
(7,870)
(1,215)(466)
(9,551)
$ 15,241
28
10. Assets Pledged as Collateral
At March 31, 2003 and 2002, assets pledged as collateral for short-term bank loans and long-term debt were as follows:
Property, plant and equipment, net
of accumulated depreciation
Other assets, net of accumulated amortization
Total
Other assets shown above represent the land use rights which had been held by a subsidiary in China.
The liabilities secured by such collateral at March 31, 2003 and 2002 were as follows:
Short-term bank loans
Current portion of long-term debt
Long-term debt
Total
12. Contingent Liabilities
The Company had the following contingent liabilities at March 31, 2003 and 2002:
As guarantor of indebtedness of:
Affiliates
Others
Total
11. Shareholders’ Equity
Under the Commercial Code of Japan (the “Code”), upon the issuance of common stock, the entire amount of the issue price is
required to be accounted for as common stock, although the companies may, by resolution of the Board of Directors, account for
an amount not exceeding one-half of the issue price of the new shares as additional paid-in capital, which is included in capital
surplus.
Effective October 1, 2001, the Code provides that an amount equal to at least 10% of cash dividends and other cash appropriations
shall be appropriated and set aside as a legal earnings reserve until the total amount of legal earnings reserve and additional paid-in
capital equals 25% of common stock account. The legal earnings reserve and additional paid-in capital may be used to eliminate or
reduce a deficit by resolution of the shareholders’ meeting or may be capitalized by resolution of the Board of Directors. On
condition that the total amount of legal earnings reserve and additional paid-in capital remains being equal to or exceeding 25% of
common stock, they are available for distribution by the resolution of shareholders’ meeting. Legal earnings reserve is included in
retained earnings in the accompanying financial statements.
The maximum amount that the Company can distribute as dividends is calculated based on the non-consolidated financial
statements of the Company in accordance with the Code.
¥ 1,627
–
¥ 1,627
Millions of yen
2003
Thousands ofU.S. dollars
2002 2003
¥ 3,353
116
¥ 3,469
$ 13,536
–
$ 13,536
¥ 495
48
¥ 543
Millions of yen
2003
Thousands ofU.S. dollars
2002 2003
¥ 507
112
¥ 619
$ 4,118
399
$ 4,517
¥ –
178
197
¥ 375
Millions of yen
2003
Thousands ofU.S. dollars
2002 2003
¥ 127
331
428
¥ 886
$ –
1,481
1,639
$ 3,120
29
NOTES TO CONSOLIDATED FINANCIAL STATEMENTS
13. Employee’s Severance and Retirement Benefits
The liabilities for severance and retirement benefits included in the liability section of the consolidated balance sheets as of March
31, 2003 and 2002 consist of the following:
Projected benefit obligation
Less fair value of plan assets
Less unrecognized actuarial differences
Less unrecognized net transition obligation
Retirement benefits for employees
Severance and retirement benefit expenses, included in the consolidated statements of operations for the years ended March 31,
2003 and 2002, are comprised of the following:
Service costs-benefits earned during the year
Interest cost on projected benefit obligation
Expected return on plan assets
Amortization of actuarial differences
Amortization of prior service costs
Amortization of net transition obligation
Severance and retirement benefit expenses
Assumptions used for the years ended March 31, 2003 and 2002 were set forth as follows:
Discount rate:
Domestic companies
Foreign companies
Expected return on plan assets:
Domestic companies
Foreign companies
Amortization of actuarial differences
Amortization period of prior service cost
Amortization period of net transition obligation
2003
2.8%
6.8%
0.8%
8.0%
Mainly 14 years
1 year
5 years
2002
2.8%
7.3%
2.4%
9.0%
Mainly 14 years
1 year
5 years
14. Research and Development Costs
Research and development costs for the years ended March 31, 2003 and 2002 amounted to ¥2,506 million ($20,849 thousand)
and ¥2,160 million, respectively.
¥ 12,357
(3,902)
(2,293)
(989)
¥ 5,173
Millions of yen
2003
Thousands ofU.S. dollars
2002 2003
¥ 12,138
(4,340)
(1,974)
(1,484)
¥ 4,340
$ 102,804
(32,462)
(19,077)
(8,228)
$ 43,037
¥ 542
319
(38)
144
36
495
¥ 1,498
Millions of yen
2003
Thousands ofU.S. dollars
2002 2003
¥ 664
404
(135)
40
(308)
495
¥ 1,160
$ 4,509
2,654
(316)
1,198
300
4,118
$ 12,463
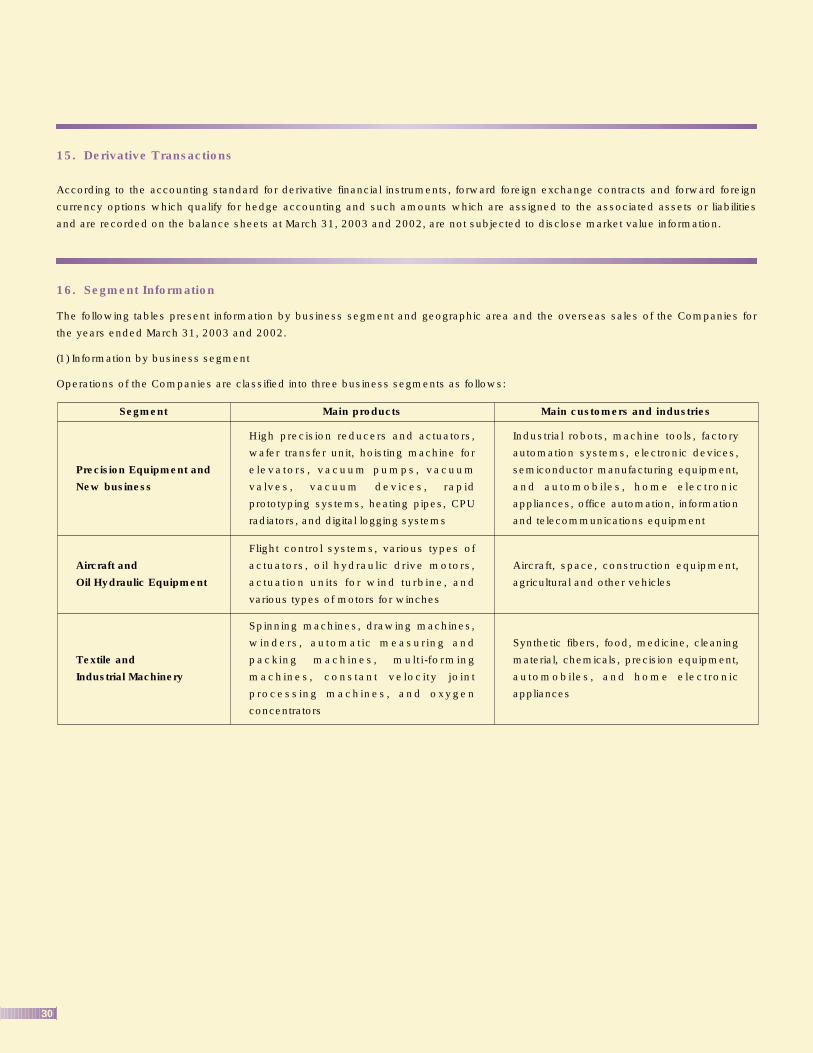
30
15. Derivative Transactions
According to the accounting standard for derivative financial instruments, forward foreign exchange contracts and forward foreign
currency options which qualify for hedge accounting and such amounts which are assigned to the associated assets or liabilities
and are recorded on the balance sheets at March 31, 2003 and 2002, are not subjected to disclose market value information.
16. Segment Information
The following tables present information by business segment and geographic area and the overseas sales of the Companies for
the years ended March 31, 2003 and 2002.
(1) Information by business segment
Operations of the Companies are classified into three business segments as follows:
Segment Main products Main customers and industries
Spinning machines, drawing machines,
winders, automatic measuring and
packing machines, multi-forming
machines, constant velocity joint
processing machines, and oxygen
concentrators
Synthetic fibers, food, medicine, cleaning
material, chemicals, precision equipment,
automobiles, and home electronic
appliances
Flight control systems, various types of
actuators, oil hydraulic drive motors,
actuation units for wind turbine, and
various types of motors for winches
Aircraft, space, construction equipment,
agricultural and other vehicles
Industrial robots, machine tools, factory
automation systems, electronic devices,
semiconductor manufacturing equipment,
and automobiles, home electronic
appliances, office automation, information
and telecommunications equipment
High precision reducers and actuators,
wafer transfer unit, hoisting machine for
elevators, vacuum pumps, vacuum
valves, vacuum devices, rapid
prototyping systems, heating pipes, CPU
radiators, and digital logging systems
Textile and
Industrial Machinery
Aircraft and
Oil Hydraulic Equipment
Precision Equipment and
New business
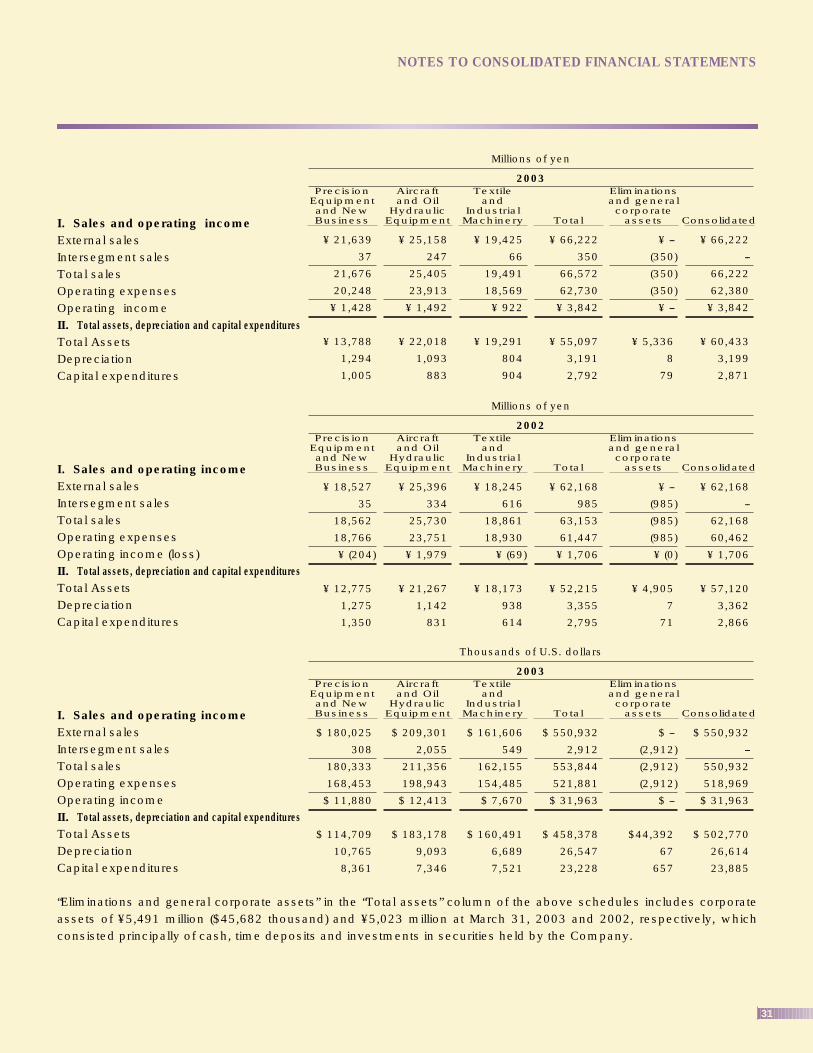
31
NOTES TO CONSOLIDATED FINANCIAL STATEMENTS
I. Sales and operating incomeExternal salesIntersegment salesTotal sales Operating expensesOperating incomeII. Total assets, depreciation and capital expendituresTotal AssetsDepreciationCapital expenditures
I. Sales and operating incomeExternal salesIntersegment salesTotal salesOperating expensesOperating income (loss)II. Total assets, depreciation and capital expendituresTotal AssetsDepreciationCapital expenditures
I. Sales and operating incomeExternal salesIntersegment salesTotal salesOperating expensesOperating incomeII. Total assets, depreciation and capital expendituresTotal AssetsDepreciationCapital expenditures
“Eliminations and general corporate assets” in the “Total assets” column of the above schedules includes corporateassets of ¥5,491 million ($45,682 thousand) and ¥5,023 million at March 31, 2003 and 2002, respectively, whichconsisted principally of cash, time deposits and investments in securities held by the Company.
Millions of yen
2003
¥ 21,639
37
21,676
20,248
¥ 1,428
¥ 13,788
1,294
1,005
¥ 25,158
247
25,405
23,913
¥ 1,492
¥ 22,018
1,093
883
¥ 19,425
66
19,491
18,569
¥ 922
¥ 19,291
804
904
¥ 66,222
350
66,572
62,730
¥ 3,842
¥ 55,097
3,191
2,792
¥ --
(350)
(350)
(350)
¥ --
¥ 5,336
8
79
¥ 66,222
--
66,222
62,380
¥ 3,842
¥ 60,433
3,199
2,871
PrecisionEquipmentand NewBusiness
Aircraftand Oil
HydraulicEquipment
Textileand
IndustrialMachinery Total
Eliminationsand generalcorporate
assets Consolidated
Millions of yen
2002
¥ 18,527
35
18,562
18,766
¥ (204)
¥ 12,775
1,275
1,350
¥ 25,396
334
25,730
23,751
¥ 1,979
¥ 21,267
1,142
831
¥ 18,245
616
18,861
18,930
¥ (69)
¥ 18,173
938
614
¥ 62,168
985
63,153
61,447
¥ 1,706
¥ 52,215
3,355
2,795
¥ --
(985)
(985)
(985)
¥ (0)
¥ 4,905
7
71
¥ 62,168
--
62,168
60,462
¥ 1,706
¥ 57,120
3,362
2,866
PrecisionEquipmentand NewBusiness
Aircraftand Oil
HydraulicEquipment
Textileand
IndustrialMachinery Total
Eliminationsand generalcorporate
assets Consolidated
Thousands of U.S. dollars
2003
$ 180,025
308
180,333
168,453
$ 11,880
$ 114,709
10,765
8,361
$ 209,301
2,055
211,356
198,943
$ 12,413
$ 183,178
9,093
7,346
$ 161,606
549
162,155
154,485
$ 7,670
$ 160,491
6,689
7,521
$ 550,932
2,912
553,844
521,881
$ 31,963
$ 458,378
26,547
23,228
$ --
(2,912)
(2,912)
(2,912)
$ --
$44,392
67
657
$ 550,932
--
550,932
518,969
$ 31,963
$ 502,770
26,614
23,885
PrecisionEquipmentand NewBusiness
Aircraftand Oil
HydraulicEquipment
Textileand
IndustrialMachinery Total
Eliminationsand generalcorporate
assets Consolidated
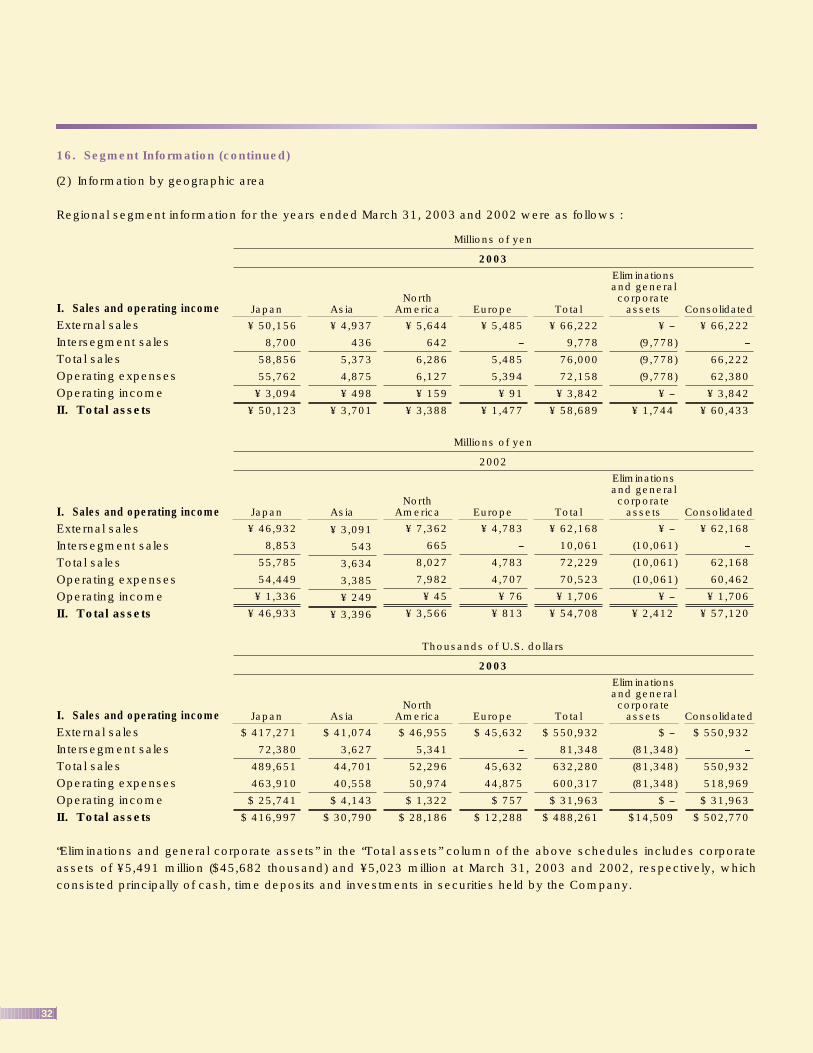
32
16. Segment Information (continued)
(2) Information by geographic area
Regional segment information for the years ended March 31, 2003 and 2002 were as follows :
I. Sales and operating incomeExternal salesIntersegment salesTotal sales Operating expensesOperating incomeII. Total assets
I. Sales and operating incomeExternal salesIntersegment salesTotal sales Operating expensesOperating incomeII. Total assets
I. Sales and operating incomeExternal salesIntersegment salesTotal sales Operating expensesOperating incomeII. Total assets
“Eliminations and general corporate assets” in the “Total assets” column of the above schedules includes corporateassets of ¥5,491 million ($45,682 thousand) and ¥5,023 million at March 31, 2003 and 2002, respectively, whichconsisted principally of cash, time deposits and investments in securities held by the Company.
Millions of yen
2003
¥ 4,937
436
5,373
4,875
¥ 498
¥ 3,701
¥ 5,644
642
6,286
6,127
¥ 159
¥ 3,388
¥ 5,485
--
5,485
5,394
¥ 91
¥ 1,477
¥ 66,222
9,778
76,000
72,158
¥ 3,842
¥ 58,689
¥ --
(9,778)
(9,778)
(9,778)
¥ --
¥ 1,744
¥ 66,222
--
66,222
62,380
¥ 3,842
¥ 60,433
Asia
¥ 50,156
8,700
58,856
55,762
¥ 3,094
¥ 50,123
JapanNorth
America Europe Total
Eliminationsand generalcorporate
assets Consolidated
Millions of yen
2002
¥ 3,091
543
3,634
3,385
¥ 249
¥ 3,396
¥ 7,362
665
8,027
7,982
¥ 45
¥ 3,566
¥ 4,783
--
4,783
4,707
¥ 76
¥ 813
¥ 62,168
10,061
72,229
70,523
¥ 1,706
¥ 54,708
¥ --
(10,061)
(10,061)
(10,061)
¥ --
¥ 2,412
¥ 62,168
--
62,168
60,462
¥ 1,706
¥ 57,120
Asia
¥ 46,932
8,853
55,785
54,449
¥ 1,336
¥ 46,933
JapanNorth
America Europe Total
Eliminationsand generalcorporate
assets Consolidated
Thousands of U.S. dollars
2003
$ 41,074
3,627
44,701
40,558
$ 4,143
$ 30,790
$ 46,955
5,341
52,296
50,974
$ 1,322
$ 28,186
$ 45,632
--
45,632
44,875
$ 757
$ 12,288
$ 550,932
81,348
632,280
600,317
$ 31,963
$ 488,261
$ --
(81,348)
(81,348)
(81,348)
$ --
$14,509
$ 550,932
--
550,932
518,969
$ 31,963
$ 502,770
Asia
$ 417,271
72,380
489,651
463,910
$ 25,741
$ 416,997
JapanNorth
America Europe Total
Eliminationsand generalcorporate
assets Consolidated
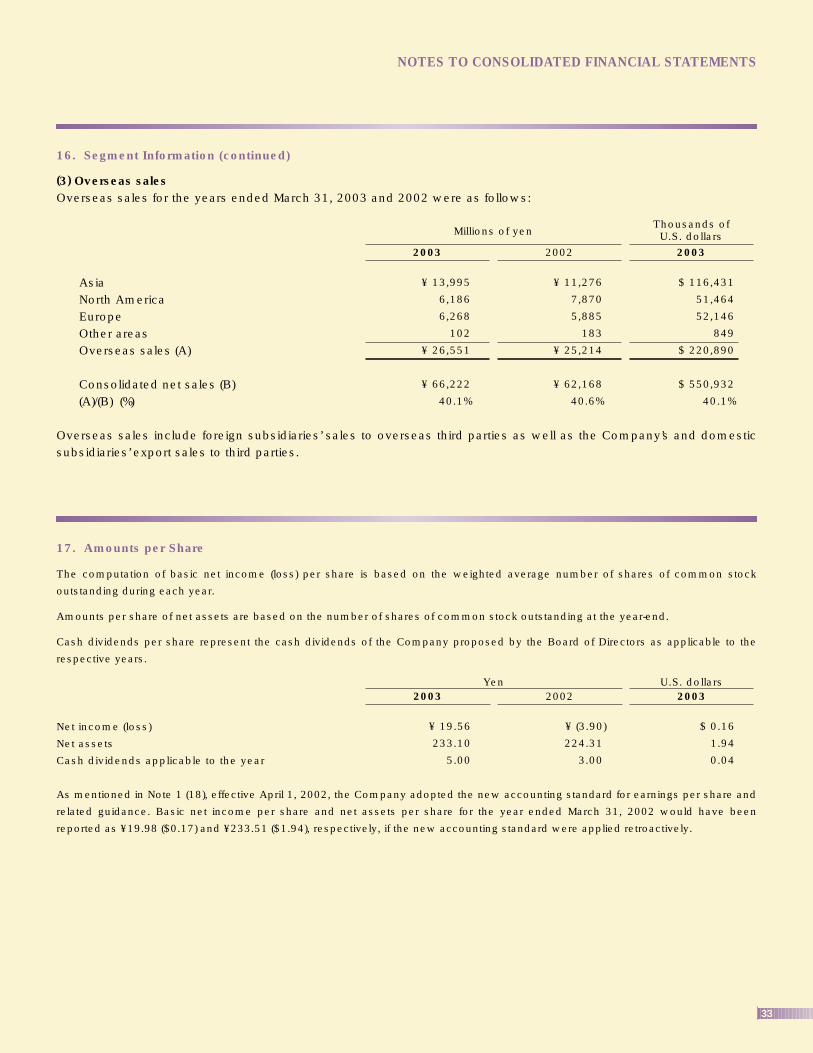
33
NOTES TO CONSOLIDATED FINANCIAL STATEMENTS
16. Segment Information (continued)
(3) Overseas salesOverseas sales for the years ended March 31, 2003 and 2002 were as follows:
AsiaNorth AmericaEuropeOther areasOverseas sales (A)
Consolidated net sales (B)(A)/(B) (%)
Overseas sales include foreign subsidiaries’ sales to overseas third parties as well as the Company’s and domesticsubsidiaries’ export sales to third parties.
¥ 13,995
6,186
6,268
102
¥ 26,551
¥ 66,222
40.1%
Millions of yen
2003
Thousands ofU.S. dollars
2002 2003
¥ 11,276
7,870
5,885
183
¥ 25,214
¥ 62,168
40.6%
$ 116,431
51,464
52,146
849
$ 220,890
$ 550,932
40.1%
17. Amounts per Share
The computation of basic net income (loss) per share is based on the weighted average number of shares of common stock
outstanding during each year.
Amounts per share of net assets are based on the number of shares of common stock outstanding at the year-end.
Cash dividends per share represent the cash dividends of the Company proposed by the Board of Directors as applicable to the
respective years.
Net income (loss)
Net assets
Cash dividends applicable to the year
As mentioned in Note 1 (18), effective April 1, 2002, the Company adopted the new accounting standard for earnings per share and
related guidance. Basic net income per share and net assets per share for the year ended March 31, 2002 would have been
reported as ¥19.98 ($0.17) and ¥233.51 ($1.94), respectively, if the new accounting standard were applied retroactively.
¥ 19.56
233.10
5.00
2003U.S. dollarsYen
2002 2003
¥ (3.90)
224.31
3.00
$ 0.16
1.94
0.04
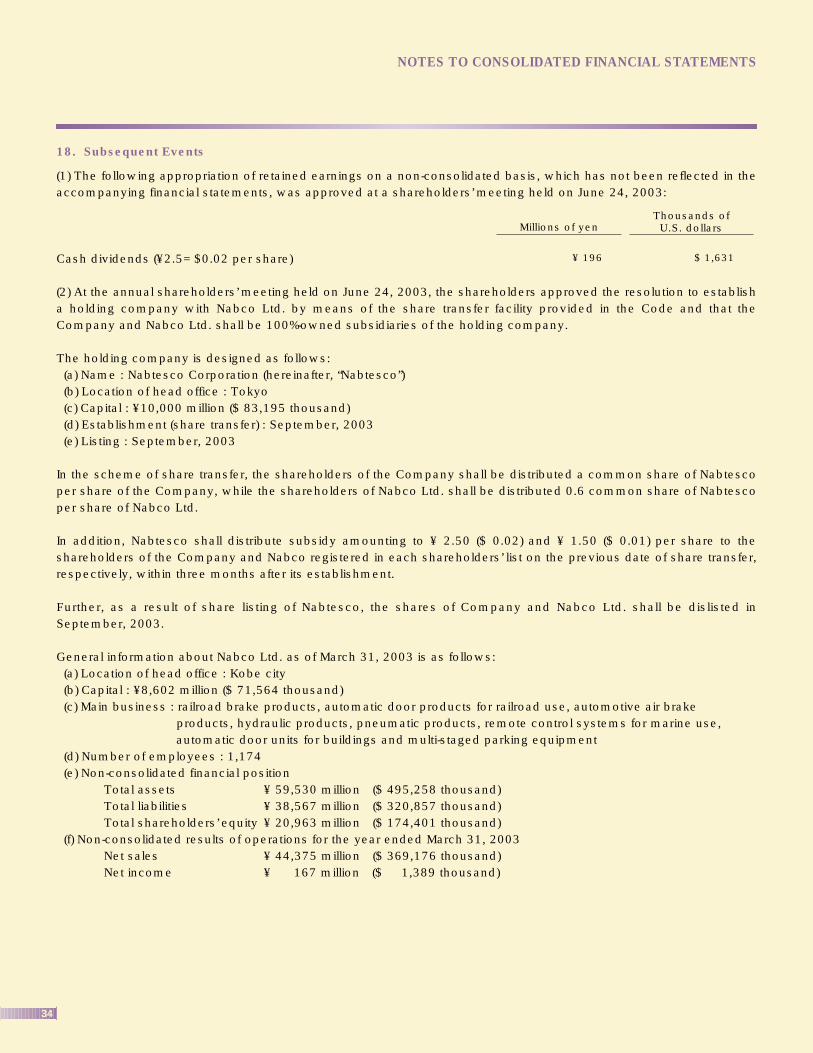
34
18. Subsequent Events
(1) The following appropriation of retained earnings on a non-consolidated basis, which has not been reflected in theaccompanying financial statements, was approved at a shareholders’ meeting held on June 24, 2003:
Cash dividends (¥2.5= $0.02 per share)
(2) At the annual shareholders’ meeting held on June 24, 2003, the shareholders approved the resolution to establisha holding company with Nabco Ltd. by means of the share transfer facility provided in the Code and that theCompany and Nabco Ltd. shall be 100%-owned subsidiaries of the holding company.
The holding company is designed as follows:(a) Name : Nabtesco Corporation (hereinafter, “Nabtesco”)(b) Location of head office : Tokyo(c) Capital : ¥10,000 million ($ 83,195 thousand) (d) Establishment (share transfer) : September, 2003(e) Listing : September, 2003
In the scheme of share transfer, the shareholders of the Company shall be distributed a common share of Nabtescoper share of the Company, while the shareholders of Nabco Ltd. shall be distributed 0.6 common share of Nabtescoper share of Nabco Ltd.
In addition, Nabtesco shall distribute subsidy amounting to ¥ 2.50 ($ 0.02) and ¥ 1.50 ($ 0.01) per share to theshareholders of the Company and Nabco registered in each shareholders’ list on the previous date of share transfer,respectively, within three months after its establishment.
Further, as a result of share listing of Nabtesco, the shares of Company and Nabco Ltd. shall be dislisted inSeptember, 2003.
General information about Nabco Ltd. as of March 31, 2003 is as follows:(a) Location of head office : Kobe city(b) Capital : ¥8,602 million ($ 71,564 thousand)(c) Main business : railroad brake products, automatic door products for railroad use, automotive air brake
products, hydraulic products, pneumatic products, remote control systems for marine use, automatic door units for buildings and multi-staged parking equipment
(d) Number of employees : 1,174(e) Non-consolidated financial position
Total assets ¥ 59,530 million ($ 495,258 thousand)Total liabilities ¥ 38,567 million ($ 320,857 thousand)Total shareholders’ equity ¥ 20,963 million ($ 174,401 thousand)
(f) Non-consolidated results of operations for the year ended March 31, 2003Net sales ¥ 44,375 million ($ 369,176 thousand)Net income ¥ 167 million ($ 1,389 thousand)
NOTES TO CONSOLIDATED FINANCIAL STATEMENTS
Millions of yenThousands ofU.S. dollars
¥ 196 $ 1,631
35
REPORT OF INDEPENDENT PUBLIC ACCOUNTANTS
To the Shareholders and Board of Directors of
Teijin Seiki Company Limited
We have audited the accompanying consolidated balance sheets of Teijin Seiki Company
Limited (a Japanese corporation) and subsidiaries as of March 31, 2003 and 2002, and the
related consolidated statements of operations, shareholders' equity and cash flows for the
years then ended, expressed in Japanese yen. These consolidated financial statements are
the responsibility of the Company’s management. Our responsibility is to express an opinion
on these consolidated financial statements based on our audits.
We conducted our audits in accordance with auditing standards generally accepted in Japan.
Those standards require that we plan and perform the audit to obtain reasonable assurance
about whether the financial statements are free of material misstatement. An audit includes
examining, on a test basis, evidence supporting the amounts and disclosures in the financial
statements. An audit also includes assessing the accounting principles used and significant
estimates made by management, as well as evaluating the overall financial statement
presentation. We believe that our audits provide a reasonable basis for our opinion.
In our opinion, the consolidated financial statements referred to above present fairly, in all
material respects, the consolidated financial position of Teijin Seiki Company Limited and
subsidiaries as of March 31, 2003 and 2002, and the consolidated results of their operations
and their cash flows for the years then ended, in conformity with accounting principles
generally accepted in Japan as described in Note 1 to the consolidated financial statements.
Without qualifying our opinion, we draw attention to the following. As discussed in Note 18 to
the consolidated financial statements, at the annual shareholders’ meeting held on June 24,
2003, the shareholders approved the resolution to establish a holding company with Nabco
Limited by means of the share transfer facility provided in the Commercial Code of Japan and
that Teijin Seiki Company Limited and Nabco Limited shall be 100%-owned subsidiaries of the
holding company.
The consolidated financial statements as of and for the year ended March 31, 2003 have been
translated into United States dollars solely for the convenience of the reader. We have
recomputed the translation and, in our opinion, the consolidated financial statements
expressed in Japanese yen have been translated into United States dollars on the basis set
forth in Note 1 to the consolidated financial statements.
Asahi & Co.
Tokyo, Japan
June 24, 2003
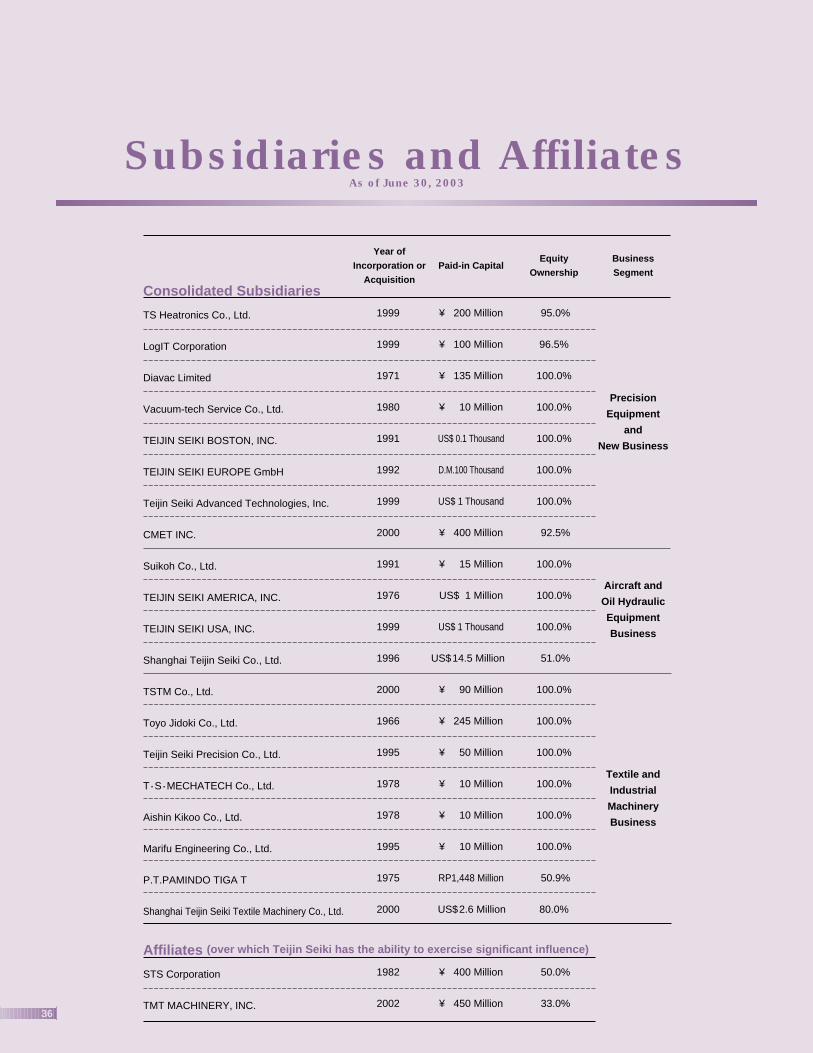
36
Subsidiaries and AffiliatesAs of June 30, 2003
Consolidated Subsidiaries
TS Heatronics Co., Ltd.
LogIT Corporation
Diavac Limited
Vacuum-tech Service Co., Ltd.
TEIJIN SEIKI BOSTON, INC.
TEIJIN SEIKI EUROPE GmbH
Teijin Seiki Advanced Technologies, Inc.
CMET INC.
Suikoh Co., Ltd.
TEIJIN SEIKI AMERICA, INC.
TEIJIN SEIKI USA, INC.
Shanghai Teijin Seiki Co., Ltd.
TSTM Co., Ltd.
Toyo Jidoki Co., Ltd.
Teijin Seiki Precision Co., Ltd.
T・S・MECHATECH Co., Ltd.
Aishin Kikoo Co., Ltd.
Marifu Engineering Co., Ltd.
P.T.PAMINDO TIGA T
Shanghai Teijin Seiki Textile Machinery Co., Ltd.
Affiliates (over which Teijin Seiki has the ability to exercise significant influence)
STS Corporation
TMT MACHINERY, INC.
Year of
Incorporation or
Acquisition
Paid-in CapitalEquity
Ownership
Business
Segment
Textile and
Industrial
Machinery
Business
Aircraft and
Oil Hydraulic
Equipment
Business
Precision
Equipment
and
New Business
1999
1999
1971
1980
1991
1992
1999
2000
1991
1976
1999
1996
2000
1966
1995
1978
1978
1995
1975
2000
1982
2002
¥ 200 Million
¥ 100 Million
¥ 135 Million
¥ 10 Million
US$ 0.1 Thousand
D.M.100 Thousand
US$ 1 Thousand
¥ 400 Million
¥ 15 Million
US$ 1 Million
US$ 1 Thousand
US$14.5 Million
¥ 90 Million
¥ 245 Million
¥ 50 Million
¥ 10 Million
¥ 10 Million
¥ 10 Million
RP1,448 Million
US$2.6 Million
¥ 400 Million
¥ 450 Million
95.0%
96.5%
100.0%
100.0%
100.0%
100.0%
100.0%
92.5%
100.0%
100.0%
100.0%
51.0%
100.0%
100.0%
100.0%
100.0%
100.0%
100.0%
50.9%
80.0%
50.0%
33.0%
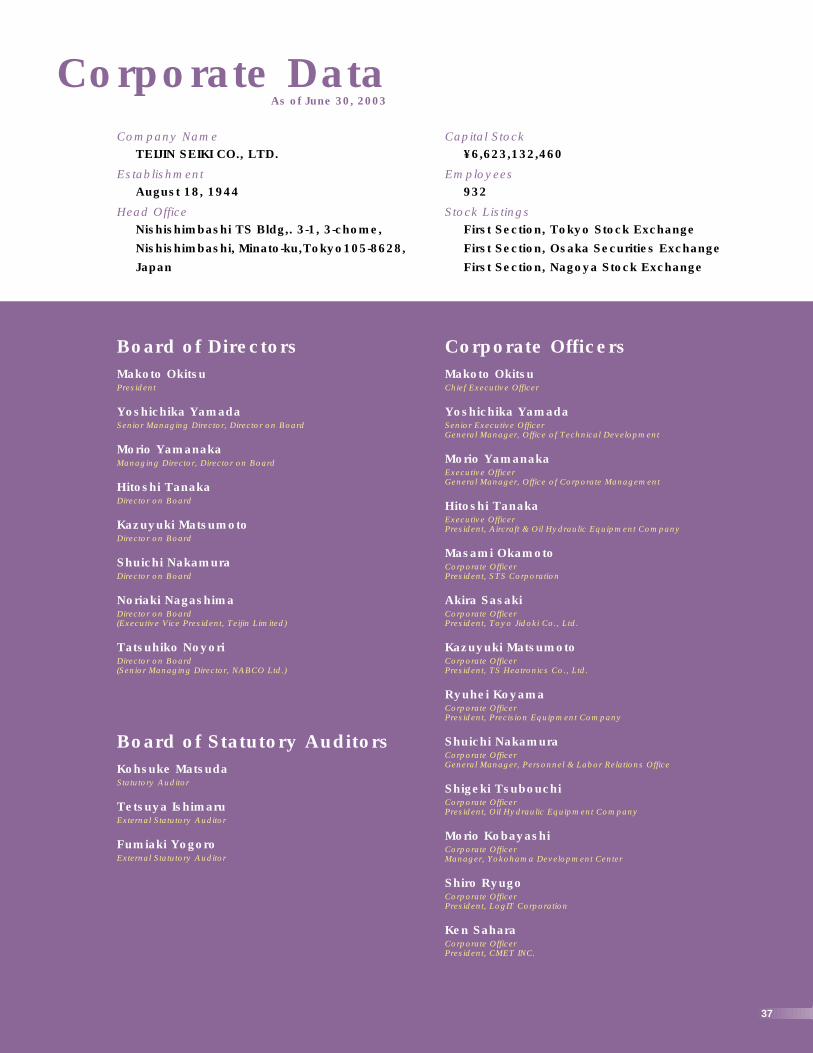
Corporate DataAs of June 30, 2003
Company Name
Establishment
Head Office
TEIJIN SEIKI CO., LTD.
August 18, 1944
Nishishimbashi TS Bldg,. 3-1, 3-chome,
Nishishimbashi, Minato-ku,Tokyo105-8628,
Japan
Capital Stock
Employees
Stock Listings
¥6,623,132,460
932
First Section, Tokyo Stock Exchange
First Section, Osaka Securities Exchange
First Section, Nagoya Stock Exchange
37
Makoto Okitsu
Yoshichika Yamada
Morio Yamanaka
Hitoshi Tanaka
Kazuyuki Matsumoto
Shuichi Nakamura
Noriaki Nagashima
Tatsuhiko Noyori
Corporate Officers
Chief Executive Officer
Senior Executive OfficerGeneral Manager, Office of Technical Development
Executive OfficerGeneral Manager, Office of Corporate Management
Executive OfficerPresident, Aircraft & Oil Hydraulic Equipment Company
Corporate OfficerPresident, STS Corporation
Corporate OfficerPresident, Toyo Jidoki Co., Ltd.
Corporate OfficerPresident, TS Heatronics Co., Ltd.
Corporate OfficerPresident, Precision Equipment Company
Corporate OfficerGeneral Manager, Personnel & Labor Relations Office
Corporate OfficerPresident, Oil Hydraulic Equipment Company
Corporate OfficerManager, Yokohama Development Center
Corporate OfficerPresident, LogIT Corporation
Corporate OfficerPresident, CMET INC.
Makoto Okitsu
Yoshichika Yamada
Morio Yamanaka
Hitoshi Tanaka
Masami Okamoto
Akira Sasaki
Kazuyuki Matsumoto
Ryuhei Koyama
Shuichi Nakamura
Shigeki Tsubouchi
Morio Kobayashi
Shiro Ryugo
Ken Sahara
Board of Statutory Auditors
Statutory Auditor
External Statutory Auditor
External Statutory Auditor
Kohsuke Matsuda
Tetsuya Ishimaru
Fumiaki Yogoro
Board of Directors
President
Senior Managing Director, Director on Board
Managing Director, Director on Board
Director on Board
Director on Board
Director on Board
Director on Board(Executive Vice President, Teijin Limited)
Director on Board(Senior Managing Director, NABCO Ltd.)
TEIJIN SEIKI CO.,LTD.―――――――――――――――――――――――――――――――――――――――――
Head Office : Nishishimbashi TS Bldg,. 3-1, 3-chome,Nishishimbashi, Minato-ku, Tokyo 105-8628, JapanPhone : 81-3-3578-7450Fax : 81-3-3578-7470URL : http://www.teijinseiki.co.jp/
This Annual Report is printed on recycled paper.
Recommended