Annual Report 2015


3
H.H. Sheikh Mohammed Bin Rashid Al MaktoumVice President, Prime Minister and Ruler of Dubai
H.H. Dr. Sheikh Sultan Bin Mohammed Al QasimiMember of the Supreme Council,
Ruler of Sharjah and its Dependencies
H.H. Sheikh Khalifa Bin Zayed Al NahyanPresident of the United Arab Emirates


5
• Board of Directors 6
• Chairman’s Speech 8
• Board of Directors Report to the General Assembly 10
• Resolution of the Ordinary General Assembly 22
• Independent Auditor’s Report 24
• Consolidated Statement of Financial Position 28
• Consolidated Statement of Profit or Loss 30
• Consolidated Statement of other Comprehensive Income 32
• Consolidated Statement of Changes in Equity 34
• Consolidated Statement of Cash Flows 36
• Notes to the Consolidated Financial Statements 38
• Graphs 96
Table Of Contents

Board of Directors

7
HONORARY CHAIRMANHis Highness, Doctor Sheikh Sultan Bin Mohammed Al Qasimi
CHAIRMANMr. Ahmed Abdalla Al Noman
VICE CHAIRMANSheikh Mohammed Bin Saud Al Qasimi
Sheikh Saif Bin MohammedBin Butti Al Hamed
H.E. Humaid Nasser Al Owais Mr. Abdul Rahman Bukhatir
Mr. Abdul Aziz HassanAl Midfa
Mr. Abdul Aziz MubarakAl Hasawi
Mr. Saud Al Besharah
Mr. Francois Dauge Executive Director & General ManagerMr. Varouj Nerguizian

Chairman’sSpeech
9
Chairman's Speech
Dear Valued Shareholders,
It gives me great pleasure to welcome you on behalf of the members of the Board of Directors and in my name to the General Assembly No. 42, and would like to express to you our deep gratitude for your support and your trust in national institution.
I take this opportunity to extend on your behalf and on behalf of the Directors, our sincere appreciation and respect to H.H. Sheikh Khalifa bin Zayed Al Nahyan, UAE President, & H.H Sheikh Mohammed bin Zayed Al Nahyan, Crown Prince of Abu Dhabi, Deputy Supreme Commander of the Armed Forces, & H.H. Sheikh Mohammed bin Rashid Al Maktoum, Vice President Prime Minister & Ruler of Dubai, H.H. Dr. Sheikh Sultan bin Mohammed Al Qasimi, Ruler of Sharjah, & Their Highnesses the Rulers and Members of the Supreme Council for their judicious and wisdom to lead our country to more prosperity and development.
Dear Valued Shareholders,
The year 2015 was a year of sufferings but also the premise of hope for a better future. It witnessed the signing of the nuclear deal with Iran; and the inauguration of the new Suez Canal. It was however marked with the escalation of global warming, natural catastrophes and widespread violence and wars. The severely damaging strives in Syria, Iraq, Libya and Yemen. Continued throughout the year and as we moved into 2016.
Dear Shareholders,
The oil prices plunged during 2015, as over supply by OPEC and non-OPEC producers led to an unprecedented glut in the markets; affecting the economies of the oil rich GCC countries.
Regional & International Political and Economic developments imposed significant challenges on banks, prompting regulatory authorities to strictly enforce harsh standards that are being increasingly adopted ever since the Global Financial Crisis.
As such, the financial year 2015 has witnessed intense pressures as provisions rose by 40% from AED 350 million in 2014 to AED 488 million in 2015.
While Profits were affected by this heavy burden, the bank proved its success and solidity of its business model as it was able to register a net profit of AED 250 million compared to AED 286 million for last year.
Dear Shareholders,
I take this opportunity to extend in your name to His Highness Dr. Sheikh Sultan bin Mohamed Al Qasimi, Supreme Council Member and Ruler of Sharjah, our Honorary Chairman, our sincere gratitude and recognition for his patronage and continued support, as well as to the Financial Authorities. I would also like to thank all our customers and correspondents all over the world for their confidence in our national Institution.
My acknowledgments and appreciation also go to the Bank's Management and staff for their tireless efforts and dedication to their work.
Finally, it is my honor to present to you the Board of Directors report for the year 2015.
Ahmed Abdalla Al Noman ChairmanSharjah 30th April 2016

Board of DirectorsReport to theGeneral Assembly

11
Board of DirectorsReport to theGeneral Assembly
2015, the year of sufferings but also the premise of hope for a better future. It saw the US putting an end to its half a century blockade of its neighboring Cuba, the signing of the nuclear deal with Iran, and the inauguration of the new Suez Canal. It was however marred with the escalation of the Global Warming Phenomenon, national catastrophes but also by widespread violence, strife and wars.
With the advent of 2016, the severely damaging strives in Syria, Iraq, Libya and Yemen gained in intensity despite the extensive diplomatic efforts spearheaded by the UN and the World Powers.
On the International scale, 2015 marked the return of Russia as a major superpower by taking a direct military role particularly in Syria, as well as its brokering the Iranian nuclear accord.
The terrorist acts that hit various parts of Western Europe led to a renewed rapprochement between EU and Russia, whose relations have been strained by the crisis in Ukraine, in terms of closer cooperation in the war on terrorism.
2015 brought about an unprecedented wave of irregular refugees influx into Europe, estimated at 2 million refuge seekers. Considered as the most dramatic human tragedy since WWII, it caused a serious rift in the unity of the EU. While Germany and the Scandinavian countries facilitated the influx of the refugees from Syria and Iraq, Eastern European countries specially the Balkan states, based on their historic apprehension, were more reserved and resorted to seal their borders, thus threatening the continuity of the Schengen space.
With the return of the Western terrorists from Syria and Iraq, another development unfolded in 2015. The year started with a bloody terrorist attack on a satiric newspaper and on a Jewish restaurant in Paris, and ended with a wave of unprecedented attacks on various popular locations in Paris leaving 130 innocent casualties, spreading fear all over Europe and triggering popular support to far-right nationalists movements.
Terrorist attacks spilled over to Asia and Africa as well; which necessitated a UN Security Council decision to wage a global war on terrorism. ISIS was the main target of the International coaliton stepped up air campaign in Syria and Iraq; aimed at reducing areas controlled by ISIS, and at drying up its financing sources.
Turkey, in its turn, was the scene of attacks in Istanbul targeting the US Consulate, a police station, a historic palace, and an important touristic destination housing the offices of the Prime Minister, and in Ankara a terrorist bombing of the central train station left hundreds injured. On another related note, the Turkish-Russian relations deteriorated after Turkey’s downing of a Russian bomber on the Syrian border. Russia imposed economic sanctions on Turkey and all trade activities and tourism were suspended between the two countries.
The UN General Assembly approved with a majority of 119 nations against 8 objections, including the US and Israel, to raise the Palestinian flag on its quarters in New York and Geneva. The Arab countries welcomed the decision hailing it as a major diplomatic victory.
On July 14th and after years of tough negotiations the agreement on the Iranian nuclear file was signed between Iran and the 5+1 world powers. The agreement called for the lifting of the economic sanctions imposed on Iran in return for restriction of the Iranian nuclear program to peaceful civilian purposes. This agreement which called for the opening of the Iranian market to foreign investments is hoped to clear the way for the potential lifting of restrictions and sanctions on trade and banking with Iran. However, other sanctions remained in place hampering effectively the full return of the economic relations to normality.
In a decisive report issued towards the end of the year, the IAEA declared Iran’s full compliance, paving the way for the implementation of the terms of the agreement. It is to be noted that concurrent with these developments, the UN declared that the launching on an intermediate range missile that could be equipped with nuclear war heads by Iran was a flagrant violation of international regulations. This declaration was considered as a potential sign that new sanctions might be considered.
On an economic note, the US Federal Budget recorded a deficit of US$ 439 billion, the lowest deficit since 2007. Total government expenditures during 2015 reached US$ 306 trillion. Following a long series of negotiations, Greece was given a third rescue package of Euro 86 billion by the EU, within the comprehensive repayment and restructuring of the country’s public debt which reached Euro 240 billion. It was decided that an amount of Euro 10 billion, out of the first aid tranche, will be allocated to consolidate the restructured Greek banks.
As economic data suggested the curbing of growth in China, the Chinese Government devalued its national currency, the Yuan, in an exceptional move within its planned reforms to liberate the huge Chinese economy. The outflow of capital, despite assurances by the Chinese Central Bank was not helped by the correlative move to reduce interest rates to 4.35%.
13
Financial experts predicted that the IMF’s decision to include the Chinese Yuan within its basket of currencies that constitute the Special Drawing Rights (SDR’s) effective October 2016 will constitute an important stepping stone in China’s aspirations to open and globalize its economy. The IMF’s decision, the first of its kind since 1999, could lead to the replacement of the Euro by the Yuan as the alternative currency to cover US Dollar denominated drawings. The value of the global financial reserves to be converted into Yuan denominated financial assets are estimated at US$ one trillion.
The IMF revealed that 48% of the world’s wealth is held by only 1% of the globe’s population. The 45th annual meeting of the World Economic Forum, held in Davos, Switzerland, evaluated various proposals to mitigate this disparity and agreed on a comprehensive plan to redraw the International Tax systems and combat tax evasion, to strengthen free governmental services, and adopt a social aid scheme for the poor. Additional taxation will be geared more towards capital rather than wages. However on a positive note, it is estimated that $ 500 million inhabitants of the world moved from extreme poverty (i.e. less than 1.25 US/day) to poverty (i.e. 2.50 $/day) since 1990.
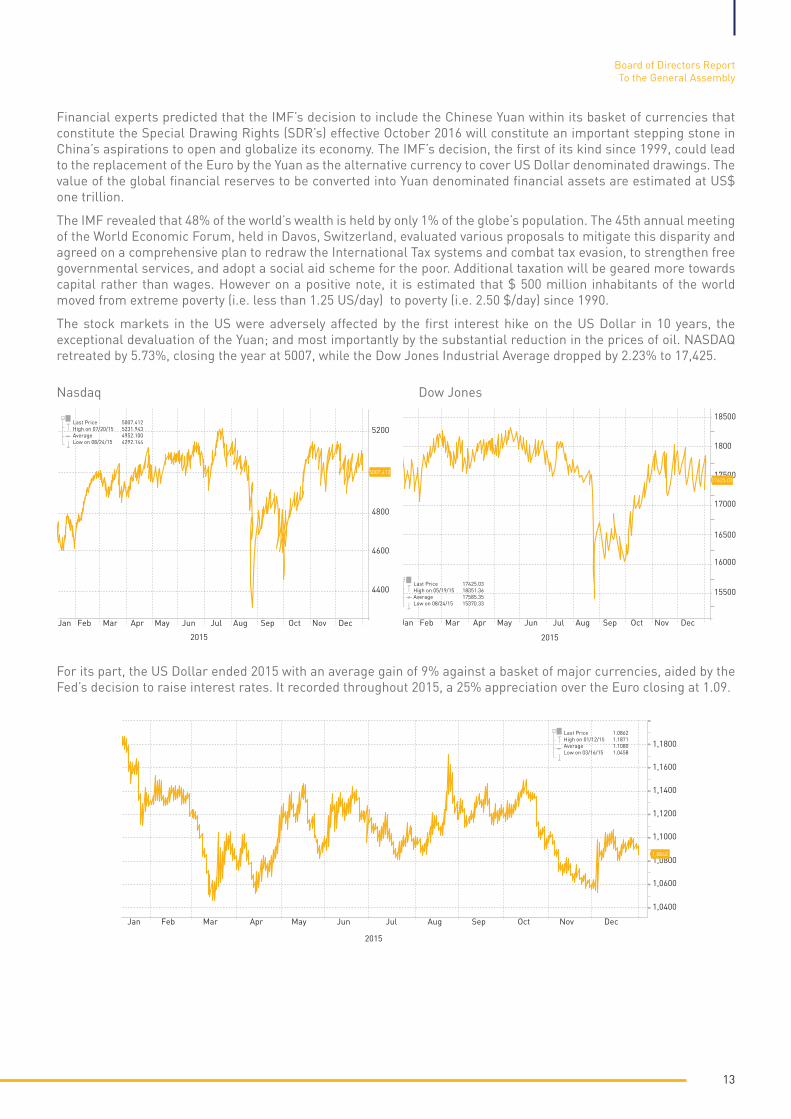
The stock markets in the US were adversely affected by the first interest hike on the US Dollar in 10 years, the exceptional devaluation of the Yuan; and most importantly by the substantial reduction in the prices of oil. NASDAQ retreated by 5.73%, closing the year at 5007, while the Dow Jones Industrial Average dropped by 2.23% to 17,425.
For its part, the US Dollar ended 2015 with an average gain of 9% against a basket of major currencies, aided by the Fed’s decision to raise interest rates. It recorded throughout 2015, a 25% appreciation over the Euro closing at 1.09.
Nasdaq Dow Jones
Board of Directors ReportTo the General Assembly
18500
1800
17500
17000
16500
16000
15500
2015
Jan Feb Mar Apr May Jun Jul Aug Sep Oct Nov Dec
17425.03
2015
5200
4800
4600
4400
Jan Feb Mar Apr May Jun Jul Aug Sep Oct Nov Dec
5007,412
Last Price 17425.03High on 05/19/15 18351.36Average 17585.35Low on 08/24/15 15370.33
Last Price 5007.412High on 07/20/15 5231.943Average 4952.100Low on 08/24/15 4292.144
2015
Jan Feb Mar Apr May Jun Jul Aug Sep Oct Nov Dec
2015
Last Price 4307.26High on 07/22/15 4902.09Average 4520.19Low on 12/13/15 3983.89
Last Price 3151.00High on 07/22/15 4253.28Average 3744.92Low on 12/13/15 2851.24
Jan Feb Mar Apr May Jun Jul Aug Sep Oct Nov Dec
2015
Jan Feb Mar Apr May Jun Jul Aug Sep Oct Nov Dec
2015
1,1800
1,1600
1,1400
1,1200
1,1000
1,0800
1,0600
1,0400
1,0862
Jan Feb Mar Apr May Jun Jul Aug Sep Oct Nov Dec
Last Price 1.0862High on 01/12/15 1.1871Average 1.1080Low on 03/16/15 1.0458
2015
Last Price 1061.42High on 01/22/15 1307.98Average 1158.60Low on 12/03/15 1046.43
Jan Feb Mar Apr May Jun Jul Aug Sep Oct Nov Dec
1300
1250
1200
1150
1100
105010661.42
70
65
60
55
50
45
40
3535.75
Last Price 35.75High on 05/06/15 68.31Average 52.33Low on 12/21/15 34.55
4800
4600
4400
4200
40002800
3000
3200
3400
3600
3800
4000
4200
4307.26
3151.00

Gold prices dropped by an average of 10% in 2015, as the price reached US$ 1,061 per ounce by year-end.
Oil was the sector that experienced the highest plunge in prices in 2015. Opec & non OPEC members increased production led to an unprecedented glut in the markets forcing the prices of the barrel down by an aggregate of 40% during the year. Opec’s meeting held in December failed to agree on a new reduced production ceiling; as Iran rejected any potential output curb till it reaches its pre-sanctions production levels; which would translate into a further over supply from the current 2 million barrel per day.
The price of Brent closed at an 11 year low of US$ 36 per barrel, ending a retractory path that is feared to continue in the future amidst worsening over-supply and price war by major producers.
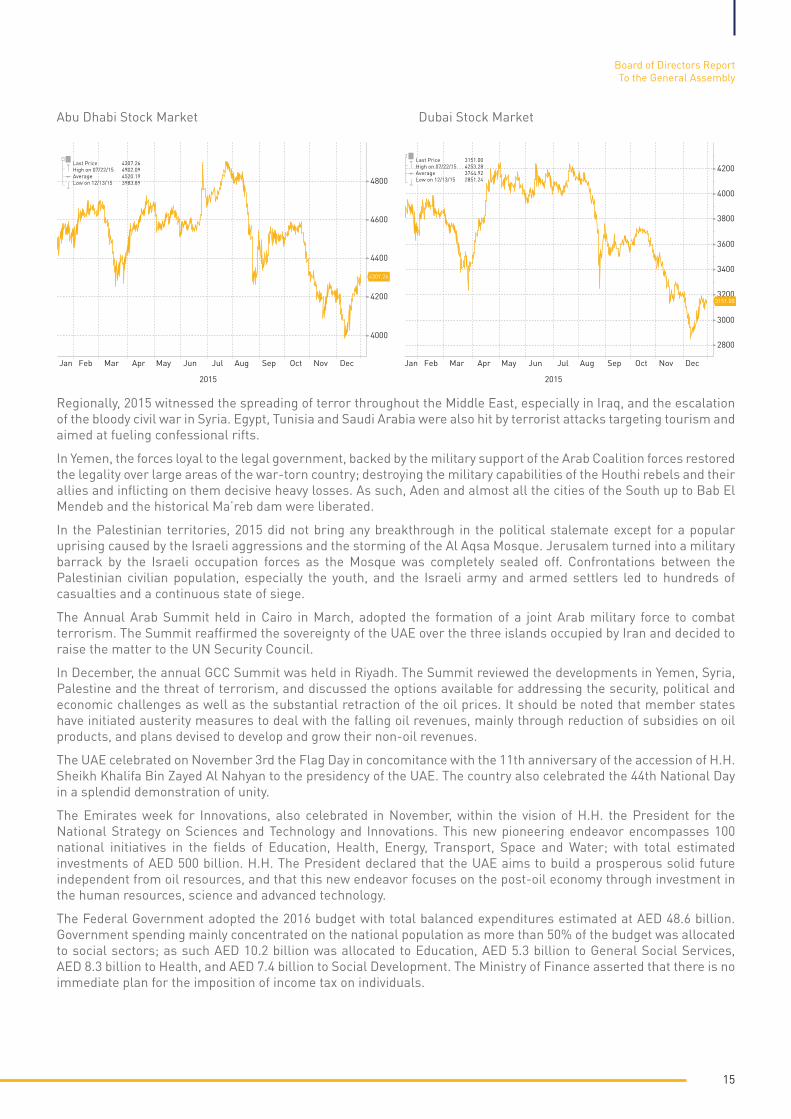
GCC stock markets were severely affected by the falling oil prices. In the UAE, Abu Dhabi Securities indices dropped during 2015 to 4037 points, Due to quick profit-taking pressure, while Dubai Stock Market improved to reach 3515 points.
18500
1800
17500
17000
16500
16000
15500
2015
Jan Feb Mar Apr May Jun Jul Aug Sep Oct Nov Dec
17425.03
2015
5200
4800
4600
4400
Jan Feb Mar Apr May Jun Jul Aug Sep Oct Nov Dec
5007,412
Last Price 17425.03High on 05/19/15 18351.36Average 17585.35Low on 08/24/15 15370.33
Last Price 5007.412High on 07/20/15 5231.943Average 4952.100Low on 08/24/15 4292.144
2015
Jan Feb Mar Apr May Jun Jul Aug Sep Oct Nov Dec
2015
Last Price 4307.26High on 07/22/15 4902.09Average 4520.19Low on 12/13/15 3983.89
Last Price 3151.00High on 07/22/15 4253.28Average 3744.92Low on 12/13/15 2851.24
Jan Feb Mar Apr May Jun Jul Aug Sep Oct Nov Dec
2015
Jan Feb Mar Apr May Jun Jul Aug Sep Oct Nov Dec
2015
1,1800
1,1600
1,1400
1,1200
1,1000
1,0800
1,0600
1,0400
1,0862
Jan Feb Mar Apr May Jun Jul Aug Sep Oct Nov Dec
Last Price 1.0862High on 01/12/15 1.1871Average 1.1080Low on 03/16/15 1.0458
2015
Last Price 1061.42High on 01/22/15 1307.98Average 1158.60Low on 12/03/15 1046.43
Jan Feb Mar Apr May Jun Jul Aug Sep Oct Nov Dec
1300
1250
1200
1150
1100
105010661.42
70
65
60
55
50
45
40
3535.75
Last Price 35.75High on 05/06/15 68.31Average 52.33Low on 12/21/15 34.55
4800
4600
4400
4200
40002800
3000
3200
3400
3600
3800
4000
4200
4307.26
3151.00
15
Regionally, 2015 witnessed the spreading of terror throughout the Middle East, especially in Iraq, and the escalation of the bloody civil war in Syria. Egypt, Tunisia and Saudi Arabia were also hit by terrorist attacks targeting tourism and aimed at fueling confessional rifts.
In Yemen, the forces loyal to the legal government, backed by the military support of the Arab Coalition forces restored the legality over large areas of the war-torn country; destroying the military capabilities of the Houthi rebels and their allies and inflicting on them decisive heavy losses. As such, Aden and almost all the cities of the South up to Bab El Mendeb and the historical Ma’reb dam were liberated.
In the Palestinian territories, 2015 did not bring any breakthrough in the political stalemate except for a popular uprising caused by the Israeli aggressions and the storming of the Al Aqsa Mosque. Jerusalem turned into a military barrack by the Israeli occupation forces as the Mosque was completely sealed off. Confrontations between the Palestinian civilian population, especially the youth, and the Israeli army and armed settlers led to hundreds of casualties and a continuous state of siege.
The Annual Arab Summit held in Cairo in March, adopted the formation of a joint Arab military force to combat terrorism. The Summit reaffirmed the sovereignty of the UAE over the three islands occupied by Iran and decided to raise the matter to the UN Security Council.
In December, the annual GCC Summit was held in Riyadh. The Summit reviewed the developments in Yemen, Syria, Palestine and the threat of terrorism, and discussed the options available for addressing the security, political and economic challenges as well as the substantial retraction of the oil prices. It should be noted that member states have initiated austerity measures to deal with the falling oil revenues, mainly through reduction of subsidies on oil products, and plans devised to develop and grow their non-oil revenues.
The UAE celebrated on November 3rd the Flag Day in concomitance with the 11th anniversary of the accession of H.H. Sheikh Khalifa Bin Zayed Al Nahyan to the presidency of the UAE. The country also celebrated the 44th National Day in a splendid demonstration of unity.
The Emirates week for Innovations, also celebrated in November, within the vision of H.H. the President for the National Strategy on Sciences and Technology and Innovations. This new pioneering endeavor encompasses 100 national initiatives in the fields of Education, Health, Energy, Transport, Space and Water; with total estimated investments of AED 500 billion. H.H. The President declared that the UAE aims to build a prosperous solid future independent from oil resources, and that this new endeavor focuses on the post-oil economy through investment in the human resources, science and advanced technology.
The Federal Government adopted the 2016 budget with total balanced expenditures estimated at AED 48.6 billion. Government spending mainly concentrated on the national population as more than 50% of the budget was allocated to social sectors; as such AED 10.2 billion was allocated to Education, AED 5.3 billion to General Social Services, AED 8.3 billion to Health, and AED 7.4 billion to Social Development. The Ministry of Finance asserted that there is no immediate plan for the imposition of income tax on individuals.
Board of Directors ReportTo the General Assembly
Abu Dhabi Stock Market Dubai Stock Market
18500
1800
17500
17000
16500
16000
15500
2015
Jan Feb Mar Apr May Jun Jul Aug Sep Oct Nov Dec
17425.03
2015
5200
4800
4600
4400
Jan Feb Mar Apr May Jun Jul Aug Sep Oct Nov Dec
5007,412
Last Price 17425.03High on 05/19/15 18351.36Average 17585.35Low on 08/24/15 15370.33
Last Price 5007.412High on 07/20/15 5231.943Average 4952.100Low on 08/24/15 4292.144
2015
Jan Feb Mar Apr May Jun Jul Aug Sep Oct Nov Dec
2015
Last Price 4307.26High on 07/22/15 4902.09Average 4520.19Low on 12/13/15 3983.89
Last Price 3151.00High on 07/22/15 4253.28Average 3744.92Low on 12/13/15 2851.24
Jan Feb Mar Apr May Jun Jul Aug Sep Oct Nov Dec
2015
Jan Feb Mar Apr May Jun Jul Aug Sep Oct Nov Dec
2015
1,1800
1,1600
1,1400
1,1200
1,1000
1,0800
1,0600
1,0400
1,0862
Jan Feb Mar Apr May Jun Jul Aug Sep Oct Nov Dec
Last Price 1.0862High on 01/12/15 1.1871Average 1.1080Low on 03/16/15 1.0458
2015
Last Price 1061.42High on 01/22/15 1307.98Average 1158.60Low on 12/03/15 1046.43
Jan Feb Mar Apr May Jun Jul Aug Sep Oct Nov Dec
1300
1250
1200
1150
1100
105010661.42
70
65
60
55
50
45
40
3535.75
Last Price 35.75High on 05/06/15 68.31Average 52.33Low on 12/21/15 34.55
4800
4600
4400
4200
40002800
3000
3200
3400
3600
3800
4000
4200
4307.26
3151.00

The UAE presided over the Arab League Assembly. It demanded the immediate application of the League’s earlier decisions to fight terrorism through the adoption of specific policies and workable mechanisms. It also rejected Iran’s interference in the affairs of its neighboring Arab countries; stressing on the UAE’s undeniable sovereignty over the three occupied islands. The Israeli aggressions on the Al Aqsa Mosque were also vehemently condemned. The Arab Parliament, for its part, called on Iran to sit on the negotiation table to tackle the issue of the occupied islands or to accept the principle of referring to the arbitration of the International Justice Tribunal.
The UAE, during its participation in the special ministerial meeting of the Security Council, insisted on the model of moderation and tolerance representing the best means of countering extremism; and warned against the persistent security challenges in the Middle East and North Africa, and their potential repercussions on the regional and world peace.
The UAE also participated in the GCC Foreign Ministers meeting with the US Secretary of State John Kerry. Bilateral relations were reviewed and means of developing mutual cooperation were discussed with the aim of countering the challenges faced by the Gulf countries and consolidating stability in the region.
During the General Assembly meeting of the International Exhibitions Bureau held in Paris, UAE was officially designated to host Expo 2020. H.E. Sheikh Ahmad Bin Saeed Al Maktoum, Chairman of Dubai Airline Authority, confirmed the country’s readiness to hold this major International event. Minister Reem Al Hashimi disclosed that the total Expo related projects vary between AED 20 and 22 billion of which AED 10 billion for infrastructure; and that 72 bids have already been awarded with the launching of the execution phase.
In February 2015, the UAE Finance Ministry signed the FATCA protocol with the US Treasury after completing the entire related legal framework.
The UAE and France signed a “declaration of intent” to form a new partnership between the two countries aimed at supporting the sustainable energy projects through providing financial grants and subsidized loans in order to fight the global warming phenomenon.
The Belgian capital, Brussels, hosted the signing ceremony of the exemption of UAE nationals from obtaining entry visas to the Schengen space. As such, UAE nationals can now travel to 34 European destinations without the need for pre-entry visas.
The UAE has officially entered the space exploration era, with the formation of the UAE Space Agency as declared by H.H. the President. Preparatory works have started on the space program to launch the first Arab exploratory mission to Mars after 7 years.
In December, the Abu Dhabi sealine for Touristic vessels was inaugurated in Mina Zayed to be a major tourist attraction in the GCC and the Middle East region.
One of the most far reaching events of 2015 was the treacherous ambush in Yemen against the UAE Armed Forces participating within the Arab Coalition to restore legitimacy to this Arab country. A number of our brave soldiers paid with their lives the price for the UAE’s courageous stance to defend justice, stability and peace in the region.
In recognition of their martyrdom, H.H. Sheikh Khalifa Bin Zayed Al Nahyan declared the 30th of November as the Martyr Day to commemorate the heroic actions and the dedication of the heroes of the UAE Armed Forces who sacrificed their lives for the country’s unity and national security.
Another tragedy turned into legend bravery when a huge fire broke in the landmark Address Downtown Hotel in Dubai, as the city was preparing to bid farewell to 2015. Civil Defense and rescue teams were able to control the fire and extinguish it within few hours, without any human loss, and allowed the city to welcome 2016 with grandeur and impressive show of fireworks and other festive activities.
In Dubai, H.H. Sheikh Mohamed Bin Rashed Al Maktoum, Vice President and Prime Minister, within the activities of the Emirates Innovative Week, launched the Dubai strategy for clean energy 2050; which aims at preparing the Emirate of Dubai to become the International hub for clean energy and green economy. H.H. inaugurated the project for the erection of the biggest solar energy station in the world at an estimated cost of AED 50 billion, to be completed by the year 2050, when 75% of Dubai energy will be based on clean sources.
H.H. Sheikh Mohamed also launched the “Mohamed Bin Rashed Global Initiatives” set to become the largest social development institution in the region. This new endeavor will constitute the platform for 28 establishments active in the fields of fighting poverty, illnesses and in spreading knowledge, culture, innovation and social endowment. A total of 1,400 programs for human development will be executed in 116 countries around the globe.
17
The Dubai Airshow was held in November. Deals signed during the show reached AED 72 billion, with the lion’s share belonging to Emirates Airline, which signed an AED 59 billion contract with General Electric to provide comprehensive maintenance.
ENOC launched the Falcon Project at a cost of AED 917 million, to construct a 58 kilometers pipeline linking the storage facilities in Jebel Ali to Dubai International Airport. For its part Etihad airline signed a strategic alliance protocol with Mubadala for AED 3.67 billion.
The Emirate of Sharjah was designated as the first Health City in the Middle East region by the World Health Organization (WHO). H.H. Doctor Sheikh Sultan bin Mohamed Al Qasimi, Ruler of Sharjah, received the award as an international recognition of his relentless efforts to serve human advancement and progress.
In December, H.H. declared Sharjah as the Child Friendly Emirate, to be the first in the region. This move aims at providing a healthy ambitious society based on the principles of reason and faith and encompasses activities aimed at providing social, health and environmental protection to the whole family, concentrating on the importance of the roles of the parents and education.
H.H. Doctor Sheikh Sultan bin Mohamed Al Qasimi, was awarded the first ever honorary membership by the Linguistic Society in recognition of his efforts in promoting the values of culture and language and in preserving Arab Cultural Heritage.
The 34th Sharjah Book Fair, an international platform for Arab literature and culture, received more than 1.2 million visitors. Book sales amounted to AED 135 million. 1,547 printing houses from 64 countries participated in the 2015 Fair.
Sharjah participated in Dubai’s Cityscape with a number of projects under execution. Of these projects, Tilal City, a 25 million sq. feet urban development project; and Al Rayan, in Nahda District, a 70% completed residential project at a total cost of AED 700 million over a total area of 2,7 million square feet.
These projects will benefit from the amendments in the Sharjah Property Law decreed in 2015, which allows non-GCC nationals to hold property for up to 100 year.
Shurooq, the Sharjah Authority for Investment and Development, won the award for the best investment promotion agency for 2015 in the Middle East, in recognition of Shurooq’s pioneering investment attractive activities. The Authority plans to invest AED 5 billion until 2018 in tourism development projects in Sharjah City and the East Coast.
In December H.H. the Ruler of Sharjah inaugurated “Al Noor” island in Khaled Lagoon. The first such island to pool nature and art with entertainment in the Arab World, Al Noor constitutes an idyllic destination over its 28,000 sq. meter area; built at a total cost of AED 80 million.
Be’eah, the Sharjah Environment Company, specialized in providing waste management solutions, won a 5 year contract to provide its services to Burj Khalifa, the World’s tallest building. This was the culmination of a number of awarded contracts in Dubai that were established with Dubai Media City, Knowledge Village, Tecom, Dubai Academic City and Dubai Internet city... The company also signed a contract with the Boston based Big Belly to procure solar energy powered trash containers to be distributed all over the city of Sharjah; the first of its kind in the Arab World relying on “Smart Containers” equipped with Wi-Fi technology.
SEWA declared its plan to save more than AED 10 billion in its operating costs over the next 10 years. The strategy consists of reducing electric power consumption by around 22.5 Megawatts per day, which would reduce Carbon emissions by more than 325 tons. The authority is planning to construct a new Wind Turbines power generating plant.
On March 22, H.H. the Ruler of Sharjah, Honorary Chairman, visited the new head office building of Bank of Sharjah, in Al Khan area. H.H. was received and welcomed by Mr. Ahmed Al Noman, Chairman of the Board, Sheikh Mohamed bin Saud Al Qasimi, Chairman of the Central Department of Finance and Vice Chairman of the Bank, and the members of the Board of Directors of Bank of Sharjah and Emirates Lebanon Bank and other dignitaries.
H.H. toured the new premises and exchanged ideas with the Chairman and Board members on the new plans and future activities of the Bank. H.H. commended the efforts of the Board and the Management of the Bank. At the end of the tour, H.H. was presented with a commemoration gift consisting of a fine engraved historic Gun of “Tipu Sultan” the tiger of Mysore, dating to 1794-5.
Board of Directors ReportTo the General Assembly
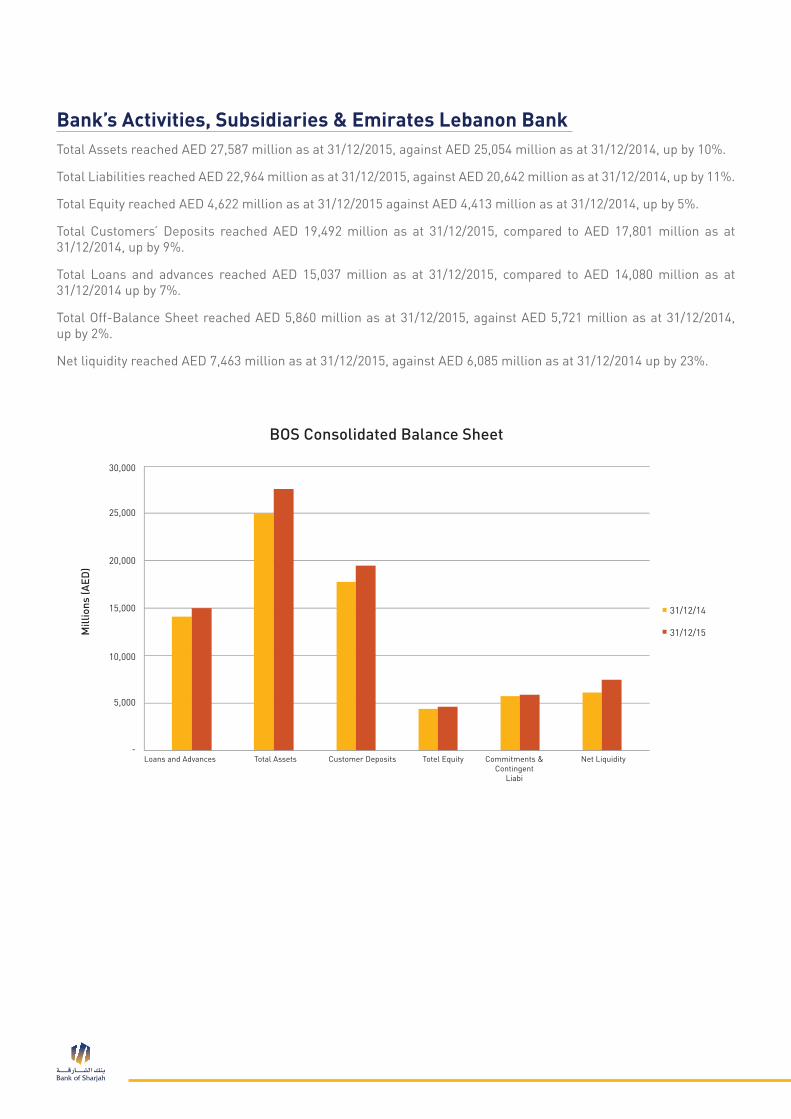
Bank’s Activities, Subsidiaries & Emirates Lebanon Bank Total Assets reached AED 27,587 million as at 31/12/2015, against AED 25,054 million as at 31/12/2014, up by 10%.
Total Liabilities reached AED 22,964 million as at 31/12/2015, against AED 20,642 million as at 31/12/2014, up by 11%.
Total Equity reached AED 4,622 million as at 31/12/2015 against AED 4,413 million as at 31/12/2014, up by 5%.
Total Customers’ Deposits reached AED 19,492 million as at 31/12/2015, compared to AED 17,801 million as at 31/12/2014, up by 9%.
Total Loans and advances reached AED 15,037 million as at 31/12/2015, compared to AED 14,080 million as at 31/12/2014 up by 7%.
Total Off-Balance Sheet reached AED 5,860 million as at 31/12/2015, against AED 5,721 million as at 31/12/2014, up by 2%.
Net liquidity reached AED 7,463 million as at 31/12/2015, against AED 6,085 million as at 31/12/2014 up by 23%.
BOS Consolidated Balance Sheet
30,000
31/12/14
25,000
20,000
15,000
10,000
5,000
Loans and Advances Total Assets Customer Deposits Totel Equity Commitments & Contingent
Liabi
Net Liquidity-
Mill
ions
(AED
)
31/12/15

19
Income Statement:Net interest income reached AED 548 million for the year ended 31/12/2015 versus AED 468 million for the year ended 31/12/2014, up by 17%.
Net operating income reached AED 521 million for the year ended 31/12/2015, against AED 545 million for the year ended 31/12/2014, down by 4%.
Net profit for the year reached AED 250 million for the year ended 31/12/2015, against AED 286 million for the year ended 31/12/2014, down by 13%.
Total comprehensive income reached AED 309 million for the year ended 31/12/2015 against AED 241 million for the year ended 31/12/2014, up by 28%.
Consolidated Income Statement
600
31/12/14 31/12/15
500
400
300
200
100
(100)
Net InterestIncome
Net Fees and Commission
Investmentincome/loss
Net OperatingIncome
G&A Expenses Net Profit Comprehensive Incom
-
Mill
ions
(AED
)

Emirates Lebanon Bank S.A.L. (EL Bank) ActivitiesTotal Assets reached AED 5,550 million as at 31/12/2015 against AED 5,507 million as at 31/12/2014, up by 1%.
Total Liabilities reached AED 4,532 million as at 31/12/2015, against AED 4,509 million as at 31/12/2014, up by 1%.
Total Equity reached AED 1,018 million as at 31/12/2015, against AED 997 million as at 31/12/2014, up by 2%.
Total Customers’ deposits reached AED 4,317 million as at 31/12/2015, against AED 4,215 million as at 31/12/2014, up by 2%.
Total Loans and advances reached AED 2,350 million as at 31/12/2015, against AED 2,262 million as at 31/12/2014, up by 4%.
Total Off-Balance Sheet reached AED 1,281 million as at 31/12/2015, against AED 1,852 million as at 31/12/2014, down by 31%.
Net Liquidity reached AED 2,222 million as at 31/12/2015, against AED 2,117 million as at 31/12/2014, up by 5%.
Balance Sheet EL Bank
6,000
31/12/14
5,000
4,000
3,000
2,000
1,000
Total Assets Customer Deposits
Loans andAdvance
Equity Off-BlanceSheet
Net Liquidity-
31/12/15
Mill
ions
(AED
)

21
Income Statement:Net interest income reached AED 87 million for the year ended 31/12/2015 against AED 87 million for the year ended 31/12/2014.
Net operating income reached AED 121 million for the year ended 31/12/2015 against AED 116 million for the year ended 31/12/2014 up by 4%.
Net profit reached AED 33 million for the year ended 31/12/2015, against AED 25 million for the year ended 31/12/2014, up by 32%.
Income Statement
140
31/12/14
120
100
80
60
40
20
Net InterestIncome
NetCommissions
Net OperatingIncome
G & AExpenses
NetProfit
ComprehensiveIncome
-
31/12/15Mill
ions
(AED
)

Resolution of theOrdinary GeneralAssembly
23
First Resolution
The Ordinary General Assembly approves the Board of Directors’ report on the Bank’s activities for 2015.
Second Resolution
The Ordinary General Assembly approves the Report, Balance Sheet & Profit & Loss Statements submitted by the Bank’s Auditors as at 31/12/2015.
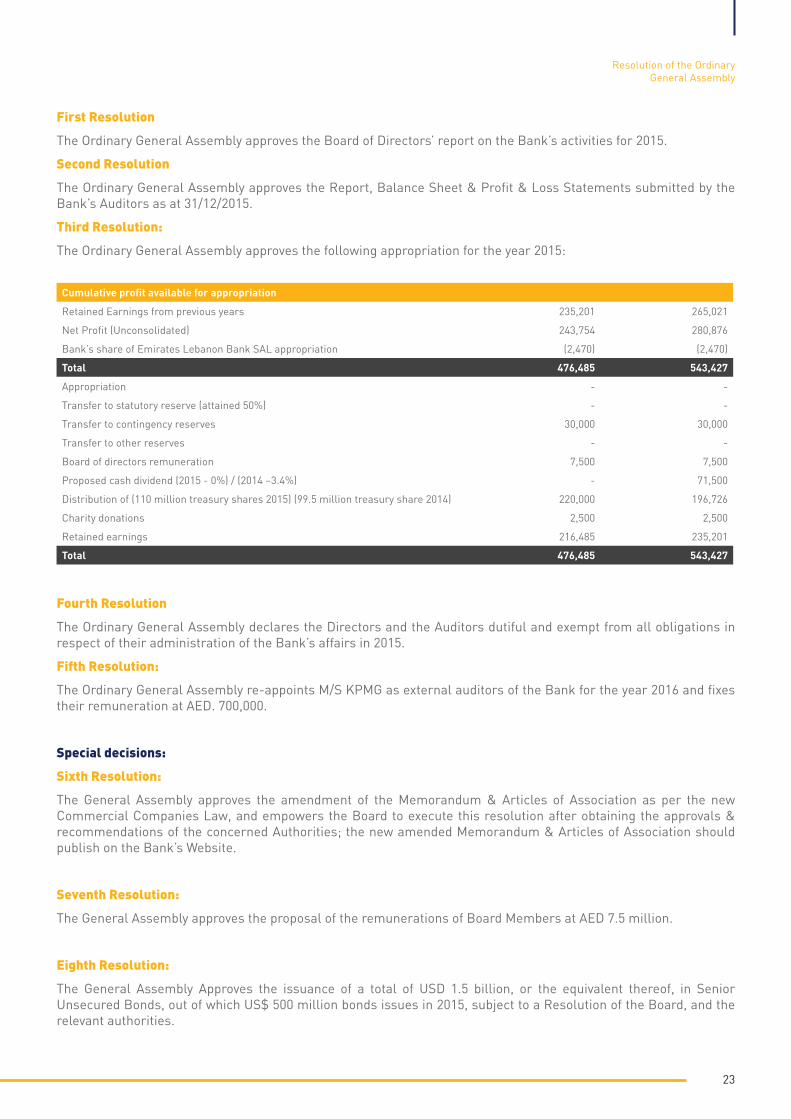
Third Resolution:
The Ordinary General Assembly approves the following appropriation for the year 2015:
Fourth Resolution
The Ordinary General Assembly declares the Directors and the Auditors dutiful and exempt from all obligations in respect of their administration of the Bank’s affairs in 2015.
Fifth Resolution:
The Ordinary General Assembly re-appoints M/S KPMG as external auditors of the Bank for the year 2016 and fixes their remuneration at AED. 700,000.
Special decisions:
Sixth Resolution:
The General Assembly approves the amendment of the Memorandum & Articles of Association as per the new Commercial Companies Law, and empowers the Board to execute this resolution after obtaining the approvals & recommendations of the concerned Authorities; the new amended Memorandum & Articles of Association should publish on the Bank’s Website.
Seventh Resolution:
The General Assembly approves the proposal of the remunerations of Board Members at AED 7.5 million.
Eighth Resolution:
The General Assembly Approves the issuance of a total of USD 1.5 billion, or the equivalent thereof, in Senior Unsecured Bonds, out of which US$ 500 million bonds issues in 2015, subject to a Resolution of the Board, and the relevant authorities.
Resolution of the OrdinaryGeneral Assembly
Cumulative profit available for appropriation
Retained Earnings from previous years 235,201 265,021
Net Profit (Unconsolidated) 243,754 280,876
Bank’s share of Emirates Lebanon Bank SAL appropriation (2,470) (2,470)
Total 476,485 543,427
Appropriation - -
Transfer to statutory reserve (attained 50%) - -
Transfer to contingency reserves 30,000 30,000
Transfer to other reserves - -
Board of directors remuneration 7,500 7,500
Proposed cash dividend (2015 - 0%) / (2014 –3.4%) - 71,500
Distribution of (110 million treasury shares 2015) (99.5 million treasury share 2014) 220,000 196,726
Charity donations 2,500 2,500
Retained earnings 216,485 235,201
Total 476,485 543,427

IndependentAuditor’s Reportfor the year ending 31 December 2015

25

The Shareholders Bank of Sharjah P.J.S.C.
Report on the Consolidated Financial Statements
We have audited the accompanying consolidated financial statements of Bank of Sharjah P.J.S.C. (the “Bank”) and its subsidiaries (“the Group”), which comprise the consolidated statement of financial position as at 31 December 2015, the consolidated statements of profit or loss and other comprehensive income, changes in equity and cash flows for the year then ended, and notes, comprising a summary of significant accounting policies and other explanatory information.
Management’s Responsibility for the Consolidated Financial Statements
Management is responsible for the preparation and fair presentation of these consolidated financial statements in accordance with International Financial Reporting Standards and their preparation in compliance with the applicable provisions of the UAE Federal Law No.(2) of 2015, and for such internal control as management determines is necessary to enable the preparation of consolidated financial statements that are free from material misstatement, whether due to fraud or error.
Auditors’ Responsibility
Our responsibility is to express an opinion on these consolidated financial statements based on our audit. We conducted our audit in accordance with International Standards on Auditing. Those standards require that we comply with ethical requirements and plan and perform the audit to obtain reasonable assurance about whether the consolidated financial statements are free from material misstatement.
An audit involves performing procedures to obtain audit evidence about the amounts and disclosures in the consolidated financial statements. The procedures selected depend on our judgment, including the assessment of the risks of material misstatement of the consolidated financial statements, whether due to fraud or error. In making those risk assessments, we consider internal control relevant to the entity’s preparation and fair presentation of the consolidated financial statements in order to design audit procedures that are appropriate in the circumstances, but not for the purpose of expressing an opinion on the effectiveness of the entity’s internal control. An audit also includes evaluating the appropriateness of accounting policies used and the reasonableness of accounting estimates made by management, as well as evaluating the overall presentation of the consolidated financial statements.
We believe that the audit evidence we have obtained is sufficient and appropriate to provide a basis for our audit opinion.
Opinion
In our opinion, the consolidated financial statements present fairly, in all material respects, the consolidated financial position of the Group as at 31 December 2015, and its consolidated financial performance and its consolidated cash flows for the year then ended in accordance with International Financial Reporting Standards.
27
Report on Other Legal and Regulatory Requirements
Further, as required by the UAE Federal Law No. (2) of 2015, we report that:
i) We have obtained all the information and explanations we considered necessary for the purposes of our audit.ii) The consolidated financial statements have been prepared and comply, in all material respects, with the applicable provisions of the UAE Federal Law No. (2) of 2015.
iii) The Group has maintained proper books of account.
iv) The financial information included in the Directors’ report, in so far as it relates to these consolidated financial statements, is consistent with the books of account of the Group.
v) As disclosed in notes 9 (c) to the consolidated financial statements, the Group has purchased shares during the year ended 31 December 2015.
vi) Note 35 to the consolidated financial statements discloses material related party transactions and the terms under which they were conducte.
vii) Based on the information that has been made available to us nothing has come to our attention which causes us to believe that the Group has contravened during the financial year ended 31 December 2015 any of the applicable provisions of the UAE Federal Law No. (2) of 2015 or in respect of the Bank its Articles of Association, which would materially affect its activities or its consolidated financial position as at 31 December 2015.
viii) Note 34 to the consolidated financial statements discloses the social contributions made during the year.
Further, as required by the UAE Union Law No (10) of 1980, as amended, we report that we have obtained all the information and explanations we considered necessary for the purposes of our audit.
Other Matter
The consolidated financial statements for the year ended 31 December 2014 were audited respectively by another auditor who expressed an unqualified audit opinion on the consolidated financial statements for the year ended 31 December 2014 on 14 February 2015.
KPMG Lower Gulf Limited
Date:
Muhammad Tariq
Registered Auditor Number: 793
Place: Dubai, United Arab Emirates
Independent Auditor’s Report

ConsolidatedStatementof Financial Positionas at 31 December 2015

29
Notes 2015 2014
AED’000 AED’000
ASSETS
Cash and balances with central banks 6 6,436,195 3,707,816
Deposits and balances due from banks 7 1,072,415 2,783,177
Loans and advances, net 8 15,036,621 14,080,102
Other financial assets measured at fair value 9 1,214,878 1,166,631
Other financial assets measured at amortised cost 9 527,330 597,349
Investment properties 10 270,441 336,143
Goodwill and other intangibles 11 234,234 242,018
Other assets 12 2,519,598 1,613,123
Property and equipment 14 275,206 292,341
Non-current assets classified as held for sale 15 - 235,683
------------- -------------
Total Assets 27,586,918 25,054,383
=========== ===========
LIABILITIES AND EQUITY
Liabilities
Customers’ deposits 17 19,491,815 17,800,882
Deposits and balances due to banks 18 45,479 405,603
Other liabilities 19 1,689,682 1,677,471
Syndicated loan 20 - 734,600
Issued bonds 21 1,737,498 -
Liabilities directly associated with non-current assets
classified as held for sale 15 - 23,168
------------- -------------
Total liabilities 22,964,474 20,641,724
------------- -------------
EQUITY
CAPITAL AND RESERVES
Share capital 22 (a) 2,100,000 2,100,000
Treasury shares 22 (a) - (196,726)
Statutory reserve 22 (b) 1,050,000 1,050,000
Contingency reserve 22 (c) 480,000 450,000
General reserve 22 (d) 100,000 100,000
Changes in fair value reserve 212,432 154,009
Retained earnings 476,485 543,427
------------- -------------
Equity attributable to equity holders of the Bank 4,418,917 4,200,710
Non-controlling interests 203,527 211,949
------------- -------------
Total equity 4,622,444 4,412,659
------------- -------------
Total liabilities and equity 27,586,918 25,054,383
=========== ===========
………………………..…………………….. ………………………….……………….
Mr. Ahmed Abdalla Al Noman Mr. Varouj NerguizianChairman Executive Director & General Manager
The accompanying notes form an integral part of these consolidated financial statements.
Consolidated Statement of Financial Positionas at 31 December 2015

Consolidatedstatementof Profit or Lossfor the year ended31 December 2015

31
Notes 2015 2014
AED’000 AED’000
Interest income 28 1,028,211 984,947
Interest expense 29 (480,120) (517,236)
------------- -------------
Net Interest Income 548,091 467,711
Net fee and commission income 30 160,113 159,553
Exchange profit 21,473 24,642
Income/(loss) on investments 31 11,530 (15,223)
Net gain on investment properties revaluation 10 4,143 32,465
Other income 32 87,736 114,735
------------- -------------
Operating Income 833,086 783,883
Net impairment loss on financial assets 33 (297,006) (238,828)
------------- -------------
Net Operating Income 536,080 545,055
General and administrative expenses 34 (267,559) (259,494)
Amortisation of intangible assets 11 (b) (7,784) (7,784)
------------- -------------
Profit Before Discontinued Operations 260,737 277,777
Discontinued operations 15 (3,438) 14,481
------------- -------------
Profit Before Taxes 257,299 292,258
Income tax expense - overseas (6,998) (6,339)
------------- -------------
Net Profit For The Year 250,301 285,919
=========== ===========
ATTRIBUTABLE TO:
Equity holders of the Bank 243,754 280,876
Non-controlling interests 6,547 5,043
------------- -------------
Net Profit For The Year 250,301 285,919
=========== ===========
Basic and Diluted Earnings Per Share (AED) 23 0.12 0.14
=========== ===========
The accompanying notes form an integral part of these consolidated financial statements.
Consolidated statement of profit or lossfor the year ended 31 December 2015

ConsolidatedStatement ofother Comprehensive Income
33
The accompanying notes form an integral part of these consolidated financial statements.
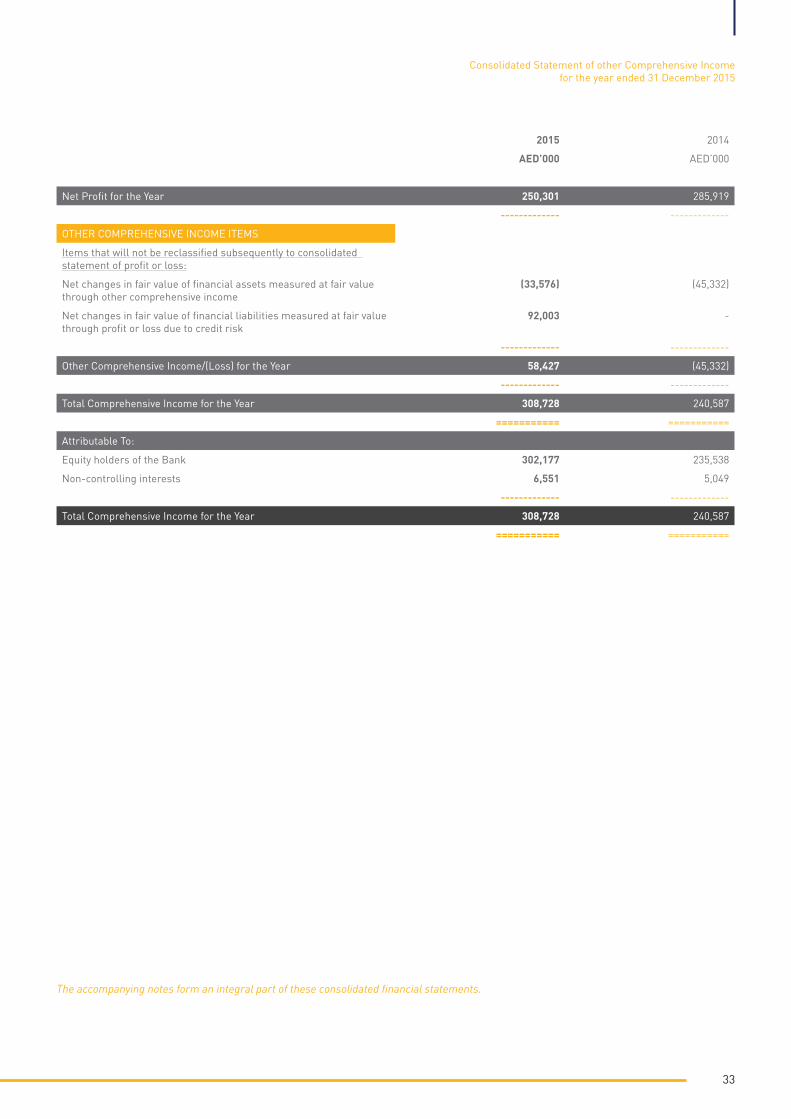
2015 2014
AED’000 AED’000
Net Profit for the Year 250,301 285,919
------------- -------------
OTHER COMPREHENSIVE INCOME ITEMS
Items that will not be reclassified subsequently to consolidated statement of profit or loss:
Net changes in fair value of financial assets measured at fair value through other comprehensive income
(33,576) (45,332)
Net changes in fair value of financial liabilities measured at fair value through profit or loss due to credit risk
92,003 -
------------- -------------
Other Comprehensive Income/(Loss) for the Year 58,427 (45,332)
------------- -------------
Total Comprehensive Income for the Year 308,728 240,587
=========== ===========
Attributable To:
Equity holders of the Bank 302,177 235,538
Non-controlling interests 6,551 5,049
------------- -------------
Total Comprehensive Income for the Year 308,728 240,587
=========== ===========
Consolidated Statement of other Comprehensive Incomefor the year ended 31 December 2015

ConsolidatedStatement ofChanges in Equity

35
The
acco
mpa
nyin
g no
tes
form
an
inte
gral
par
t of t
hese
con
solid
ated
fina
ncia
l sta
tem
ents
.
ConsolidatedStatement ofChanges in Equity
Tota
l equ
ity
Shar
eTr
easu
rySt
atut
ory
Cont
inge
ncy
Gen
eral
Chan
ges
inat
trib
utab
le to
Non
-
capi
tal
shar
esre
serv
ere
serv
ere
serv
efa
ir v
alue
Ret
aine
dow
ners
of t
heco
ntro
lling
Tota
l
rese
rve
earn
ings
pare
ntin
tere
sts
equi
ty
AED
’000
AED
’000
AED
’000
AED
’000
AED
’000
AED
’000
AED
’000
AED
’000
AED
’000
AED
’000
Bal
ance
at 1
Jan
uary
201
42,
100,
000
(327
,792
)1,
085,
357
413,
126
92,9
9919
9,34
757
9,12
94,
142,
166
210,
455
4,35
2,62
1
Profi
t for
the
year
--
--
--
280,
876
280,
876
5,04
328
5,91
9
Oth
er c
ompr
ehen
sive
loss
--
--
-(4
5,33
8)-
(45,
338)
6(4
5,33
2)
----
----
----
----
----
----
----
----
----
----
----
----
----
----
----
----
----
----
----
----
----
----
----
----
----
----
----
----
----
----
Tota
l com
preh
ensi
ve in
com
e fo
r th
e ye
ar
--
--
-(4
5,33
8)28
0,87
623
5,53
85,
049
240,
587
----
----
----
----
----
----
----
----
----
----
----
----
----
----
----
----
----
----
----
----
----
----
----
----
----
----
----
----
----
----
Shar
e di
vide
nds
(Not
e 24
)-
119,
197
--
--
(119
,197
)-
--
Trea
sury
sha
res
sold
dur
ing
the
year
-11
,869
--
--
-11
,869
-11
,869
Dir
ecto
rs’ r
emun
erat
ion
(Not
e 24
)-
--
--
-(9
,968
)(9
,968
)(6
17)
(10,
585)
Char
ity d
onat
ions
(Not
e 24
)-
--
--
-(2
,500
)(2
,500
)-
(2,5
00)
Tran
sfer
from
sta
tuto
ry re
serv
e-
-(3
5,35
7)-
--
35,3
57-
--
Tran
sfer
to c
ontin
genc
y re
serv
e-
--
36,8
74-
-(3
6,87
4)-
--
Tran
sfer
to g
ener
al re
serv
e-
--
-7,
001
-(7
,001
)-
--
Div
iden
ds p
aid
(Not
e 24
)-
--
--
-(1
76,3
95)
(176
,395
)(2
,938
)(1
79,3
33)
----
----
----
---
----
----
---
----
----
----
---
----
----
---
----
----
----
---
----
----
---
----
----
----
---
----
----
---
----
----
----
---
----
----
---
Bal
ance
at 3
1 D
ecem
ber
2014
2,10
0,00
0(1
96,7
26)
1,05
0,00
045
0,00
010
0,00
015
4,00
954
3,42
74,
200,
710
211,
949
4,41
2,65
9
Profi
t for
the
year
--
--
--
243,
754
243,
754
6,54
725
0,30
1
Oth
er c
ompr
ehen
sive
inco
me
--
--
-58
,423
-58
,423
458
,427
----
----
----
----
----
----
----
----
----
----
----
----
----
----
----
----
----
----
----
----
----
----
----
----
----
----
----
----
----
----
Tota
l com
preh
ensi
ve in
com
e fo
r th
e ye
ar
--
--
-58
,423
243,
754
302,
177
6,55
130
8,72
8
----
----
----
----
----
----
----
----
----
----
----
----
----
----
----
----
----
----
----
----
----
----
----
----
----
----
----
----
----
----
Shar
e di
vide
nds
(Not
e 24
)-
196,
726
--
--
(196
,726
)-
--
Dir
ecto
rs’ r
emun
erat
ion
(Not
e 24
)-
--
--
-(9
,970
)(9
,970
)(6
17)
(10,
587)
Char
ity d
onat
ions
(Not
e 24
)-
--
--
-(2
,500
)(2
,500
)-
(2,5
00)
Tran
sfer
to c
ontin
genc
y re
serv
e-
--
30,0
00-
-(3
0,00
0)-
--
Div
iden
ds p
aid
(Not
e 24
)-
--
--
-(7
1,50
0)(7
1,50
0)(1
,841
)(7
3,34
1)
Res
ale
of in
vest
men
ts (N
ote
15)
--
--
--
--
(12,
515)
(12,
515)
----
----
----
----
----
----
----
----
----
----
----
----
----
----
----
----
----
----
----
----
----
----
----
----
----
----
----
----
----
----
Bal
ance
at 3
1 D
ecem
ber
2015
2,10
0,00
0-
1,05
0,00
048
0,00
010
0,00
021
2,43
247
6,48
54,
418,
917
203,
527
4,62
2,44
4
----
----
----
----
----
----
----
----
----
----
----
----
----
----
----
----
----
----
----
----
----
----
----
----
----
----
----
----
----
----
Consolidated Statement of other Comprehensive Incomefor the year ended 31 December 2015

ConsolidatedStatement ofCash Flows
37
The accompanying notes form an integral part of these consolidated financial statements.
2015 2014
AED’000 AED’000
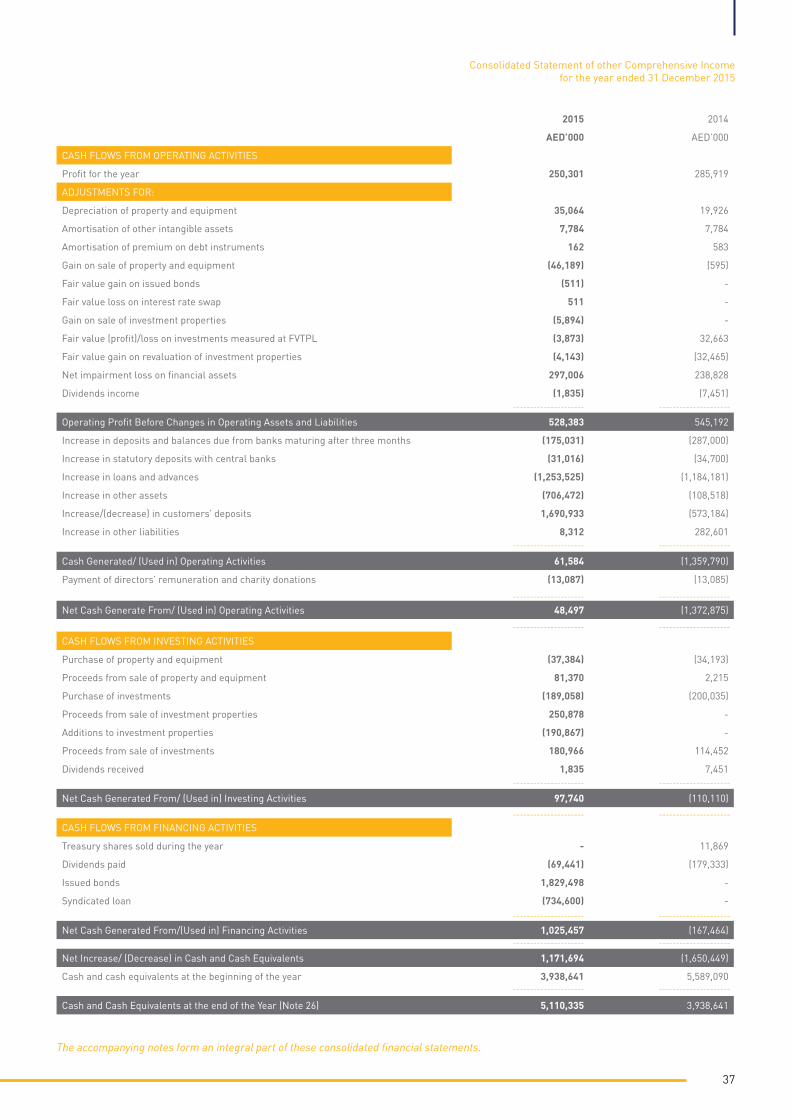
CASH FLOWS FROM OPERATING ACTIVITIES
Profit for the year 250,301 285,919
ADJUSTMENTS FOR:
Depreciation of property and equipment 35,064 19,926
Amortisation of other intangible assets 7,784 7,784
Amortisation of premium on debt instruments 162 583
Gain on sale of property and equipment (46,189) (595)
Fair value gain on issued bonds (511) -
Fair value loss on interest rate swap 511 -
Gain on sale of investment properties (5,894) -
Fair value (profit)/loss on investments measured at FVTPL (3,873) 32,663
Fair value gain on revaluation of investment properties (4,143) (32,465)
Net impairment loss on financial assets 297,006 238,828
Dividends income (1,835) (7,451)
Operating Profit Before Changes in Operating Assets and Liabilities 528,383 545,192
Increase in deposits and balances due from banks maturing after three months (175,031) (287,000)
Increase in statutory deposits with central banks (31,016) (34,700)
Increase in loans and advances (1,253,525) (1,184,181)
Increase in other assets (706,472) (108,518)
Increase/(decrease) in customers’ deposits 1,690,933 (573,184)
Increase in other liabilities 8,312 282,601
Cash Generated/ (Used in) Operating Activities 61,584 (1,359,790)
Payment of directors’ remuneration and charity donations (13,087) (13,085)
Net Cash Generate From/ (Used in) Operating Activities 48,497 (1,372,875)
CASH FLOWS FROM INVESTING ACTIVITIES
Purchase of property and equipment (37,384) (34,193)
Proceeds from sale of property and equipment 81,370 2,215
Purchase of investments (189,058) (200,035)
Proceeds from sale of investment properties 250,878 -
Additions to investment properties (190,867) -
Proceeds from sale of investments 180,966 114,452
Dividends received 1,835 7,451
Net Cash Generated From/ (Used in) Investing Activities 97,740 (110,110)
CASH FLOWS FROM FINANCING ACTIVITIES
Treasury shares sold during the year - 11,869
Dividends paid (69,441) (179,333)
Issued bonds 1,829,498 -
Syndicated loan (734,600) -
Net Cash Generated From/(Used in) Financing Activities 1,025,457 (167,464)
Net Increase/ (Decrease) in Cash and Cash Equivalents 1,171,694 (1,650,449)
Cash and cash equivalents at the beginning of the year 3,938,641 5,589,090
Cash and Cash Equivalents at the end of the Year (Note 26) 5,110,335 3,938,641
--------------------- ---------------------
--------------------- ---------------------
--------------------- ---------------------
--------------------- ---------------------
--------------------- ---------------------
--------------------- ---------------------
--------------------- ---------------------
--------------------- ---------------------
--------------------- ---------------------
Consolidated Statement of other Comprehensive Incomefor the year ended 31 December 2015

Notes to theconsolidatedFinancial Statements

39
1 - General informationBank of Sharjah P.J.S.C. (the “Bank”), is a public joint stock company incorporated by an Amiri Decree issued on 22 December 1973 by His Highness The Ruler of Sharjah and was registered in February 1993 under the Commercial Companies Law Number 8 of 1984 (as amended). The Bank commenced its operations under a banking license issued by the United Arab Emirates Central Bank dated 26 January 1974. The Bank is engaged in commercial and investment banking activities.
The Bank’s registered office is located at Al Khan Road, P.O. Box 1394, Sharjah, United Arab Emirates. The Bank operates through five branches in the United Arab Emirates located in the Emirates of Sharjah, Dubai, Abu Dhabi, and City of Al Ain.
The accompanying consolidated financial statements combine the activities of the Bank and its subsidiaries (collectively the “Group”).
2 - Application of new and revised International Financial Reporting Standards (“IFRSs”)
New and revised IFRSs in issue but not yet effective and not early adopted
The Group has not early applied the following new standards, amendments and interpretations that have been issued but are not yet effective:
New and revised IFRSs
• Finalised version of IFRS 9 (IFRS 9 Financial Instruments (2014))was issued in July 2014 incorporating requirements for classification and measurement, impairment, general hedge accounting and derecognition. This amends classification and measurement requirement of financial assets and introduces new expected loss impairment model.
A new measurement category of fair value through other comprehensive income (FVTOCI) will apply for debt instruments held within a business model whose objective is achieved both by collecting contractual cash flows and selling financial assets.
A new impairment model based on expected credit losses will apply to debt instruments measured at amortised costs or FVTOCI, lease receivables, contract assets and certain written loan commitments and financial guarantee contract.
1 January 2018
Effective forannual periodsbeginning on or after
Consolidated Statement of other Comprehensive Incomefor the year ended 31 December 2015
New and revised IFRSs
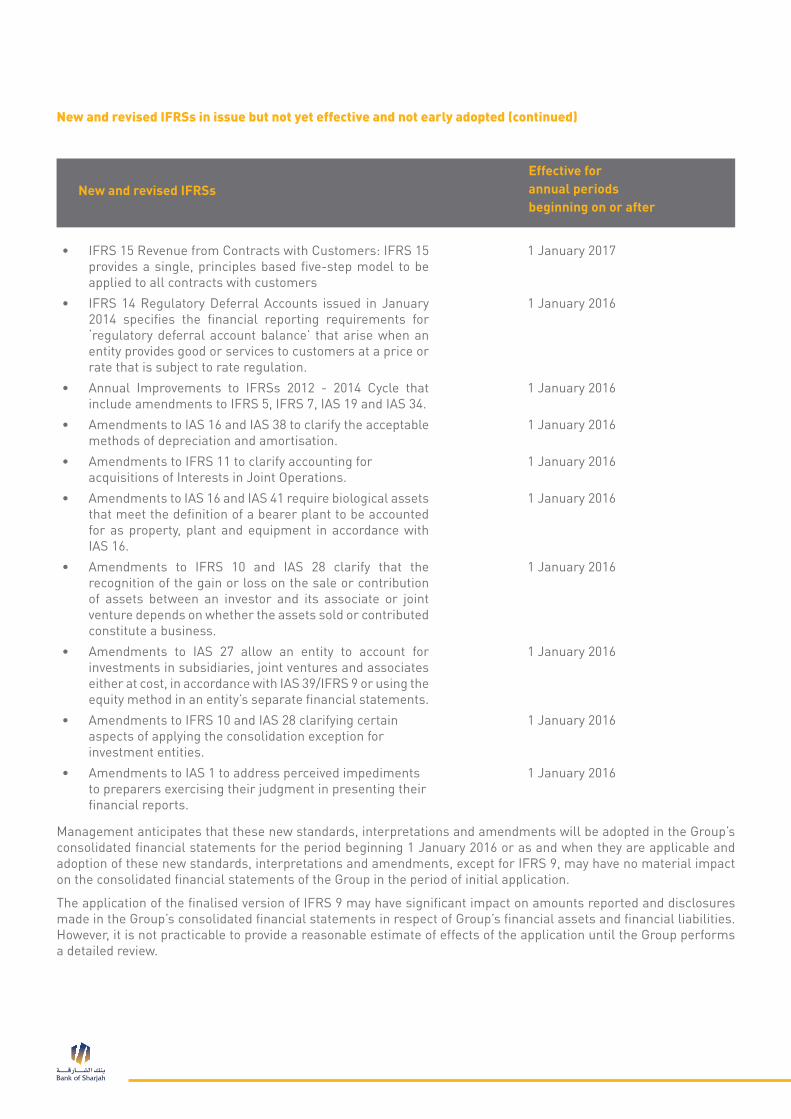
New and revised IFRSs in issue but not yet effective and not early adopted (continued)
Effective forannual periodsbeginning on or after
• IFRS 15 Revenue from Contracts with Customers: IFRS 15 provides a single, principles based five-step model to be applied to all contracts with customers
1 January 2017
• IFRS 14 Regulatory Deferral Accounts issued in January 2014 specifies the financial reporting requirements for ‘regulatory deferral account balance’ that arise when an entity provides good or services to customers at a price or rate that is subject to rate regulation.
1 January 2016
• Annual Improvements to IFRSs 2012 - 2014 Cycle that include amendments to IFRS 5, IFRS 7, IAS 19 and IAS 34.
1 January 2016
• Amendments to IAS 16 and IAS 38 to clarify the acceptable methods of depreciation and amortisation.
1 January 2016
• Amendments to IFRS 11 to clarify accounting for acquisitions of Interests in Joint Operations.
1 January 2016
• Amendments to IAS 16 and IAS 41 require biological assets that meet the definition of a bearer plant to be accounted for as property, plant and equipment in accordance with IAS 16.
1 January 2016
• Amendments to IFRS 10 and IAS 28 clarify that the recognition of the gain or loss on the sale or contribution of assets between an investor and its associate or joint venture depends on whether the assets sold or contributed constitute a business.
1 January 2016
• Amendments to IAS 27 allow an entity to account for investments in subsidiaries, joint ventures and associates either at cost, in accordance with IAS 39/IFRS 9 or using the equity method in an entity’s separate financial statements.
1 January 2016
• Amendments to IFRS 10 and IAS 28 clarifying certain aspects of applying the consolidation exception for investment entities.
1 January 2016
• Amendments to IAS 1 to address perceived impediments to preparers exercising their judgment in presenting their financial reports.
1 January 2016
Management anticipates that these new standards, interpretations and amendments will be adopted in the Group’s consolidated financial statements for the period beginning 1 January 2016 or as and when they are applicable and adoption of these new standards, interpretations and amendments, except for IFRS 9, may have no material impact on the consolidated financial statements of the Group in the period of initial application.
The application of the finalised version of IFRS 9 may have significant impact on amounts reported and disclosures made in the Group’s consolidated financial statements in respect of Group’s financial assets and financial liabilities. However, it is not practicable to provide a reasonable estimate of effects of the application until the Group performs a detailed review.

41
3 - Basis of preparation
3.1 Statement of compliance
The consolidated financial statements have been prepared in accordance with International Financial Reporting Standards (IFRSs) and applicable requirements of the Laws of the U.A.E. and U.A.E. Central Bank regulations. UAE Federal Law No 2 of 2015 ("UAE Companies Law of 2015") was issued on 1 April 2015 and has come into force on 1 July 2015. Companies are allowed to ensure compliance with the UAE Companies Law of 2015 by 30 June 2016 as per the transitional provisions contained therein. The Bank is currently in the process of implementing all changes required by the UAE Companies Law of 2015.
3.2 Basis of measurement
The consolidated financial statements have been prepared on the historical cost basis except for certain financial instruments that are measured at revalued amounts or fair values at the end of each reporting period, as explained in the accounting policies below.
Historical cost is generally based on the fair value of the consideration given in exchange for assets, goods and services.
3.3 Functional and presentation currency
The consolidated financial statements are presented in Arab Emirates Dirham (AED) and all values are rounded to the nearest thousands dirham, except when otherwise indicated.
The principal accounting policies are set out below.
4 - Summary of significant accounting policies
4.1 Basis of consolidation
These consolidated financial statements incorporate the financial statements of the Bank and entities controlled by the Bank. Control is achieved when the Bank has:
• Powerovertheinvestee.
• Exposure,orhasrights,tovariablereturnsfromitsinvolvementwiththeinvestee.
• Theabilitytouseitspowerovertheinvesteetoaffectitsreturns.
The Bank reassesses whether or not it controls an investee if facts and circumstances indicate that there are changes to one or more of the three elements of control listed above.
When the Bank has less than a majority of the voting rights of an investee, it has power over the investee when the voting rights are sufficient to give it the practical ability to direct the relevant activities of the investee unilaterally. The Bank considers all relevant facts and circumstances in assessing whether or not the Bank’s voting rights in an investee are sufficient to give it power, including:
• ThesizeoftheBank’sholdingofvotingrightsrelativetothesizeanddispersionofholdingsoftheother vote holders.
• PotentialvotingrightsheldbytheBank,othervoteholdersandotherparties.
• Rightsraisingfromothercontractualarrangements.
• AnyadditionalfactsandcircumstancesthatindicatethattheBankhas,ordoesnothave,thecurrentability to direct the relevant activities at the time that decisions need to be made, including voting patterns and previous shareholders’ meetings.
Consolidated Statement of other Comprehensive Incomefor the year ended 31 December 2015

4.1 Basis of consolidation
Consolidation of a subsidiary begins when the Bank obtains control over the subsidiary and ceases when the Bank loses control of the subsidiary. Specifically, income and expenses of a subsidiary acquired or disposed of during the year are included in the consolidated statement of profit or loss from the date the Bank gains control until the date when the Bank ceases to control the subsidiary.
Profit or loss and each component of other comprehensive income are attributable to the owners of the Bank and to the non-controlling interests. Total comprehensive income of the subsidiaries is attributable to the owners of the parent and to the non-controlling interest even if this results in the non-controlling interests having a deficit balance.
When necessary, adjustments are made to the financial statements of subsidiaries to bring their accounting policies into line with the Bank’s accounting policies.
All intragroup assets, liabilities, equity, income, expenses and cash flows relating to transactions between entities of the Bank are eliminated in full on consolidation.
Changes in the Bank’s ownership interests in subsidiaries that do not result in the Bank losing control over the subsidiaries are accounted for as equity transactions. The carrying amounts of the Bank’s interests and the non-controlling interests are adjusted to reflect the changes in their relative interests in the subsidiaries. Any difference between the amount by which the non-controlling interests are adjusted and the fair value of the consideration paid/payable or received/receivable is recognised directly in equity and attributed to owners of the Bank.
When the Bank loses control of a subsidiary, a gain or loss is recognised in the consolidated statement of profit or loss and is calculated as the difference between (i) the aggregate of the fair value of the consideration received and the fair value of any retained interest, and (ii) the previous carrying amount of the assets (including goodwill) and liabilities of the subsidiary, and any non-controlling interests. All amounts previously recognised in other comprehensive income in relation to that subsidiary are accounted for as if the Bank had directly disposed of the related assets or liabilities of the subsidiary (i.e. reclassified to statement of profit or loss or transferred to another category of equity as specified/permitted by applicable IFRSs). The fair value of any investment retained in the former subsidiary at the date when control is lost is regarded as the fair value on initial recognition for subsequent accounting under IFRS 9, when applicable, the cost on initial recognition of an investment in an associate or a joint venture.
4.2 Cash and cash equivalents
Cash and cash equivalents disclosed in the consolidated statement of cash flows consist of cash on hand, current accounts and other balances with central banks, certificate of deposits, balances with banks, and money market placements which have original maturity of less than three months.
4.3 Due from banks
Due from banks are stated at cost less any amounts written-off and allowance for impairment, if any.
4.4 Financial instruments
4.4.1 Initial recognition
The Group recognises a financial asset or liability in its consolidated statement of financial position only when it becomes party to the contractual provisions of that instrument.
4.4.2 Initial measurement
Financial assets and liabilities are initially measured at fair value. Transaction costs that are directly attributable to the acquisition or issue of financial assets and liabilities (other than financial assets and financial liabilities at fair value through profit or loss) are added to or deducted from the fair value of the financial assets or financial liabilities, as appropriate, on initial recognition. Transaction costs directly attributable to the acquisition of financial assets or financial liabilities at fair value through profit or loss are recognised immediately in the consolidated statement of profit or loss.

43
4.4.3 Financial assets
All regular way purchases or sales of financial assets are recognised and derecognised on a trade date basis. Regular way purchases or sales are purchases or sales of financial assets that require delivery of assets within the time frame established by regulation or convention in the marketplace.
All recognised financial assets are subsequently measured in their entirety at either amortised cost or fair value, depending on the classification of the financial assets.
Classification of financial assets
For the purposes of classifying financial assets an instrument is an ‘equity instrument’ if it is a non-derivative and meets the definition of ‘equity’ for the issuer except for certain non-derivative puttable instruments presented as equity by the issuer. All other non-derivative financial assets are ‘debt instruments’.
Balances with central banks, due from banks and financial institutions, financial assets and certain items in receivables and other assets that meet the following conditions are subsequently measured at amortised cost less impairment loss and deferred income, if any (except for those assets that are designated as at fair value through profit or loss on initial recognition):
• The asset is held within a business model whose objective is to hold assets in order to collect contractual cash flows.
• The contractual terms of the instrument give rise on specified dates to cash flows that are solely payments of principal and profit on the principal amount outstanding.
All other financial assets are subsequently measured at fair value.
Financial assets measured at amortised cost
The effective interest rate method is a method of calculating the amortised cost of those financial instruments measured at amortised cost and of allocating income over the relevant period. The effective interest rate is the rate that is used to calculate the present value of the estimated future cash receipts (including all fees and points paid or received that form an integral part of the effective interest rate, transaction costs and other premiums or discounts) through the expected life of the financial instruments, or, where appropriate, a shorter period, to arrive at the net carrying amount on initial recognition.
Income is recognised in the consolidated statement of profit or loss on an effective interest rate basis for financing and investing instruments measured subsequently at amortised cost.
Financial assets measured at FVTPL
Investments in equity instruments are classified as financial assets measured at FVTPL, unless the Group designates fair value through other comprehensive income (FVTOCI) at initial recognition.
Financial assets that do not meet the amortised cost criteria described above, or that meet the criteria but the Group has chosen to designate as at FVTPL at initial recognition, are measured at FVTPL.
Financial assets (other than equity instruments) may be designated at FVTPL upon initial recognition if such designation eliminates or significantly reduces a measurement or recognition inconsistency that would arise from measuring assets or liabilities or recognizing the gains or losses on them on different basis.
Financial assets are reclassified from amortised cost to FVTPL when the business model is changed such that the amortised cost criteria are no longer met.
Reclassification of financial assets (other than equity instruments) designated as at FVTPL at initial recognition is not permitted.
Financial assets measured at FVTPL are measured at fair value at the end of each reporting period, with any gains or losses arising on re-measurement recognised in the consolidated statement of profit or loss at the end of each reporting period. The net gain or loss recognised in the consolidated statement of profit or loss. Fair value is determined in the manner described in note 40.
Dividend income on investments in equity instruments at FVTPL is recognised in the consolidated statement of profit or loss when the Group’s right to receive the dividends is established.
Consolidated Statement of other Comprehensive Incomefor the year ended 31 December 2015

Financial assets measured at FVTOCI
On initial recognition, the Group can make an irrevocable election (on an instrument-by-instrument basis) to designate investments in equity instruments as at FVTOCI. Designation at FVTOCI is not permitted if the equity investment is held for trading.
A financial asset is held for trading if:
• It has been acquired principally for the purpose of selling it in the near term.
• On initial recognition it is part of a portfolio of identified financial instruments that the Group manages together and has evidence of a recent actual pattern of short-term profit-taking.
• It is a derivative that is not designated and effective as a hedging instrument or a financial guarantee.
Investments in equity instruments at FVTOCI are initially measured at fair value plus transaction costs. Subsequently, they are measured at fair value with gains and losses arising from changes in fair value recognised in other comprehensive income and accumulated in the investments fair value reserve. Where the asset is disposed of, the cumulative gain or loss previously accumulated in the investments fair value reserve is not transferred to consolidated statement of profit or loss.
Dividends on these investments in equity instruments are recognised in the consolidated statement of profit or loss when the Group’s right to receive the dividends is established, unless the dividends clearly represent a recovery of part of the cost of the investment.
4.5 Definition of fair value
Fair value is the price that would be received to sell an asset or paid to transfer a liability in an orderly transaction between market participants at the measurement date, regardless of whether that price is directly observable or estimated using another valuation technique. In estimating the fair value of an asset or a liability, the Group takes into account when pricing the asset or liability if market participants would take those characteristics into account when pricing the asset or liability at the measurement date. Fair value for measurement and/or disclosure purposes in these consolidated financial statements is determined on such a basis, except for measurements that have some similarities to fair value but are not fair value such as value in use in IAS 36.
All financial instruments are recognised initially at fair value. The fair value of a financial instrument on initial recognition is normally the transaction price, i.e. the fair value of the consideration given or received.
• The fair value of financial assets and financial liabilities with standard terms and conditions and traded on active liquid markets is determined with reference to quoted market prices.
• The fair value of other financial assets and financial liabilities (excluding derivative instruments) is determined in accordance with generally accepted pricing models based on discounted cash flow analysis using prices from observable current market transactions and dealer quotes for similar instruments.
• The fair value of derivative instruments is calculated using quoted prices. Where such prices are not available, use is made of discounted cash flow analysis using the applicable yield curve for the duration of the instruments for non-optional derivatives, and option pricing models for optional derivatives.

45
4.6 Investment properties
Investment properties are held to earn rental income and/or capital appreciation. Investment properties include cost of initial purchase, developments transferred from property under development, subsequent cost of development, and fair value adjustments. Investment properties are reported at valuation based on fair value at the end of the reporting period. The fair value is determined on a periodic basis by independent professional valuers. Fair value adjustments on investment property are included in the consolidated statement of profit or loss in the period in which these gains or losses arise.
Investment properties are derecognised when either they have been disposed of or when the investment property is permanently withdrawn from use and no future economic benefit is expected from its disposal. The difference between the net disposal proceeds and the carrying amount of the asset is recognised in the consolidated statement of profit or loss in the period of derecognition.
Transfers are made to or from investment property only when there is a change in use. For a transfer from investment property to owner occupied property, the deemed cost for subsequent accounting is the fair value at the date of change in use. If owner occupied property becomes an investment property, the Group accounts for such property in accordance with the policy stated under property, plant and equipment up to the date of change in use.
4.7 Property and equipment
Property and equipment are stated at historical cost less accumulated depreciation and impairment loss, if any. Historical cost includes expenditure that is directly attributable to the acquisition of the asset.
Depreciation is charged so as to write off the cost or valuation of assets, over their estimated useful lives using the straight-line method as follows:
Subsequent costs are included in the asset’s carrying amount or recognized as a separate asset, as appropriate, only when it is probable that future economic benefits associated with the item will flow to the Group and the cost of the item can be measured reliably. All other repairs and maintenance are charged to the consolidated statement of other comprehensive income when incurred.
Gain or loss arising on the disposal or retirement of an asset is determined as the difference between the sales proceeds and the carrying amount of the asset at that date and is recognised in the consolidated statement of profit or loss.
Capital work-in-progress is carried at cost, less any accumulated impairment loss. Cost includes professional fees and, for qualifying assets, borrowing costs capitalised in accordance with the Group’s accounting policy. Depreciation of these assets commences when the assets are ready for their intended use.
YearsBuildings 20 - 40Furniture and office equipment 2 - 6Installation, partitions and decorations 3 - 4Leasehold improvements 5 - 10Motor vehicles 3
Consolidated Statement of other Comprehensive Incomefor the year ended 31 December 2015
4.8 Intangible assets acquired separately
Intangible assets acquired in a business combination and recognised separately from goodwill are initially recognised at their fair value at the acquisition date (which is regarded as their cost).
Subsequent to initial recognition, intangible assets acquired in a business combination are reported at cost less accumulated amortisation and accumulated impairment losses. Amortisation is recognised on a straight-line basis over their estimated useful lives. The estimated useful life and amortisation method are reviewed at the end of each annual reporting period, with the effect of any changes in estimate being accounted for on a prospective basis.
Amortisation is charged so as to write off the cost of intangible assets, over their estimated useful lives using the straight-line method as follows:
4.9 Impairment of tangible and intangibles
At the end of each reporting period, the Group reviews the carrying amounts of its tangible and intangibles to determine whether there is any indication that those assets have suffered an impairment loss. If any such indication exists, the recoverable amount of the assets is estimated in order to determine the extent of the impairment loss, if any. Where it is not possible to estimate the recoverable amount of an individual asset, the Group estimates the recoverable amount of the cash-generating unit to which the asset belongs.
The recoverable amount is the higher of fair value less costs to sell and value in use. In assessing value in use, the estimated future cash flows are discounted to their present value using a pre-tax discount rate that reflects current market assessments of the time value of money and the risks specific to the asset.
If the recoverable amount of an asset (or cash-generating unit) is estimated to be less than its carrying amount, the carrying amount of the asset (cash-generating unit) is reduced to its recoverable amount. An impairment loss is recognised in the consolidated statement of profit or loss, unless the relevant asset is carried at a revalued amount, in which case the impairment loss is treated as a revaluation decrease.
Where an impairment loss subsequently reverses, the carrying amount of the asset (cash-generating unit) is increased to the revised estimate of its recoverable amount, such that the increased carrying amount does not exceed the carrying amount that would have been determined had no impairment loss been recognised for the asset (cash-generating unit) in prior years. A reversal of an impairment loss is recognised in the consolidated statement of profit or loss, unless the relevant asset is carried at a revalued amount, in which case the reversal of the impairment loss is treated as a revaluation increase.
4.10 Impairment of financial assets
Financial assets that are measured at amortised cost are assessed for impairment at the end of each reporting period. Financial assets are considered to be impaired when there is objective evidence that, as a result of one or more events that occurred after the initial recognition of the financial assets, the estimated future cash flows of the asset have been affected.
Years Banking license Indefinite Legal corporate setup in Lebanon 10 Customer base 10 Branch network 10
47
4.10 Impairment of financial assets
Objective evidence of impairment could include:
• Significant financial difficulty of the issuer or counterparty.
• Breach of contract, such as a default or delinquency in interest or principal payments.
• It’s becoming probable that the borrower will enter bankruptcy or financial re-organisation.
• The disappearance of an active market for that financial asset because of financial difficulties.
The amount of the impairment loss recognised is the difference between the asset’s carrying amount and the present value of estimated future cash flows reflecting the amount of collateral and guarantee, discounted at the financial asset’s original effective interest rate.
The carrying amount of the financial asset is reduced by the impairment loss directly for all financial assets with the exception of loans and advances, where the carrying amount is reduced through the use of an allowance account. When a loan is considered uncollectible, it is written off against the allowance account. Subsequent recoveries of amounts previously written off are credited against the allowance account. Changes in the carrying amount of the allowance account are recognised in the consolidated statement of profit or loss.
If, in a subsequent period, the amount of the impairment loss decreases and the decrease can be related objectively to an event occurring after the impairment was recognised, the previously recognised impairment loss is reversed through the consolidated statement of profit or loss to the extent that the carrying amount of the financial asset at the date the impairment is reversed does not exceed what the amortised cost would have been had the impairment not been recognised.
Impairment of loans and advances measured at amortised costs are assessed by the Group as follows:
Individually assessed loans
Individually assessed loans mainly represent corporate and commercial loans which are assessed individually in order to determine whether there exists any objective evidence that a loan is impaired. Loans are classified as impaired as soon as there is doubt about the borrower’s ability to meet payment obligations to the Group in accordance with the original contractual terms. Doubt about the borrower’s ability to meet payment obligations generally arises when:
a) Principal and interest are not serviced as per contractual terms.
b) When there is significant deterioration in the borrower’s financial condition and the amount expected to be realised from disposal of collateral, if any, is not likely to cover the present carrying value of the loan.
Impaired loans are measured on the basis of the present value of expected future cash flows discounted at the loan’s effective interest rate or, as a practical expedient, at the loan’s observable market price or fair value of the collateral if the loan is collateral dependent.
Impairment loss is calculated as the difference between the loan’s carrying value and its present impaired value.
Collectively assessed loans
Impairment losses of collectively assessed loans include the allowances calculated on:
a) Performing loans.
b) Retail loans with common features and which are not individually significant.
Consolidated Statement of other Comprehensive Incomefor the year ended 31 December 2015

4.10 Impairment of financial assets
Performing loans
Where individually assessed loans are evaluated and no evidence of loss has been identified, these loans are classified as performing loans portfolios with common credit risk characteristics based on industry, product or loan rating. Impairment covers losses which may arise from individual performing loans that are impaired at the end of the reporting period but were not specifically identified as such until sometime in the future. The estimated impairment is calculated by the Group’s management for each identified portfolio based on historical experience and the assessed inherent losses which are reflected by the economic and credit conditions.
Retail loans with common features and which are not individually significant
Impairment of retail loans is calculated by applying a formulaic approach which allocates progressively higher loss rates in line with the overdue instalment date.
Renegotiated loans
Retail loans, which are subject to collective impairment review and whose terms have been renegotiated, are no longer considered to be past due and consequently impaired only when the minimum required number of payments under the new arrangements has not been received and the borrower has not complied with the revised terms and conditions.
Loans subject to individual impairment assessment, whose terms have been renegotiated, are subject to continuous review to determine whether they remain impaired or are considered to be past due depending upon the borrower complying with the revised terms and conditions and making the minimum required payments for the loans to be moved to performing category.
Loans that are either subject to collective impairment assessment or are individually significant and whose terms have been renegotiated are no longer considered to be past due but are treated as new loans. In subsequent years, the asset is considered to be past due and disclosed only if renegotiated.
4.11 Derecognition of financial assets
The Group derecognises a financial asset only when the contractual rights to the cash flows from the asset expire, or when it transfers the financial asset and substantially all the risks and rewards of ownership of the asset to another entity. If the Group neither transfers nor retains substantially all the risks and rewards of ownership and continues to control the transferred asset, the Group recognises its retained interest in the asset and an associated liability for amounts it may have to pay. If the Group retains substantially all the risks and rewards of ownership of a transferred financial asset, the Group continues to recognise the financial asset and also recognises a collateralised borrowing for the proceeds received.
On derecognition of a financial asset measured at amortised cost, the difference between the asset's carrying amount and the sum of the consideration received and receivable is recognised in the consolidated statement of profit or loss.
On derecognition of a financial asset that is classified as FVTOCI, the cumulative gain or loss previously accumulated in the investments fair value reserve is not reclassified to the consolidated statement of profit or loss, but is reclassified to retained earnings within equity.
4.12 Offsetting
Financial assets and liabilities are offset and reported net in the consolidated financial position only when there is a legally enforceable right to set off the recognised amounts and when the Group intends to settle either on a net basis, or to realise the asset and settle the liability simultaneously.
Income and expenses are presented on a net basis only when permitted by the accounting standards, or for gains and losses arising from a group of similar transactions such as in the Group trading activity.
The Group is party to a number of arrangements, including master netting agreements, that give it the right to offset financial assets and financial liabilities but where it does not intend to settle the amounts net or simultaneously and therefore the assets and liabilities concerned are presented on a gross basis.
49
4.13 Assets acquired in settlement of debt
The Group occasionally acquires real estate and other collateral in settlement of certain loans and advances. Such real estate and other collateral are stated at the lower of the net realisable value of the loans and advances and the current fair value of such assets at the date of acquisition. Gains or losses on disposal and unrealised losses on revaluation are recognised in the consolidated statement of profit or loss.
4.14 Derivative financial instruments
A derivative is a financial instrument whose value changes in response to an underlying variable, that requires little or no initial investment and that is settled at a future date.
The Group enters into a variety of derivative financial instruments to manage its exposure to foreign exchange rate risks, including forward foreign exchange contracts and currency swaps.
Derivative financial instruments are initially measured at cost, being the fair value at contract date, and are subsequently re-measured at fair value. All derivatives are carried at their fair values as assets where the fair values are positive and as liabilities where the fair values are negative.
Fair values are generally obtained by reference to quoted market prices, discounted cash flow models and recognised pricing models as appropriate.
For the purpose of hedge accounting, the Group classifies hedges into two categories: (a) fair value hedges, which hedge the exposure to changes in the fair value of a recognised asset or liability; and (b) cash flow hedges, which hedge exposure to variability in cash flows that are either attributable to a particular risk associated with a recognised asset or liability, or a highly probable forecasted transaction that will affect future reported net income.
In order to qualify for hedge accounting, it is required that the hedge should be expected to be highly effective, i.e. the changes in fair value or cash flows of the hedging instrument should effectively offset corresponding changes in the hedged item and should be reliably measurable. At inception of the hedge, the risk management objectives and strategies are documented including the identification of the hedging instrument, the related hedged item, the nature of risk being hedged, and how the Group will assess the effectiveness of the hedging relationship. Subsequently, the hedge is required to be assessed and determined to be an effective hedge on an ongoing basis.
Fair value hedges
Where a hedging relationship is designated as a fair value hedge, the hedged item is adjusted for the change in fair value in respect of the risk being hedged. Gains or losses on the re-measurement of both the derivative and the hedged item are recognised in the consolidated statement of profit or loss. Fair value adjustments relating to the hedging instrument are allocated to the same consolidated statement of profit or loss category as the related hedged item. Any ineffectiveness is also recognised in the same consolidated statement of profit or loss category as the related hedged item. If the derivative expires, is sold, terminated, exercised, no longer meets the criteria for fair value hedge accounting, or the designation is revoked, hedge accounting is discontinued. Any adjustment up to that point to a hedged item for which the effective interest method is used, is amortised in the consolidated statement of profit or loss as part of the recalculated effective interest rate over the period to maturity.
Cash flow hedges
The effective portion of changes in the fair value of derivatives that are designated and qualify as cash flow hedges are recognised in the cash flow hedging reserve in equity. The ineffective part of any gain or loss is recognised immediately in the consolidated statement of profit or loss as trading revenue/loss. Amounts accumulated in equity are transferred to the consolidated statement of profit or loss in the periods in which the hedged item affects profit or loss. However, when the forecast transaction that is hedged results in the recognition of a non-financial asset or a non-financial liability, the cumulative gains or losses previously deferred in equity are transferred from equity and included in the initial measurement of the cost of the asset or liability. When a hedging instrument expires or is sold, or when a hedge no longer meets the criteria for hedge accounting, the cumulative gains or losses recognised in other comprehensive income remain in equity until the forecast transaction is recognised, in the case of a non-financial asset or a non-financial liability, or until the forecast transaction affects the consolidated statement of profit or loss. If the forecast transaction is no longer expected to occur, the cumulative gains or losses recognised in other comprehensive income are immediately transferred to the consolidated statement of profit or loss and classified as trading revenue/loss.
Consolidated Statement of other Comprehensive Incomefor the year ended 31 December 2015

4.14 Derivative financial instruments
Derivatives that do not qualify for hedge accounting
All gains and losses from changes in the fair values of derivatives that do not qualify for hedge accounting are recognised immediately in the consolidated statement of profit or loss as trading revenue/loss. However, the gains and losses arising from changes in the fair values of derivatives that are managed in conjunction with financial instruments designated at fair value are included in net income from financial instruments designated at fair value under other non-interest revenue/loss.
Derivatives embedded in other financial instruments or other non-financial host contracts are treated as separate derivatives when their risks and characteristics are not closely related to those of the host contract and the host contract is not carried at fair value with unrealised gains or losses reported in the consolidated statement of profit or loss.
4.15 Financial liabilities
Financial liabilities are classified as either financial liabilities ‘at FVTPL’ or ‘other financial liabilities’. The Group initially recognises financial liabilities such as deposits and debt securities issued on the date at which they are originated. All other financial liabilities (including liabilities designated at fair value through profit or loss) are initially recognised on the trade date at which the Group becomes party to the contractual provision of the instrument.
Financial liabilities at FVTPL
Financial liabilities are classified at FVTPL where the financial liability is either held for trading or it is designated at FVTPL and measured at fair value. Determination is made at initial recognition and is not reassessed.
Financial liabilities measured at FVTPL are measured at fair value at the end of each reporting period, with any gains or losses arising on re-measurement recognised in the consolidated statement of profit or loss at the end of each reporting period. The net gain or loss recognised in the consolidated statement of profit or loss. Other changes in fair value attributable to credit risk are recognized in other comprehensive income. Amounts presented in other comprehensive income shall not be subsequently transferred to profit or loss. However, the Bank may transfer the cumulative gain or loss within equity. Fair value is determined in the manner described in note 40.
The Bank has elected to designate the issued bond as at FVTPL as the Bank will be managing and evaluating the performance of the issued bond alongside a group of financial assets in such a way that measuring that group at FVTPL results in more relevant information.
Other financial liabilities
Other financial liabilities, including borrowings, are initially measured at fair value, net of transaction costs. Other financial liabilities are subsequently measured at amortised cost using the effective interest method, with interest expense recognised on an effective yield basis.
The effective interest method is a method of calculating the amortised cost of a financial liability and of allocating interest expense over the relevant period. The effective interest rate is the rate that exactly discounts estimated future cash payments through the expected life of the financial liability, or, where appropriate, a shorter period.
De-recognition of financial liabilities
Financial liabilities are derecognised when they are extinguished - that is when the obligation specified in the contract is discharged, cancelled or expired.
4.16 Customers’ deposits and syndicated loan
Customers’ deposits and syndicated loan are initially measured at fair value which is normally consideration received net of directly attributable transaction costs incurred, and subsequently measured at their amortised cost using the effective interest method.
51
4.17 Business combinations
Acquisitions of subsidiaries and businesses are accounted for using the purchase method. The cost of the business combination is measured at the aggregate of the fair values, at the date of exchange, of assets given, liabilities incurred or assumed, and equity instruments issued by the Group in exchange for control of the acquiree, plus any costs directly attributable to the business combination. The acquiree’s identifiable assets, liabilities and contingent liabilities that meet the conditions for recognition under IFRS 3 Business Combinations are recognised at their fair values at the acquisition date; except for non-current assets (or disposal banks) that are classified as held for sale in accordance with IFRS 5 Non-current Assets Held for Sale and Discontinued Operations, which are recognised and measured at fair value less costs to sell.
Goodwill arising on acquisition is recognised as an asset and initially measured at cost, being the excess of the cost of the business combination over the Group’s interest in the net fair value of the identifiable assets, liabilities and contingent liabilities recognised. If, after reassessment, the Group’s interest in the net fair value of the acquiree’s identifiable assets, liabilities and contingent liabilities exceeds the cost of the business combination, the excess is recognised immediately in the consolidated statement of profit or loss.
The interest of non-controlling shareholders in the acquiree is initially measured at the non-controlling shareholder’s proportion of the net fair value of the assets, liabilities and contingent liabilities recognised.
4.18 Goodwill
Goodwill is initially recognised as an asset at cost and is subsequently measured at cost less any accumulated impairment losses.
For the purpose of impairment testing, goodwill is allocated to each of the Group’s cash-generating units expected to benefit from the synergies of the combination. Cash-generating units to which goodwill has been allocated are tested for impairment annually, or more frequently when there is an indication that the unit may be impaired. If the recoverable amount of the cash-generating unit is less than the carrying amount of the unit, the impairment loss is allocated first to reduce the carrying amount of any goodwill allocated to the unit and then to the other assets of the unit pro-rata on the basis of the carrying amount of each asset in the unit. An impairment loss recognised for goodwill is not reversed in a subsequent period.
4.19 Employees’ end-of-service benefits
The Group provides end of service benefits for its expatriate employees. The entitlement to these benefits is based upon the employees’ length of service and completion of a minimum service period. The expected costs of these benefits are accrued over the period of employment.
Pension and national insurance contributions for the U.A.E. citizens are made by the Group in accordance with Federal Law No. 2 of 2000.
4.20 Provisions and contingent liabilities
Provisions are recognised when the Group has a present obligation (legal or constructive) as a result of a past event, it is probable that the Group will be required to settle the obligation, and a reliable estimate can be made of the amount of the obligation.
The amount recognised as a provision is the best estimate of the consideration required to settle the present obligation at the end of the reporting period, taking into account the risks and uncertainties surrounding the obligation. When a provision is measured using the cash flows estimated to settle the present obligation, its carrying amount is the present value of those cash flows.
When some or all of the economic benefits required to settle a provision are expected to be recovered from a third party, a receivable is recognised as an asset if it is virtually certain that reimbursement will be received and the amount of the receivable can be measured reliably.
Consolidated Statement of other Comprehensive Incomefor the year ended 31 December 2015
4.20 Provisions and contingent liabilities
Contingent liabilities, which include certain guarantees and letters of credit pledged as collateral security, are possible obligations that arise from past events whose existence will be confirmed only by the occurrence, or non-occurrence, of one or more uncertain future events not wholly within the Group’s control. Contingent liabilities are not recognised in the consolidated financial statements but are disclosed in the notes to the consolidated financial statements.
4.21 Acceptances
Acceptances are recognised as financial liabilities in the consolidated statement of financial position with a contractual right of reimbursement from the customer as a financial asset. Therefore, commitments with respect to acceptances have been accounted for as financial assets and financial liabilities.
4.22 Financial guarantees
Financial guarantees are contracts that require the Group to make specified payments to reimburse the holder for a loss it incurs because a specified party fails to meet its obligation when due in accordance with the contractual terms.
Financial guarantees are initially recognised at their fair value, which is the premium received on issuance. The received premium is amortised over the life of the financial guarantee. The guarantee liability (the notional amount) is subsequently recognised at the higher of this amortised amount and the present value of any expected payments (when a payment under guarantee has become probable).
4.23 Leasing
Leases are classified as finance leases whenever the terms of the lease transfer substantially all the risks and rewards of ownership to the lessee. All other leases are classified as operating leases.
The Group as lessor
Rental income from operating leases is recognised on a straight-line basis over the term of the relevant lease. Initial direct costs incurred in negotiating and arranging an operating lease are added to the carrying amount of the leased asset and recognised on a straight-line basis over the lease term.
The Group as lessee
Operating lease payments are recognised as an expense on a straight-line basis over the lease term, except where another systematic basis is more representative of the time pattern in which economic benefits from the leased asset are consumed. Contingent rentals arising under operating leases are recognised as an expense in the period in which they are incurred.
In the event that lease incentives are received to enter into operating leases, such incentives are recognised as a liability. The aggregate benefit of incentives is recognised as a reduction of rental expense on a straight-line basis, except where another systematic basis is more representative of the time pattern in which economic benefits from the leased asset are consumed.
4.24 Revenue and expense recognition
4.24.1 Interest income and expense
Interest income and interest expense are recognised in consolidated statement of profit or loss using the effective interest method. The effective interest rate is the rate that exactly discounts the estimated future cash payments and receipts through the expected life of the financial asset or liability (or, where appropriate, a shorter period) to the carrying amount of the financial asset or liability. When calculating the effective interest rate, the Group estimates the future cash flows considering all contractual terms of the financial instrument, but not future credit losses.

53
The calculation of the effective interest rate includes transactions costs, fees and points paid or received that are an integral part of the effective interest rate. Transaction costs include incremental costs that are directly attributable to the acquisition or issue of a financial asset or liability.
Interest income and expense presented in the consolidated statement of profit or loss include:
- Interest on financial assets and financial liabilities measured at amortised cost calculated on an effective interest basis.
- The effective portion of fair value changes in qualifying hedging derivatives designated in cash flow hedges of variability in interest cash flows, in the same period that the hedged cash flows affect interest income/expenses.
- The effective portion of fair value changes in qualifying hedging derivatives designated in filir value hedges of interest rate risk.
Interest income and expense on all trading assets and liabilities are considered to be incidental to the Group's trading operations and are presented together with all other changes in the fair value of trading assets and liabilities in net income from investments.
Fair value changes on the other derivatives held for risk management purposes, and other financial assets and financial liabilities carried at fair value through profit and loss (FVTPL) are presented in net trading income from foreign currencies and net income from investment securities in the consolidated statement of profit or loss.
4.24.2 Fees and commission income and expense
Fees and commission income and expense that are integral to the effective interest rate on a financial asset or liability are included in the measurement of the effective interest rate.
Other fees and commission income are generally recognised on an accrual basis when the related services are performed by the Group. When a loan commitment is not expected to result in the draw-down of a loan, commitment fees are recognised on a straight line basis over the commitment period.
Other fees and commission expenses are expensed as the related services are received.
4.24.3 Dividend income
Dividend income is recognised in the consolidated statement of profit or loss when the Group's right to receive such income is established. Usually this is the ex-dividend date for equity securities.
4.25 Foreign currency transactions
Transactions in foreign currencies are recorded in the functional currency at the rate of exchange prevailing on the date of the transaction. Monetary assets and liabilities denominated in foreign currencies are translated into the functional currency at the rate of exchange prevailing at the consolidated statement of financial position date. Non-monetary assets and liabilities that are measured at historical cost in a foreign currency are translated into the functional currency using rate of exchange at the date of initial transaction. Non-monetary assets and liabilities measured at fair value in a foreign currency are translated into the functional currency using the rate of exchange at the date the fair value was determined. Foreign currency differences are generally recognised in the statement of profit or loss.
For financial assets measured at FVTPL, the foreign exchange component is recognised in the consolidated statement of profit or loss. For financial assets measured at FVTOCI any foreign exchange component is recognised in other comprehensive income.
For foreign currency denominated debt instruments measured at amortised cost, the foreign exchange gains and losses are determined based on the amortised cost of the asset and are recognised in the consolidated statement of profit or loss.
Consolidated Statement of other Comprehensive Incomefor the year ended 31 December 2015

4.26 Foreign operations
In the consolidated financial statements, the assets, including related goodwill where applicable, and liabilities of branches, subsidiaries, joint ventures and associates whose functional currency is not AED, are translated into the Group’s presentation currency at the rate of exchange ruling at the consolidated statement of financial position date. The results of branches, subsidiaries, joint ventures and associates whose functional currency is not AED are translated into AED at the average rates of exchange for the reporting period. Exchange differences arising from the retranslation of opening foreign currency net investments, and exchange differences arising from retranslation of the result for the reporting period from the average rate to the exchange rate prevailing at the period end, are recognised in other comprehensive income and accumulated in equity in the ‘foreign exchange reserve’.
On disposal or partial disposal (i.e. of associates or jointly controlled entities not involving a change of accounting basis) of a foreign operation, exchange differences relating thereto and previously recognised in reserves are recognised in the consolidated statement of profit or loss on proportionate basis except in the case of partial disposal (i.e. no loss of control) of a subsidiary that includes a foreign operation, the proportionate share of accumulated exchange differences are re-attributed to non-controlling interests and are not recognised in consolidated statement of profit or loss.
Goodwill and fair value adjustments arising on the acquisition of a foreign operation are treated as assets and liabilities of the foreign operation and translated at the closing rate.
4.27 Non-current assets classified as held for sale
Non-current assets and disposal groups are classified as held for sale if their carrying amount will be recovered principally through a sale transaction rather than through continuing use. This condition is regarded as met only when the asset (or disposal group) is available for immediate sale in its present condition subject only to terms that are usual and customary for sales of such asset (or disposal group) and its sale is highly probable. Management must be committed to the sale which should be expected to qualify for recognition as a comparable sale within one year from the date of classification.
Non-current assets (or disposal groups) classified as held for sale are measured at the lower of their previous carrying amount and fair value less costs to sell.
4.28 Fiduciary activities
The Group acts as trustee/manager and in other capacities that result in holding or placing of assets in a fiduciary capacity on behalf of trusts or other institutions. Such assets and income arising thereon are not included in the Group’s consolidated financial statements as they are not assets of the Group.
4.29 Taxation
Provision is made for current and deferred taxes arising from operating results of overseas subsidiaries in accordance with the fiscal regulations of the respective countries in which the subsidiaries operate.
4.30 Current tax
The tax currently payable is based on taxable profit for the year. Taxable profit differs from profit as reported in the consolidated statement of profit or loss because of items of income or expense that are taxable or deductible in other years and items that are never taxable or deductible.

55
4.31 Deferred tax
Deferred tax is recognised on temporary differences between the carrying amounts of assets and liabilities in the consolidated financial statements and the corresponding tax bases used in the computation of taxable profit.
Deferred tax liabilities are generally recognised for all taxable temporary differences. Deferred tax assets are generally recognised for all deductible temporary differences to the extent that it is probable that taxable profits will be available against which those deductible temporary differences can be utilised. Such deferred tax assets and liabilities are not recognised if the temporary difference arises from goodwill or from the initial recognition (other than in a business combination) of other assets and liabilities in a transaction that affects neither the taxable profit nor the accounting profit.
Deferred tax liabilities are recognised for taxable temporary differences associated with investments in subsidiaries and associates, and interests in joint ventures, except where the Group is able to control the reversal of the temporary difference and it is probable that the temporary difference will not reverse in the foreseeable future. Deferred tax assets arising from deductible temporary differences associated with such investments and interests are only recognised to the extent that it is probable that there will be sufficient taxable profits against which to utilise the benefits of the temporary differences and they are expected to reverse in the foreseeable future.
The carrying amount of deferred tax assets is reviewed at the end of each reporting period and reduced to the extent that it is no longer probable that sufficient taxable profits will be available to allow all or part of the asset to be recovered.
5 - Critical accounting judgments and key sources of estimation of uncertaintyWhile applying the accounting policies as stated in Note 4, the management of the Group has made certain judgments, estimates and assumptions that are not readily apparent from other sources. The estimates and associated assumptions are based on historical experience and other factors that are considered to be relevant. Actual results may differ from these estimates.
The estimates and underlying assumptions are reviewed on an ongoing basis. Revisions to accounting estimates are recognised in the period of the revision in which the estimate is revised if the revision affects only that period, or in the period of the revision and future periods if the revision affects both current and future periods.
Significant areas where management has used estimates, assumptions or exercised judgments are as follows:
5.1 Critical accounting judgments
i. Impairment of financial assets measured at amortised cost and loans and advances
The Group’s accounting policy for allowances in relation to impaired financial assets carried at amortised cost is described in Note 4. Impairment is calculated on the basis of discounted estimated future cash flows or by applying a statistical modelling on the performing unclassified loans and advances book based on market trend and historical pattern of defaults. For retail loans and advances impairment is calculated based on a formulaic approach depending on past due instalments and payments.
The allowance for loans and advances losses is established through charges to income in the form of an allowance. Increases and decreases in the allowance due to changes in the measurement of the impaired loans and advances are included in the allowance for loans and advances losses and affect the consolidated statement of profit or loss accordingly.
Loans and advances
The impairment allowance for loan losses is established through charges to the consolidated statement of profit or loss in the form of an impairment allowance for doubtful loans and advances.
Consolidated Statement of other Comprehensive Incomefor the year ended 31 December 2015

5.1 Critical accounting judgments
Individually assessed loans
Impairment losses for individually assessed loans are determined by an evaluation of exposure on a case-by-case basis. This procedure is applied to all classified corporate loans and advances which are individually significant accounts or are not subject to the portfolio-based-approach.
The following factors are considered by management when determining the allowance for impairment on individual loans and advances which are significant:
• The amount expected to be realised on disposal of collateral.
• The Group’s ability to enforce its claim on the collateral and the associated cost of litigation.
• The expected time frame to complete legal formalities and disposal of collateral.
The Group’s policy requires quarterly review of the level of impairment allowances on individual facilities and regular valuation of the collateral and its enforceability.
Impaired loans continue to be classified as impaired unless they are brought fully current and the collection of scheduled interest and principal is considered probable.
Collectively assessed loans
Collective assessment of allowance for impairment is made for overdue retail loans with common features which are not individually significant and performing loans which are not found to be individually impaired.
The following factors are considered by management when determining allowance for impairment for such loans:
Retail loans - All the loans falling under similar overdue category are assumed to carry similar credit risk and allowance for impairment is taken on a gross basis.
Other performing loans - The management of the Group assesses, based on historical experience and the prevailing economic and credit conditions, the magnitude of loans which may be impaired but not identified as of the end of the reporting period.
ii. Classification of properties
In the process of classifying properties, the management has made various judgments. Judgment is needed to determine whether a property qualifies as an investment property, property and equipment, and/or property held for resale. The Group develops criteria so that it can exercise that judgment consistently in accordance with the definitions of investment property, property and equipment, and property held for resale. In making its judgment, management considered the detailed criteria and related guidance for the classification of properties as set out in IAS 2, IAS 16 and IAS 40, in particular, the intended usage of property as determined by the management.
iii. Fair value of investment properties and investment properties under development
The best evidence of fair value is current prices in an active market for similar lease and other contracts. In the absence of such information, the Group determined the amount within a range of reasonable fair value estimates. In making its judgment, the Group considered recent prices of similar properties in the same location and similar conditions, with adjustments to reflect any changes in the nature, location or economic conditions since the date of the transactions that occurred at those prices. Such estimation is based on certain assumptions, which are subject to uncertainty and might materially differ from the actual results.
The determination of the fair value of revenue-generating properties requires the use of estimates such as future cash flows from assets (such as leasing, tenants’ profiles, future revenue streams, capital values of fixtures and fittings, and the overall repair and condition of the property) and discount rates applicable to those assets. In addition, development risks (such as construction and leasing risks) are also taken into consideration when determining the fair value of investment properties under development. These estimates are based on local market conditions existing at the end of the reporting period.
57
iv. Useful lives of property and equipment and intangible assets
Management reviews the residual values and estimated useful lives of property and equipment and intangible assets at the end of each annual reporting period in accordance with IAS 16 and IAS 38. Management determined that current year expectations do not differ from previous estimates based on its review.
5.2 Key sources of estimation of uncertainty
The key assumptions concerning the future, and other key sources of estimation of uncertainty at the end of the reporting period, that have a significant risk of causing a material adjustment to the carrying amounts of assets and liabilities within the next financial year, are discussed below:
i. Valuation of unquoted equity investments
The valuation of unquoted equity investments is normally based on recent market transactions done on an arm’s length basis, or the fair value of another instrument that is substantially the same, or the expected cash flows discounted at current rates for similar instruments, or on other valuation models. The inputs to these models are derived from observable market data where possible, but where observable market data are not available, judgment is required to establish fair values. Management believes that the chosen valuation techniques and assumptions used are appropriate in determining the fair value of the unquoted equity investments.
ii. Derivative financial instruments
Subsequent to initial recognition, the fair values of derivative financial instruments measured at fair value are generally obtained by reference to quoted market prices, discounted cash flow models and recognised pricing models as appropriate. When independent prices are not available, fair values are determined by using valuation techniques which refer to observable market data. These include comparison with similar instruments where market observable prices exist, discounted cash flow analysis, option pricing models, and other valuation techniques commonly used by market participants. The main factors which management considers when applying a model are:
a) The likelihood and expected timing of future cash flows on the instrument. These cash flows are usually governed by the terms of the instrument, although management’s judgment may be required in situations where the ability of the counterparty to service the instrument in accordance with the contractual terms is in doubt.
b) An appropriate discount rate for the instrument. Management determines this rate, based on its assessment of the appropriate spread of the rate for the instrument over the risk-free rate. When valuing instruments by reference to comparable instruments, management takes into account the maturity, structure, and rating of the instrument with which the position held is being compared. When valuing instruments on a model basis using the fair value of underlying components, management considers, in addition, the need for adjustments to take account of a number of factors such as bid-offer spread, credit profile, servicing costs of portfolios and model uncertainty.
iii. Valuation of investment properties
The Group values its investment properties at fair value on the basis of market valuations prepared by an independent chartered surveyor and property consultant. The fair values were derived by using appropriate valuation methods. The valuations are based on assumptions such as comparison with sale price of land for comparable developments, plot sizes and the recent value of any expected timing of payments and receipts in short-term to long-term, which are mainly on market conditions existing at the reporting date. Therefore, any future change in the market conditions could change significantly the fair value of these properties.
Consolidated Statement of other Comprehensive Incomefor the year ended 31 December 2015
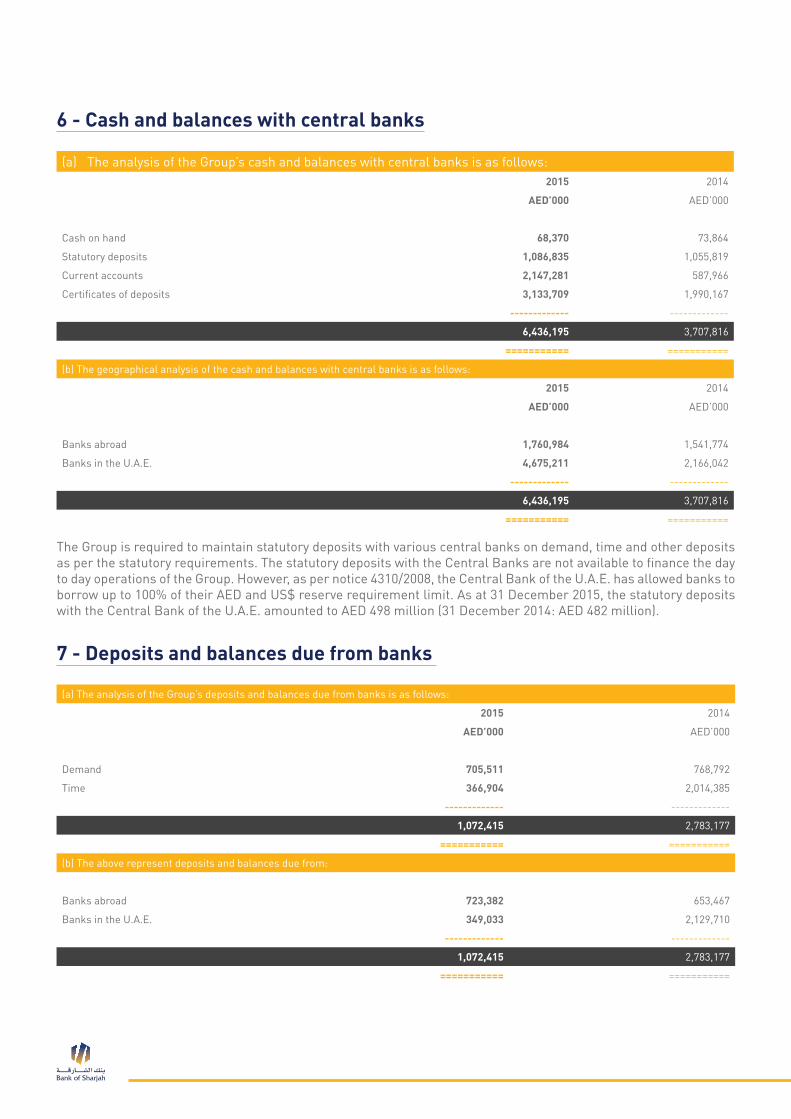
6 - Cash and balances with central banks
7 - Deposits and balances due from banks
(a) The analysis of the Group’s cash and balances with central banks is as follows:2015 2014
AED’000 AED’000
Cash on hand 68,370 73,864
Statutory deposits 1,086,835 1,055,819
Current accounts 2,147,281 587,966
Certificates of deposits 3,133,709 1,990,167
------------- -------------
6,436,195 3,707,816
=========== ===========
(b) The geographical analysis of the cash and balances with central banks is as follows:
2015 2014
AED’000 AED’000
Banks abroad 1,760,984 1,541,774
Banks in the U.A.E. 4,675,211 2,166,042
------------- -------------
6,436,195 3,707,816
=========== ===========
(a) The analysis of the Group’s deposits and balances due from banks is as follows:
2015 2014
AED’000 AED’000
Demand 705,511 768,792
Time 366,904 2,014,385
------------- -------------
1,072,415 2,783,177
=========== ===========
(b) The above represent deposits and balances due from:
Banks abroad 723,382 653,467
Banks in the U.A.E. 349,033 2,129,710
------------- -------------
1,072,415 2,783,177
=========== ===========
The Group is required to maintain statutory deposits with various central banks on demand, time and other deposits as per the statutory requirements. The statutory deposits with the Central Banks are not available to finance the day to day operations of the Group. However, as per notice 4310/2008, the Central Bank of the U.A.E. has allowed banks to borrow up to 100% of their AED and US$ reserve requirement limit. As at 31 December 2015, the statutory deposits with the Central Bank of the U.A.E. amounted to AED 498 million (31 December 2014: AED 482 million).

59
8 - Loans and advances, net
Additions / (reversals) through credit extension premium represent the fees charged/refunded to clients upon sanctioning / renewing any facilities on the limit and allocated directly to collective impairment provision.
(a) The analysis of the Group’s loans and advances measured at amortised cost is as follows:
2015 2014
AED’000 AED’000
Overdrafts 8,916,160 8,639,606
Commercial loans 6,131,020 5,480,731
Bills receivable 789,213 714,902
Other advances 995,513 880,244
------------- -------------
Gross amount of loans and advances 16,831,906 15,715,483
Less: Allowance for impairment (1,524,442) (1,347,377)
Less: Interest in suspense (270,843) (288,004)
------------- -------------
Net Loans and Advances 15,036,621 14,080,102
=========== ===========
(b) The geographic analysis of the loans and advances of the Group is as follows:
2015 2014
AED’000 AED’000
Loans and advances in the U.A.E. 14,222,200 13,275,107
Loans and advances abroad 2,609,706 2,440,376
------------- -------------
16,831,906 15,715,483
=========== ===========
(c) Loans and advances are stated net of allowance for impairment. The movement in the allowance during the year was as follows:
2015 2014
AED’000 AED’000
At 1 January 1,347,377 1,011,629
Additions through credit extension premium 1,510 96,264
Additions (Note 33) 386,490 260,726
Write-off (138,736) (6,641)
Write-backs (72,199) (14,601)
------------- -------------
Balance at the end of the Year 1,524,442 1,347,377
=========== ===========
Consolidated Statement of other Comprehensive Incomefor the year ended 31 December 2015
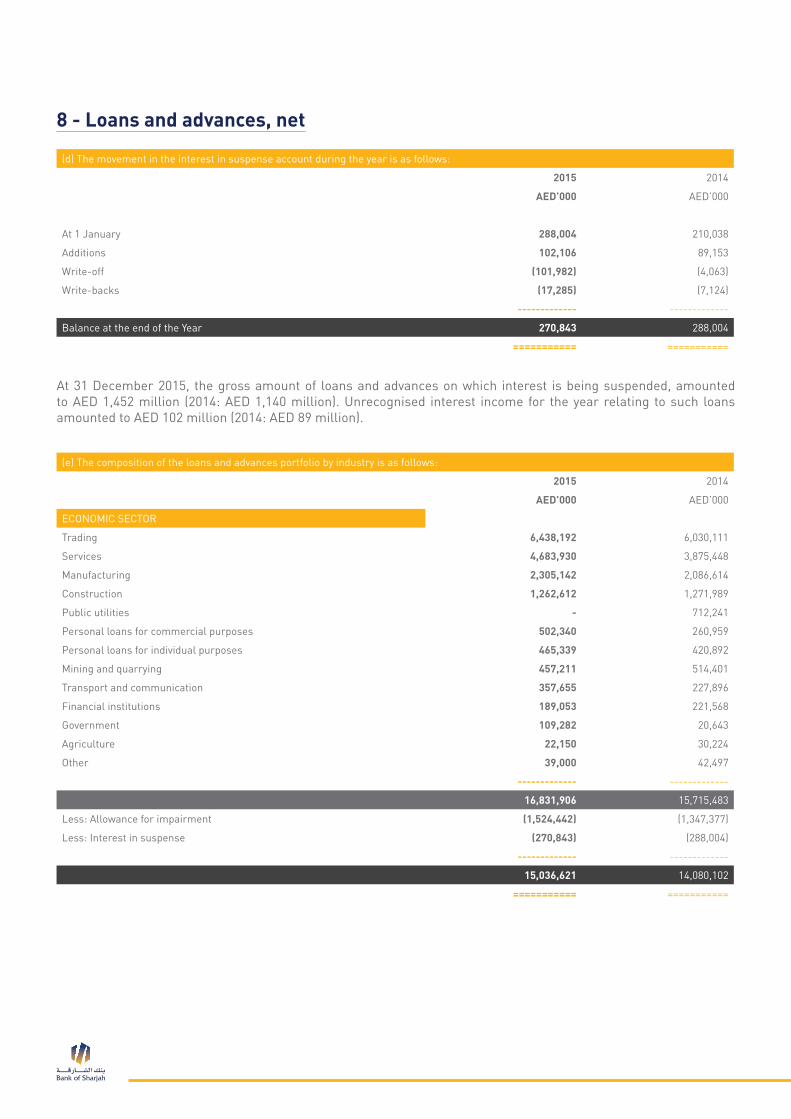
(d) The movement in the interest in suspense account during the year is as follows:
2015 2014
AED’000 AED’000
At 1 January 288,004 210,038
Additions 102,106 89,153
Write-off (101,982) (4,063)
Write-backs (17,285) (7,124)
------------- -------------
Balance at the end of the Year 270,843 288,004
=========== ===========
At 31 December 2015, the gross amount of loans and advances on which interest is being suspended, amounted to AED 1,452 million (2014: AED 1,140 million). Unrecognised interest income for the year relating to such loans amounted to AED 102 million (2014: AED 89 million).
(e) The composition of the loans and advances portfolio by industry is as follows:
2015 2014
AED’000 AED’000
ECONOMIC SECTOR
Trading 6,438,192 6,030,111
Services 4,683,930 3,875,448
Manufacturing 2,305,142 2,086,614
Construction 1,262,612 1,271,989
Public utilities - 712,241
Personal loans for commercial purposes 502,340 260,959
Personal loans for individual purposes 465,339 420,892
Mining and quarrying 457,211 514,401
Transport and communication 357,655 227,896
Financial institutions 189,053 221,568
Government 109,282 20,643
Agriculture 22,150 30,224
Other 39,000 42,497
------------- -------------
16,831,906 15,715,483
Less: Allowance for impairment (1,524,442) (1,347,377)
Less: Interest in suspense (270,843) (288,004)
------------- -------------
15,036,621 14,080,102
=========== ===========
8 - Loans and advances, net
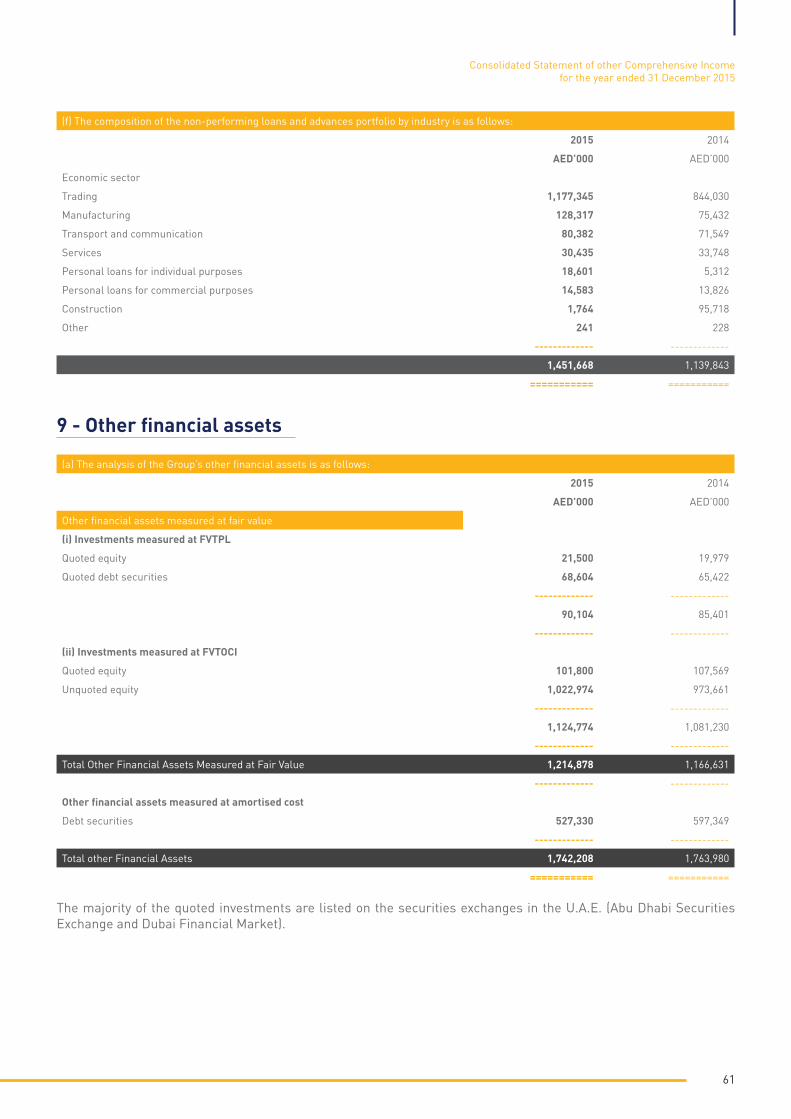
61
(f) The composition of the non-performing loans and advances portfolio by industry is as follows:
2015 2014
AED’000 AED’000
Economic sector
Trading 1,177,345 844,030
Manufacturing 128,317 75,432
Transport and communication 80,382 71,549
Services 30,435 33,748
Personal loans for individual purposes 18,601 5,312
Personal loans for commercial purposes 14,583 13,826
Construction 1,764 95,718
Other 241 228
------------- -------------
1,451,668 1,139,843
=========== ===========
9 - Other financial assets
(a) The analysis of the Group’s other financial assets is as follows:
2015 2014
AED’000 AED’000
Other financial assets measured at fair value
(i) Investments measured at FVTPL
Quoted equity 21,500 19,979
Quoted debt securities 68,604 65,422
------------- -------------
90,104 85,401
------------- -------------
(ii) Investments measured at FVTOCI
Quoted equity 101,800 107,569
Unquoted equity 1,022,974 973,661
------------- -------------
1,124,774 1,081,230
------------- -------------
Total Other Financial Assets Measured at Fair Value 1,214,878 1,166,631
------------- -------------
Other financial assets measured at amortised cost
Debt securities 527,330 597,349
------------- -------------
Total other Financial Assets 1,742,208 1,763,980
=========== ===========
The majority of the quoted investments are listed on the securities exchanges in the U.A.E. (Abu Dhabi Securities Exchange and Dubai Financial Market).
Consolidated Statement of other Comprehensive Incomefor the year ended 31 December 2015
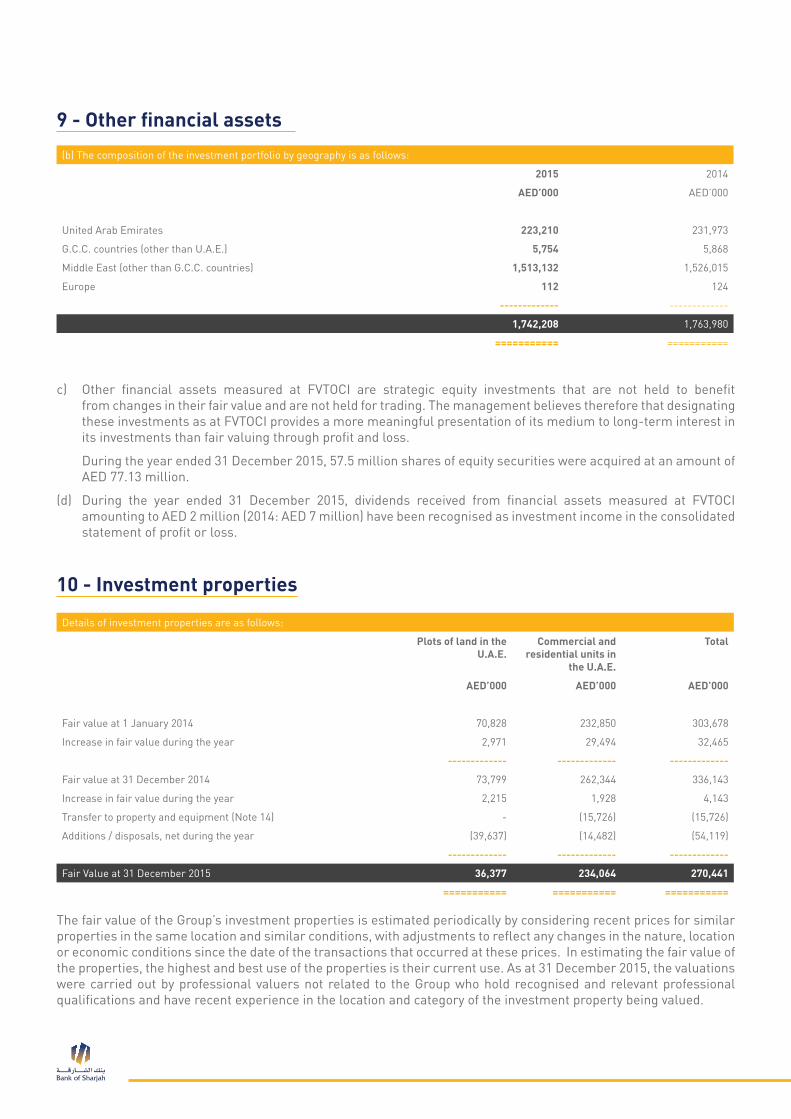
(b) The composition of the investment portfolio by geography is as follows:
2015 2014
AED’000 AED’000
United Arab Emirates 223,210 231,973
G.C.C. countries (other than U.A.E.) 5,754 5,868
Middle East (other than G.C.C. countries) 1,513,132 1,526,015
Europe 112 124
------------- -------------
1,742,208 1,763,980
=========== ===========
c) Other financial assets measured at FVTOCI are strategic equity investments that are not held to benefit from changes in their fair value and are not held for trading. The management believes therefore that designating these investments as at FVTOCI provides a more meaningful presentation of its medium to long-term interest in its investments than fair valuing through profit and loss.
During the year ended 31 December 2015, 57.5 million shares of equity securities were acquired at an amount of AED 77.13 million.
(d) During the year ended 31 December 2015, dividends received from financial assets measured at FVTOCI amounting to AED 2 million (2014: AED 7 million) have been recognised as investment income in the consolidated statement of profit or loss.
10 - Investment properties
Details of investment properties are as follows:
Plots of land in the U.A.E.
Commercial and residential units in
the U.A.E.
Total
AED’000 AED’000 AED’000
Fair value at 1 January 2014 70,828 232,850 303,678
Increase in fair value during the year 2,971 29,494 32,465
------------- ------------- -------------
Fair value at 31 December 2014 73,799 262,344 336,143
Increase in fair value during the year 2,215 1,928 4,143
Transfer to property and equipment (Note 14) - (15,726) (15,726)
Additions / disposals, net during the year (39,637) (14,482) (54,119)
------------- ------------- -------------
Fair Value at 31 December 2015 36,377 234,064 270,441
=========== =========== ===========
The fair value of the Group’s investment properties is estimated periodically by considering recent prices for similar properties in the same location and similar conditions, with adjustments to reflect any changes in the nature, location or economic conditions since the date of the transactions that occurred at these prices. In estimating the fair value of the properties, the highest and best use of the properties is their current use. As at 31 December 2015, the valuations were carried out by professional valuers not related to the Group who hold recognised and relevant professional qualifications and have recent experience in the location and category of the investment property being valued.
9 - Other financial assets

63
11 - Goodwill and other intangibles
The recoverable amount of the assets acquired in the business combination (cash generating unit) described above is determined based on fair value less cost of disposal which is determined to be higher than the asset’s carrying value using the market approach.
The geographic analysis of the investment properties of the Group is as follows:
2015 2014
AED’000 AED’000
Commercial and residential units in the U.A.E. 234,064 262,344
Plots of lands in the U.A.E. 36,377 73,799
------------- -------------
Total 270,441 336,143
=========== ===========
(a) The analysis of the Group’s goodwill and other intangibles is as follows:
Goodwill represents the excess of the cost of acquisition over the fair value of the Group’s share in the net identifiable assets, liabilities and contingent liabilities of a Lebanese branch of a multinational bank acquired in 2008.
2015 2014
AED’000 AED’000
Goodwill 184,733 184,733
------------- -------------
OTHER INTANGIBLES
Banking license 18,365 18,365
Legal corporate setup in Lebanon 17,181 21,475
Customer base 12,489 15,611
Branch network 1,466 1,834
------------- -------------
49,501 57,285
------------- -------------
Total 234,234 242,018
=========== ===========
(b) The movement on other intangible assets during the year is as follows:
Bankinglicense
Legal corporate setup in Lebanon
Customer base
Branchnetwork Total
OTHER INTANGIBLES AED’000 AED’000 AED’000 AED’000 AED’000
Balance as at 1 January 2014 18,365 25,769 18,733 2,202 65,069
Amortisation in 2014 - (4,294) (3,122) (368) (7,784)
------------- ------------- ------------- ------------- -------------
Balance as at 31 December 2014 18,365 21,475 15,611 1,834 57,285
Amortisation in 2015 - (4,294) (3,122) (368) (7,784)
------------- ------------- ------------- ------------- -------------
Balance as at 31 December 2015 18,365 17,181 12,489 1,466 49,501
=========== =========== =========== =========== ===========
Consolidated Statement of other Comprehensive Incomefor the year ended 31 December 2015
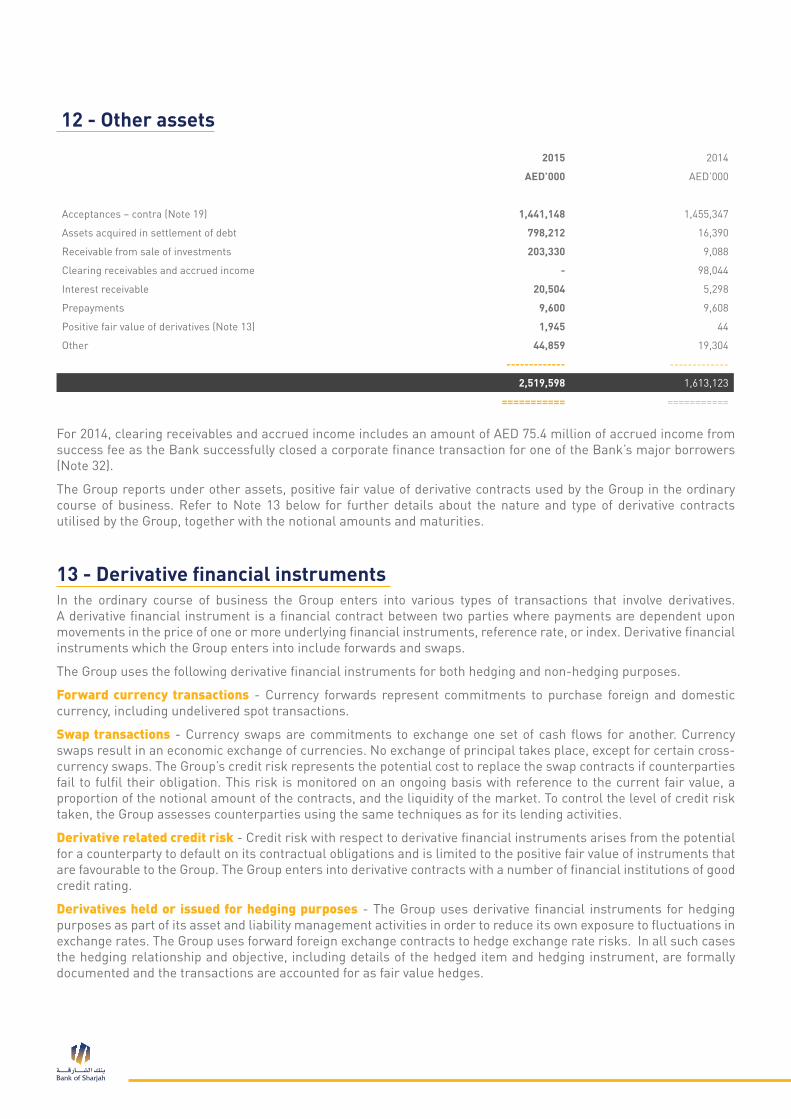
12 - Other assets
2015 2014
AED’000 AED’000
Acceptances – contra (Note 19) 1,441,148 1,455,347
Assets acquired in settlement of debt 798,212 16,390
Receivable from sale of investments 203,330 9,088
Clearing receivables and accrued income - 98,044
Interest receivable 20,504 5,298
Prepayments 9,600 9,608
Positive fair value of derivatives (Note 13) 1,945 44
Other 44,859 19,304
------------- -------------
2,519,598 1,613,123
=========== ===========
For 2014, clearing receivables and accrued income includes an amount of AED 75.4 million of accrued income from success fee as the Bank successfully closed a corporate finance transaction for one of the Bank’s major borrowers (Note 32).
The Group reports under other assets, positive fair value of derivative contracts used by the Group in the ordinary course of business. Refer to Note 13 below for further details about the nature and type of derivative contracts utilised by the Group, together with the notional amounts and maturities.
13 - Derivative financial instruments In the ordinary course of business the Group enters into various types of transactions that involve derivatives. A derivative financial instrument is a financial contract between two parties where payments are dependent upon movements in the price of one or more underlying financial instruments, reference rate, or index. Derivative financial instruments which the Group enters into include forwards and swaps.
The Group uses the following derivative financial instruments for both hedging and non-hedging purposes.
Forward currency transactions - Currency forwards represent commitments to purchase foreign and domestic currency, including undelivered spot transactions.
Swap transactions - Currency swaps are commitments to exchange one set of cash flows for another. Currency swaps result in an economic exchange of currencies. No exchange of principal takes place, except for certain cross-currency swaps. The Group’s credit risk represents the potential cost to replace the swap contracts if counterparties fail to fulfil their obligation. This risk is monitored on an ongoing basis with reference to the current fair value, a proportion of the notional amount of the contracts, and the liquidity of the market. To control the level of credit risk taken, the Group assesses counterparties using the same techniques as for its lending activities.
Derivative related credit risk - Credit risk with respect to derivative financial instruments arises from the potential for a counterparty to default on its contractual obligations and is limited to the positive fair value of instruments that are favourable to the Group. The Group enters into derivative contracts with a number of financial institutions of good credit rating.
Derivatives held or issued for hedging purposes - The Group uses derivative financial instruments for hedging purposes as part of its asset and liability management activities in order to reduce its own exposure to fluctuations in exchange rates. The Group uses forward foreign exchange contracts to hedge exchange rate risks. In all such cases the hedging relationship and objective, including details of the hedged item and hedging instrument, are formally documented and the transactions are accounted for as fair value hedges.

65
The following table shows the positive and negative fair values of derivative financial instruments, together with the notional amounts analysed by the term to maturity, and the nature of the risk being hedged.
The notional amounts, which provide an indication of the volumes of the transactions outstanding at the year end, do not necessarily reflect the amounts of future cash flows involved. These notional amounts, therefore, are neither indicative of the Group’s exposure to credit risk, which is generally limited to the fair value of the derivatives, nor market risk.
NOTIONAL AMOUNTS BY TERM TO MATURITY
Positive fair value
Negative fair value
Notional amount
Within 3 months
3-12months 1-5 years
AED’000 AED’000 AED’000 AED’000 AED’000 AED’000
2015
Interest rate swap - (511) 1,836,500 - - 1,836,500
Currency swaps - (312) 463,496 463,496 - -
Forward foreign exchange contracts 1,945 - 130,709 64,041 66,668 -
------------- ------------- ------------- ------------- ------------- -------------
Total 1,945 (823) 2,430,705 527,537 66,668 1,836,500
=========== =========== =========== =========== =========== ===========
2014
Currency swaps - - 220,380 220,380 - -
Forward foreign exchange contracts 44 3 84,900 69,650 15,250 -
------------- ------------- ------------- ------------- ------------- -------------
Total 44 3 305,280 290,030 15,250 -
=========== =========== =========== =========== =========== ===========
Consolidated Statement of other Comprehensive Incomefor the year ended 31 December 2015
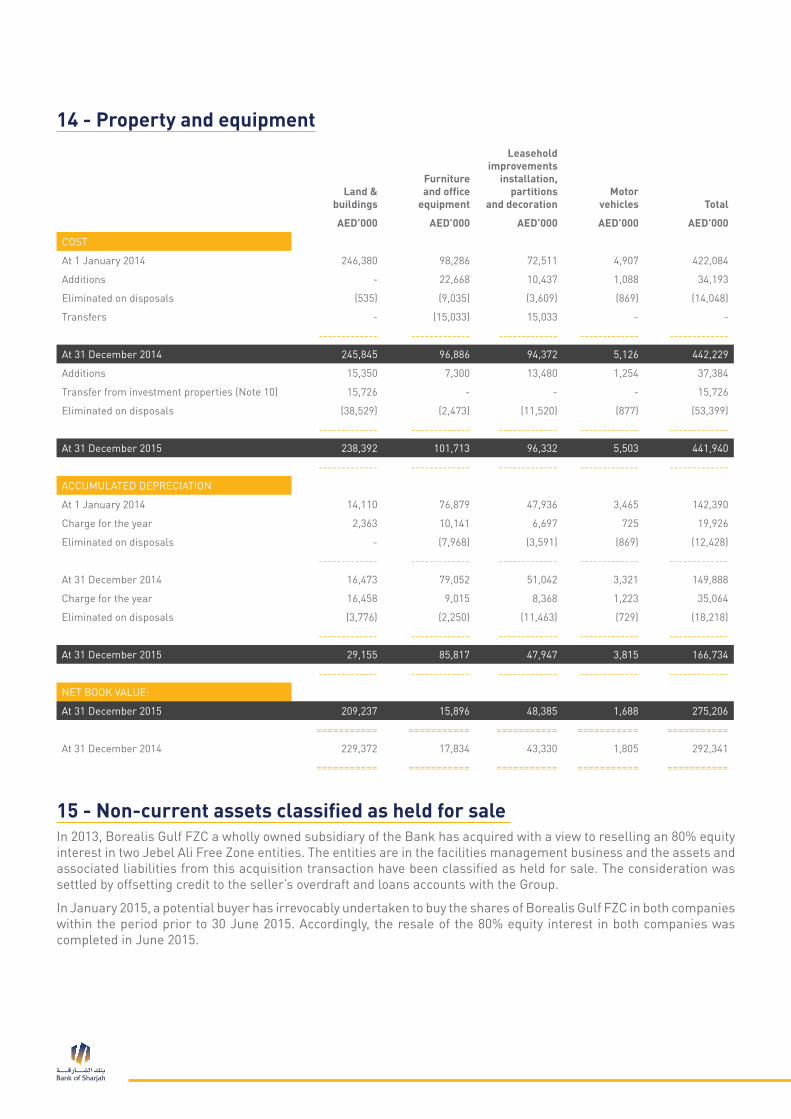
Land &buildings
Furnitureand office
equipment
Leaseholdimprovements
installation,partitions
and decorationMotor
vehicles Total
AED’000 AED’000 AED’000 AED’000 AED’000
COST
At 1 January 2014 246,380 98,286 72,511 4,907 422,084
Additions - 22,668 10,437 1,088 34,193
Eliminated on disposals (535) (9,035) (3,609) (869) (14,048)
Transfers - (15,033) 15,033 - -
------------- ------------- ------------- ------------- -------------
At 31 December 2014 245,845 96,886 94,372 5,126 442,229
Additions 15,350 7,300 13,480 1,254 37,384
Transfer from investment properties (Note 10) 15,726 - - - 15,726
Eliminated on disposals (38,529) (2,473) (11,520) (877) (53,399)
------------- ------------- ------------- ------------- -------------
At 31 December 2015 238,392 101,713 96,332 5,503 441,940
------------- ------------- ------------- ------------- -------------
ACCUMULATED DEPRECIATION
At 1 January 2014 14,110 76,879 47,936 3,465 142,390
Charge for the year 2,363 10,141 6,697 725 19,926
Eliminated on disposals - (7,968) (3,591) (869) (12,428)
------------- ------------- ------------- ------------- -------------
At 31 December 2014 16,473 79,052 51,042 3,321 149,888
Charge for the year 16,458 9,015 8,368 1,223 35,064
Eliminated on disposals (3,776) (2,250) (11,463) (729) (18,218)
------------- ------------- ------------- ------------- -------------
At 31 December 2015 29,155 85,817 47,947 3,815 166,734
------------- ------------- ------------- ------------- -------------
NET BOOK VALUE:
At 31 December 2015 209,237 15,896 48,385 1,688 275,206
=========== =========== =========== =========== ===========
At 31 December 2014 229,372 17,834 43,330 1,805 292,341
=========== =========== =========== =========== ===========
14 - Property and equipment
15 - Non-current assets classified as held for sale In 2013, Borealis Gulf FZC a wholly owned subsidiary of the Bank has acquired with a view to reselling an 80% equity interest in two Jebel Ali Free Zone entities. The entities are in the facilities management business and the assets and associated liabilities from this acquisition transaction have been classified as held for sale. The consideration was settled by offsetting credit to the seller’s overdraft and loans accounts with the Group.
In January 2015, a potential buyer has irrevocably undertaken to buy the shares of Borealis Gulf FZC in both companies within the period prior to 30 June 2015. Accordingly, the resale of the 80% equity interest in both companies was completed in June 2015.
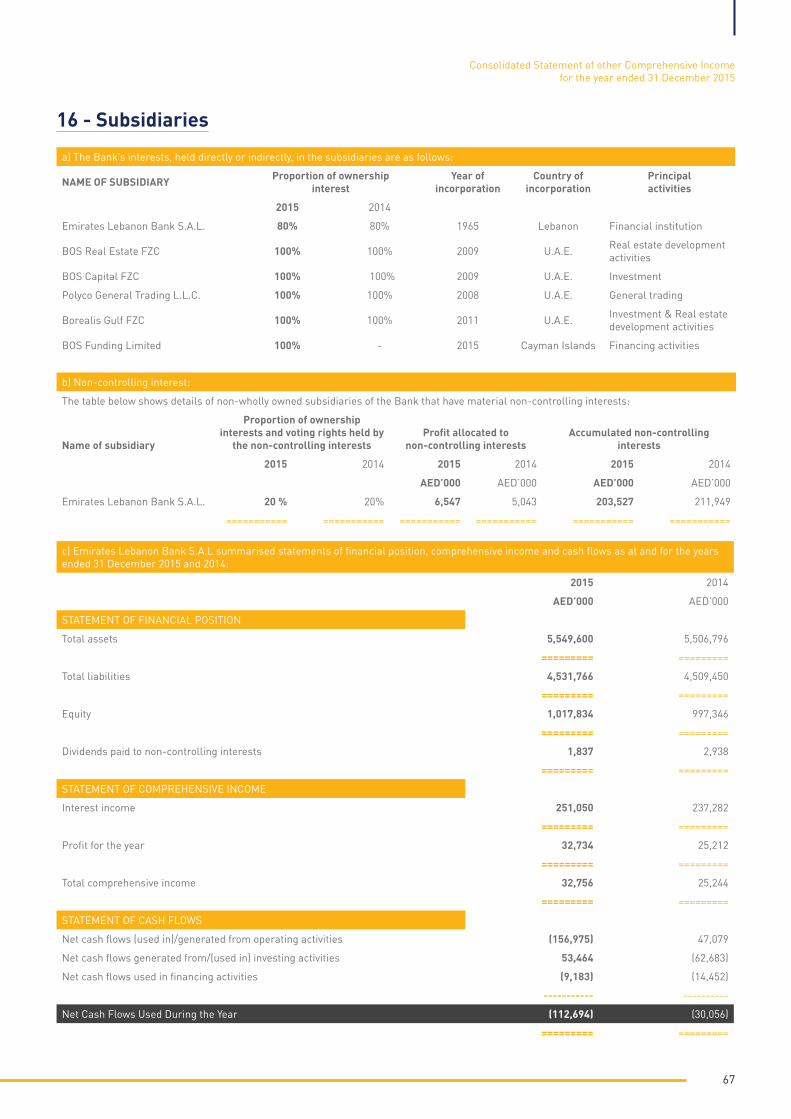
67
16 - Subsidiaries
a) The Bank’s interests, held directly or indirectly, in the subsidiaries are as follows:
NAME OF SUBSIDIARY Proportion of ownershipinterest
Year ofincorporation
Country ofincorporation
Principalactivities
2015 2014
Emirates Lebanon Bank S.A.L. 80% 80% 1965 Lebanon Financial institution
BOS Real Estate FZC 100% 100% 2009 U.A.E. Real estate development activities
BOS Capital FZC 100% 100% 2009 U.A.E. Investment
Polyco General Trading L.L.C. 100% 100% 2008 U.A.E. General trading
Borealis Gulf FZC 100% 100% 2011 U.A.E. Investment & Real estate development activities
BOS Funding Limited 100% - 2015 Cayman Islands Financing activities
b) Non-controlling interest:
The table below shows details of non-wholly owned subsidiaries of the Bank that have material non-controlling interests:
Name of subsidiary
Proportion of ownershipinterests and voting rights held by
the non-controlling interestsProfit allocated to
non-controlling interestsAccumulated non-controlling
interests
2015 2014 2015 2014 2015 2014
AED’000 AED’000 AED’000 AED’000
Emirates Lebanon Bank S.A.L. 20 % 20% 6,547 5,043 203,527 211,949
=========== =========== =========== =========== =========== ===========
c) Emirates Lebanon Bank S.A.L summarised statements of financial position, comprehensive income and cash flows as at and for the years ended 31 December 2015 and 2014:
2015 2014
AED’000 AED’000
STATEMENT OF FINANCIAL POSITION
Total assets 5,549,600 5,506,796
========= =========
Total liabilities 4,531,766 4,509,450
========= =========
Equity 1,017,834 997,346
========= =========
Dividends paid to non-controlling interests 1,837 2,938
========= =========
STATEMENT OF COMPREHENSIVE INCOME
Interest income 251,050 237,282
========= =========
Profit for the year 32,734 25,212
========= =========
Total comprehensive income 32,756 25,244
========= =========
STATEMENT OF CASH FLOWS
Net cash flows (used in)/generated from operating activities (156,975) 47,079
Net cash flows generated from/(used in) investing activities 53,464 (62,683)
Net cash flows used in financing activities (9,183) (14,452)
----------- ----------
Net Cash Flows Used During the Year (112,694) (30,056)
========= =========
Consolidated Statement of other Comprehensive Incomefor the year ended 31 December 2015

17 - Customers' deposits
18 - Deposits and balances due to banks
19 - Other liabilities
The analysis of customers’ deposits is as follows:
2015 2014
AED’000 AED’000
Current and other accounts 4,008,397 4,242,438
Saving accounts 1,634,738 1,586,748
Time deposits 13,848,680 11,971,696
------------- -------------
19,491,815 17,800,882
=========== ===========
The analysis of deposits and balances due to banks is as follows:
2015 2014
AED’000 AED’000
Demand 839 42,584
Time 44,640 363,019
------------- -------------
45,479 405,603
=========== ===========
Due to banks represent due to:
2015 2014
AED’000 AED’000
Banks in the U.A.E. - 110,848
Banks abroad 45,479 294,755
------------- -------------
45,479 405,603
=========== ===========
2015 2014
AED’000 AED’000
Acceptances – contra (Note 12) 1,441,148 1,455,347
Provision for employees’ end of service benefits 39,374 33,025
Interest payable 84,858 75,791
Unearned income 22,362 21,017
Managers’ cheques 24,174 17,598
Accrued expenses and others 76,943 74,690
Negative fair value of derivatives (Note 13) 823 3
------------- -------------
1,689,682 1,677,471
=========== ===========

69
20 - Syndicated loanOn 8 July 2013, the Bank signed a USD 200 million (AED 735 million) syndicated term loan facility. The purpose of the facility is to finance general corporate activities. The facility has a tenor of two years and is payable at maturity. The facility carries an interest rate of LIBOR plus a margin of 125 basis points which is payable on a quarterly basis. The drawdown on the facility was on 18 August 2013. The syndicated loan was fully settled on 22 June 2015 prior to maturity date.
21 - Issued bondsOn 8 June 2015, the Bank raised financing by way of USD 500 million (equivalent to AED 1,836 million) in senior unsecured bonds (the “Bonds”) issued by BOS Funding Limited, a wholly owned subsidiary of the Bank, incorporated in the Cayman Islands. The Bonds are fully guaranteed by the Bank, carry a fixed interest rate of 3.374 per cent per annum payable semi-annually and are listed on the Irish Stock Exchange.
The Group estimates changes in fair value due to credit risk by estimating the amount of change in fair value that is not due to changes in market conditions that give rise to market risk.
The movement in the provision for employees’ end of service benefits is as follows:
2015 2014
AED’000 AED’000
At 1 January 33,025 53,845
Charged during the year 7,203 9,905
Payments during the year (854) (30,725)
------------- -------------
At 31 December 39,374 33,025
=========== ===========
The fair value and the change in that fair value that can be ascribed to changes in underlying credit risk are set out below:
31 December 2015
AED’000
Fair value of issued bond
1,737,498
Changes in fair value of issued bond not attributable to changes in market conditions
(92,003)
Difference between carrying amount and amount contractually required to be paid at maturity 99,003
Consolidated Statement of other Comprehensive Incomefor the year ended 31 December 2015

22 - Issued and paid up capital and reserves
(a) Issued and paid up capital and treasury shares
2015 2014
Number of shares AED’000 Number of Shares AED’000
Issued capital 2,100,000,000 2,100,000 2,100,000,000 2,100,000
Shares held in treasury - - (99,526,834) (196,726)
------------- ------------- ------------- -------------
2,100,000,000 2,100,000 2,000,473,166 1,903,274
=========== =========== =========== ===========
During 2015, 99.5 million shares were released from the treasury shares as share distribution and as such the number of shares held as treasury shares as at 31 December 2015 is nil (31 December 2014: 99.5 million shares with market value of those shares amounting to AED 194 million).
During 2014, 60 million shares were released from the treasury shares as share dividend and in December 2014, the Bank sold out 5,473,166 shares of the treasury shares. As at 31 December 2014, the treasury shares balance stood at 99,526,834 shares (31 December 2013: 165 million shares) with a carrying value of AED 197 million (31 December 2013: AED 328 million). As such, the number of shares outstanding as at 31 December 2014 is 2 billion shares (31 December 2013: 1.935 billion shares). The market value of the treasury shares as at 31 December 2014 is AED 194 million (31 December 2013: AED 295 million).
(b) Statutory reserve
In accordance with Article 239 of the UAE companies’ law of 2015, 10% of the profit for the year is to be transferred to statutory reserve. Such transfers to reserves may cease when they reach the levels established by the respective regulatory authorities (in the U.A.E. this level is 50% of the issued and paid up share capital).
(c) Contingency reserve
In accordance with the Articles of Association of the Bank a contingency reserve is calculated at 10% of the profit for the year to be transferred to a contingency reserve until this reserve becomes 50% of the issued and paid up share capital.
d) General reserve
Transfers to general reserve are made based on the discretion of the Board of Directors and is subject to the approval of the shareholders at the annual general meeting.

71
23 - Earnings per share
The weighted average number of shares outstanding during 2015 and 2014 has been revised to include the impact of releasing 99.5 million shares and 60 million shares respectively from the treasury shares as share dividend declared during the current year.
As at the reporting date, the diluted earnings per share is equal to the basic earnings per share as the Group has not issued any financial instruments that should be taken into consideration when the diluted earnings per share is calculated.
24 - Dividends and Directors’ remuneration
Dividends
At the Annual General Meeting of the shareholders held on 21 March 2015, the shareholders approved a 3.4% cash dividend amounting to AED 71.5 million and 4.98% treasury shares distribution (99.5 million shares) amounting to AED 197 million (2014: 9% cash dividend amounting to AED 176.4 million and 2.86% treasury shares distribution (60 million shares) amounting to AED 119 million). The shareholders also approved Directors’ remuneration of AED 7.5 million (2014: AED 7.5 million) and charitable donations of AED 2.5 million (2014: AED 2.5 million). In addition, the shareholders also approved the appropriation of AED 30 million to contingency reserves.
At the Annual General Meeting held on 6 February 2016 of the shareholders of Emirates Lebanon Bank S.A.L, a subsidiary of the Bank, the shareholders approved a cash dividend for an amount of AED 11.0 million (2014: cash dividend of AED 9.2 million) out of which the non-controlling interest share amounted to AED 2.2 million (2014: AED 1.8 million). In addition to the above, an amount of AED 3.1 million was paid as Directors’ remuneration (2014: AED 3.1 million).
Treasury shares
As mentioned earlier, during the period, 99.5 million shares were released from the treasury shares as share distribution and as such the number of shares held as treasury shares as at 31 December 2015 is nil (31 December 2014: 99.5 million shares with market value of those shares amounting to AED 194 million).
Earnings per share are computed by dividing the profit for the year by the average number of shares outstanding during the year as follows:
2015 2014
Basic And Diluted Earnings Per Share
Profit attributable to owners of the Bank for the year (AED’000) 243,754 280,876
------------- -------------
Profit available to the owners of the Bank 243,754 280,876
=========== ===========
Weighted average number of ordinary shares:
Ordinary shares at the beginning of the year 2,000,473 1,935,000
Effect of scrip dividend issued during the year 99,527 65,473
Weighted average number of shares outstanding during the year (in thousands shares) 2,083,412 1,995,457
=========== ===========
Basic Earnings Per Share (AED) 0.12 0.14
=========== ===========
Consolidated Statement of other Comprehensive Incomefor the year ended 31 December 2015

Credit-related commitments include commitments to extend credit, standby letters of credit, and guarantees which are designed to meet the requirements of the Group’s customers.
Commitments to extend credit represent contractual commitments to make loans and advances and revolving credits. Commitments generally have fixed expiry dates, or other termination clauses. Since commitments may expire without being drawn upon, the total contract amounts do not necessarily represent future cash requirements.
Letters of credit and guarantees commit the Group to make payments on behalf of customers contingent upon the failure of the customer to perform under the terms of the contract. These contracts would have market risk if issued or extended at a fixed rate of interest. However, these contracts are primarily made at zero or floating interest rates.
26 - Cash and cash equivalents
27 - Fiduciary assets The Group holds investments amounting to AED 0.8 billion (31 December 2014: AED 2.4 billion) which are held on behalf of customers and not treated as assets in the consolidated statement of financial position.
25 - Commitments and contingent liabilities
2015 2014
AED’000 AED’000
Financial guarantees for loans 706,794 1,060,534
Other guarantees 2,247,582 1,868,815
Letters of credit 1,307,698 1,211,836
Capital commitments 44,929 44,929
------------- -------------
4,307,003 4,186,114
Irrevocable commitments to extend credit 1,552,812 1,535,327
------------- -------------
5,859,815 5,721,441
=========== ===========
2015 2014
AED’000 AED’000
Cash and balances with central banks (Note 6) 6,436,195 3,707,816
Deposits and balances due from banks (Note 7) 1,072,415 2,783,177
Deposits and balances due to banks (Note 18) (45,479) (405,603)
------------- -------------
7,463,131 6,085,390
Less: Deposits and balances due from banks - original maturity more than three months (1,265,961) (1,090,930)
Less: Statutory deposits with central banks (Note 6) (1,086,835) (1,055,819)
------------- -------------
5,110,335 3,938,641
=========== ===========

73
28 - Interest income
29 - Interest expense
30 - Net fee and commission income
31 - Income/(loss) on investments
2015 2014
AED’000 AED’000
Loans and advances 907,032 886,364
Certificates of deposit, treasury bills
with central banks and debt instruments 99,623 89,893
Placements with banks 8,182 8,690
Interest rate swap 13,374 -
------------- -------------
1,028,211 984,947
=========== ===========
2015 2014
AED’000 AED’000
Customers’ deposits 426,711 488,633
Banks’ deposits 12,030 9,677
Syndicated loan - 12,314
Interest on cash contribution towards capital
due to non-controlling interests 6,611 6,612
Issued bonds 34,768 -
------------- -------------
480,120 517,236
=========== ===========
2015 2014
AED’000 AED’000
Corporate banking credit related fees 59,765 58,940
Trade finance activities 62,554 59,306
Letters of guarantee 33,863 36,852
Other 3,931 4,455
------------- -------------
160,113 159,553
=========== ===========
2015 2014
AED’000 AED’000
Dividends 1,835 7,451
Revaluation gain/(loss) on investments measured at FVTPL 3,873 (32,663)
Other investment income 5,822 9,989
------------- -------------
11,530 (15,223)
=========== ===========
Consolidated Statement of other Comprehensive Incomefor the year ended 31 December 2015

32 - Other income
33 - Net impairment loss on financial assets
34 - General and administrative expenses
2015 2014
AED’000 AED’000
Success fee* - 75,370
Income/(loss) on sale of fixed assets 46,189 (595)
Other 41,547 39,960
------------- -------------
87,736 114,735
=========== ===========
* Success fee is the compensation given to the Bank for successfully arranging project finance for one of the Bank’s major borrowers (Note 12).
*Other includes an amount of AED 10.46 million representing social contributions made during the year ended 31 December 2015.
2015 2014
AED’000 AED’000
Collective impairment of loans and advances 67,500 215,250
Specific provision of loans and advances 318,990 45,303
------------- -------------
Total charge for the year (Note 8) 386,490 260,553
Write backs (89,484) (21,725)
------------- -------------
297,006 238,828
=========== ===========
2015 2014
AED’000 AED’000
Salaries and employees related expenses 159,640 164,511
Depreciation on property and equipment (Note 14) 35,064 19,926
Other * 72,855 75,057
------------- -------------
267,559 259,494
=========== ===========
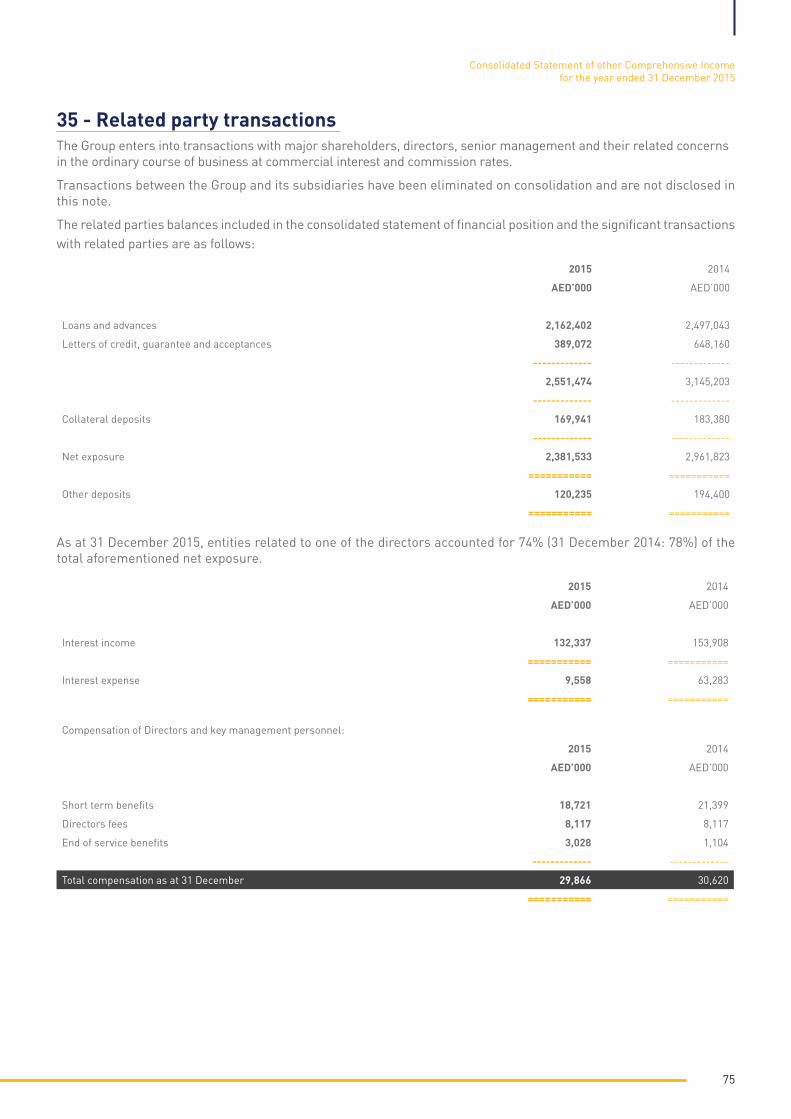
75
35 - Related party transactions The Group enters into transactions with major shareholders, directors, senior management and their related concerns in the ordinary course of business at commercial interest and commission rates.
Transactions between the Group and its subsidiaries have been eliminated on consolidation and are not disclosed in this note.
The related parties balances included in the consolidated statement of financial position and the significant transactions with related parties are as follows:
As at 31 December 2015, entities related to one of the directors accounted for 74% (31 December 2014: 78%) of the total aforementioned net exposure.
2015 2014
AED’000 AED’000
Loans and advances 2,162,402 2,497,043
Letters of credit, guarantee and acceptances 389,072 648,160
------------- -------------
2,551,474 3,145,203
------------- -------------
Collateral deposits 169,941 183,380
------------- -------------
Net exposure 2,381,533 2,961,823
=========== ===========
Other deposits 120,235 194,400
=========== ===========
2015 2014
AED’000 AED’000
Interest income 132,337 153,908
=========== ===========
Interest expense 9,558 63,283
=========== ===========
Compensation of Directors and key management personnel:
2015 2014
AED’000 AED’000
Short term benefits 18,721 21,399
Directors fees 8,117 8,117
End of service benefits 3,028 1,104
------------- -------------
Total compensation as at 31 December 29,866 30,620
=========== ===========
Consolidated Statement of other Comprehensive Incomefor the year ended 31 December 2015
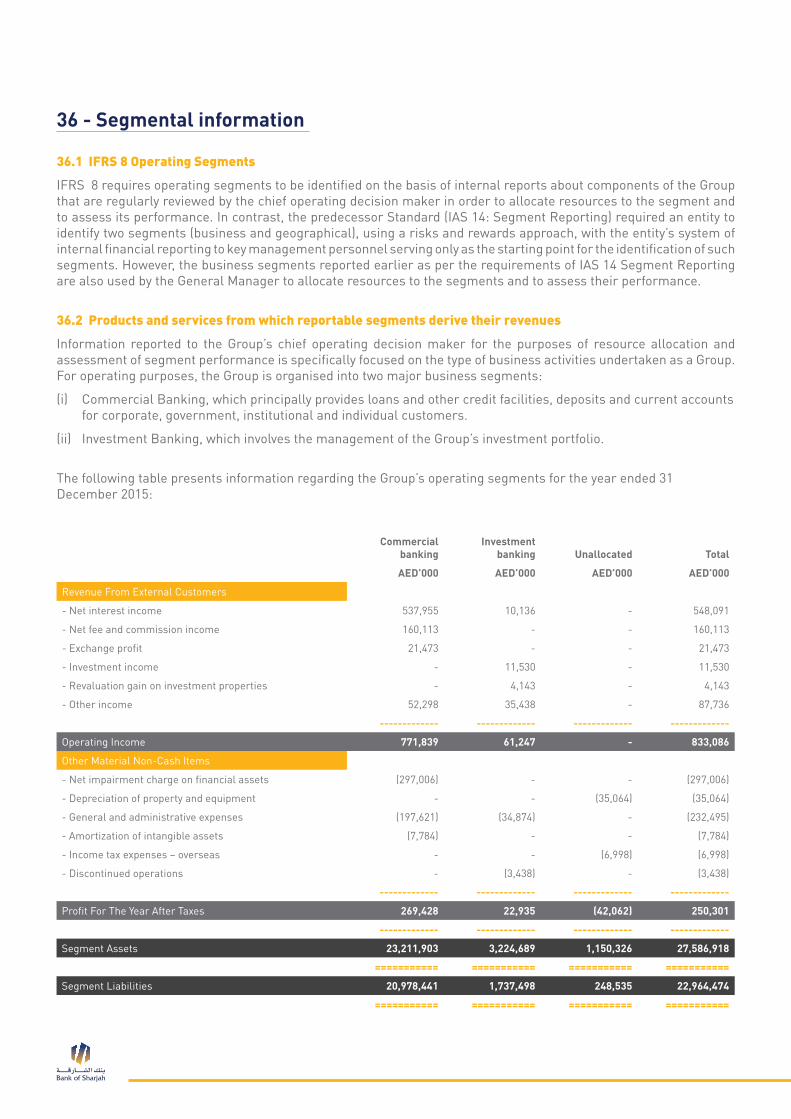
36 - Segmental information
36.1 IFRS 8 Operating Segments
IFRS 8 requires operating segments to be identified on the basis of internal reports about components of the Group that are regularly reviewed by the chief operating decision maker in order to allocate resources to the segment and to assess its performance. In contrast, the predecessor Standard (IAS 14: Segment Reporting) required an entity to identify two segments (business and geographical), using a risks and rewards approach, with the entity’s system of internal financial reporting to key management personnel serving only as the starting point for the identification of such segments. However, the business segments reported earlier as per the requirements of IAS 14 Segment Reporting are also used by the General Manager to allocate resources to the segments and to assess their performance.
36.2 Products and services from which reportable segments derive their revenues
Information reported to the Group’s chief operating decision maker for the purposes of resource allocation and assessment of segment performance is specifically focused on the type of business activities undertaken as a Group. For operating purposes, the Group is organised into two major business segments:
(i) Commercial Banking, which principally provides loans and other credit facilities, deposits and current accounts for corporate, government, institutional and individual customers.
(ii) Investment Banking, which involves the management of the Group’s investment portfolio.
The following table presents information regarding the Group’s operating segments for the year ended 31 December 2015:
Commercial banking
Investment banking Unallocated Total
AED’000 AED’000 AED’000 AED’000
Revenue From External Customers
- Net interest income 537,955 10,136 - 548,091
- Net fee and commission income 160,113 - - 160,113
- Exchange profit 21,473 - - 21,473
- Investment income - 11,530 - 11,530
- Revaluation gain on investment properties - 4,143 - 4,143
- Other income 52,298 35,438 - 87,736
------------- ------------- ------------- -------------
Operating Income 771,839 61,247 - 833,086
Other Material Non-Cash Items
- Net impairment charge on financial assets (297,006) - - (297,006)
- Depreciation of property and equipment - - (35,064) (35,064)
- General and administrative expenses (197,621) (34,874) - (232,495)
- Amortization of intangible assets (7,784) - - (7,784)
- Income tax expenses – overseas - - (6,998) (6,998)
- Discontinued operations - (3,438) - (3,438)
------------- ------------- ------------- -------------
Profit For The Year After Taxes 269,428 22,935 (42,062) 250,301
------------- ------------- ------------- -------------
Segment Assets 23,211,903 3,224,689 1,150,326 27,586,918
=========== =========== =========== ===========
Segment Liabilities 20,978,441 1,737,498 248,535 22,964,474
=========== =========== =========== ===========

77
The following table presents information regarding the Group’s operating segments for the year ended31 December 2014:
Revenue reported above represents revenue generated from external customers. There were no inter-segment sales during the year (2014: Nil). Transactions between segments, inter-segment cost of funds and allocation of expenses are not determined by management for resource allocation purpose. The accounting policies of the reportable segments are the same as the Group’s accounting policies described in note 4.
For the purposes of monitoring segment performance and allocating resources between segments:
• All assets are allocated to reportable segments except for property and equipment, goodwill and other intangibles and certain amounts included in other assets.• All liabilities are allocated to reportable segments except for certain amounts included in other liabilities.
Commercial Banking
Investment Banking Unallocated Total
AED’000 AED’000 AED’000 AED’000
Revenue From External Customers
- Net interest income 444,040 23,671 - 467,711
- Net fee and commission income 159,553 - - 159,553
- Exchange profit 24,642 - - 24,642
- Investment loss - (15,223) - (15,223)
- Revaluation gain on investment properties - 32,465 - 32,465
- Other income 91,215 23,520 - 114,735
------------- ------------- ------------- -------------
Operating Income 719,450 64,433 - 783,883
Other Material Non-Cash Items
- Net impairment charge on financial assets (238,828) - - (238,828)
- Depreciation of property and equipment - - (19,926) (19,926)
- General and administrative expenses (203,613) (35,955) - (239,568)
- Amortization of intangible assets (7,784) - - (7,784)
- Income tax expenses – overseas - - (6,339) (6,339)
- Discontinued operations - 14,481 - 14,481
------------- ------------- ------------- -------------
Profit For The Year After Taxes 269,225 42,959 (26,265) 285,919
------------- ------------- ------------- -------------
Segment Assets 21,713,976 2,899,378 441,029 25,054,383
=========== =========== =========== ===========
Segment Liabilities 19,685,001 734,600 222,123 20,641,724
=========== =========== =========== ===========
Consolidated Statement of other Comprehensive Incomefor the year ended 31 December 2015

36.3 Geographical information
The Group operates in two principal geographical areas - United Arab Emirates (country of domicile) and Lebanon (referred to as ‘foreign’).
The Group’s revenue from external customers and information about its non-current assets by geographical location are detailed below:
36.4 Information about major customers
In 2015, two customers accounted for more than 10% of the Group’s net revenue from external customers (2014: one customer accounted for more than 10% of the Group’s net revenue from external customers).
37 - Classification of financial assets and liabilities
Country of domicile Foreign Total
AED’000 AED’000 AED’000
2015
Operating income (from external customers) 732,320 100,766 833,086
=========== =========== ===========
Non-current assets 1,566,425 291,905 1,858,330
=========== =========== ===========
2014
Operating income (from external customers) 684,034 99,849 783,883
=========== =========== ===========
Non-current assets 731,914 296,364 1,028,278
=========== =========== ===========
(a) The table below sets out the Group’s classification of each class of financial assets and liabilities and their carrying amounts as at 31 December 2015
FVTPL FVTOCI Amortised cost Total
AED’000 AED’000 AED’000 AED’000
FINANCIAL ASSETS:
Cash and balances with central banks - - 6,436,195 6,436,195
Deposits and balances due from banks - - 1,072,415 1,072,415
Loans and advances, net - - 15,036,621 15,036,621
Other financial assets measured at fair value 90,104 1,124,774 - 1,214,878
Other financial assets measured at amortised cost - - 527,330 527,330
Other assets - - 1,711,779 1,711,779
------------- ------------- ------------- -------------
Total 90,104 1,124,774 24,784,340 25,999,218
=========== =========== =========== ===========
FINANCIAL LIABILITIES:
Customers’ deposits - - 19,491,815 19,491,815
Deposits and balances due to banks - - 45,479 45,479
Other liabilities 823 - 1,627,123 1,627,946
Issued Bonds 1,737,498 - - 1,737,498
------------- ------------- ------------- -------------
Total 1,738,321 - 21,164,417 22,902,738
=========== =========== =========== ===========

79
38 - Risk managementThe Group has Senior Management committees to oversee the risk management. The Executive Committee and the Board Risk Committee, under delegation from the Board of Directors defines policies, processes, and systems to manage and monitor credit risk. It also sets policies, system and limits for interest rate risk, foreign exchange risk, and liquidity risk. The Group also has a Credit Risk function which independently reviews adherence to all risk management policies and processes. The Group’s internal audit function, which is part of risk review, primarily evaluates the effectiveness of the controls addressing operational risk.
Credit risk management
Credit risk is the risk that one party to a financial instrument will fail to discharge an obligation and cause the other party to incur a financial loss. The Group attempts to control credit risk by monitoring credit exposures, limiting transactions with specific counter-parties, and continually assessing the creditworthiness of counter-parties. In addition to monitoring credit limits, the Group manages the credit exposure relating to its trading activities by entering into master netting agreements and collateral arrangements with counter-parties in appropriate circumstances, and by limiting the duration of exposure. In certain cases, the Group may also close out transactions or assign them to other counter-parties to mitigate credit risk.
Concentrations of credit risk arise when a number of counter-parties are engaged in similar business activities, or activities in the same geographic region, or have similar economic features that would cause their ability to meet contractual obligations to be similarly affected by changes in economic, political, or other conditions. Concentrations of credit risk indicate the relative sensitivity of the Group’s performance to developments affecting a particular industry or geographic location.
(b) The table below sets out the Group’s classification of each class of financial assets and liabilities and their carrying amounts as at 31 December 2014:
FVTPL FVTOCI Amortised cost Total
AED’000 AED’000 AED’000 AED’000
FINANCIAL ASSETS:
Cash and balances with central banks - - 3,707,816 3,707,816
Deposits and balances due from banks - - 2,783,177 2,783,177
Loans and advances, net - - 14,080,102 14,080,102
Other financial assets measured at fair value 85,401 1,081,230 - 1,166,631
Other financial assets measured at amortised cost - - 597,349 597,349
Other assets 44 - 1,587,081 1,587,125
------------- ------------- ------------- -------------
Total 85,445 1,081,230 22,755,525 23,922,200
=========== =========== =========== ===========
FINANCIAL LIABILITIES:
Customers’ deposits - - 17,800,882 17,800,882
Deposits and balances due to banks - - 405,603 405,603
Other liabilities 3 - 1,623,426 1,623,429
Syndicated loan - - 734,600 734,600
------------- ------------- ------------- -------------
Total 3 - 20,564,511 20,564,514
=========== =========== =========== ===========
Consolidated Statement of other Comprehensive Incomefor the year ended 31 December 2015

Policies relating to credit are reviewed and approved by the Group’s Executive Committee. All credit lines are approved in accordance with the Group’s credit policy set out in the Credit Policy Manual. Credit and marketing functions are segregated. In addition, whenever possible, loans are secured by acceptable forms of collateral in order to mitigate credit risk. The Group further limits risk through diversification of its assets by economic and industry sectors.
All credit facilities are administered and monitored by the Credit Administration Department. Periodic reviews are conducted by Credit Risk and facilities are risk graded based on criterion established in the Credit Policy Manual.
Cross border exposure and financial institutions exposure limits for money market and treasury activities are approved as per guidelines established by the Group’s Executive Committee and are monitored by the Senior Management on a daily basis.
The Executive Committee is responsible for setting credit policy of the Group. It also establishes industry caps, approves policy exceptions, and conducts periodic portfolio reviews to ascertain portfolio quality.
Commercial/Institutional lending underwriting
All credit applications for Commercial and Institutional lending are subject to the Group’s credit policies, underwriting standards and industry caps (if any) and to regulatory requirements, as applicable from time to time. The Group does not lend to companies operating in industries that are considered by the Group inherently risky and where industry knowledge specialisation is required. In addition, the Group sets credit limits for all customers based on their creditworthiness.
All credit facilities extended by the Group are made subject to prior approval pursuant to a delegated signature authority system under the ultimate authority of the Executive Committee or the Group’s Executive Director and General Manager under the supervision of the Board. At least two signatures are required to approve any commercial or institutional credit application.
Credit review procedures and loan classification
The Group’s Credit Risk department subjects the Group’s risk assets to an independent quality evaluation on a regular basis in conformity with the guidelines of the Central Bank of the U.A.E. and the Group’s internal policies in order to assist in the early identification of accrual and potential performance problems. The Credit Risk department validates the risk ratings of all commercial clients, provides an assessment of portfolio risk by product and industry and monitors observance of all approved credit policies, guidelines and operating procedures across the Group.
All commercial/institutional loan facilities of the Group are assigned one of nine risk ratings (A-I) where A is being excellent and I being loss with no reimbursement capacity and total provisioning.
If a credit is impaired, interest suspended will not be credited to the consolidated statement of profit or loss. Specific allowance for impairment of classified assets is made based on recoverability of outstanding and risk ratings of the assets.
The Group also complies with IAS 39 in accordance with which it assesses the need for any impairment losses on its loan portfolio by calculating the net present value of the expected future cash flows for each loan. As required by Central Bank of the U.A.E. guidelines, the Group takes the higher of the loan loss provisions required under IAS 39, and Central Bank regulations.
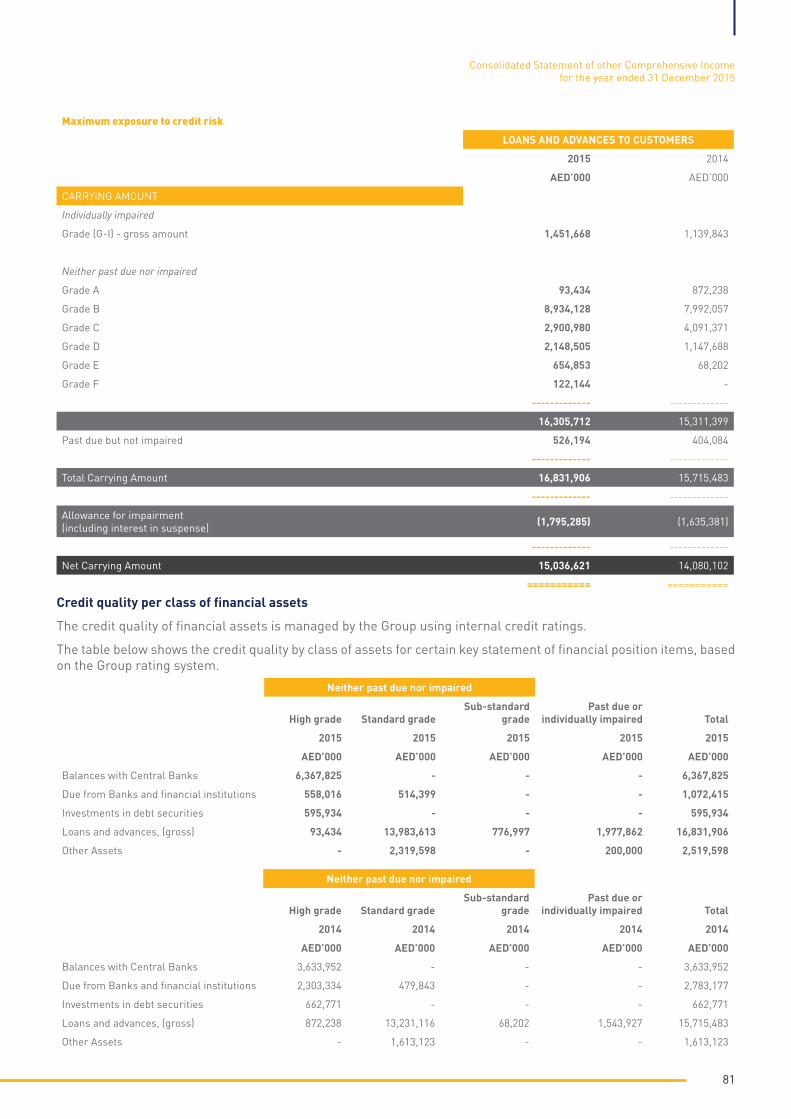
81
Credit quality per class of financial assets
The credit quality of financial assets is managed by the Group using internal credit ratings.
The table below shows the credit quality by class of assets for certain key statement of financial position items, based on the Group rating system.
Maximum exposure to credit risk
LOANS AND ADVANCES TO CUSTOMERS
2015 2014
AED’000 AED’000
CARRYING AMOUNT
Individually impaired
Grade (G-I) - gross amount 1,451,668 1,139,843
Neither past due nor impaired
Grade A 93,434 872,238
Grade B 8,934,128 7,992,057
Grade C 2,900,980 4,091,371
Grade D 2,148,505 1,147,688
Grade E 654,853 68,202
Grade F 122,144 -
------------- -------------
16,305,712 15,311,399
Past due but not impaired 526,194 404,084
------------- -------------
Total Carrying Amount 16,831,906 15,715,483
------------- -------------
Allowance for impairment (including interest in suspense) (1,795,285) (1,635,381)
------------- -------------
Net Carrying Amount 15,036,621 14,080,102
=========== ===========
Neither past due nor impaired
High grade Standard gradeSub-standard
gradePast due or
individually impaired Total
2015 2015 2015 2015 2015
AED’000 AED’000 AED’000 AED’000 AED’000
Balances with Central Banks 6,367,825 - - - 6,367,825
Due from Banks and financial institutions 558,016 514,399 - - 1,072,415
Investments in debt securities 595,934 - - - 595,934
Loans and advances, (gross) 93,434 13,983,613 776,997 1,977,862 16,831,906
Other Assets - 2,319,598 - 200,000 2,519,598
Neither past due nor impaired
High grade Standard gradeSub-standard
gradePast due or
individually impaired Total
2014 2014 2014 2014 2014
AED’000 AED’000 AED’000 AED’000 AED’000
Balances with Central Banks 3,633,952 - - - 3,633,952
Due from Banks and financial institutions 2,303,334 479,843 - - 2,783,177
Investments in debt securities 662,771 - - - 662,771
Loans and advances, (gross) 872,238 13,231,116 68,202 1,543,927 15,715,483
Other Assets - 1,613,123 - - 1,613,123
Consolidated Statement of other Comprehensive Incomefor the year ended 31 December 2015
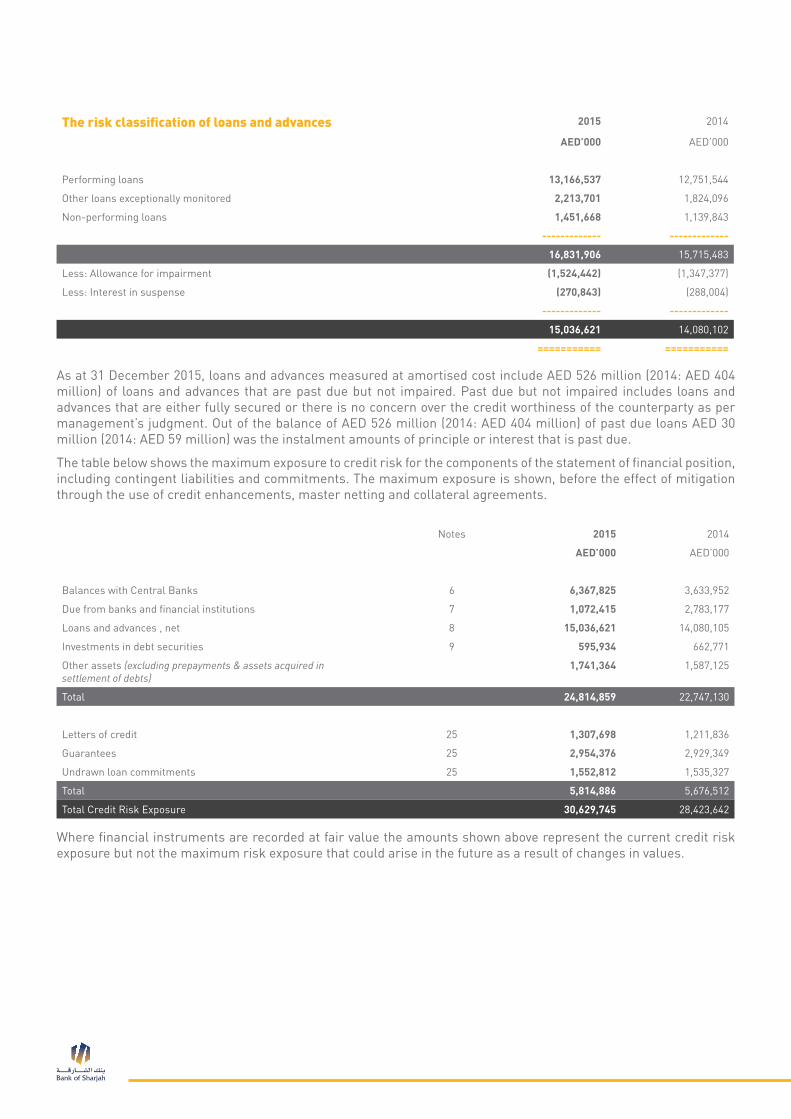
The risk classification of loans and advances 2015 2014
AED’000 AED’000
Performing loans 13,166,537 12,751,544
Other loans exceptionally monitored 2,213,701 1,824,096
Non-performing loans 1,451,668 1,139,843
------------- -------------
16,831,906 15,715,483
Less: Allowance for impairment (1,524,442) (1,347,377)
Less: Interest in suspense (270,843) (288,004)
------------- -------------
15,036,621 14,080,102
=========== ===========
As at 31 December 2015, loans and advances measured at amortised cost include AED 526 million (2014: AED 404 million) of loans and advances that are past due but not impaired. Past due but not impaired includes loans and advances that are either fully secured or there is no concern over the credit worthiness of the counterparty as per management’s judgment. Out of the balance of AED 526 million (2014: AED 404 million) of past due loans AED 30 million (2014: AED 59 million) was the instalment amounts of principle or interest that is past due.
The table below shows the maximum exposure to credit risk for the components of the statement of financial position, including contingent liabilities and commitments. The maximum exposure is shown, before the effect of mitigation through the use of credit enhancements, master netting and collateral agreements.
Where financial instruments are recorded at fair value the amounts shown above represent the current credit risk exposure but not the maximum risk exposure that could arise in the future as a result of changes in values.
Notes 2015 2014
AED’000 AED’000
Balances with Central Banks 6 6,367,825 3,633,952
Due from banks and financial institutions 7 1,072,415 2,783,177
Loans and advances , net 8 15,036,621 14,080,105
Investments in debt securities 9 595,934 662,771
Other assets (excluding prepayments & assets acquired insettlement of debts)
1,741,364 1,587,125
Total 24,814,859 22,747,130
Letters of credit 25 1,307,698 1,211,836
Guarantees 25 2,954,376 2,929,349
Undrawn loan commitments 25 1,552,812 1,535,327
Total 5,814,886 5,676,512
Total Credit Risk Exposure 30,629,745 28,423,642

83
Collaterals held against loans and advances
The fair value of the collateral that the Group held at 31 December 2015 for past due but not impaired loans and advances to customers covers 127% (2014: 129%) of the outstanding balance.
Carrying amount per class of on-balance sheet financial assets whose terms have been renegotiated
Impaired loans and securities
Impaired loans and securities are loans and securities for which the Group determines that it is likely the collectability of all principal and interest due according to the contractual terms of the loan/securities agreement(s) would be doubtful. These loans are graded G to I in the Group’s internal credit risk grading system.
Allowances for impairment
The Group establishes an allowance for impairment losses that represents its estimate of incurred losses in its loans and advances portfolio. The main components of this allowance are a specific loss component that relates to individually significant exposures and a collective loan loss allowance established for group of homogeneous assets with respect to losses that have been incurred but have not been identified on loans subject to individual assessment for impairment.
Write-off policy
The Group writes off a loan/security balance (and any related allowances for impairment losses) when the Group determines that the loans/securities are uncollectible. This determination is reached after considering information such as the occurrence of significant changes in the borrower/issuer’s financial position such that the borrower/issuer can no longer pay the obligation, or that proceeds from collateral will not be sufficient to pay back the entire exposure.
The Group holds collateral against loans and advances in the form of mortgage interests over properties, vehicles and machineries, cash margins, fixed deposits, guarantees and others. The Group accepts guarantees mainly from well-reputed local or international banks, well-established local or multinational corporate and high net worth private individuals. Management has estimated the fair value of collateral to be AED 12.2 billion (2014: AED 9.1 billion). The fair value of the collateral includes cash deposits which are not under lien and the Group has right to set-off against the outstanding facilities.
No collateral are held against investment securities.
Aging analysis of past due but not impaired loans per class of on-balance sheet financial assets
Less than 30 days 31 to 89 days More than 90 days Total
2015 2015 2015 2015
AED’000 AED’000 AED’000 AED’000
Loans and advances 356,143 46,236 123,815 526,194
Less than 30 days 31 to 89 days More than 90 days Total
2014 2014 2014 2014
AED’000 AED’000 AED’000 AED’000
Loans and advances 99,128 23,827 281,130 404,085
2015 2014
AED’000 AED’000
Loans and advances 1,109,691 473,939
Consolidated Statement of other Comprehensive Incomefor the year ended 31 December 2015

Liquidity risk management
Executive Committee (EC) & Board Risk Committee (BRC)
In addition to its credit related activity, the Executive Committee along with the Board Risk Committee have a broad range of authority delegated by the Board of Directors to manage the Group’s asset and liability structure and funding strategy. The EC and BRC review liquidity ratios; asset and liability structure; interest rate and foreign exchange exposures; internal and statutory ratio requirements; funding gaps; and general domestic and international economic and financial market conditions. The EC & BRC formulate liquidity risk management guidelines for the Group’s operation on the basis of such review.
The Group’s Senior Management monitors the liquidity on a daily basis and uses an interest rate simulation model to measure and monitor interest rate sensitivity and varying interest rate scenarios.
The EC members comprise of the Chairman, three Board Members, in addition to the Executive Director and General Manager. The EC meets once or more every 45 days, as circumstances dictate. The quorum requires all members to be present at the meeting and decisions taken to be unanimous.
Liquidity risk is the risk that the Group will encounter difficulty in meeting obligations from its financial liabilities.
The Group manages its liquidity in accordance with U.A.E. Central Bank requirements and the Group’s internal guidelines. The U.A.E. Central Bank sets cash ratio requirements on overall deposits ranging between 1.0 percent for time deposits and 14.0 percent for demand deposits, according to the tenor of the deposits. The U.A.E. Central Bank also imposes a mandatory 1:1 utilisation ratio, whereby; loans and advances (combined with inter-bank placements having a remaining term of 'greater than three months') should not exceed stable funds as defined by the U.A.E. Central Bank. Stable funds are defined by the U.A.E. Central Bank to mean free-own funds, inter-bank deposits with a remaining term of more than six months, and stable customer deposits. To guard against liquidity risk, the Group diversifies its funding sources and manages its assets with liquidity in mind, seeking to maintain a preferable proportion between cash, cash equivalent, and readily marketable securities. The Board Risk Committee sets and monitors liquidity ratios and regularly revises and updates the Group’s liquidity management policies to ensure that the Group would be in a position to meet its obligations as they fall due. Management of liquidity risk within the parameters prescribed by the Board Risk Committee has been delegated to an Asset and Liability Committee (ALCO) comprising the Deputy General Manager and senior executives from treasury, finance, corporate credit, and investment departments.
The Group’s approach to managing liquidity is to ensure that it will always have sufficient liquidity to meet its liabilities when they fall due, under both normal and stressed conditions, without incurring unacceptable losses or potential damage to the Group’s reputation.
The Treasury department communicates with other business units regarding the liquidity profile of their financial assets and liabilities and details of other projected cash flows arising from projected future business. The Treasury maintains a portfolio of short-term liquid assets to ensure liquidity is maintained within the Group’s operations as a whole.
The daily liquidity position is monitored and regular liquidity stress testing is performed under a variety of scenarios covering both normal and severe market conditions. All liquidity policies and procedures are subject to review and approval by the Board Risk Committee. The Daily Position sheet, which reports the liquidity and exchange positions of the Group is reviewed by Senior Management. A summary report, including any exceptions and remedial action taken, is submitted to the Board Risk Committee.

85
The maturity profile of the assets and liabilities at 31 December 2015 based on the remaining period from the end of the reporting period to the contractual maturity date is as follows:
Within 3 months
Over 3 months to 1 year Over 1 year Undated Total
AED’000 AED’000 AED’000 AED’000 AED’000
Assets
Cash and balances with central banks 5,170,234 36,730 1,229,231 - 6,436,195
Deposits and balances due from banks 839,742 232,673 - - 1,072,415
Loans and advances, net 9,221,352 1,568,863 4,246,406 - 15,036,621
Other financial assets measured at fair value 21,500 68,604 - 1,124,774 1,214,878
Other financial assets measured at amortised cost 27,510 20,228 471,817 7,775 527,330
Investment properties - - - 270,441 270,441
Goodwill and other intangibles - - - 234,234 234,234
Other assets 1,486,039 2,521 1,025,349 5,689 2,519,598
Property and equipment - - - 275,206 275,206
------------- ------------- ------------- ------------- -------------
Total Assets 16,766,377 1,929,619 6,972,803 1,918,119 27,586,918
=========== =========== =========== =========== ===========
Liabilities and equity
Customers’ deposits 14,895,061 4,333,640 263,114 - 19,491,815
Deposits and balances due to banks 45,479 - - - 45,479
Other liabilities 1,596,749 40,571 52,362 - 1,689,682
Issued Bonds - - 1,737,498 - 1,737,498
Equity - - - 4,622,444 4,622,444
------------- ------------- ------------- ------------- -------------
Total Liabilities and Equity 16,537,289 4,374,211 2,052,974 4,622,444 27,586,918
=========== =========== =========== =========== ===========
Net liquidity gap 229,088 (2,444,592) 4,919,829 (2,704,325) -
Consolidated Statement of other Comprehensive Incomefor the year ended 31 December 2015
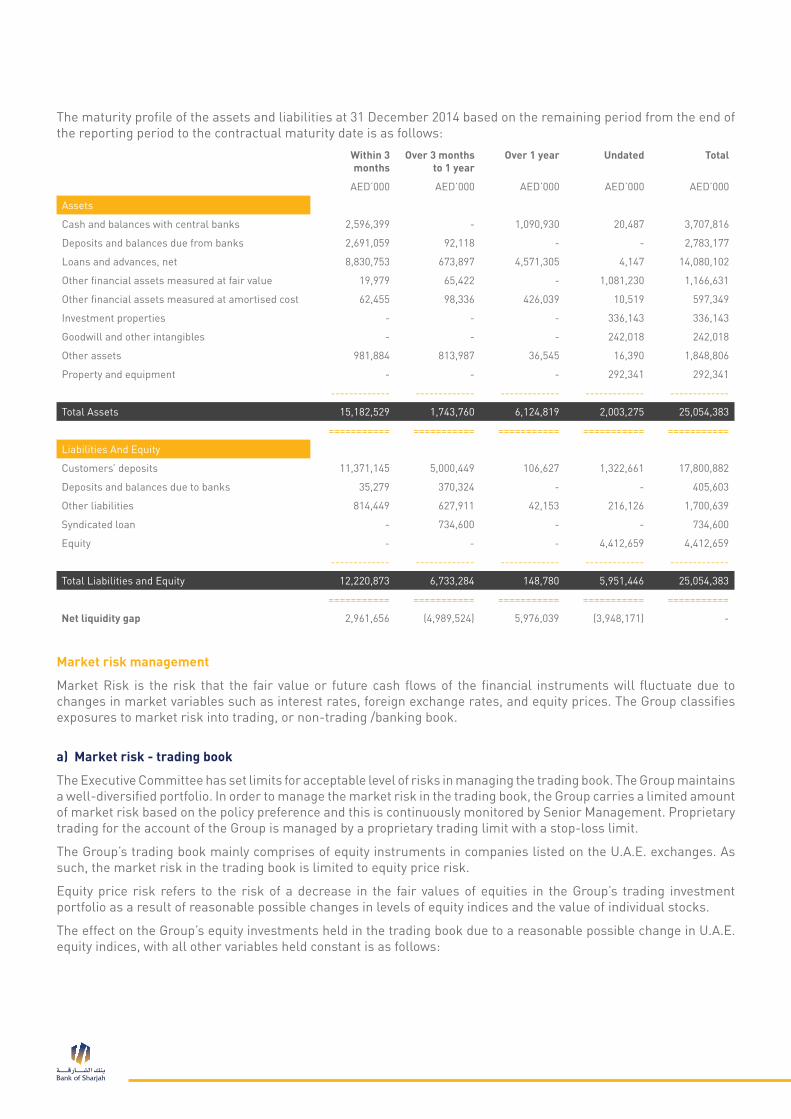
The maturity profile of the assets and liabilities at 31 December 2014 based on the remaining period from the end of the reporting period to the contractual maturity date is as follows:
Market risk management
Market Risk is the risk that the fair value or future cash flows of the financial instruments will fluctuate due to changes in market variables such as interest rates, foreign exchange rates, and equity prices. The Group classifies exposures to market risk into trading, or non-trading /banking book.
a) Market risk - trading book
The Executive Committee has set limits for acceptable level of risks in managing the trading book. The Group maintains a well-diversified portfolio. In order to manage the market risk in the trading book, the Group carries a limited amount of market risk based on the policy preference and this is continuously monitored by Senior Management. Proprietary trading for the account of the Group is managed by a proprietary trading limit with a stop-loss limit.
The Group’s trading book mainly comprises of equity instruments in companies listed on the U.A.E. exchanges. As such, the market risk in the trading book is limited to equity price risk.
Equity price risk refers to the risk of a decrease in the fair values of equities in the Group’s trading investment portfolio as a result of reasonable possible changes in levels of equity indices and the value of individual stocks.
The effect on the Group’s equity investments held in the trading book due to a reasonable possible change in U.A.E. equity indices, with all other variables held constant is as follows:
Within 3 months
Over 3 months to 1 year
Over 1 year Undated Total
AED’000 AED’000 AED’000 AED’000 AED’000
Assets
Cash and balances with central banks 2,596,399 - 1,090,930 20,487 3,707,816
Deposits and balances due from banks 2,691,059 92,118 - - 2,783,177
Loans and advances, net 8,830,753 673,897 4,571,305 4,147 14,080,102
Other financial assets measured at fair value 19,979 65,422 - 1,081,230 1,166,631
Other financial assets measured at amortised cost 62,455 98,336 426,039 10,519 597,349
Investment properties - - - 336,143 336,143
Goodwill and other intangibles - - - 242,018 242,018
Other assets 981,884 813,987 36,545 16,390 1,848,806
Property and equipment - - - 292,341 292,341
------------- ------------- ------------- ------------- -------------
Total Assets 15,182,529 1,743,760 6,124,819 2,003,275 25,054,383
=========== =========== =========== =========== ===========
Liabilities And Equity
Customers’ deposits 11,371,145 5,000,449 106,627 1,322,661 17,800,882
Deposits and balances due to banks 35,279 370,324 - - 405,603
Other liabilities 814,449 627,911 42,153 216,126 1,700,639
Syndicated loan - 734,600 - - 734,600
Equity - - - 4,412,659 4,412,659
------------- ------------- ------------- ------------- -------------
Total Liabilities and Equity 12,220,873 6,733,284 148,780 5,951,446 25,054,383
=========== =========== =========== =========== ===========
Net liquidity gap 2,961,656 (4,989,524) 5,976,039 (3,948,171) -

87
b) Market risk - non-trading or banking book
Market risk on non-trading or banking positions mainly arises from the interest rate, foreign currency exposures and equity price changes.
i) Interest rate risk
Interest rate risk arises from the possibility that changes in interest rates will affect the value of financial instruments. The Group is exposed to interest rate risk as a result of mismatches or gaps in the amounts of assets and liabilities.
The Group uses simulation-modelling tools to periodically measure and monitor interest rate sensitivity. The results are monitored and analysed by the Senior Management. Since most of the Group’s financial assets and liabilities are floating rate, deposits and loans generally re-price simultaneously providing a natural hedge, which reduces interest rate exposure. Moreover, the majority of the Group’s assets and liabilities will be re-priced within one year or less, thereby further limiting interest rate risk.
The Group’s interest sensitivity position, based on the contractual re-pricing or maturity dates, whichever dates are earlier as at 31 December 2015 was as follows:
31 December 2015 31 December 2014
Market Indices Change in equity price Effect on income Change in equity
price Effect on income
% AED’000 % AED’000
Global Stock Markets +1% 1,196 +1% 854
Weighted Average
EffectiveRate
Within 3 months
Over 3 months to 1
year
Over 1 year Non-interest sensitive
Total
AED’000 AED’000 AED’000 AED’000 AED’000
Assets
Cash and balances with central banks 0.98% 2,907,889 - 795,818 2,732,488 6,436,195
Deposits and balances due from banks 0.09% 230,181 - - 842,234 1,072,415
Loans and advances, net 6.22% 14,823,009 152,626 18,324 42,662 15,036,621
Other financial assets - Equity instruments - - - - 1,214,878 1,214,878
Other financial assets - Debt securities 6.08% 36,767 27,207 457,162 6,194 527,330
Investment properties - - - - 270,441 270,441
Goodwill and other intangibles - - - - 234,234 234,234
Other assets - - - - 2,519,598 2,519,598
Property and equipment, net - - - - 275,206 275,206
------------- ------------- ------------- ------------- -------------
Total Assets 17,997,846 179,833 1,271,304 8,137,935 27,586,918
=========== =========== =========== =========== ===========
Liabilities And Equity
Customers’ deposits 2.20% 11,869,108 4,204,849 270,576 3,147,282 19,491,815
Deposits and balances due to banks 1.73% 15,529 - - 29,950 45,479
Other liabilities - - - - 1,689,682 1,689,682
Issued Bonds 3.37% - - 1,737,498 - 1,737,498
Equity - - - - 4,622,444 4,622,444
=========== =========== =========== =========== ===========
Total Liabilities and Equity 11,884,637 4,204,849 2,008,074 9,489,358 27,586,918
=========== =========== =========== =========== ===========
On statement of financial position gap 6,113,209 (4,025,016) (736,770) (1,351,423) -
=========== =========== =========== =========== ===========
Cumulative Interest Rate Sensitivity Gap 6,113,209 2,088,193 1,351,423 - -
=========== =========== =========== =========== ===========
Consolidated Statement of other Comprehensive Incomefor the year ended 31 December 2015
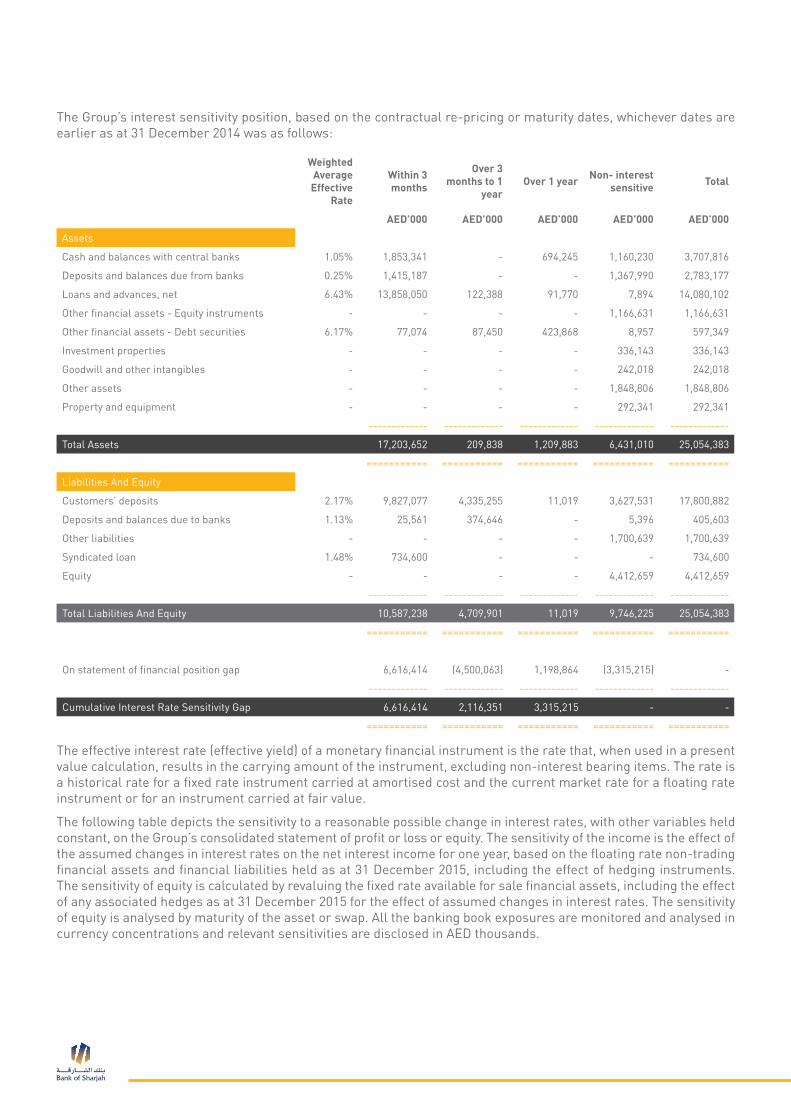
The Group’s interest sensitivity position, based on the contractual re-pricing or maturity dates, whichever dates are earlier as at 31 December 2014 was as follows:
Weighted Average
Effective Rate
Within 3 months
Over 3 months to 1
yearOver 1 year Non- interest
sensitive Total
AED’000 AED’000 AED’000 AED’000 AED’000
Assets
Cash and balances with central banks 1.05% 1,853,341 - 694,245 1,160,230 3,707,816
Deposits and balances due from banks 0.25% 1,415,187 - - 1,367,990 2,783,177
Loans and advances, net 6.43% 13,858,050 122,388 91,770 7,894 14,080,102
Other financial assets - Equity instruments - - - - 1,166,631 1,166,631
Other financial assets - Debt securities 6.17% 77,074 87,450 423,868 8,957 597,349
Investment properties - - - - 336,143 336,143
Goodwill and other intangibles - - - - 242,018 242,018
Other assets - - - - 1,848,806 1,848,806
Property and equipment - - - - 292,341 292,341
------------- ------------- ------------- ------------- -------------
Total Assets 17,203,652 209,838 1,209,883 6,431,010 25,054,383
=========== =========== =========== =========== ===========
Liabilities And Equity
Customers’ deposits 2.17% 9,827,077 4,335,255 11,019 3,627,531 17,800,882
Deposits and balances due to banks 1.13% 25,561 374,646 - 5,396 405,603
Other liabilities - - - - 1,700,639 1,700,639
Syndicated loan 1.48% 734,600 - - - 734,600
Equity - - - - 4,412,659 4,412,659
------------- ------------- ------------- ------------- -------------
Total Liabilities And Equity 10,587,238 4,709,901 11,019 9,746,225 25,054,383
=========== =========== =========== =========== ===========
On statement of financial position gap 6,616,414 (4,500,063) 1,198,864 (3,315,215) -
------------- ------------- ------------- ------------- -------------
Cumulative Interest Rate Sensitivity Gap 6,616,414 2,116,351 3,315,215 - -
=========== =========== =========== =========== ===========
The effective interest rate (effective yield) of a monetary financial instrument is the rate that, when used in a present value calculation, results in the carrying amount of the instrument, excluding non-interest bearing items. The rate is a historical rate for a fixed rate instrument carried at amortised cost and the current market rate for a floating rate instrument or for an instrument carried at fair value.
The following table depicts the sensitivity to a reasonable possible change in interest rates, with other variables held constant, on the Group’s consolidated statement of profit or loss or equity. The sensitivity of the income is the effect of the assumed changes in interest rates on the net interest income for one year, based on the floating rate non-trading financial assets and financial liabilities held as at 31 December 2015, including the effect of hedging instruments. The sensitivity of equity is calculated by revaluing the fixed rate available for sale financial assets, including the effect of any associated hedges as at 31 December 2015 for the effect of assumed changes in interest rates. The sensitivity of equity is analysed by maturity of the asset or swap. All the banking book exposures are monitored and analysed in currency concentrations and relevant sensitivities are disclosed in AED thousands.
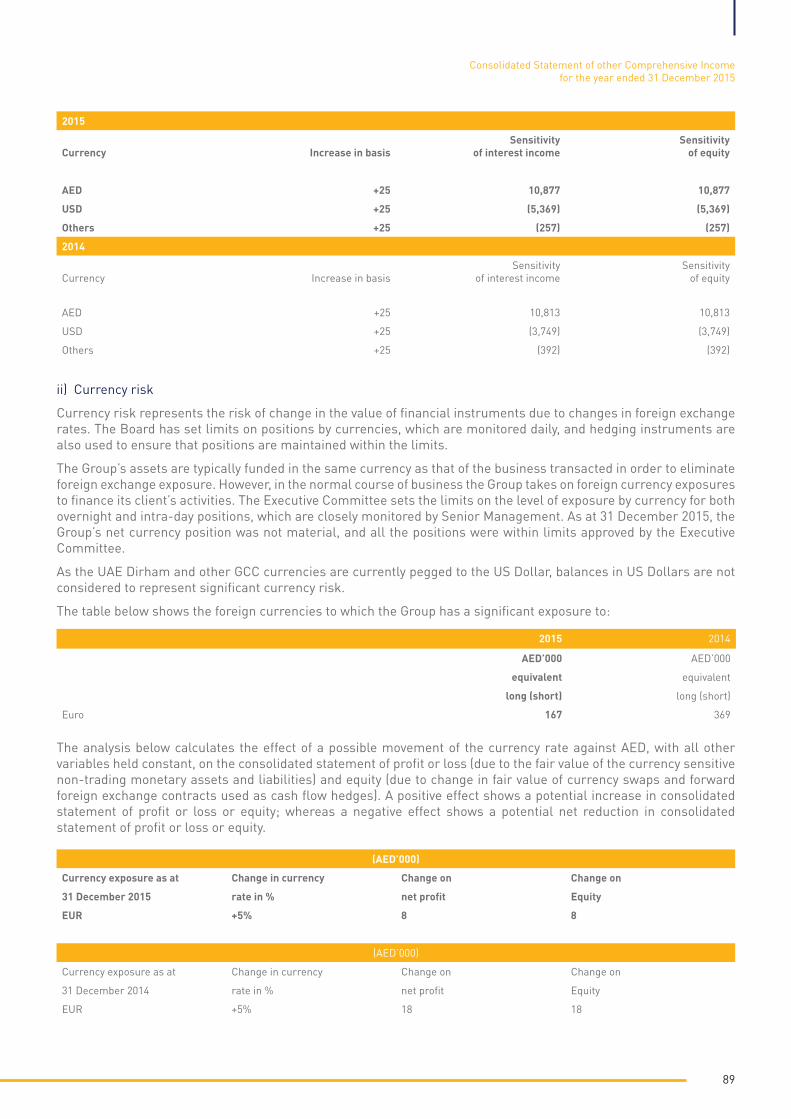
89
ii) Currency risk
Currency risk represents the risk of change in the value of financial instruments due to changes in foreign exchange rates. The Board has set limits on positions by currencies, which are monitored daily, and hedging instruments are also used to ensure that positions are maintained within the limits.
The Group’s assets are typically funded in the same currency as that of the business transacted in order to eliminate foreign exchange exposure. However, in the normal course of business the Group takes on foreign currency exposures to finance its client’s activities. The Executive Committee sets the limits on the level of exposure by currency for both overnight and intra-day positions, which are closely monitored by Senior Management. As at 31 December 2015, the Group’s net currency position was not material, and all the positions were within limits approved by the Executive Committee.
As the UAE Dirham and other GCC currencies are currently pegged to the US Dollar, balances in US Dollars are not considered to represent significant currency risk.
The table below shows the foreign currencies to which the Group has a significant exposure to:
2015
Currency Increase in basisSensitivity
of interest incomeSensitivity
of equity
AED +25 10,877 10,877
USD +25 (5,369) (5,369)
Others +25 (257) (257)
2014
Currency Increase in basisSensitivity
of interest incomeSensitivity
of equity
AED +25 10,813 10,813
USD +25 (3,749) (3,749)
Others +25 (392) (392)
The analysis below calculates the effect of a possible movement of the currency rate against AED, with all other variables held constant, on the consolidated statement of profit or loss (due to the fair value of the currency sensitive non-trading monetary assets and liabilities) and equity (due to change in fair value of currency swaps and forward foreign exchange contracts used as cash flow hedges). A positive effect shows a potential increase in consolidated statement of profit or loss or equity; whereas a negative effect shows a potential net reduction in consolidated statement of profit or loss or equity.
2015 2014
AED’000 AED’000
equivalent equivalent
long (short) long (short)
Euro 167 369
(AED’000)
Currency exposure as at Change in currency Change on Change on
31 December 2015 rate in % net profit Equity
EUR +5% 8 8
(AED’000)
Currency exposure as at Change in currency Change on Change on
31 December 2014 rate in % net profit Equity
EUR +5% 18 18
Consolidated Statement of other Comprehensive Incomefor the year ended 31 December 2015

iii) Equity price risk
Equity price risk refers to the risk of a decrease in the fair value of equities in the Group’s non-trading investment portfolio as a result of reasonable possible changes in levels of equity indices and the value of individual stocks.
The effect on the Group’s quoted equity investments held as financial assets at FVTOCI due to reasonable possible change in equity prices, with all other variables held constant is as follows:
Operational risk
Operational risk is the risk of loss arising from system failure, human error, fraud, or external events. When controls fail to perform, operational risks can cause damage to reputation, and may have legal or regulatory implications, or lead to financial losses. The Group would not be able to eliminate all operational risks, but through a control framework and by monitoring and responding to potential risks, the Group could minimise the risks. Controls include effective segregation of duties, access, authorisation and reconciliation procedures, staff education and assessment processes, including the use of internal audit.
39 - Capital adequacy and capital management
Capital management process
The Group’s objectives when managing capital, which is a broader concept than the ‘equity’ in the consolidated statement of financial positions, are:
• To comply with the capital requirements set by the Central Bank of United Arab Emirates.
• To safeguard the Group’s ability to continue as a going concern and increase the returns for the shareholders.
• To maintain a strong capital base to support the development of its business.
Capital adequacy and the use of regulatory capital are monitored on a regular basis by the Group’s management, employing techniques based on the guidelines developed by the Basel Committee and the Central Bank of United Arab Emirates. The required information is filed with the authority on a quarterly basis.
The U.A.E. Central Bank vide its circular No.27/2009 dated 17 November 2009 informed all the Banks operating in the U.A.E. to implement the Standardised Approach of Basel II from the date of the circular. For credit and market risks, the Central Bank has issued draft guidelines for implementation of the Standardised Approach and banks are expected to comply and report under Pillar 2- Internal Capital Adequacy Assessment Process (ICAAP) requirements by March 2010. For operational risk, the Central Bank has given banks the option to use the Basic Indicators Approach or the Standardised Approach and the Group has chosen to use the Basic Indicator Approach. The capital adequacy ratio required under Basel II is 12% to be maintained at all times.
31 December 2015 31 December 2014
Market Indices Change in equity price Effect on equity Change in equity
price Effect on equity
% AED’000 % AED’000
Global stock markets 1+% 1,419 +1% 1,081
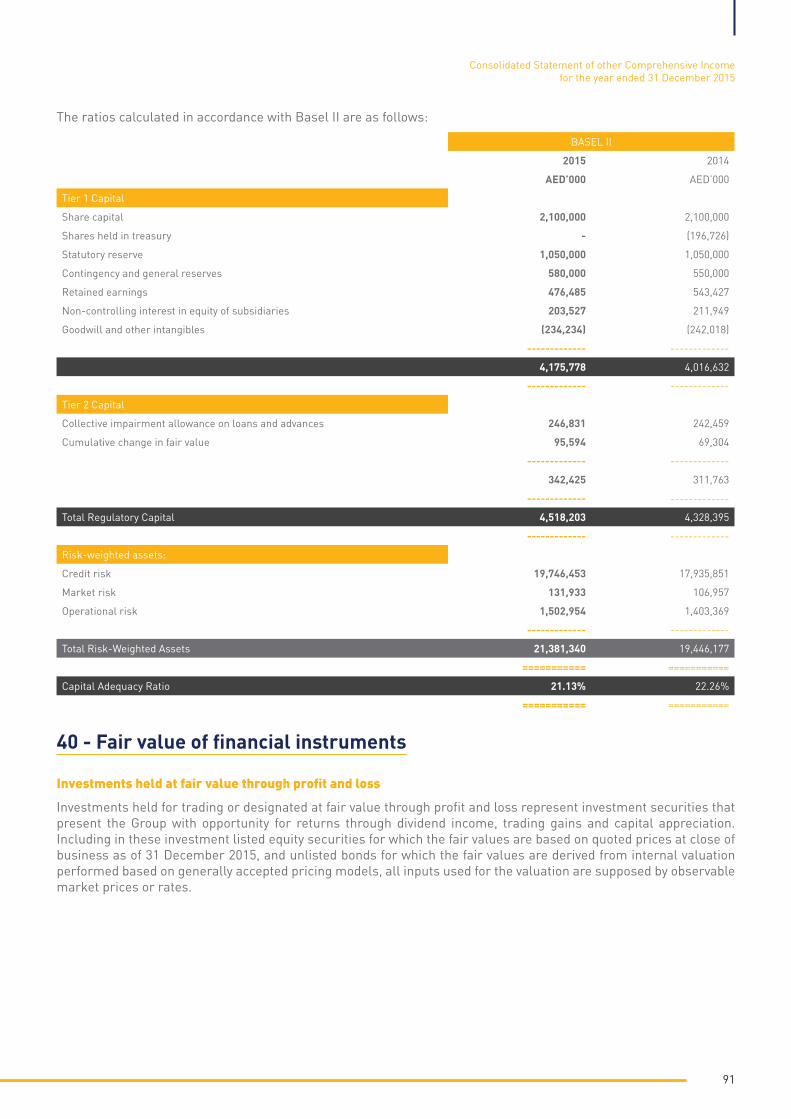
91
40 - Fair value of financial instruments
Investments held at fair value through profit and loss
Investments held for trading or designated at fair value through profit and loss represent investment securities that present the Group with opportunity for returns through dividend income, trading gains and capital appreciation. Including in these investment listed equity securities for which the fair values are based on quoted prices at close of business as of 31 December 2015, and unlisted bonds for which the fair values are derived from internal valuation performed based on generally accepted pricing models, all inputs used for the valuation are supposed by observable market prices or rates.
The ratios calculated in accordance with Basel II are as follows:
BASEL II
2015 2014
AED’000 AED’000
Tier 1 Capital
Share capital 2,100,000 2,100,000
Shares held in treasury - (196,726)
Statutory reserve 1,050,000 1,050,000
Contingency and general reserves 580,000 550,000
Retained earnings 476,485 543,427
Non-controlling interest in equity of subsidiaries 203,527 211,949
Goodwill and other intangibles (234,234) (242,018)
------------- -------------
4,175,778 4,016,632
------------- -------------
Tier 2 Capital
Collective impairment allowance on loans and advances 246,831 242,459
Cumulative change in fair value 95,594 69,304
------------- -------------
342,425 311,763
------------- -------------
Total Regulatory Capital 4,518,203 4,328,395
------------- -------------
Risk-weighted assets:
Credit risk 19,746,453 17,935,851
Market risk 131,933 106,957
Operational risk 1,502,954 1,403,369
------------- -------------
Total Risk-Weighted Assets 21,381,340 19,446,177
=========== ===========
Capital Adequacy Ratio 21.13% 22.26%
=========== ===========
Consolidated Statement of other Comprehensive Incomefor the year ended 31 December 2015

Unquoted investments held at fair value through other comprehensive income
The consolidated financial statements include holdings in unquoted securities amounting to AED 1,021 million (2014: AED 974 million) which are measured at fair value. Fair values are determined in accordance with generally accepted pricing models based on comparable ratios backed by discounted cash flow analysis depending on the investment and industry. The valuation model includes some assumptions that are not supported by observable market prices or rates.
For investments valued using comparable ratios, share prices of comparable companies represent significant inputs to the valuation model. If the share prices of the comparable companies were 5% higher/lower while all other variables were held constant, then the fair value of the securities would increase/decrease by AED 37 million (2014: AED 36 million).
The impact of the change in fair valuation from previously existing carrying amounts have been recognised as a part of cumulative changes in fair value in equity.
Fair value of financial assets carried at amortised cost
Except as detailed in the following table, the management considers that the carrying amounts of financial assets and financial liabilities measured at amortised cost in the consolidated financial statements approximate their fair values.
The fair value for other financial assets measured at amortised cost is based on market prices.
Fair value measurements recognised in the consolidated statement of financial position
The following table provides an analysis of financial instruments that are measured subsequent to initial recognition at fair value. They are banked into levels 1 to 3 based on the degree to which the fair value is observable.
• Level 1 fair value measurements are those derived from quoted prices (unadjusted) in active markets for identical assets or liabilities.
• Level 2 fair value measurements are those derived from inputs other than quoted prices included within Level 1 that are observable for the asset or liability, either directly (i.e. as prices) or indirectly (i.e. derived from prices, including over-the-counter quoted prices).
• Level 3 fair value measurements are those derived from valuation techniques that include inputs for the asset or liability that are not based on observable market data (unobservable inputs).
2015 2014
Carrying amount Fair value Carrying amount Fair value
AED’000 AED’000 AED’000 AED’000
Financial Assets
- Other financial assets measured at amortised cost 527,330 527,752 597,349 604,283
======== ======== ======== ========
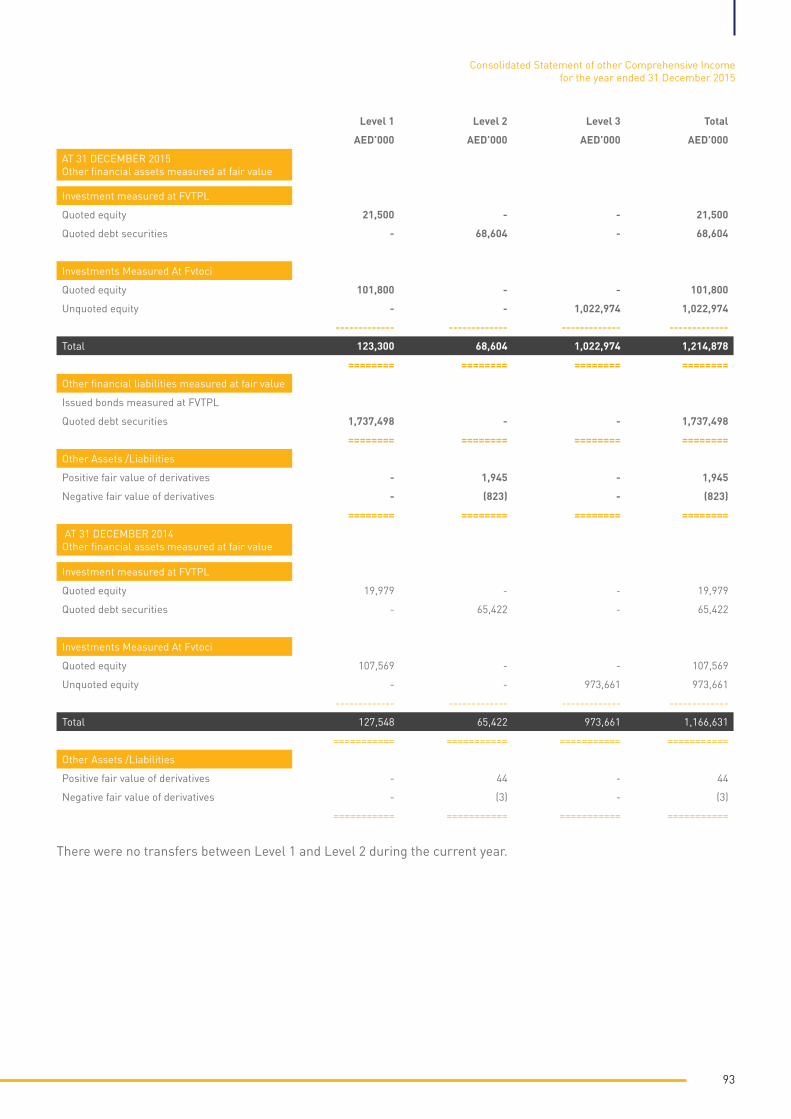
93
There were no transfers between Level 1 and Level 2 during the current year.
Level 1 Level 2 Level 3 Total
AED’000 AED’000 AED’000 AED’000
AT 31 DECEMBER 2015Other financial assets measured at fair value
Investment measured at FVTPL
Quoted equity 21,500 - - 21,500
Quoted debt securities - 68,604 - 68,604
Investments Measured At Fvtoci
Quoted equity 101,800 - - 101,800
Unquoted equity - - 1,022,974 1,022,974
------------- ------------- ------------- -------------
Total 123,300 68,604 1,022,974 1,214,878
======== ======== ======== ========
Other financial liabilities measured at fair value
Issued bonds measured at FVTPL
Quoted debt securities 1,737,498 - - 1,737,498
======== ======== ======== ========
Other Assets /Liabilities
Positive fair value of derivatives - 1,945 - 1,945
Negative fair value of derivatives - (823) - (823)
======== ======== ======== ========
AT 31 DECEMBER 2014Other financial assets measured at fair value
Investment measured at FVTPL
Quoted equity 19,979 - - 19,979
Quoted debt securities - 65,422 - 65,422
Investments Measured At Fvtoci
Quoted equity 107,569 - - 107,569
Unquoted equity - - 973,661 973,661
------------- ------------- ------------- -------------
Total 127,548 65,422 973,661 1,166,631
=========== =========== =========== ===========
Other Assets /Liabilities
Positive fair value of derivatives - 44 - 44
Negative fair value of derivatives - (3) - (3)
=========== =========== =========== ===========
Consolidated Statement of other Comprehensive Incomefor the year ended 31 December 2015
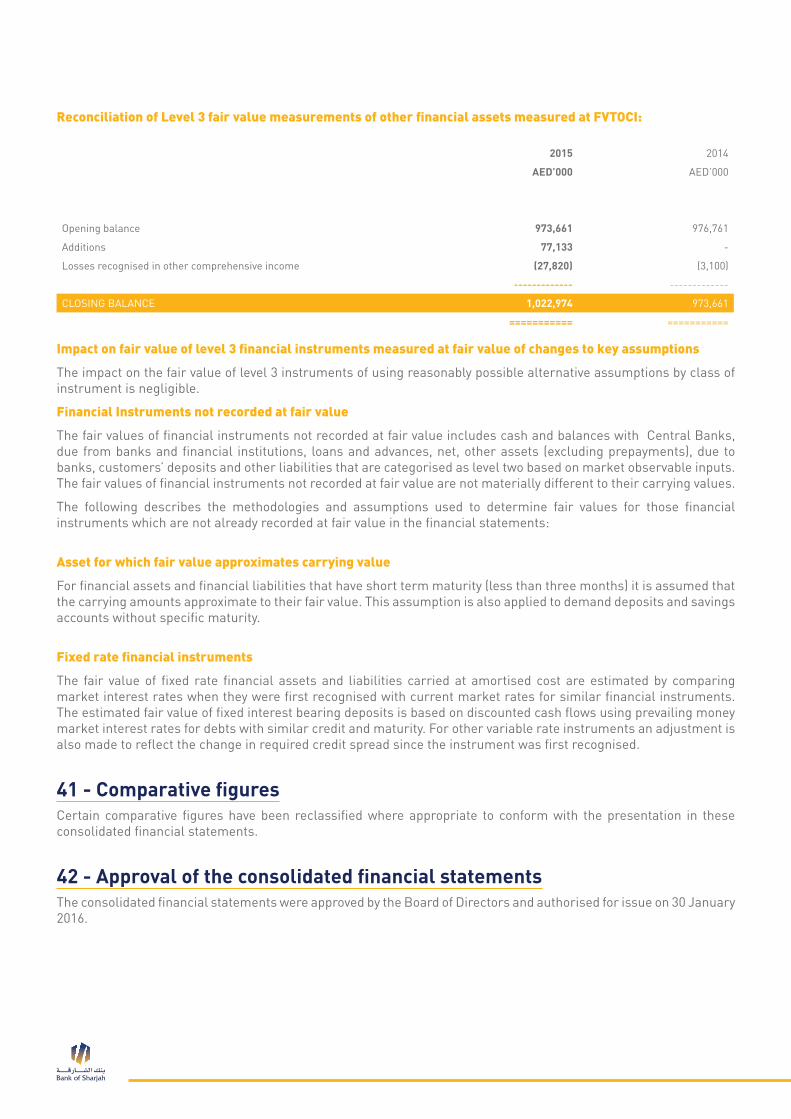
Reconciliation of Level 3 fair value measurements of other financial assets measured at FVTOCI:
2015 2014
AED’000 AED’000
Opening balance 973,661 976,761
Additions 77,133 -
Losses recognised in other comprehensive income (27,820) (3,100)
------------- -------------
CLOSING BALANCE 1,022,974 973,661
=========== ===========
Impact on fair value of level 3 financial instruments measured at fair value of changes to key assumptions
The impact on the fair value of level 3 instruments of using reasonably possible alternative assumptions by class of instrument is negligible.
Financial Instruments not recorded at fair value
The fair values of financial instruments not recorded at fair value includes cash and balances with Central Banks, due from banks and financial institutions, loans and advances, net, other assets (excluding prepayments), due to banks, customers’ deposits and other liabilities that are categorised as level two based on market observable inputs. The fair values of financial instruments not recorded at fair value are not materially different to their carrying values.
The following describes the methodologies and assumptions used to determine fair values for those financial instruments which are not already recorded at fair value in the financial statements:
Asset for which fair value approximates carrying value
For financial assets and financial liabilities that have short term maturity (less than three months) it is assumed that the carrying amounts approximate to their fair value. This assumption is also applied to demand deposits and savings accounts without specific maturity.
Fixed rate financial instruments
The fair value of fixed rate financial assets and liabilities carried at amortised cost are estimated by comparing market interest rates when they were first recognised with current market rates for similar financial instruments. The estimated fair value of fixed interest bearing deposits is based on discounted cash flows using prevailing money market interest rates for debts with similar credit and maturity. For other variable rate instruments an adjustment is also made to reflect the change in required credit spread since the instrument was first recognised.
41 - Comparative figuresCertain comparative figures have been reclassified where appropriate to conform with the presentation in these consolidated financial statements.
42 - Approval of the consolidated financial statementsThe consolidated financial statements were approved by the Board of Directors and authorised for issue on 30 January 2016.

95
Consolidated Statement of other Comprehensive Incomefor the year ended 31 December 2015

Graphs

97
Evolution of Total Assets, Liabilities and Shareholders’ Equity تطور مجموع الموجودات، المطلوبات و حقوق المساهمين
Evolution of Total Advances Deposits, and Net Liquidity تطور مجموع التسهيالت، الودائع و السيولة الصافية
30,000
2%
3%
-4%
Assets Liabilities Equity
0% 4% 1% 5%
11%11% 0%
11%9%
9% 0%
10%
25,000
20,000
AED
Mill
ions
15,000
10,000
5,000
0
2011 2012 2013 2014 2015
2011 2012 2013 2014 2015
-1% 3%6%
7%7% 4%
10%
12%-3%9%
25,000
20,000
15,000
10,000
5,000
0
2%26%
23%18%
23%
Advances Deposits Net Liquidity
AED
Mill
ions
Evolution of Capital, Equity & Profitتطور رأس المال و حقوق المساهمين و ا�رباح
AED
Mill
ions
5,000
4,500
4,000
3,500
3,000
2,500
2,000
1,500
1,000
500
500
400
300
200
100
00
2011
Capital Equity Net Profit Comprehensive Income
2012 2013 2014 2015
242
254
4,199 4,1824,353 4,413
4,622
277
433
273
353286
228250
309

AED
Mill
ions
Evolution of Deposits and Advancesتطور الودائع و القروض
Distribution of Loans & Advances by Economic Sector توزيع القروض و السلفيات حسب القطاع ا�قتصادي
Distribution of Loans & Advances by Economic Sector توزيع القروض و السلفيات حسب القطاع ا�قتصادي
25,000
20,000
15,000
10,000
5,000
02011 2012 2013 2014 2015
82%
81%
76%
71%
79%
77%
80%
78%
76%
74%
72%
70%
68%
66%
Advances Deposits Ratio A/D
Trading
Services
Manufacturing
Construction
Public utilities
Personal loans for commercialpurposesPersonal loans for individualpurposesMining and quarrying
Transport and communication
Financial Institution
Goverment
Agriculture
Other
27.8%
13.7%
7.5%
3.0%
2.8%2.7%
38.2%
1.1%
0.6%0.1%0.23%
2.1%
0.7%3.3%
1.5%1.4% 0.1%
0.2%0.3%
2014 2015
38.4%
24.7%
13.3%
8.1%
4.5%
3.7%
3.0%2.7%
2.1%1.1%
0.6%
0.23%0.23%
2.8%
38.2%
27.8%
13.7%

99
AED
Mill
ions
Evolution of Deposits and Advancesتطور الودائع و القروض
Distribution of Loans & Advances by Economic Sector توزيع القروض و السلفيات حسب القطاع ا�قتصادي
Distribution of Loans & Advances by Economic Sector توزيع القروض و السلفيات حسب القطاع ا�قتصادي
25,000
20,000
15,000
10,000
5,000
02011 2012 2013 2014 2015
82%
81%
76%
71%
79%
77%
80%
78%
76%
74%
72%
70%
68%
66%
Advances Deposits Ratio A/D
Trading
Services
Manufacturing
Construction
Public utilities
Personal loans for commercialpurposesPersonal loans for individualpurposesMining and quarrying
Transport and communication
Financial Institution
Goverment
Agriculture
Other
27.8%
13.7%
7.5%
3.0%
2.8%2.7%
38.2%
1.1%
0.6%0.1%0.23%
2.1%
0.7%3.3%
1.5%1.4% 0.1%
0.2%0.3%
2014 2015
38.4%
24.7%
13.3%
8.1%
4.5%
3.7%
3.0%2.7%
2.1%1.1%
0.6%
0.23%0.23%
2.8%
38.2%
27.8%
13.7%
Investment Breakdown by Regionتوزيع ا�ستثمارات جغرافيا
Details of Investments by Classificationتصنيف ا�ستثمارات
Share Book Valueالقيمة الدفترية للسهم
Middle East & Africa:AED 1,513 Mn, 87%
Europe:AED 0.11 Mn
Dubai:AED 81Mn, 5%
Sharjah:AED 141Mn, 8%
GCC:AED 6 Mn
2015
2015
2014
Europe:AED 0.12 Mn Dubai:
AED 91 Mn, 5%Sharjah:AED 141 Mn, 8%
GCC:AED 6 Mn
Middle East & Africa:AED 1,526 Mn, 87%
Fair Value Through OtherComprehensive Income (Equity)
Measured at Amor�zed Cost Fair Value Through P&L (P&L)
65%30%
5%
2014
61%34%
5%
1973
1975
1977
1979
1981
1983
1985
1987
1989
1991
1993
1995
1997
1999
2001
2003
2005
2007
2009
2011
2013
2015
3.00
2.50
2.00
1.50
1.00
0.50
0.00

Evolution of Share Price month for the Year 2015تطور سعر ا�سهم بحسب الشهر لعام ٢٠١٥
Total Monthly Volume for the year 2015الحجم الكلي بحسب الشهر لعام ٢٠١٥
Volume & Value of Transactions for the Year 2015حجم وقيمة الصفقات لعام ٢٠١٥
Jan-15 Feb-15 Mar-15 Apr-15 May-15 Jun-15 Jul-15 Aug-15 Sep-15 Oct-15 Nov-15 Dec-15
2.5
2
1.5
1
0.5
0
30,000,000
25,000,000
20,000,000
15,000,000
10,000,000
5,000,000
0
7,38
9,73
0
2,31
5,62
6
2,19
7,99
8
27,5
68,4
51
3,89
2,69
5
3,71
7,42
3
1,67
9,02
2
7,13
6,85
4
1,45
2,65
8
13,1
51,5
52
383,
729
11,7
77,9
51
30,000,000
25,000,000
20,000,000
15,000,000
10,000,000
5,000,000
0Jan-15 Feb-15 Mar-15 Apr-15 May-15 Jun-15 Jul-15 Aug-15 Sep-15 Oct-15 Nov-15 Dec-15
50,000,000
VOLUME
45,000,000
40,000,000
35,000,000
30,000,000
25,000,000
20,000,000
15,000,000
10,000,000
5,000,000
Jan-15 Mar-15 May-15 Jul-15 Sep-15 Nov-150
VALUE
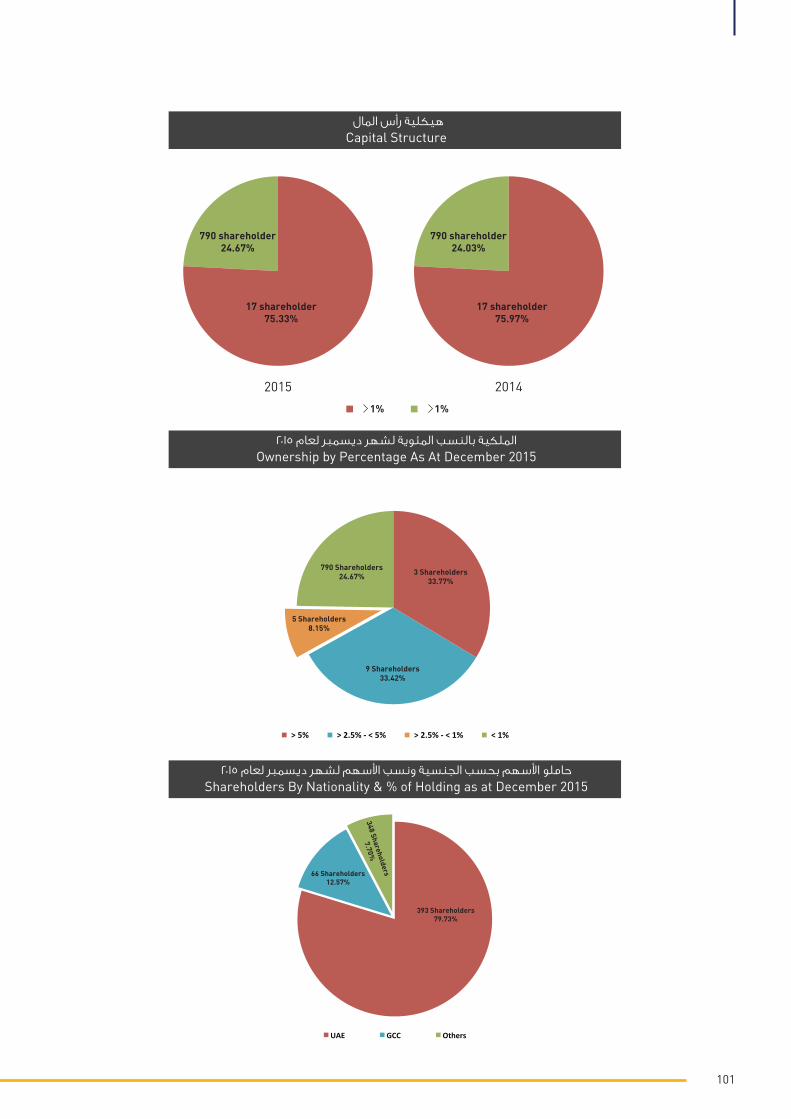
101
Evolution of Share Price month for the Year 2015تطور سعر ا�سهم بحسب الشهر لعام ٢٠١٥
Total Monthly Volume for the year 2015الحجم الكلي بحسب الشهر لعام ٢٠١٥
Volume & Value of Transactions for the Year 2015حجم وقيمة الصفقات لعام ٢٠١٥
Jan-15 Feb-15 Mar-15 Apr-15 May-15 Jun-15 Jul-15 Aug-15 Sep-15 Oct-15 Nov-15 Dec-15
2.5
2
1.5
1
0.5
0
30,000,000
25,000,000
20,000,000
15,000,000
10,000,000
5,000,000
0
7,38
9,73
0
2,31
5,62
6
2,19
7,99
8
27,5
68,4
51
3,89
2,69
5
3,71
7,42
3
1,67
9,02
2
7,13
6,85
4
1,45
2,65
8
13,1
51,5
52
383,
729
11,7
77,9
51
30,000,000
25,000,000
20,000,000
15,000,000
10,000,000
5,000,000
0Jan-15 Feb-15 Mar-15 Apr-15 May-15 Jun-15 Jul-15 Aug-15 Sep-15 Oct-15 Nov-15 Dec-15
50,000,000
VOLUME
45,000,000
40,000,000
35,000,000
30,000,000
25,000,000
20,000,000
15,000,000
10,000,000
5,000,000
Jan-15 Mar-15 May-15 Jul-15 Sep-15 Nov-150
VALUE
Capital Structure
Ownership by Percentage As At December 2015الملكية بالنسب المئوية لشهر ديسمبر لعام ٢٠١٥
Shareholders By Nationality & % of Holding as at December 2015حاملو ا�سهم بحسب الجنسية ونسب ا�سهم لشهر ديسمبر لعام ٢٠١٥
هيكلية رأس المال
2015
17 shareholder75.33%
790 shareholder24.67%
2014
17 shareholder75.97%
790 shareholder24.03%
1% 1%
3 Shareholders33.77%
9 Shareholders33.42%
5 Shareholders8.15%
790 Shareholders24.67%
> 5% > 2.5% - < 5% > 2.5% - < 1% < 1%
UAE GCC Others
393 Shareholders79.73%
66 Shareholders12.57%
348 Shareholders
7.70%
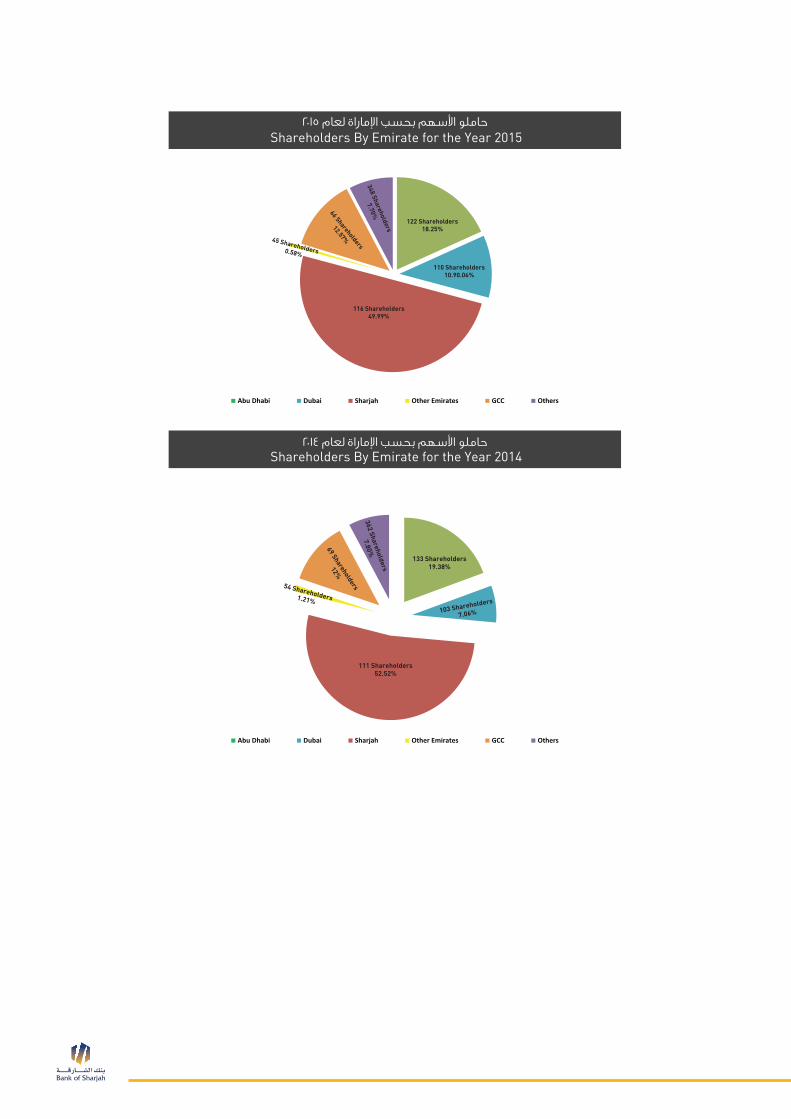
Shareholders By Emirate for the Year 2015
Shareholders By Emirate for the Year 2014
Abu Dhabi Dubai Sharjah Other Emirates GCC Others
Abu Dhabi Dubai Sharjah Other Emirates GCC Others
116 Shareholders49.99%
110 Shareholders10.90.06%
122 Shareholders18.25%
348 Shareholders
7.70%66 Shareholders
12.57%45 Shareholders0.58%
111 Shareholders52.52%
362 Shareholders
7.80%69 Shareholders
12%
103 Shareholders
7.06%
133 Shareholders19.38%
54 Shareholders1.21%
حاملو اسهم بحسب ا�ماراة لعام ٢٠١٥
حاملو اسهم بحسب ا�ماراة لعام ٢٠١٤

103
Shareholders By Emirate for the Year 2015
Shareholders By Emirate for the Year 2014
Abu Dhabi Dubai Sharjah Other Emirates GCC Others
Abu Dhabi Dubai Sharjah Other Emirates GCC Others
116 Shareholders49.99%
110 Shareholders10.90.06%
122 Shareholders18.25%
348 Shareholders
7.70%66 Shareholders
12.57%45 Shareholders0.58%
111 Shareholders52.52%
362 Shareholders
7.80%69 Shareholders
12%
103 Shareholders
7.06%
133 Shareholders19.38%
54 Shareholders1.21%
حاملو اسهم بحسب ا�ماراة لعام ٢٠١٥
حاملو اسهم بحسب ا�ماراة لعام ٢٠١٤
بيانات
Recommended