Annual Report 2010

PRofilE foREwoRd businEss PERfoRmAncE finAnciAl stAtEmEnts coRPoRAtE GovERnAncE
Into the future with innovation.
RUAG’s activities centre around its two market segments, Aerospace and Defence. Its production facilities are located in
Switzerland, Germany, Austria, Sweden, Hungary and the USA.
Aerospace
The Aerospace market segment comprises the Space, Aviation and Technology divisions. RUAG Space is Europe’s largest
independent space technology supplier. RUAG Aviation focuses on military and civil aviation. RUAG Technology develops and
produces components and provides services to the aviation, energy, semiconductor, automotive and recycling industries.
Defence
The Defence market segment comprises the Ammotec and Defence divisions. RUAG Ammotec is the global technology leader
in primer systems for small calibre ammunition and an acknowledged specialist in pyrotechnic solutions. RUAG Defence
specializes in heavy weapon systems, protection technologies, command and control systems and infrastructures, as well as
laser and computer supported training systems for land forces.
Strategic focus
CIVIL
MILITARY
Geography Products Applications Markets
SWITZERLANDEUROPE
AMERICASASIA
SPACE
AVIATION
TECHNOLOGY
AMMOTEC
AEROSPACE
DEFENCEDEFENCE
PEOPLE
COMPANY VALUE

PRofilE foREwoRd businEss PERfoRmAncE finAnciAl stAtEmEnts coRPoRAtE GovERnAncE
Global with strong Swiss roots
RUAG is set to achieve international growth with all five
operating divisions. Building on RUAG’s already strong
presence in Germany, activities are progressively being
expanded in Europe, North America and Asia. In 2010, the
focus was on sustainably profitable core activities in aero-
space and defence. At the same time, risks were minimized.
An essential instrument for this purpose is transparent
leadership on the basis of strict strategic and financial rules,
which are expressed for the first time in segment reporting
(at division level) in this Annual Report.
Return to profit
The 2010 financial year was marked by initial success in
implementing RUAG’s strategy of tightening its focus and
minimizing risks, and thus returning to profit. Whereas
in the previous year, RUAG had to grapple with serious
problems in Aerostructures, Business Aviation and the
automotive and semiconductor industry supply business,
the Group boosted net sales by 6% in 2010 to CHF 1796
million. EBIT totalled CHF 98 million. Net profit reached a
pleasing figure of CHF 92 million, and four of the Group’s
five operating divisions posted a positive EBIT. A turnaround
was successfully instigated in all areas that were previously
unprofitable. The number of employees rose by 2% to 7719.
Due in particular to acquisitions, research and development
expenses rocketed up by 27% to CHF 190 million.
Sales by region in %
0% 20% 40% 60% 80% 100%
Switzerland
Europe
US
Asia
Other
45
43
7
3
3
2
2
43
43
9
DDPS proportion 2009 2010
Civil
Military
Sales by usage type in %
0% 20% 40% 60% 80% 100%
47
5336
52
4835
Overview of key figuresin CHF million 2010 2009 Change in %
Orders received 1 713 1 872 –8.5%
Net sales 1 796 1 696 5.9%
Net cash flows from operating activities 130 131 –0.5%
Orders on hand 1 654 1 783 –7.3%
EBIT 98 –113 n.a.
EBITDA 194 38 409.2%
Net profit 92 –107 n.a.
Research and development expenses 190 149 27.3%
Employees as at 31 December 7 719 7 534 2.5%
CAGR = cumulated average growth rate
Detailed figures are provided in Note 39 to the consolidated financial statements, “Operating segments”.
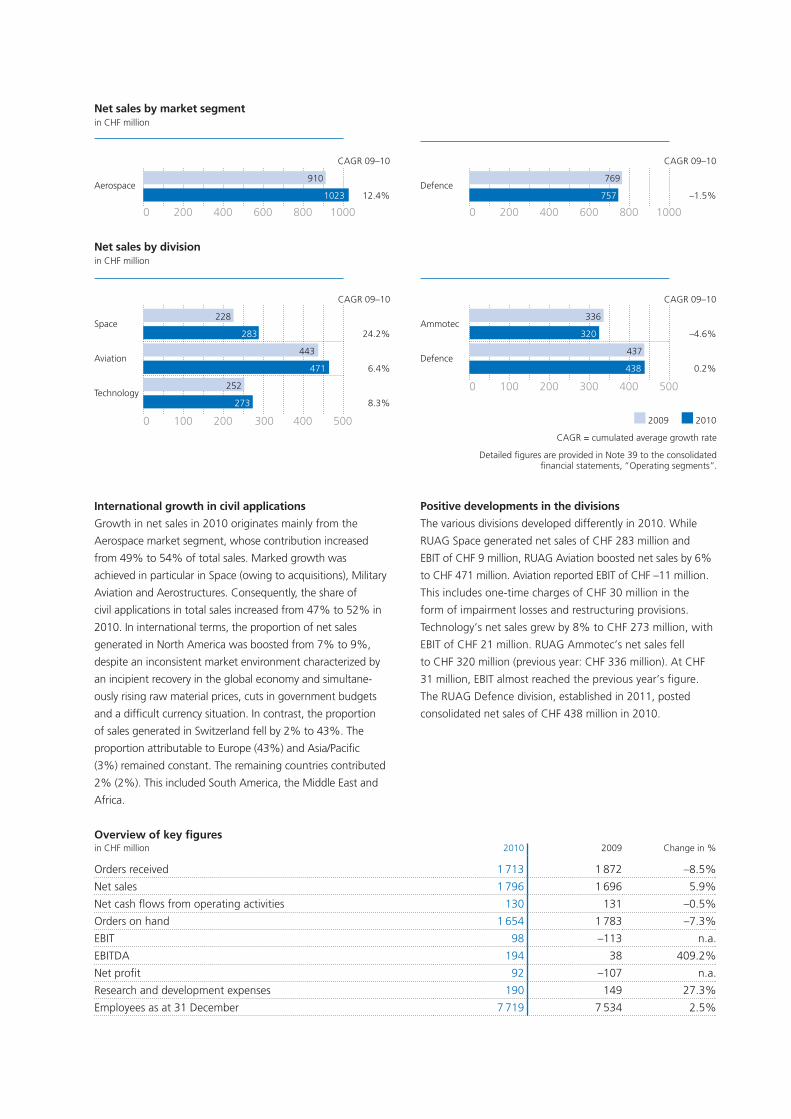
International growth in civil applications
Growth in net sales in 2010 originates mainly from the
Aerospace market segment, whose contribution increased
from 49% to 54% of total sales. Marked growth was
achieved in particular in Space (owing to acquisitions), Military
Aviation and Aerostructures. Consequently, the share of
civil applications in total sales increased from 47% to 52% in
2010. In international terms, the proportion of net sales
generated in North America was boosted from 7% to 9%,
despite an inconsistent market environment characterized by
an incipient recovery in the global economy and simultane-
ously rising raw material prices, cuts in government budgets
and a difficult currency situation. In contrast, the proportion
of sales generated in Switzerland fell by 2% to 43%. The
proportion attributable to Europe (43%) and Asia/Pacific
(3%) remained constant. The remaining countries contributed
2% (2%). This included South America, the Middle East and
Africa.
Positive developments in the divisions
The various divisions developed differently in 2010. While
RUAG Space generated net sales of CHF 283 million and
EBIT of CHF 9 million, RUAG Aviation boosted net sales by 6%
to CHF 471 million. Aviation reported EBIT of CHF –11 million.
This includes one-time charges of CHF 30 million in the
form of impairment losses and restructuring provisions.
Technology’s net sales grew by 8% to CHF 273 million, with
EBIT of CHF 21 million. RUAG Ammotec’s net sales fell
to CHF 320 million (previous year: CHF 336 million). At CHF
31 million, EBIT almost reached the previous year’s figure.
The RUAG Defence division, established in 2011, posted
consolidated net sales of CHF 438 million in 2010.
Net sales by market segmentin CHF million
0 200 400 600 800 1000
CAGR 09–10
12.4%Aerospace
0 200 400 600 800 1000
CAGR 09–10
–1.5%Defence
0 100 200 300 400 500
CAGR 09–10
–4.6%
0.2%
Ammotec
Defence
Net sales by division in CHF million
0 100 200 300 400 500
CAGR 09–10
24.2%
6.4%
8.3%
Space
Aviation
Technology
2009 2010
910
228
437
336
443
252
283 320
438471
273
1023
769
757
RUAG AnnUAl RepoRt 2010 5
Contents.
Foreword
Business Performance
Space
Aviation
Technology
Ammotec
Defence
Service & Support units
Financial Statements
Corporate Governance
Board of Directors
Executive Board
Compensation
Capital structure and shareholders
Employee benefits
Statutory auditor and information policy
Forthcoming Events
6
12
16
20
24
28
32
40
98
101
103
106
107
108
109
6 RUAG AnnUAl RepoRt 2010
pRofile foRewoRd bUsiness peRfoRmAnce finAnciAl stAtements coRpoRAte GoveRnAnce
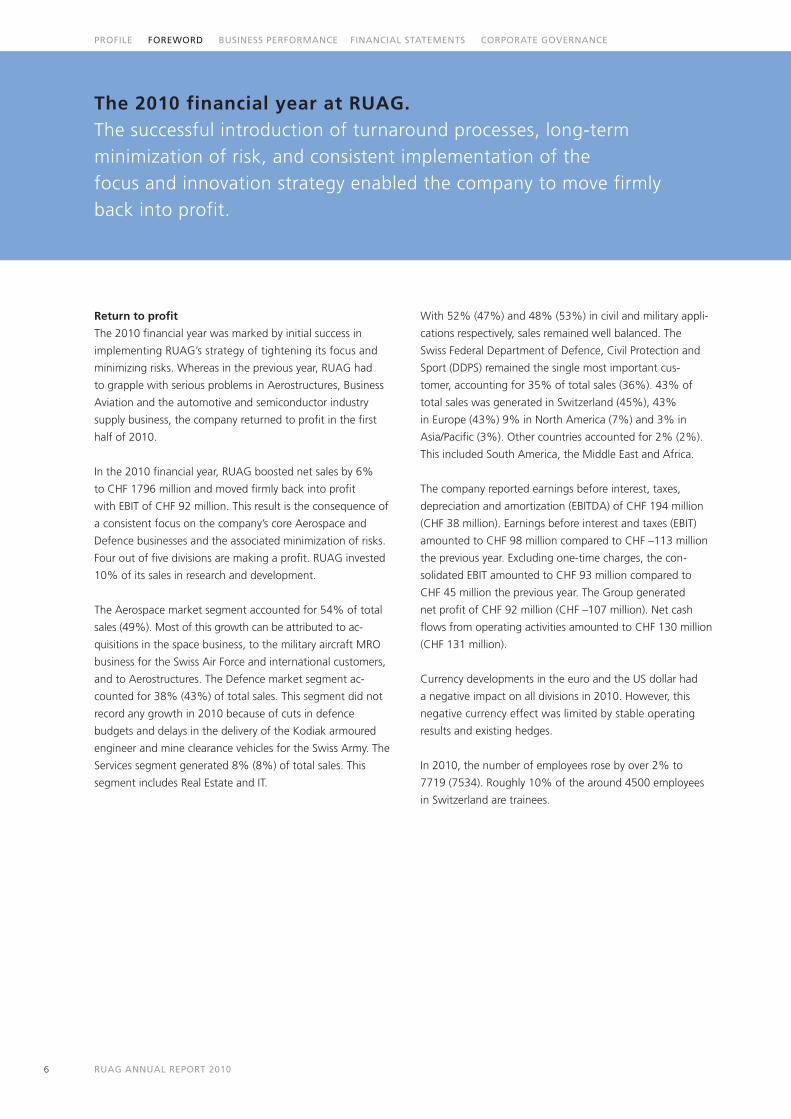
The 2010 financial year at RUAG. The successful introduction of turnaround processes, long-term
minimization of risk, and consistent implementation of the
focus and innovation strategy enabled the company to move firmly
back into profit.
Return to profit
The 2010 financial year was marked by initial success in
implementing RUAG’s strategy of tightening its focus and
minimizing risks. Whereas in the previous year, RUAG had
to grapple with serious problems in Aerostructures, Business
Aviation and the automotive and semiconductor industry
supply business, the company returned to profit in the first
half of 2010.
In the 2010 financial year, RUAG boosted net sales by 6%
to CHF 1796 million and moved firmly back into profit
with EBIT of CHF 92 million. This result is the consequence of
a consistent focus on the company’s core Aerospace and
Defence businesses and the associated minimization of risks.
Four out of five divisions are making a profit. RUAG invested
10% of its sales in research and development.
The Aerospace market segment accounted for 54% of total
sales (49%). Most of this growth can be attributed to ac-
quisitions in the space business, to the military aircraft MRO
business for the Swiss Air Force and international customers,
and to Aerostructures. The Defence market segment ac-
counted for 38% (43%) of total sales. This segment did not
record any growth in 2010 because of cuts in defence
budgets and delays in the delivery of the Kodiak armoured
engineer and mine clearance vehicles for the Swiss Army. The
Services segment generated 8% (8%) of total sales. This
segment includes Real Estate and IT.
With 52% (47%) and 48% (53%) in civil and military appli-
cations respectively, sales remained well balanced. The
Swiss Federal Department of Defence, Civil Protection and
Sport (DDPS) remained the single most important cus-
tomer, accounting for 35% of total sales (36%). 43% of
total sales was generated in Switzerland (45%), 43%
in Europe (43%) 9% in North America (7%) and 3% in
Asia/Pacific (3%). Other countries accounted for 2% (2%).
This included South America, the Middle East and Africa.
The company reported earnings before interest, taxes,
depreciation and amortization (EBITDA) of CHF 194 million
(CHF 38 million). Earnings before interest and taxes (EBIT)
amounted to CHF 98 million compared to CHF –113 million
the previous year. Excluding one-time charges, the con-
solidated EBIT amounted to CHF 93 million compared to
CHF 45 million the previous year. The Group generated
net profit of CHF 92 million (CHF –107 million). Net cash
flows from operating activities amounted to CHF 130 million
(CHF 131 million).
Currency developments in the euro and the US dollar had
a negative impact on all divisions in 2010. However, this
negative currency effect was limited by stable operating
results and existing hedges.
In 2010, the number of employees rose by over 2% to
7719 (7534). Roughly 10% of the around 4500 employees
in Switzerland are trainees.
7RUAG AnnUAl RepoRt 2010
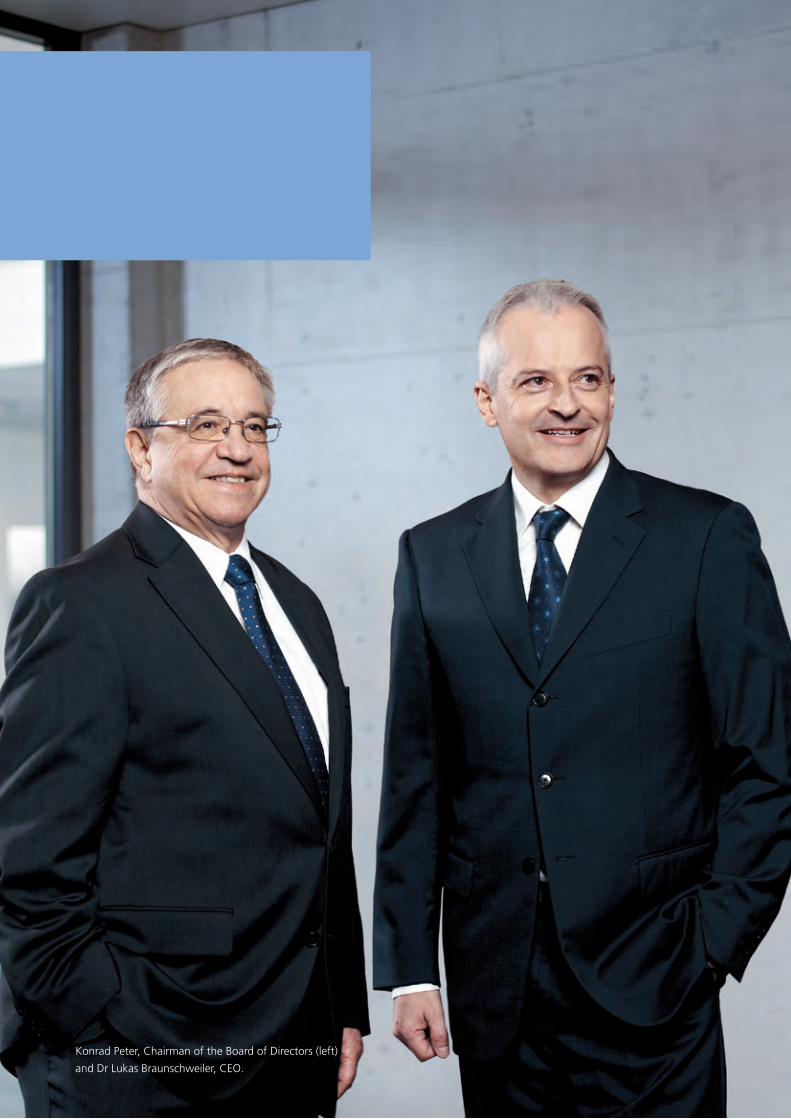
Konrad Peter, Chairman of the Board of Directors (left)
and Dr Lukas Braunschweiler, CEO.

8 RUAG AnnUAl RepoRt 2010
pRofile foRewoRd bUsiness peRfoRmAnce finAnciAl stAtements coRpoRAte GoveRnAnce
Tightened focus and risk minimization
From management’s perspective, 2010 was centred on
focussing the divisions’ activities on sustainably profitable
core activities in Aerospace and Defence. Parallel to this,
the company pursued a policy of minimizing risks through a
clear strategy of innovation and ongoing internationalization
of activities. An essential instrument to advance these objec-
tives is transparent leadership on the basis of strict strategic
and financial rules, which are expressed for the first time in
segment reporting (at division level) in this Annual Report.
In the pursuit of risk minimization, important goals were
achieved in 2010. A successful start was made in turning
around the Aviation and Technology divisions. Targeted
restructuring measures were successfully implemented to
this end. One improvement in the Aviation division was
streamlining the organization of civil aircraft MRO. In the
Technology division, Aerostructures concluded a long-term
contract with Airbus, a major client, which will stabilize its
future, and also achieved growth in this area. In contrast,
despite numerous efforts, a long-term solution could not be
found for the Plan-les-Ouates site. Work commenced on
establishing a Group-wide risk management system, which
will enable the Group to actively manage risks over the long
term and to adopt suitable corrective measures in time.
A consistently high rate of innovation is crucial for RUAG’s
future growth. To pursue this goal, RUAG has implemented
structured innovation management and substantially in-
creased its total spending on research and development by
27% to CHF 190 million (CHF 149 million) in the year under
review.
Space: internationalization
In 2010, RUAG Space generated net sales of CHF 283 million.
The post-merger integration of Oerlikon Space AG, which was
acquired in mid-2009, is largely completed.
As Europe’s largest independent space supplier with operations
in Switzerland, Sweden and Austria, RUAG Space is specialized
in systems for use on board satellites and launch vehicles. The
largest orders in 2010 included assemblies worth EUR 35 million
for the European Galileo satellite navigation programme.
Today, with a redefined and refocused product portfolio, the
three national Space subsidiaries are able to compete more
effectively in the global market as Europe's biggest independent
space supplier. Moreover, RUAG was able to expand its cus-
tomer base in the USA and Asia. RUAG Space is thus well set to
successfully participate in the expected growth in global com-
mercial space activities.
The division generated EBIT of CHF 9 million.
9RUAG AnnUAl RepoRt 2010
Aviation: concentration
RUAG Aviation increased net sales by 6% to CHF 471 million.
The core business of the division, of which Philipp M. Berner
became CEO on December 1, 2010, is the maintenance,
repair and overhaul of military and civil aircraft and the pro-
vision of specific products, subsystems and components for
a broad aviation clientele. On the basis of its solid foundation
in Switzerland, the proportion of sales generated by Military
Aviation has also grown well internationally. In future, RUAG
intends to make greater use of synergies between the
business units and areas of activity and focus resolutely on
sustainably profitable operations. Possibilities have been
identified in the area of Components in particular. Among
Aviation’s major successes was the maiden flight of the
prototype for the upgrade programme for the Swiss Air
Force’s TH-89 Super Puma/Cougar helicopters, strategi-
cally important Super Puma maintenance contracts from
Slovenia and Finland, and maintenance contracts for the
Royal Malaysian Air Force’s F/A-18 Hornet engine modules.
Considerable progress has been made in turning round
Business Aviation, which came under pressure in 2009 as a
result of the economic crisis, and a substantial improvement
has been achieved. Currently, the site network is being
streamlined and specific competencies concentrated at
particular locations.
Aviation reported EBIT of CHF –11 million. This includes one-
time charges of CHF 30 million in the form of impairment
losses and restructuring provisions. Capacity adjustments have
been made at the Aviation site in Oberpfaffenhofen (Ger-
many) in the light of cuts in the German defence budget and
delayed sales successes of the Do 228NG.
Technology: turnaround
In 2010, RUAG Technology successfully boosted net
sales by 8% to CHF 273 million. The division manufactures
and processes structural assemblies and high-quality
components and provides special services to customers in
the aviation, semiconductor, energy, automotive and
recycling industries. The turnaround initiated in 2009 is
well underway. A series of restructuring measures already
considerably improved the foundations of Technology’s
business in 2010. This was achieved by focusing on high-
value, profitable specialist products and niche applications
on the one hand and minimizing risks on the other. In
autumn 2010, RUAG strengthened its longstanding part-
nership with Airbus by signing new contracts with an
expandable annual order volume of CHF 85 million. Busi-
ness and currency risks were also minimized. RUAG Tech-
nology is the exclusive supplier for all wingtip fences for
current Airbus models and is responsible for the entire
supply chain for certain fuselage sections for aircraft in the
Airbus A320, A330 and A340 families. In addition, a
recovery in the semiconductor industry, for which RUAG
manufactures large precision parts, also contributed to
an improvement in the situation. Despite various efforts, it
was not possible to sustainably return the Plan-les-Ouates
site to profit. The Plan-les-Ouates site will be closed in June
2012 if its activities cannot be successfully spun off by
then.
In 2010, RUAG Technology generated EBIT of CHF 21 million.
This includes a net amount of CHF 35 million in positive
one-time effects from the reversal of write-downs on inven-
tories and of provisions.

10 RUAG AnnUAl RepoRt 2010
pRofile foRewoRd bUsiness peRfoRmAnce finAnciAl stAtements coRpoRAte GoveRnAnce
Ammotec: specialization
In 2010, RUAG Ammotec generated net sales of CHF 320
million. Ammotec specializes in high-quality pyrotechnic
products for military and civil markets and for industry. Activi-
ties include developing and manufacturing small-calibre
ammunition for hunting and sport as well as armed forces
and government agencies. Although the market environ-
ment was challenging on account of overcapacity and cuts
in government budgets, overall Ammotec was able to
defend its strong market position.
Owing to fierce competition, only part of the sharp increases
in commodity prices could be passed on to customers. In
2010, there was a gratifying turnaround in the market for
hunting and sports ammunition, which had come under
pressure in 2009. However, higher sales volumes were partially
offset by price erosion in the important US market.
Industrial pyrotechnics also reported a positive development
in 2010. The biggest success in this respect is a long-term
supply contract with Hilti for low-pollutant actuator cartridg-
es. This major contract required considerable investment in
new production capacities.
The EBIT of the division was CHF 31 million. Despite negative
currency effects, this result almost equalled that of 2010.
Defence: market proximity
In 2010, RUAG Defence generated net sales of CHF 438
million. RUAG Defence was formed as a new division on
1 January 2011 from the merger of the core businesses of
the former divisions RUAG Electronics and RUAG Land
Systems. The division is managed by Urs Breitmeier.
The merger was a consequence of the fact that both former
divisions sold their products and services in the same inter-
national land forces market. The merger not only makes it
easier to address customers, in particular the DDPS, the
biggest customer – it has also made it possible to offer a
single-source, more comprehensive and, in many fields,
complementary portfolio of products and services in the
international market. RUAG Defence specializes in maintain-
ing and upgrading heavy weapon systems, ballistic protec-
tion systems, virtual and live simulation training systems and
system integration and development of command and
control systems.
Successes in 2010 in Switzerland included the upgrade
programme for the Leopard 2 main battle tank, a command
information system (FIS HE) and further contracts for the
Kodiak armoured engineer and mine clearance vehicle based
on converted Leopard 2 chassis. Contracts have been signed
for a total of 42 such vehicles. RUAG Defence is also the
Swiss Army centre of excellence for combat training centres
based on the state-of-the-art SIMUG laser firing simulation
platform, as well as a full service provider for all operating
matters. In 2010, the division was appointed as the materiel
centre of excellence for the DDPS’s integrated radio recon-
naissance and transmission system (IFASS).
The Defence division generated EBIT of CHF 32 million.

11RUAG AnnUAl RepoRt 2010
Service & Support units
To enable the divisions to focus on their business and techno-
logical competencies and efficient performance, RUAG has
concentrated its infrastructure services – real estate manage-
ment and IT services – in two centralized support units, RUAG
Real Estate and RUAG Services. As a professional real estate
management company, RUAG Real Estate is in a better
position to successfully increase the long-term return on the
Group’s considerable real estate holdings. Already in 2010,
net sales increased by 4% to CHF 90 million. EBIT amounted
to CHF 19 million. At present, master plans to further in-
crease the value of the bigger sites and industrial parks are
being drawn up and implemented. In 2010, RUAG Services,
the Group’s quality-certified IT services unit, also increased
net sales by 14% to CHF 33 million. The new, centralized
Software House will in future not only provide network, server,
SAP and workplace services, but also concentrate and stand-
ardize software development competencies.
Human Resources, Secretary General & Legal Services,
Marketing & Communication, Finance & Controlling and Risk
Management are central Group units that function as key
control tools for the company's management. They work
closely with the divisions to ensure consistent focus and
implementation of the company’s strategy. Particular impor-
tance is attached to human resources policy. Highly qualified,
motivated staff are the prerequisite for RUAG's innovation
strategy. Attracting, retaining and helping these employees
to further develop their skills is therefore decisive to RUAG’s
success. Well-trained skilled staff are just as essential to
RUAG as qualified university graduates. In 2010, the number
of employees rose by 2% to 7719 (7534). Roughly 10% of
the approx. 4500 employees in Switzerland are trainees.
Outlook
While the global recovery from the economic crisis is likely
to continue, clouds on the horizon include the persistent
strength of the Swiss franc and rising commodity prices. In
expanding its sales internationally, RUAG is making an
important contribution to Switzerland’s security and inde-
pendence by ensuring that the Swiss Armed Forces and Swiss
economy retain access to essential technological expertise.
In view of rising state budget deficits, orders from govern-
ment agencies and military markets are likely to decline.
RUAG intends to counter this trend by tapping new markets
both geographically and through product and service innova-
tions. In this way, RUAG is acting on its responsibility as a
joint stock company under private law wholly owned by the
Swiss Confederation.
The Board of Directors and Executive Board agree that RUAG
faces significant challenges. Against this backdrop, we owe
special thanks to our customers for their confidence and
custom, to our shareholder for a positive working relation-
ship, and to our employees for their great dedication.
We look forward to achieving further progress for RUAG
together with you.
Konrad Peter
Chairman of the Board of Directors of RUAG Holding Ltd
Dr Lukas Braunschweiler
CEO of RUAG Holding Ltd
12 RUAG AnnUAl RepoRt 2010
pRofile foRewoRd bUsiness peRfoRmAnce spAce finAnciAl stAtements coRpoRAte GoveRnAnce
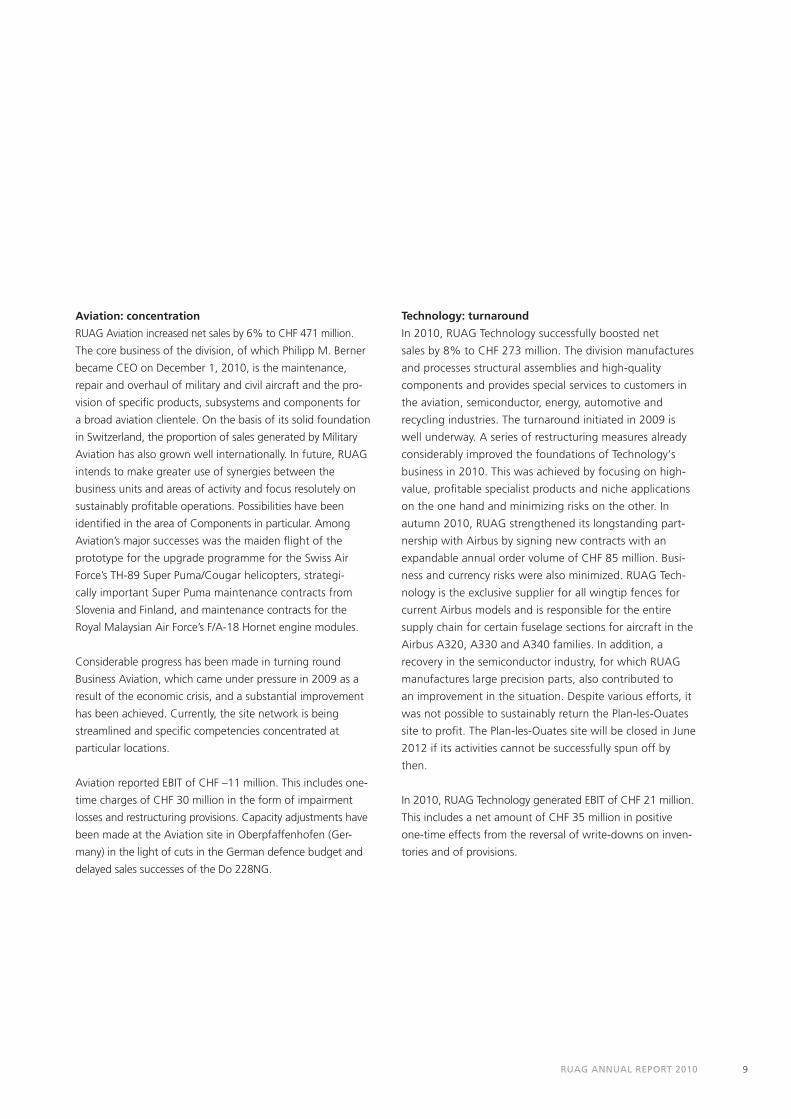
Space. With a broad-based portfolio of subsystems and equipment
for satellites and launch vehicles, RUAG Space is the leading independent
supplier of space products in Europe.

13RUAG AnnUAl RepoRt 2010
RUAG Space in numbers
Net sales: CHF 283 m
EBITDA: CHF 30 m
EBIT: CHF 9 m
Employees: 1088
Locations: Switzerland, Sweden, Austria
Core business
As the leading independent supplier of space products in
Europe, RUAG Space specializes in component assemblies for
use on board satellites and launch vehicles. The division devel-
ops, manufactures and tests a broad spectrum of products
for institutional and commercial customers. The five major
product areas are structures and separation systems for
launch vehicles, structures and mechanisms for satellites,
digital electronics for satellites and launch vehicles, satellite
communications equipment and satellite instruments.
The three national subsidiaries in Switzerland, Sweden and
Austria are established founding partners in the institutional
programmes of the European Space Agency ESA and the
Ariane European launch vehicle programme. Most European
space missions are controlled and monitored by RUAG Space
computers. Precision mechanisms, slip rings, thermal systems
and satellite structures have been key factors in the success
of many space projects.
RUAG Space has applied the capabilities developed for
institutional programmes to gain a foothold in the commer-
cial space market as well. The division is market leader in
composite payload fairings, in adapters and in launch vehicle
and satellite separation systems. Additional products for
the commercial market include receivers and converters for
telecommunication satellites, thermal insulation, pointing
mechanisms for electric propulsion thrusters, solar array drive
mechanisms and mechanical ground support equipment.
Quality niche products such as microchip lithography mecha-
nisms, thermal insulation for medical devices and high-end
slip rings are also supplied to customers outside the space
industry.
Business performance
RUAG Space achieved net sales of CHF 283 million in finan-
cial year 2010. Due to the acquisition of Oerlikon Space AG
in mid-2009, a direct comparison with the prior year is not
possible. EBIT was CHF 9 million.
The most important new order in 2010 was related to
the European Union’s Galileo satellite navigation system.
RUAG Space will deliver subsystems with a total value
of EUR 35 million for 14 navigation satellites, including the
satellites’ central control computers as well as antennas
and other electronic components. The mechanisms used to
position the solar arrays and the thermal insulation to
protect the electronics on board the satellites against the
extreme temperature fluctuations of space will also be
supplied by RUAG Space. Furthermore, the division is also
developing and manufacturing the dispenser used to mount
the satellites in pairs in the nose of the Soyuz launch vehicle.
The European environmental satellite CryoSat-2 was launched
in April 2010. This ESA satellite will carry out research on
changes in the global ice caps using a highly sophisticated
radar instrument. This instrument’s “eyes”, two special radar
antennas, were developed and built by RUAG Space. RUAG
Space also supplied the structure of the satellite, the thermal
insulation and equipment for transport and testing on the
ground.
14 RUAG AnnUAl RepoRt 2010
pRofile foRewoRd bUsiness peRfoRmAnce spAce finAnciAl stAtements coRpoRAte GoveRnAnce
“TODAy, RUAG IS ON BOARD
OF NEARLy EvERy EUROPEAN
SPACE MISSION.”DR PETER GUGGENBACH, CEO RUAG SPACE
2010 was a record year for payload fairings, with a total
of nine successful launches of launch vehicles carrying RUAG
fairings. One of these was the largest fairing ever built in
Europe at a height of 23.5 metres, used in the September
launch of a satellite from vandenberg Air Force Base, Cali-
fornia on an American Atlas v rocket.
The division set other records in 2010 as well: with 139 flight
units, more receivers and converters were delivered than
ever before, and 24 RUAG antennas began their journey into
space aboard a single rocket in the launch of 6 Globalstar
satellites. The customer base in the commercial market also
grew in 2010, especially outside Europe. For example,
RUAG Space won its first order from American satellite builder
General Dynamics for X-band antennas. The business rela-
tionship with Canada’s MacDonald, Dettwiler and Associates
Ltd. (MDA) was strengthened with a follow-up contract for
antenna deployment mechanisms. In Asia too, RUAG Space’s
position was bolstered, with radiation monitors being deliv-
ered for the first time to Japanese satellite producer Mitsubishi
Electric.
Innovations and initiatives
Research and development efforts are focussed on systema-
tically strengthening and improving the existing strategically
defined product portfolio of the three national subsidiaries.
At the centre are products of interest to growth markets
outside of institutional space missions, such as equipment for
satellite-supported telecommunications. In this area, RUAG
Space qualified a new C-band receiver and a new cross-
converter between the C and Ku bands in the microwave
spectrum in 2010.
The list of current development projects ranges from pay-
load fairings, adapters and separation systems for the
upcoming European vega launch vehicle, through precision
pointing mechanisms for electric propulsion thrusters and
solar array drive mechanisms, to precision GPS receivers for
fixing exact locations in earth orbit.
In production, the expanded order volume of recent years
has driven expansion and modernization of existing facilities,
including new cleanrooms commissioned in Zurich at the
end of 2010. These provide an additional 400 square metres
of state-of-the-art rooms of various cleanliness classes for
the production of mechanisms and optical systems. In vienna,
a new laser cold-cutting plant for thermal insulation entered
service. Additionally, two extensions are currently being built
in vienna and at the second Austrian site in Berndorf.
15RUAG AnnUAl RepoRt 2010
Outlook and strategy
RUAG Space operates in a relatively stable market environ-
ment. Thanks to the long cycles of space programmes and
the high proportion of institutional customers, the business
is exposed to few cyclical fluctuations.
Growth drivers in recent years have primarily included re -
placement of satellite fleets by commercial telecommunica-
tion operators. This market segment is expected to slow
down initially in the next few years. In the medium and long
term, however, we anticipate renewed growth in this im-
portant market segment. Key engines of growth include the
ambitious programmes of emerging nations in Asia and the
rise of new application areas, particularly in earth observation
and navigation.
With a focussed product portfolio, RUAG Space finds itself
in a good starting position to participate in the expected
market growth. The decisive factors will be the successful
development of innovative products along with determined
efforts to tap into new market segments outside Europe.
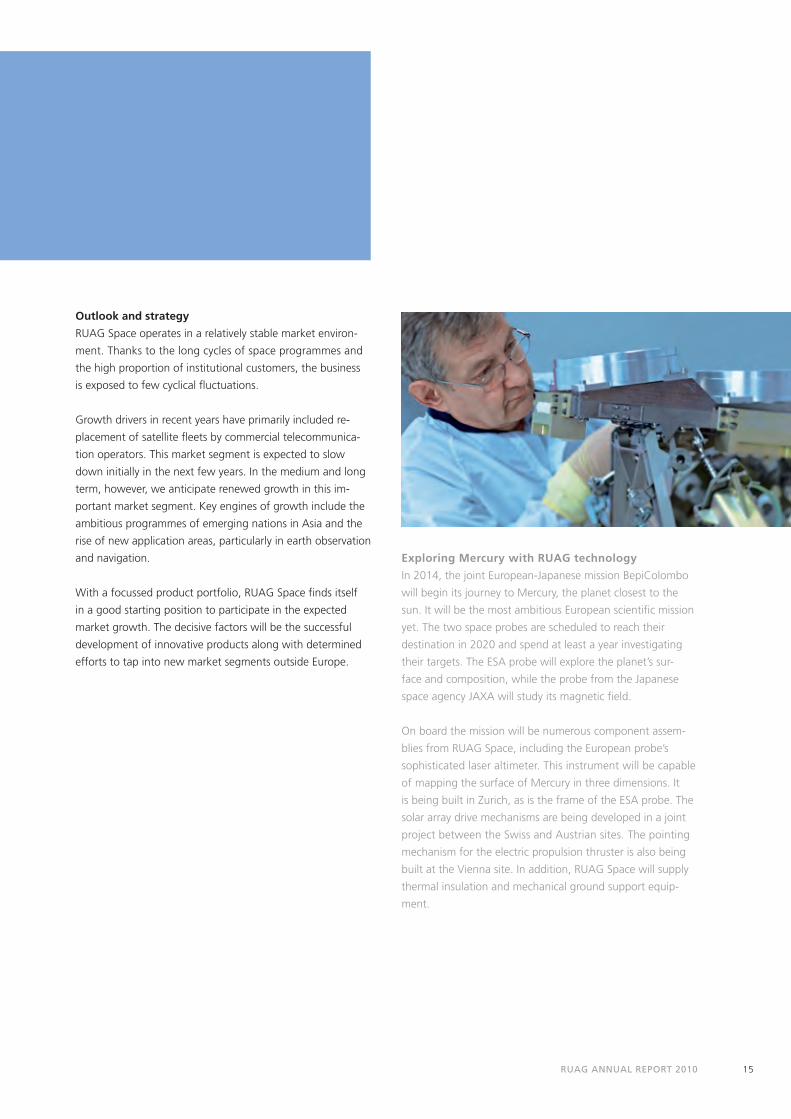
Exploring Mercury with RUAG technology
In 2014, the joint European-Japanese mission BepiColombo
will begin its journey to Mercury, the planet closest to the
sun. It will be the most ambitious European scientific mission
yet. The two space probes are scheduled to reach their
destination in 2020 and spend at least a year investigating
their targets. The ESA probe will explore the planet’s sur-
face and composition, while the probe from the Japanese
space agency JAXA will study its magnetic field.
On board the mission will be numerous component assem-
blies from RUAG Space, including the European probe’s
sophis ticated laser altimeter. This instrument will be capable
of mapping the surface of Mercury in three dimensions. It
is being built in Zurich, as is the frame of the ESA probe. The
solar array drive mechanisms are being developed in a joint
project between the Swiss and Austrian sites. The pointing
mechanism for the electric propulsion thruster is also being
built at the vienna site. In addition, RUAG Space will supply
thermal insulation and mechanical ground support equip-
ment.
16 RUAG AnnUAl RepoRt 2010
pRofile foRewoRd bUsiness peRfoRmAnce AviAtion finAnciAl stAtements coRpoRAte GoveRnAnce
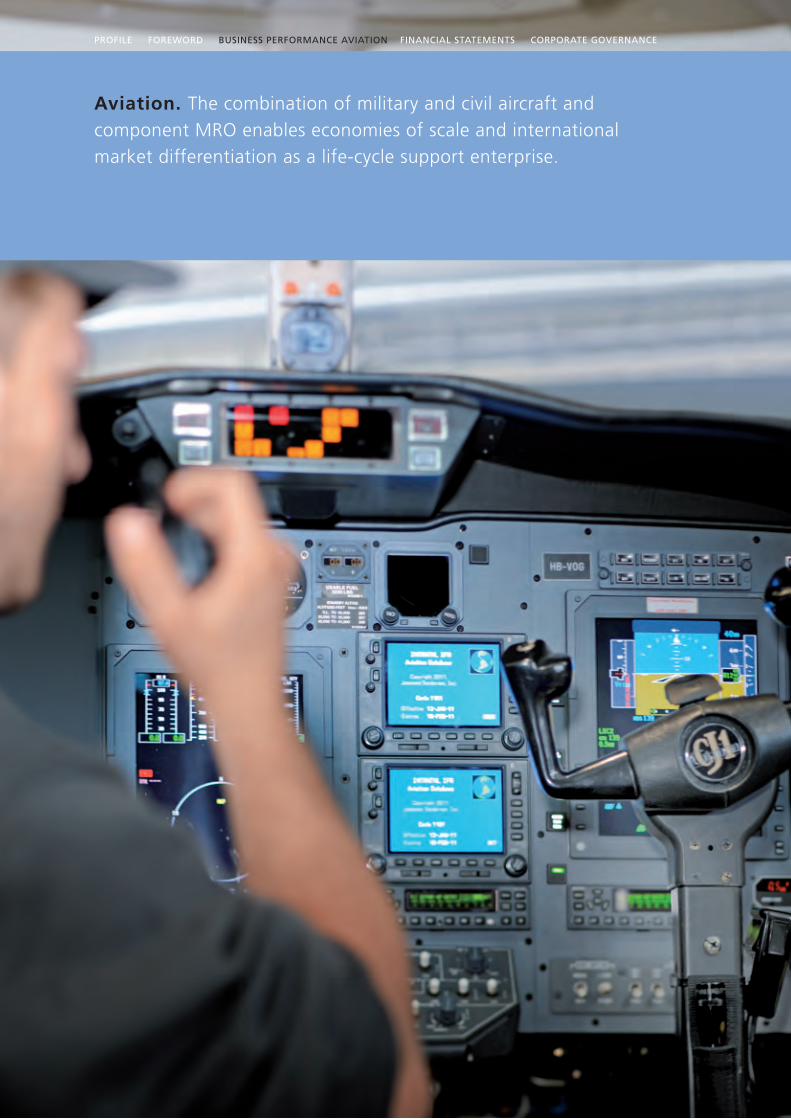
Aviation. The combination of military and civil aircraft and
component MRO enables economies of scale and international
market differentiation as a life-cycle support enterprise.
17RUAG AnnUAl RepoRt 2010
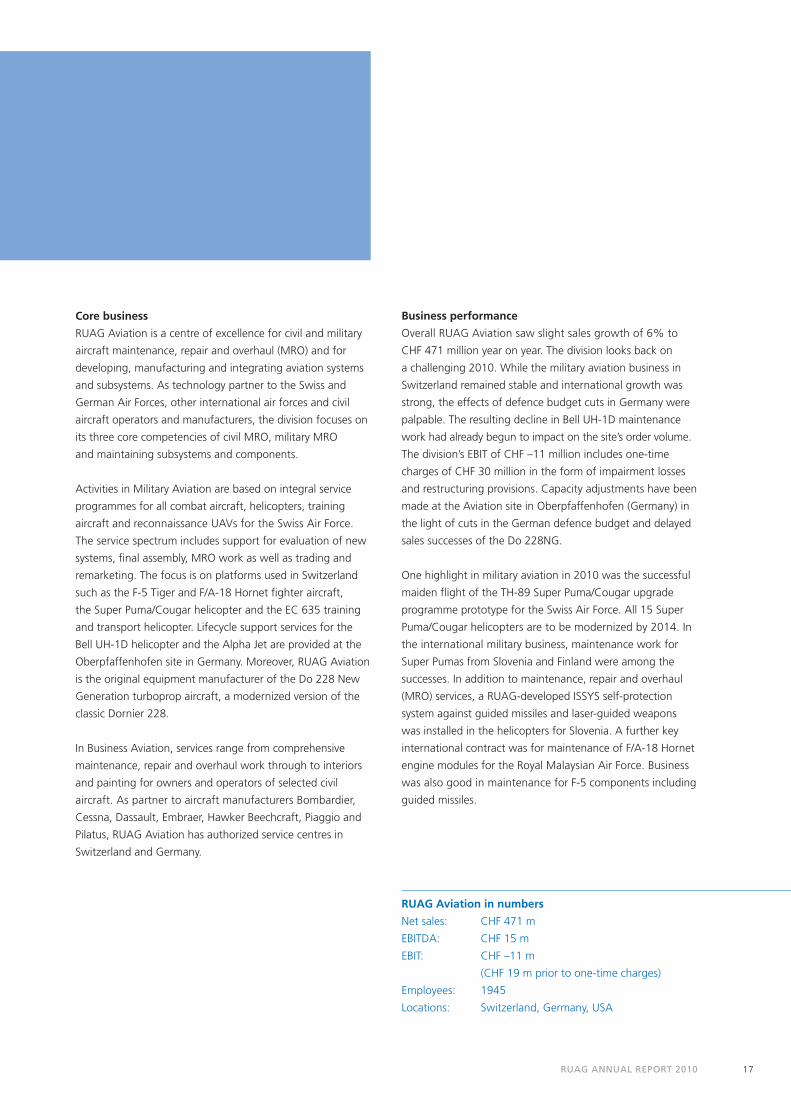
RUAG Aviation in numbers
Net sales: CHF 471 m
EBITDA: CHF 15 m
EBIT: CHF –11 m
(CHF 19 m prior to one-time charges)
Employees: 1945
Locations: Switzerland, Germany, USA
Core business
RUAG Aviation is a centre of excellence for civil and military
aircraft maintenance, repair and overhaul (MRO) and for
developing, manufacturing and integrating aviation systems
and subsystems. As technology partner to the Swiss and
German Air Forces, other international air forces and civil
aircraft operators and manufacturers, the division focuses on
its three core competencies of civil MRO, military MRO
and maintaining subsystems and components.
Activities in Military Aviation are based on integral service
programmes for all combat aircraft, helicopters, training
aircraft and reconnaissance UAVs for the Swiss Air Force.
The service spectrum includes support for evaluation of new
systems, final assembly, MRO work as well as trading and
remarketing. The focus is on platforms used in Switzerland
such as the F-5 Tiger and F/A-18 Hornet fighter aircraft,
the Super Puma/Cougar helicopter and the EC 635 training
and transport helicopter. Lifecycle support services for the
Bell UH-1D helicopter and the Alpha Jet are provided at the
Oberpfaffenhofen site in Germany. Moreover, RUAG Aviation
is the original equipment manufacturer of the Do 228 New
Generation turboprop aircraft, a modernized version of the
classic Dornier 228.
In Business Aviation, services range from comprehensive
maintenance, repair and overhaul work through to interiors
and painting for owners and operators of selected civil
aircraft. As partner to aircraft manufacturers Bombardier,
Cessna, Dassault, Embraer, Hawker Beechcraft, Piaggio and
Pilatus, RUAG Aviation has authorized service centres in
Switzerland and Germany.
Business performance
Overall RUAG Aviation saw slight sales growth of 6% to
CHF 471 million year on year. The division looks back on
a challenging 2010. While the military aviation business in
Switzerland remained stable and international growth was
strong, the effects of defence budget cuts in Germany were
palpable. The resulting decline in Bell UH-1D maintenance
work had already begun to impact on the site’s order volume.
The division’s EBIT of CHF –11 million includes one-time
charges of CHF 30 million in the form of impairment losses
and restructuring provisions. Capacity adjustments have been
made at the Aviation site in Oberpfaffenhofen (Germany) in
the light of cuts in the German defence budget and delayed
sales successes of the Do 228NG.
One highlight in military aviation in 2010 was the successful
maiden flight of the TH-89 Super Puma/Cougar upgrade
programme prototype for the Swiss Air Force. All 15 Super
Puma/Cougar heli copters are to be modernized by 2014. In
the international military business, maintenance work for
Super Pumas from Slovenia and Finland were among the
successes. In addition to maintenance, repair and overhaul
(MRO) services, a RUAG-developed ISSYS self-protection
system against guided missiles and laser-guided weapons
was installed in the helicopters for Slovenia. A further key
international contract was for maintenance of F/A-18 Hornet
engine modules for the Royal Malaysian Air Force. Business
was also good in maintenance for F-5 components including
guided missiles.

18 RUAG AnnUAl RepoRt 2010
pRofile foRewoRd bUsiness peRfoRmAnce AviAtion finAnciAl stAtements coRpoRAte GoveRnAnce
“OUR PARTNERSHIP WITH THE
SWISS AIR FORCE IS THE BASIS
OF OUR INTERNATIONALIzATION
STRATEGY.”PHILIPP M. BERNER, CEO RUAG AVIATION
RUAG Aviation strengthened its civil helicopter MRO capa-
bilities and expanded its customer and platform port folio
with the acquisition of Linth Air Service AG’s helicopter service
operations in Mollis. The division also acquired the turbo-
prop aircraft service operations of A.M. Aeromeccanica SA
in Locarno, thus expanding its market share in turboprop
aircraft in Switzerland and strengthening its position in
northern Italy too.
The year 2010 was decisive for the first aircraft built by RUAG,
the Do 228NG. The new, improved version of the Dornier
228 had its successful maiden flight and received extended
type approval from the European Aviation Safety Agency
(EASA) at mid-year, setting the stage for successful delivery
to the first customers from Japan and Norway. In 2011 the
emphasis will primarily be on marketing and sales activities
for the Do 228NG.
In civil aircraft MRO, stabilization and considerable improve-
ment was achieved by focusing the strategy on selected
platforms and services in association with targeted restruc-
turing measures. The aim is to bundle the compe tencies of
RUAG Aviation at the Geneva, Berne Belp, Agno (Switzer-
land) and Oberpfaffenhofen (Germany) sites with a view to
meeting customer needs even better. For example, services
for Embraer customers are now concentrated in Oberpfaffen-
hofen and a Piaggio service centre has been established
in Agno. The Cessna and painting businesses, which came
under pressure in 2009, were also stabilized, and the
Bombardier business area even gained market share. The
zurich Kloten site was shut down in early 2010 during
the realignment, with new jobs being found for most of
the staff.
Innovations and initiatives
Innovations represent a major strategic initiative at RUAG
Aviation, with both technical and commercial innovations
encouraged. An example of technical innovation in aircraft
MRO is the development of a quick, low-cost process to
repair corrosion and wear damage to the landing gear of
the F-5.
RUAG Aviation has also established itself in recent years
as a developer of its own products, such as the ISSYS self-
protection system, which provides aircraft with extensive
protection against surface and air threats. The latest innova-
tion in this field is a POD (plug-on device) variant. This
platform-independent solution, which can be installed on
different aircraft types as needed, was given the Survivability
Solution Award at the annual Aircraft Survivability Confer-
ence in Berlin.
As a forward-looking technology company, RUAG Aviation
makes a point of keeping a finger on the pulse of the latest
technology trends and developments. Modern wind tunnel
facilities are available for aerodynamic testing by customers
in the aerospace and automotive industries. Here, engineers
and specialists focus on new technologies, collaborating with
universities and academic institutions, or directly with custom-
ers. In 2010, for example, tests were conducted jointly with
Boeing and Rolls-Royce for the development of innovative,
particularly fuel-efficient engines.

19RUAG AnnUAl RepoRt 2010
Outlook
In future, RUAG Aviation will focus clearly on its core
com petencies of military and civil aircraft and component
MRO.
RUAG Aviation will also place considerable strategic empha-
sis on innovation in 2011. On the technical side, this will
include innovations such as new upgrade, MRO and product
solutions. On the commercial side, RUAG Aviation will
continue to systematically pursue innovations such as “power
by the hour” contracts involving fixed maintenance costs
per hour of operation.
In military MRO, the focus in Switzerland in 2011 will be
on strengthening the relationship with the main customer,
the Federal Department of Defence, Civil Protection and
Sport (DDPS). In the global military business, growth oppor-
tunities are being pursued especially in the United States,
Asia and South America. For Business Aviation, efforts will
focus on completing the turnaround process.
First F/A-18 Hornet engine modules for Malaysia
One highlight was the successful delivery of the first F/A-18
Hornet engine modules to the Royal Malaysian Air Force.
Maintenance work was carried out in 2010 on several F404
engine modules, making the Royal Malaysian Air Force an
important early customer for RUAG Aviation in the global
F/A-18 Hornet engine business. Key factors influencing the
customer’s decision to work with RUAG Aviation were its
ability both to complete the orders quickly and cost-effec-
tively and to provide the air force with support in complex
technical and logistical matters – all with a view to keeping
turnaround times as short as possible. RUAG Aviation’s
investments in spare parts have further enhanced efficiency:
the company guarantees that materials are always available
at short notice, which also benefits the Swiss Air Force. The
good working relationship that RUAG Aviation has estab-
lished at all levels with the Royal Malaysian Air Force is
expected to bring MRO work on further engine modules to
Switzerland in 2011.

20 RUAG AnnUAl RepoRt 2010
pRofile foRewoRd bUsiness peRfoRmAnce technoloGy finAnciAl stAtements coRpoRAte GoveRnAnce
Technology. Flexible processes combined with comprehensive
technology capabilities and outstanding production quality
enable RUAG Technology to establish a successful niche position
in various international markets.

21RUAG AnnUAl RepoRt 2010
RUAG Technology in numbers
Net sales: CHF 273 m
EBITDA: CHF 30 m
EBIT: CHF 21 m
(CHF –14 m prior to one-time effects)
Employees: 1362
Locations: Switzerland, Germany
Core business
RUAG Technology manufactures and machines structural
assemblies and high-quality components and provides special
services to customers in the aviation, semiconductor, energy,
automotive and recycling industries. Activities are grouped
into Aerostructures and Components, the latter spanning the
Mechanical Engineering, Coatings, Automotive and Environ-
ment businesses.
In Aerostructures, key focal points are producing complete
passenger aircraft fuselage sections for major customers
such as Airbus and Bombardier, wing and control surface
com ponents and sophisticated component assemblies and
parts for civil and military aircraft. As a centre of excellence
for wingtip fences, RUAG Technology produces all of the
winglets for current Airbus models and serves as a “quality
gate” for final assembly and the entire global fuselage
section supply chain for the European aircraft manufacturer.
Mechanical Engineering produces sophisticated structural
elements and components for machinery and equipment
manufacturing, for the wind power and semiconductor
industries and for aerospace, precision mechanics and tool
production. The unit’s specialities include high-precision
machining of large parts. The Coatings business unit is
proficient in a comprehensive array of layering, chemical,
electrolytic, electrochemical, tribological and nanotechno-
logical surface treatment processes. Automotive provides
metal forming for the automotive sector. Environment is a
total service provider for electrical, electronic and industrial
materials recycling.
Business performance
RUAG Technology grew net sales by CHF 21 million to CHF
273 million in 2010. The turnaround that began in 2009 is
thus well underway. Whereas Technology had a large nega-
tive impact on the RUAG Group’s profit figures in 2009
and a reassessment of risks revealed the need for restruc-
turing measures, stability returned to all business units during
the year under review. This accomplishment is all the more
notable in light of the additional pressures that the division,
like all other exporters, faced in 2010 due to the strong Swiss
franc along with huge spikes in some raw material prices.
Technology’s EBIT in 2010 was CHF 21 million, including a
net amount of CHF 35 million in positive one-time effects
from the reversal of write-downs on inventories and of
provisions.
The future of Aerostructures will see a focus on high-value,
profitable speciality products and niche applications along
with efforts to minimize risks for the Group as a supplier in
the global supply chains of aircraft manufacturers. This
includes new, multi-year contracts concluded with the Euro-
pean aircraft producer Airbus in the autumn of 2010,
which comprise an expandable annual order volume of
CHF 85 million and minimize both business and currency
risks.
At the Plan-les-Ouates production site near Geneva, efforts
to establish a profitable focus on core competencies in the
production of sophisticated titanium and nickel components
for civil and military aviation proved unsuccessful. Decisive

22 RUAG AnnUAl RepoRt 2010
pRofile foRewoRd bUsiness peRfoRmAnce technoloGy finAnciAl stAtements coRpoRAte GoveRnAnce
“INNOVATION AND
QUALITY FROM PROTOTYPE
TO MANUFACTURING
ARE OUR TRUMP CARDS.”DR VIkTOR HAEFELI, CEO RUAG TECHNOLOGY
measures such as progressive workforce reductions and
shorttime work did not have the desired effects, and
attempts to expand the customer base did not bear fruit.
Despite various efforts, it was not possible to sustainably
return the Plan-les-Ouates site to profit. The Plan-les-Ouates
site will be closed in June 2012 if its activities cannot be
successfully spun off by then.
Mechanical Engineering benefitted from the incipient upturn
in the machine and especially the semiconductor industry,
for which it manufactures precision large assemblies. The Coat-
ings business unit likewise took advantage of the nascent
recovery in world trade to replenish its order book. The same
is true for the Automotive business unit, although cost and
innovation pressures in the automotive sector remain intense
and there is excess capacity on the market. Since this sector
is not part of RUAG’s core business, a decision has been taken
to withdraw from heavy sheet metal processing and com-
bine the Automotive business unit with Mechanical Engineer-
ing in 2011. The intention is to find jobs for the affected
staff elsewhere within RUAG.
The Environment business unit proved to be a stable pillar
of growth in 2010. Moreover, steps were taken during the
year to further expand capabilities as a comprehensive
recycling service provider for third-party businesses, offering
a single source for everything from collection through
demanufacturing to reintroduction of materials into produc-
tion cycles.
The faster than expected turnaround of RUAG Technology
has been the combined result of various measures and
activities in all areas. These include not only more effective
risk assessment and the resulting new contracts with
Airbus, a systematic expansion of sales efforts and continual
efficiency-enhancing process improvements, but also opti-
mization of our own supply chain for better control of foreign
exchange risks by expanding procurement in dollars and
euros.
Innovations and initiatives
As supplier to a wide range of industries, RUAG Technology
focuses its development and engineering efforts on innova-
tive solutions to our customers’ most difficult challenges. The
company addresses the entire development, engineering
and production cycle from prototype design to industrial manu-
facturing.
Examples of RUAG Technology development projects that
provided tangible value to customers in 2010 included
lightweight high-temperature tubing for aircraft construction
and a self-cleaning painting system. The high-temperature
composite tubes are designed for heating systems and
generators in aircraft, where they must withstand tempera-
tures of up to 350 degrees Celsius. The tubes are made
of carbon fibres embedded in heat-resistant resin, an ap-
proach that is not only less costly in production than conven-
tional titanium-based tubing, but also substantially lighter,
yielding additional fuel savings during flight.
The Coatings business unit’s painting system is based on
nanotechnology. Among other applications, it is intended
for use on upmarket mountain bikes, making them much
faster to clean. The innovative coating is an attractive differ-
entiating factor for high-end bicycles.
In addition to its technology development initiatives, RUAG
Technology also systematically redoubled sales efforts in
2010. Sales teams were expanded through new hires and a
structured, targeted effort was undertaken both to acquire
new customers and to expand relationships with existing ones.
23RUAG AnnUAl RepoRt 2010
Outlook
In 2011, RUAG Technology intends to forge ahead continually
and consistently with its turnaround strategy. Alongside
the division’s own efforts, success will depend crucially on
developments in our export-oriented customer markets.
Since most signs currently point to a continuing recovery in
the global economy, a further positive trend in sales and
income for the current year is anticipated. The strong Swiss
franc and rising commodity prices are likely to remain nega-
tive factors in 2011.
The key to long-term success will be continuous improve-
ment in processes at all business units. This is being pursued
throughout the division through a structured improvement
process, including ongoing optimization of our own supply
chains. A major consideration is more flexible hedging of
exchange rate fluctuations.
The strategic objectives of the individual business units reside
in a tighter focus on profitable activities as a basis for ex-
pansion. In Aerostructures, to this end, the profitable niches
that RUAG Technology occupies internationally will be
expanded in both the civil and military markets. Mechanical
Engineering will continue to pursue a consistent strategy
of supplying precision assemblies with overall responsibility
for sections of the supply chain. Environment is aiming
for growth in 2011 and hopes to further apply the expertise
it has acquired internally in recycling materials from industrial
production with a view to providing services to third-party
business clients.
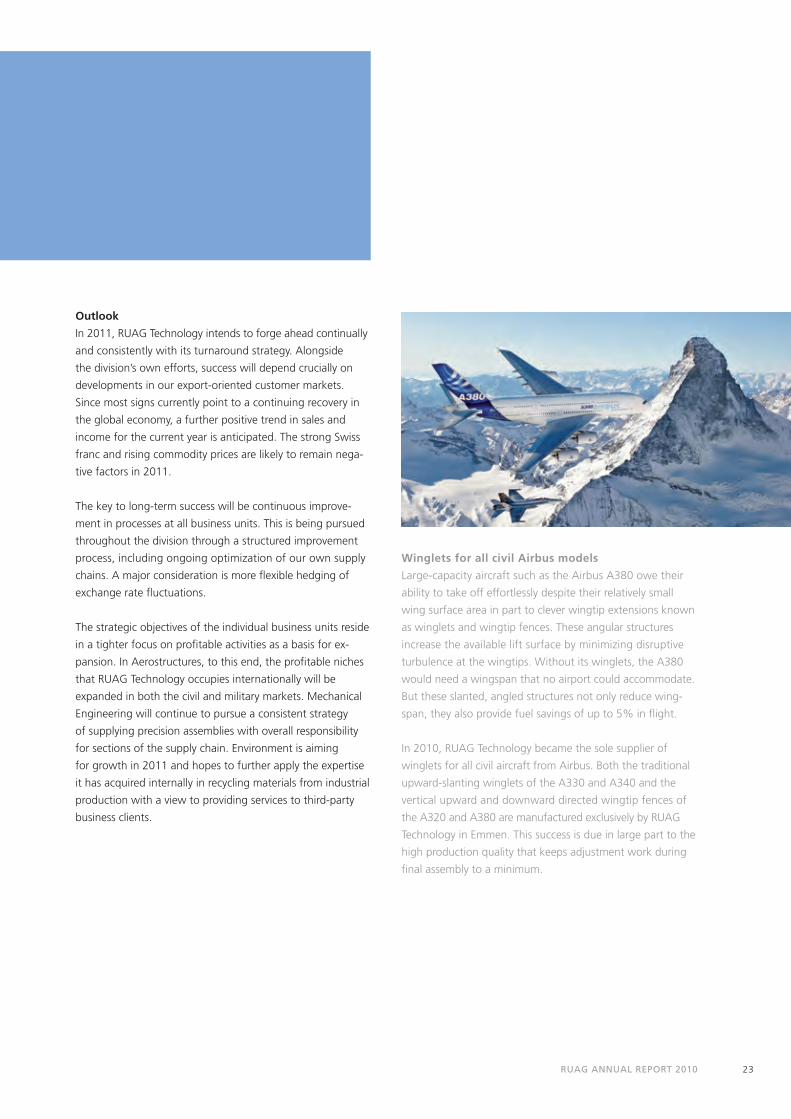
Winglets for all civil Airbus models
Large-capacity aircraft such as the Airbus A380 owe their
ability to take off effortlessly despite their relatively small
wing surface area in part to clever wingtip extensions known
as winglets and wingtip fences. These angular structures
increase the available lift surface by minimizing disruptive
turbulence at the wingtips. Without its winglets, the A380
would need a wingspan that no airport could accommodate.
But these slanted, angled structures not only reduce wing-
span, they also provide fuel savings of up to 5% in flight.
In 2010, RUAG Technology became the sole supplier of
winglets for all civil aircraft from Airbus. Both the traditional
upward-slanting winglets of the A330 and A340 and the
vertical upward and downward directed wingtip fences of
the A320 and A380 are manufactured exclusively by RUAG
Technology in Emmen. This success is due in large part to the
high production quality that keeps adjustment work during
final assembly to a minimum.

24 RUAG AnnUAl RepoRt 2010
pRofile foRewoRd bUsiness peRfoRmAnce Ammotec finAnciAl stAtements coRpoRAte GoveRnAnce
Ammotec. Focussing research and development on top-quality
pyrotechnic specialty products for hunting and sport, law enforcement,
the military and industry is opening new market niches worldwide.

25RUAG AnnUAl RepoRt 2010
Core business
RUAG Ammotec specializes in high-quality pyrotechnic
products for military and civil markets and for industry.
Activities include developing and manufacturing small-calibre
ammunition for hunting and sport as well as armed forces
and gov ernment agencies. The products are renowned for
their ultimate dependability, precision and optimally engi-
neered effect. Environmentally safe disposal of pyrotechnic
products also forms part of the service portfolio.
RUAG Ammotec is the European market leader in hunting
and sport ammunition. Its hunting ammunition includes a
broad range of classic brands such as RWS, Rottweil, GECO,
Norma and Hirtenberger. Among sporting marksmen, numer-
ous Olympic medals and world records underscore the world-
class quality of RUAG Ammotec’s products, especially those
sold under the RWS and Norma brands. For defence and law
enforcement, the division supplies high-precision ammunition
across the entire small-calibre spectrum, including special-
purpose ammunition under the SWISS P brand. A wide range
of small-calibre ammunition for various operational and
training applications is available for government agencies.
The company also produces a unique line of low-pollutant,
NATO-qualified small-calibre ammunition. Customers include
the Swiss and German Armed Forces and other international
government agencies and security forces.
In Industrial Products, building on the company’s compre-
hensive ammunition expertise and a systematic strategy
of innovation, RUAG Ammotec develops products such as
actuator cartridges for fastening technologies in the con-
struction sector and for safety systems.
Business performance
RUAG Ammotec’s net sales declined by CHF 16 million from
the previous year’s figure to CHF 320 million. Overall, the
division was able to defend its strong market position in a
difficult environment characterized by global overcapacity
and cuts in government budgets, especially in Europe. There
was successful expansion in special ammunition and in
tapping new geographic markets in the defence and law
enforcement sector. The division’s EBIT totalled CHF 31
million. Despite negative currency effects, this result almost
equalled that of 2010.
The Industrial Products and Hunting & Sports business units
both saw gains in 2010. The biggest success in Industrial
Products is a long-term supply contract with Hilti for low-
pollutant actuator cartridges. Hilti is the market leader in
direct fastening technologies in the construction sector. This
major contract has triggered extensive investments in new
production capacity. Hunting & Sports benefited from recov-
ering markets following the end of the global recession.
Nevertheless, consumers’ purchasing behaviour has become
more price-conscious, which has to some extent impacted
on the premium brands RWS and Rottweil. The important US
market was especially affected by price erosion. By contrast,
a long-term exclusive contract as supplier to the British
National Rifle Association is a sign of things to come, under-
scoring the division’s ability to compete even in a price-sensi-
tive environment.
RUAG Ammotec in numbers
Net sales: CHF 320 m
EBITDA: CHF 42 m
EBIT: CHF 31 m
Employees: 1734
Locations: Switzerland, Germany, Hungary, Sweden,
USA, France, Austria, UK, Belgium

26 RUAG AnnUAl RepoRt 2010
pRofile foRewoRd bUsiness peRfoRmAnce Ammotec finAnciAl stAtements coRpoRAte GoveRnAnce
“INTERNATIONALIzATION IS
ImPORTANT FOR A SUCCESSFUL
FUTURE.”CyRIL KUBELKA, CEO RUAG AmmOTEC
Delayed effects of the economic crisis had a negative impact
on earnings in the defence and law enforcement markets.
As a consequence of budget cuts, there were several unex-
pected reductions in orders from existing customers, which
were only partially offset by new sales successes. In response
to these falls, production shifts were reduced and temporary
employees left the company in 2010.
On the positive side, highlights include an initial order
from the Spanish Army for tracer ammunition and a
generally encouraging trend in business with the German
Armed Forces.
moreover, the effects of the reduced orders were offset by
several first-time orders from new markets. The division
sees significant market potential in Eastern Europe thanks
to the eastward expansion of NATO. Among measures
to realize this potential, RUAG Hungarian Ammotec Inc. was
acquired in 2009 and its production capacity is being mod-
ernized and expanded. Further internationalization of pro-
duction is a major strategic option for the division, as it will
enable a more flexible response to currency and demand
fluctuations and boost competitiveness overall. Systematic
international business development is thus a key strategic
objective in pursuit of long-term success.
Innovations and initiatives
Among the numerous improvements developed last year
was a temperature-independent propellant powder that
guarantees full ammunition precision even under extreme
climatic conditions. In electrical ignition elements, the
ensuing electrostatic charge was substantially lowered,
reducing the risk of accidents. In addition, a unique low-
pollutant manoeuvre round was developed for the German
Armed Forces. A promising market launch was achieved
with an innovative type of special ammunition called Copper-
matrix NTF, developed specially for police, military and
security forces training. Also known as “frangible ammuni-
tion”, these rounds completely disintegrate hitting the
target. This makes it possible to train for close-range action
without the risk of injuries from ricochets. The completely
lead-free ammunition also protects human health in enclosed
training facilities and the environment.
Another forward-looking project was the collaboration
with the Hilti Group to develop low-pollutant, heavy-metal-
free actuator cartridges for direct fastening. A long-term
supply contract and the commissioning of new production
and packing facilities will open up growth opportunities
for RUAG Ammotec in this market for the coming years.
27RUAG AnnUAl RepoRt 2010
Outlook
RUAG Ammotec expects the environment to remain chal-
lenging in 2011. Ongoing pressure on government budgets,
rising raw material costs and the strong Swiss franc are
expected to have negative impacts. Global market prices for
copper, zinc and lead have risen by over 250% since a
temporary low in January 2009. This has an unavoidable
effect on future results.
Some growth is expected in the Hunting & Sports busi-
ness unit, where the effects of the recession are continuing
to fade. Customer proximity in this area will be further
enhanced by expanding communication channels.
A small gain is expected in Industrial Products. The construc-
tion industry, and with it sales of actuator cartridges for
fastening equipment, should see growth in parallel with the
broad economy.
By contrast, a slight contraction is expected in orders for
Defence & Law Enforcement orders due to continuing
pressure on state budgets and international excess capacity.
It is still difficult to make valid forecasts for this market
segment.
Among other things, the 2010 launch of frangible ammu-
nition, whose performance characteristics provide differ-
entiation on the market, will open new opportunities for
RUAG Ammotec. The eastward NATO expansion is also
opening new markets. Special attention will be devoted in
2011 to continuous improvement and modernization
measures in production to better counter rising commodity
prices and increasing cost pressures in various markets.
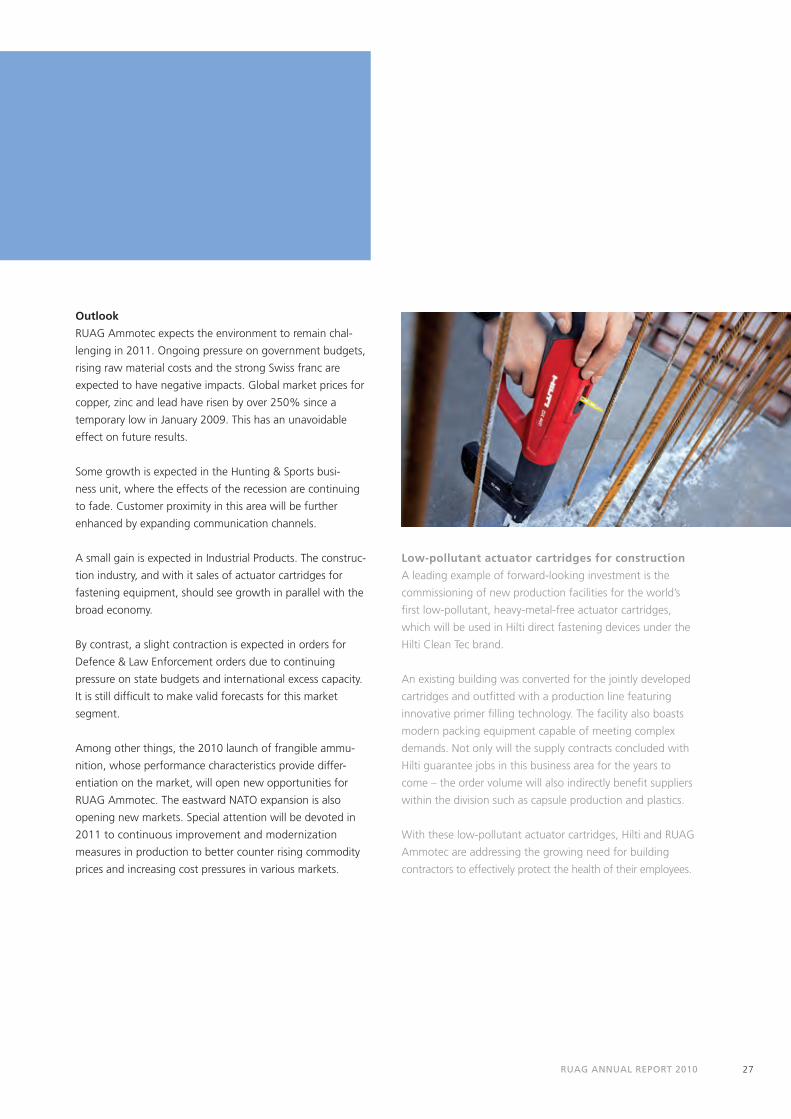
Low-pollutant actuator cartridges for construction
A leading example of forward-looking investment is the
commissioning of new production facilities for the world’s
first low-pollutant, heavy-metal-free actuator cartridges,
which will be used in Hilti direct fastening devices under the
Hilti Clean Tec brand.
An existing building was converted for the jointly developed
cartridges and outfitted with a production line featuring
innovative primer filling technology. The facility also boasts
modern packing equipment capable of meeting complex
demands. Not only will the supply contracts concluded with
Hilti guarantee jobs in this business area for the years to
come – the order volume will also indirectly benefit suppliers
within the division such as capsule production and plastics.
With these low-pollutant actuator cartridges, Hilti and RUAG
Ammotec are addressing the growing need for building
contractors to effectively protect the health of their employees.

28 RUAG AnnUAl RepoRt 2010
pRofile foRewoRd bUsiness peRfoRmAnce defence finAnciAl stAtements coRpoRAte GoveRnAnce
Defence. Systems expertise in the Swiss Army’s tracked armoured
vehicles, the associated broad array of single-source products and
services and a strong commitment to innovation have allowed the division
to pursue a successful niche strategy on the international market.
29RUAG AnnUAl RepoRt 2010
RUAG Defence in numbers
Net sales: CHF 438 m
EBITDA: CHF 38 m
EBIT: CHF 32 m
Employees: 1341
Locations: Switzerland, Germany
Core business
RUAG Defence is a strategic technology partner for land
forces. Its focus lies on the needs of the Swiss Armed Forces
in terms of protection, training, and upgrades of defence
systems. In addition, the division goes to great lengths to
ensure that its products and services are aligned with inter-
national requirements. The activities of the three business
units Land Systems, Simulation & Training and Network
Enabled Ope rations cover innovative products, maintenance,
upgrades, training and systems integration services.
The core competency of the Land Systems business unit
is in upgrades and enhancements to heavy weapons systems
and manufacturing protective systems for armoured vehicles.
The unit also offers logistics solutions such as special contain-
ers that provide protection against electromagnetic disrup-
tion and electronic listening.
The Simulation & Training business unit specializes in virtual
and live simulation systems for land forces training. Inte-
gration of different systems yields a range of effective train-
ing programmes, from individual training of soldiers to
tactical exercises for entire units. The business unit also
provides comprehensive service and operation of installed
equipment.
As a vendor-neutral technology partner, the Network Ena -
bled Operations business unit ensures integration, operation
and maintenance of electronic command and control,
communication, radar and reconnaissance systems for the
Swiss Armed Forces and related systems for civil organiza-
tions. The unit also develops solutions for information
security and long-term protection of corporate assets against
cyberwar threats. It designed the PantherCommand opera-
tional command system for government agencies.
Business performance
RUAG Defence posted net sales of CHF 438 million in 2010.
As a result of the focus on core businesses, RUAG Defence
was formed from the two former divisions RUAG Electronics
and RUAG Land Systems on 1 January 2011. The restructur-
ing was primarily motivated by a recognition that both
divisions were operating in the same markets. Sales gener-
ated by the former RUAG Electronics and RUAG Land
Systems divisions in the previous year were on a similar scale.
The merger enhances customer reach with the Swiss Armed
Forces as RUAG Defence’s key customer, and for international
customers. This enables the division to offer optimized one-
stop shopping for a broader product port-folio together with
complementary services. EBIT for RUAG Defence in 2010 was
CHF 32 million.
An increased focus on the international land forces market
yielded several successes at the Land Systems business
unit in 2010. For example, demand for the Kodiak armoured
engineer and mine clearance vehicle, developed jointly with
Rheinmetall, was very strong. By the end of the year, contracts
had been signed for 42 of these versatile vehicles, based
on converted used main battle tank chassis. Furthermore, an
additional contract was signed with general contractor
Mowag for partial development and production of protective
superstructures and interior fittings for 216 armoured per-
sonnel carriers.

30 RUAG AnnUAl RepoRt 2010
pRofile foRewoRd bUsiness peRfoRmAnce defence finAnciAl stAtements coRpoRAte GoveRnAnce
“WE KNOW WHAT
CUSTOMERS NEED AND
OFFER TAILORED SOLUTIONS
FOR SAFE MISSIONS.”URS BREITMEIER, CEO RUAG DEFENCE
The Simulation & Training business unit handed over the keys
to the SIMUG simulation platform, specially designed for
training in built-up terrain, at the St. Luzisteig training ground,
giving the Swiss Army a second, state-of-the-art combat
training centre approved under the 2004 armaments pro-
gramme. SIMUG uses modern laser firing simulators for
realistic exercises up to company level that enable detailed
after-action reviews (AAR). In a joint pilot project, the Swiss
Army also handed over operation of the West and East
combat training centres to RUAG Defence at the start of the
year. An efficient operating strategy was implemented in
cooperation with the Swiss Army. Since that time, RUAG
Defence has been responsible as the full service provider for
all operational tasks at the combat training centres.
The Network Enabled Operations business unit was desig-
nated in 2010 as the materiel centre of excellence for
the IFASS integrated radio reconnaissance and transmission
system of the Federal Department of Defence, Civil Protec-
tion and Sport (DDPS), the budget for which was appropri-
ated under the 2005 armaments programme. The system will
be implemented by stages through 2012. RUAG Defence
was appointed partner with responsibility for all service and
maintenance work.
Innovations and initiatives
The Leopard 2 main battle tank upgrade programme devel-
oped for the Swiss Army was modified for international
requirements and saw further development in 2010. The
modular, expandable programme is now marketed world-
wide. A further newly launched product is the SidePRO
protection module, which provides armoured vehicles with
effective but lightweight lateral protection against threats
from armour-piercing weapons.
In the area of live simulation, the Gladiator laser system
for military and police training was launched, a product that
can be expanded in several stages. Options range from
a cost-effective variant for day-to-day training up to a high-
tech body harness. The system is designed for realistic
training of special units, police forces and combat troops up
to brigade level. In virtual simulation, the main focus was
on integration of components from the gaming industry.
RUAG Defence combines proven and innovative technologies
from the civilian world with professional training systems for
military needs, enabling rapid implementation of customer
and market requirements. The first prototype of the forward-
looking RUAG Virtual Arena 2.0 platform was presented at
the I/ITSEC trade show in Orlando (USA) in 2010.
In close cooperation with the Swiss Armed Forces, the
Network Enabled Operations business unit launched the
Computer Network Defence (CND) project to develop
approaches to countering the growing threat of cyberwar-
fare. Innovative algorithms and methods are being devised
to protect against various Internet threats. The various
security tools will eventually be bundled into a command
information system for operations in cyberspace.

31RUAG AnnUAl RepoRt 2010
Outlook
RUAG Defence expects business to remain stable in 2011.
Factors including operation of the combat training centres,
ramp-up of production in major customer projects such
as the Kodiak armoured engineer and mine clearance vehicle
as well as the solid maintenance business will have a posi-
tive and long-term stabilizing effect. Capacity utilization is
largely assured in the medium term thanks to various major
contracts.
The priority in 2011 will be implementation of RUAG
Defence’s integrated strategy, which seeks to realize syner-
gies among the core competencies that were expanded
through the merger of the former divisions, including main-
tenance of heavy weapons systems, protection for troops
and materiel, simulation and training along with secure
information transmission. In particular, efforts will focus on
utilizing the broader assortment of products and services
from a single source to expand customer relationships.
On the order side, the emphasis will be on securing further
contracts for the Kodiak armoured engineer and mine
clearance vehicle and expanding the materiel centre of excel-
lence by adding services for the Swiss Army’s new com-
mand information systems (FIS HE) and for the IFASS. There
are also prospects of additional anti-mine orders for the
German PUMA infantry fighting vehicle and follow-up virtual
and live simulation orders.
Efforts to internationalize the business in selected markets
beyond Switzerland and Germany will continue in 2011.
Europe will remain the key market, with an additional focus
on selected countries that put their trust in Swiss Army
systems.
Live simulation as a turnkey service
Marshalling a full battalion in good order and rapidly equip-
ping it, from sleeping bags to combat fatigues to laser
firing simulators, is a true feat of logistics — one in which
the staff of the Swiss Army’s combat training centres
have considerable experience. Each of the centres’ 130 special-
ists knows exactly what it takes. In 2010, the Swiss Army
handed over the wide range of responsibilities of a full
service provider for the two combat training centres, West
and East, to RUAG Defence — from maintenance and
equipment supply to operation and after-action review
support.
The customer determines the content of the training before
an exercise is held, directs the exercises and defines which
training-related information is required. Then the training
can begin. Training can be carried out for modern deploy-
ments at all escalation levels through use of live simulation.
RUAG Defence records the relevant data and scenes during
the exercise and compiles an after-action review, which can
substantially enhance the efficiency of the training.

32 RUAG AnnUAl RepoRt 2010
pRofile foRewoRd seRvice & sUppoRt finAnciAl stAtements coRpoRAte GoveRnAnce
Service & Support units. Centralized centres of expertise for Finance &
Controlling, Risk Management, Human Resources, IT, Real Estate,
Secretary General & Legal Services, and Marketing & Communication
guarantee a strategic focus and common objectives.
33RUAG AnnUAl RepoRt 2010
Strategic management and infrastructure
RUAG is focused on profitable core activities. This applies
both to the Group as a whole and, with respect to the
strategic objectives, to each division and its business units.
Each of them bears responsibility for its own results, as
the Annual Report underscores with separate reporting at
Group and division level.
To ensure the consistent orientation of the RUAG Group
and enable each division to focus optimally on its core
businesses, strategic cross-cutting functions are taken care
of by centralized service and support units. These units
help the divisions and their service and support units to
successfully target markets and ensure consistent standards
throughout the company. Wherever appropriate and possi-
ble, RUAG also makes use of synergies between the divisions
to enhance profitability and product quality in customer
projects.
Specifically, RUAG has centralized management in the
Finance & Controlling, Risk Management, Human Resources,
Secretary General & Legal Services and Marketing & Com-
munication strategic management areas, and the IT and Real
Estate infrastructure units. The centres of expertise are
organized as in-house departments at Group level. This ensures
that their activities are aligned very closely with the broader
Group strategy. To enable them to provide services as effi-
ciently as possible, the infrastructure units are independent.
Functions and objectives
The strategic management areas Finance & Controlling, Risk
Management, Human Resources, Secretary General & Legal
Services and Marketing & Communication, which are centrally
managed, play a decisive role in how RUAG is perceived
both in-house and externally. Their consistent appearance
strengthens both the Group’s shared values and the image
presented to customers, partners, existing and potential
employees, the shareholder, politicians, media, the general
public and other stakeholders.
Finance & Controlling is responsible for ensuring a consistent
approach to finances throughout the Group. Risk Manage-
ment ensures the long-term financial stability of the separate
divisions and the Group as a whole. Human Resources en-
hances employee satisfaction and internal mobility, plus the
quality of management and the company’s attractiveness
on the labour market. Secretary General & Legal Services pro-
vides support for the divisions in all legal and compliance
matters, communicates with the shareholder and monitors
compliance with all national and international regulations.
Marketing & Communication coordinates brand positioning,
communication with the media and public relations.
The centralized infrastructure services make it possible
for the divisions to focus on their core competencies, while
providing an extremely professional level of service. As a
centralized IT service provider, RUAG Services, for instance,
is able to achieve significantly greater economies of scale
in terms of cost-effectiveness and quality than several indi-
vidual IT departments could. RUAG Real Estate Ltd was
formed so as to entrust the management of RUAG’s substan-
tial real estate portfolio to a specialized entity. Moreover, the
bundling of specialist skills makes it possible to provide the
divisions with professional support in executing their building
projects.

34 RUAG AnnUAl RepoRt 2010
“SkILLEd, MoTIvATEd EMpLoyEES
GUARAnTEE THE qUALITy
oF pRodUCTS And pRojECTS.”HAnS BRACHER, SEnIoR vICE pRESIdEnT CoRpoRATE HR, RUAG HoLdInG LTd
pRofile foRewoRd hUmAn ResoURces finAnciAl stAtements coRpoRAte GoveRnAnce
Human Resources
RUAG’s human resources policy is rooted in its corporate
strategy, the aim of which is to achieve profitable, global
growth of the core operations of the individual divisions.
Skilled, motivated employees guarantee the quality of
products and projects. Attracting, retaining and developing
their skills is therefore a crucial factor in RUAG’s success.
As a centralized service and support unit, Human Resources
in conjunction with the divisions is continually working
on HR policy initiatives to better realize the strategic objec-
tives and current requirements of the business. Human
Resources’ activities focus on four core competencies: key
account management, high-tech engineering, major project
management and process optimization. With a view to
establishing Group-wide standards, centralized, preferably
internationally certified training courses are offered. An
important tool in this regard is the three-stage, modular
leadership development programme offered by the in-house
RUAG Business Training Centre.
The broader goal of HR policy is a customer and value-
oriented corporate culture that promotes the employability of
staff and management. This not only creates interesting
perspectives for employees and modern employment condi-
tions, but also strengthens relationships with customers
and partners. Well-trained skilled staff are just as essential
to RUAG as qualified university graduates. The company
cultivates a constructive dialogue with employees, employee
representatives and social partners.
Activities and initiatives
In 2010, RUAG began to set up an employee health manage-
ment system. This move was inspired by the conviction that
health is a fundamental determinant of satisfaction and thus
also a motivational factor. The new health management
system is based on the three fields of health promotion and
prevention, absence management and active case manage-
ment. In addition, an independent counselling service is also
available to employees.
Thanks to RUAG’s innovative capacity, it was successful in
centralized graduate marketing in 2010. As a potential
employer of university graduates in the field of engineering,
RUAG’s ranking in Switzerland improved further from 9th
place to 7th place. In Sweden, RUAG’s ranking jumped from
99th place to 55th place in just one year. To further build
on this good reputation, RUAG was present last year at 12
university fairs and graduate congresses in Switzerland,
Germany, Austria and Sweden.
The Group also takes a strategic interest in encouraging the
development of trainees. Special training centres staffed
with full-time apprenticeship supervisors are available to the
trainees. The high quality of RUAG’s vocational training is
underscored by the regular success of its apprentices in the
Swiss Skills Championships. In the 2010 Swiss Skills Champi-
onships, two RUAG apprentices won gold and thus the title
of Swiss Champion.
Another focus of in-house employee development is the
step-by-step introduction of three career paths of equal
status for managers, project managers and technical experts.
These are aimed in particular at securing the necessary skills
and competencies in the long term, and retaining employees
with specialist knowledge.

35RUAG AnnUAl RepoRt 2010
pRofile foRewoRd mARketinG & commUnicAtion finAnciAl stAtements coRpoRAte GoveRnAnce
“MARkETInG & CoMMUnI -
CATIon pRovIdES GLoBAL
vISIBILITy And SUppoRTS MARkET
CULTIvATIon.”CHRISTIAnE SCHnEIdER, SEnIoR vICE pRESIdEnT CoMMUnICATIon And MARkETInG, RUAG HoLdInG LTd
Marketing & Communication
In line with the company's management philosophy, Market-
ing & Communication maintains a transparent and open
dialogue about strategic orientation and goals and associ-
ated activities with all stakeholders. These activities are
centrally managed at Group level in cooperation with the
divisions with the objective of creating a consistent, strong
identity to enhance RUAG’s global visibility and strengthen
the RUAG brand. The marketing and communication depart-
ments of the individual divisions are responsible for specifically
cultivating each division’s customer markets based on re-
quirements.
Stakeholders include the Swiss Armed Forces, which are still
RUAG’s biggest customer, global customers in the aero-
space and defence industries, existing and potential employ-
ees, politicians, government agencies, business associations,
partners, suppliers, the media and the general public. As a
joint stock company under private law wholly owned by
the Swiss Confederation, RUAG has a duty of particular
transparency towards the Swiss public. As RUAG's operations
have become increasingly international, its clientele has
expanded well beyond the Swiss Armed Forces to include
numerous other national Swiss and international government
agencies, armed forces and industry customers, among
them the European Space Agency ESA, Airbus, Arianespace,
General Electric, Boeing, Bombardier, northrop, dassault,
EAdS, ASML and Saab.
RUAG’s dialogue
As RUAG becomes larger and more international, consistent
communication and an appropriate brand image become
more important. Uniform global perception is the only way
to enhance RUAG’s visibility among its stakeholders. To
this end, Marketing & Communication coordinates customer
communication, for instance through the Group-wide
customer magazine RUAG vIEW, and the company’s public
image though the Internet, trade fairs and special events.
In addition, RUAG conducts an active dialogue with Swiss
and international media to highlight and proactively promote
topics that are relevant for the Group as a whole or for
individual divisions.
To further enhance the uniform perception of the RUAG
Group, Group management will in future give greater
emphasis to more consistent implementation of the mono-
brand strategy, i.e. a consistent brand image both in-house
and externally across all divisions and support units. This
ensures a more uniform identity for RUAG and its employees
and has a positive impact on customers and all other stake-
holders. Furthermore, the various divisions and business units
will be able to benefit from greater synergies in perception
when presenting the qualities of their products and services.
Marketing & Communication thus functions as a Group-
wide support network, networking the divisions and
the service and support units with the relevant stakeholders
to ensure customer-focused market orientation in Switzer-
land and abroad.

36 RUAG AnnUAl RepoRt 2010
pRofile foRewoRd ReAl estAte finAnciAl stAtements coRpoRAte GoveRnAnce
“ConCEnTRATEd MAnAGEMEnT
HELpS To ConTRoL pREMISES
CoSTS And BooST THE vALUE oF
REAL ESTATE.”HAnS RUdoLF HAURI, CEo RUAG REAL ESTATE LTd
RUAG Real Estate
RUAG Real Estate is the centre of expertise for managing
RUAG’s real estate. The unit is organized as an independent
joint stock company and acquires and disposes of property
and real rights for RUAG’s divisions and for third parties. The
main tasks of RUAG Real Estate are to improve the return on
investment, increase the value of RUAG’s considerable real
estate portfolio and to acquire, plan, develop and manage
production areas and infrastructure for the divisions and their
business units.
As a market-oriented, all-in-one service provider for industrial
sites, RUAG Real Estate services covers the entire life-cycle
of its properties. The core activities of the process-oriented
unit include real estate development, transactions, commer-
cial real estate management, plant and area planning, client
representation and technical and structural building manage-
ment services. Its range of activities is rounded off by strate-
gic development, safety and environmental services that
ensure the sustainability of processes and properties.
Strategic master plans have been drawn up for the long-
term development of the industrial parks, some of which
are huge properties. These plans seek to take best possible
account of the interests of the owner and the needs of
potential users, as well as spatial planning considerations.
Measures include the development of innovative building
and infrastructure concepts adapted to the production cycles
of a modern, global industry. The goal is comprehensive,
flexible offers that enable tenants to rapidly initiate produc-
tion with a minimum of capital investment in building and
infrastructure.
Modern industrial parks
In 2010, RUAG Real Estate was able to achieve significant
progress at all levels of activity. Introducing an asset and
portfolio management solution laid the foundation for a
systematic valuation of the real estate portfolio. In 2011,
all of the Group’s real estate will be valued in accordance
with Swiss valuation Standards. This overview of the entire
portfolio will serve as a basis for improving its management
considerably.
The challenge facing RUAG Real Estate is to develop RUAG’s
large industrial sites as theme-oriented industrial parks. To
this end, further progress was made in the structuring of all
RUAG sites in 2010. The founding of nidwalden Airpark AG
is a pioneering step. In conjunction with local companies,
the aim is to develop a 90 000 square metre site adjoining
Buochs air base as a theme-specific industrial park for the
international aviation industry. At the Swiss Air Force air base
in Emmen, a detailed master plan for tapping the full poten-
tial of the property, which covers 430 000 square metres, is
being drawn up. A status analysis of the approx. 350 000
square metre site in Thun provided fundamental insights for
use in further development planning.
As part of the selected streamlining of the property portfolio,
RUAG Real Estate successfully disposed of a plot of land at
the Swiss Air Force air base at dübendorf in 2010.
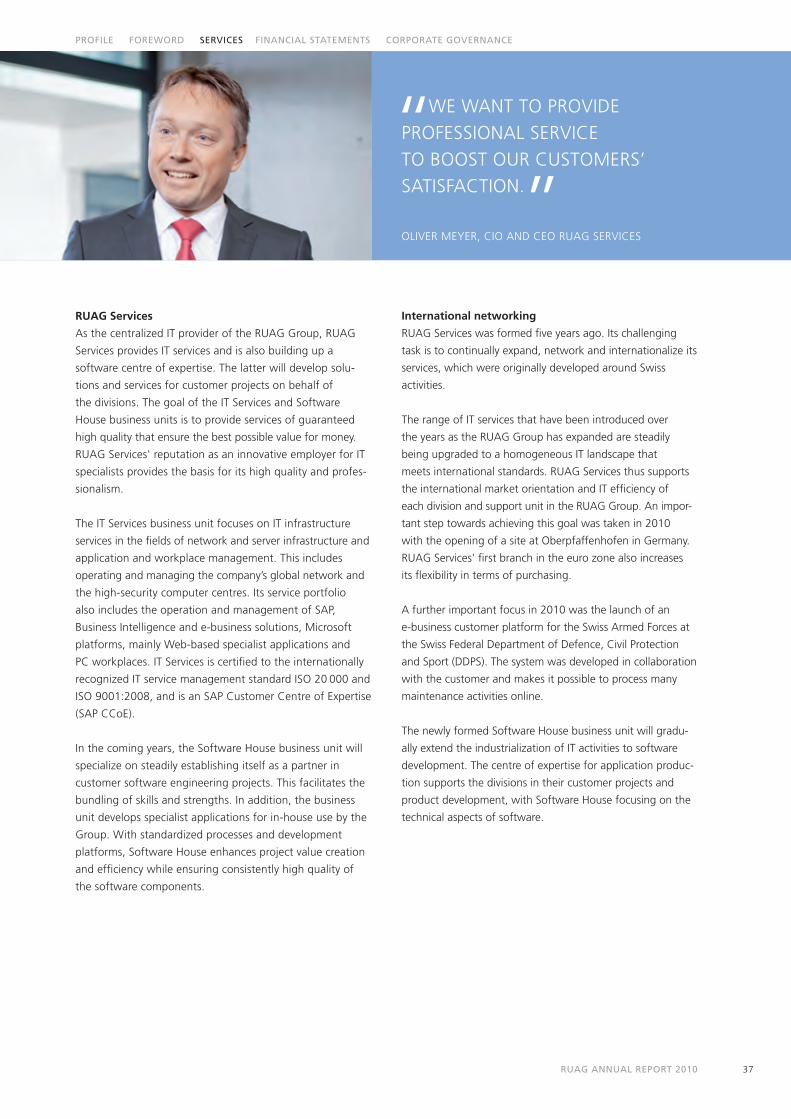
37RUAG AnnUAl RepoRt 2010
pRofile foRewoRd seRvices finAnciAl stAtements coRpoRAte GoveRnAnce
“WE WAnT To pRovIdE
pRoFESSIonAL SERvICE
To BooST oUR CUSToMERS’
SATISFACTIon.”oLIvER MEyER, CIo And CEo RUAG SERvICES
RUAG Services
As the centralized IT provider of the RUAG Group, RUAG
Services provides IT services and is also building up a
software centre of expertise. The latter will develop solu-
tions and services for customer projects on behalf of
the divisions. The goal of the IT Services and Software
House business units is to provide services of guaranteed
high quality that ensure the best possible value for money.
RUAG Services' reputation as an innovative employer for IT
specialists provides the basis for its high quality and profes-
sionalism.
The IT Services business unit focuses on IT infrastructure
services in the fields of network and server infrastructure and
application and workplace management. This includes
operating and managing the company’s global network and
the high-security computer centres. Its service portfolio
also includes the operation and management of SAp,
Business Intelligence and e-business solutions, Microsoft
platforms, mainly Web-based specialist applications and
pC workplaces. IT Services is certified to the internationally
recognized IT service management standard ISo 20 000 and
ISo 9001:2008, and is an SAp Customer Centre of Expertise
(SAp CCoE).
In the coming years, the Software House business unit will
specialize on steadily establishing itself as a partner in
customer software engineering projects. This facilitates the
bundling of skills and strengths. In addition, the business
unit develops specialist applications for in-house use by the
Group. With standardized processes and development
platforms, Software House enhances project value creation
and efficiency while ensuring consistently high quality of
the software components.
International networking
RUAG Services was formed five years ago. Its challenging
task is to continually expand, network and internationalize its
services, which were originally developed around Swiss
activities.
The range of IT services that have been introduced over
the years as the RUAG Group has expanded are steadily
being upgraded to a homogeneous IT landscape that
meets international standards. RUAG Services thus supports
the international market orientation and IT efficiency of
each division and support unit in the RUAG Group. An impor-
tant step towards achieving this goal was taken in 2010
with the opening of a site at oberpfaffenhofen in Germany.
RUAG Services’ first branch in the euro zone also increases
its flexibility in terms of purchasing.
A further important focus in 2010 was the launch of an
e-business customer platform for the Swiss Armed Forces at
the Swiss Federal department of defence, Civil protection
and Sport (ddpS). The system was developed in collaboration
with the customer and makes it possible to process many
maintenance activities online.
The newly formed Software House business unit will gradu-
ally extend the industrialization of IT activities to software
development. The centre of expertise for application produc-
tion supports the divisions in their customer projects and
product development, with Software House focusing on the
technical aspects of software.

38 RUAG AnnUAl RepoRt 2010
pRofile foRewoRd secRetARy GeneRAl & leGAl seRvices finAnciAl stAtements coRpoRAte GoveRnAnce
“THE oWnER’S STRATEGy
And CoMpLIAnCE dETERMInE
THE FRAMEWoRk FoR oUR
ACTIvITIES.”THoMAS kopp, SECRETARy GEnERAL And dIRECToR oF LEGAL SERvICES, RUAG HoLdInG LTd
Secretary General & Legal Services
The Secretary General & Legal Services support unit provides
services for RUAG's governing bodies, i.e. the Annual Gen-
eral Meeting, the Board of directors and the Executive Board,
and advises the RUAG Group in all legal and compliance
matters. Core competencies include the fostering of share-
holder relations, the monitoring of compliance in the Swiss
market and the export business as well as contracts and
contract management. Interdisciplinary cooperation and
shared objectives with other centres of expertise such as
Finance, IT, Marketing & Communication, Human Resources
and Risk Management constitute core characteristics of
the unit's activities.
RUAG is a joint stock company wholly owned by the Swiss
Confederation. The Swiss Confederation's interests as the
shareholder are exercised by the Swiss Federal department of
defence, Civil protection and Sport (ddpS). on account
of its close association with the Swiss Confederation and in
keeping with its corporate principles of transparency, open-
ness and clarity, RUAG pays particular attention to the Federal
Council, the Swiss Armed Forces, Swiss parliament and
government agencies.
The owner's strategy of the Federal Council establishes a
binding framework for the RUAG Group. It ensures that the
RUAG Group can fulfil its duties profitably while taking
account of the broader interests of Switzerland. These inter-
ests concern in particular Swiss national defence, expec-
tations regarding cooperation and investments, as well as
human resource policy and financial objectives. The Secretary
General & Legal Services are actively involved in implement-
ing the objectives and preparing the annual report for the
owner.
Exports and compliance
The growing internationalization of the market for the civil
and military applications of RUAG’s Aerospace and defence
market segments is foreseen in the owner’s strategy. Against
the backdrop of a decline in the volume of orders from the
Swiss Armed Forces, the objective of the strategy is to ensure
RUAG’s competitive long-term development. Transactions
with international customers using platforms developed for
the Swiss Armed Forces create economies of scale and
synergy effects. This helps to stabilize costs in Switzerland
and to ensure the necessary technology transfer for the Swiss
Armed Forces.
As an internationally active company, legal coordination and
critical assessment of its export activities is of crucial concern
for RUAG. In all its activities, the Group complies with the
strict provisions of Swiss law and maintains close contact with
the relevant authorization agency, the State Secretariat for
Economic Affairs (SECo).
In addition to the relevant export regulations, RUAG has
to observe national and international compliance regulations.
For this purpose, Legal Services has in-house regulations
drawn up and updated as required, and monitors the con-
tracts negotiated by the divisions to ensure that they comply
with legal regulations. The relevant employees in the divi-
sions receive regular training and, on request, advice in
specific matters.
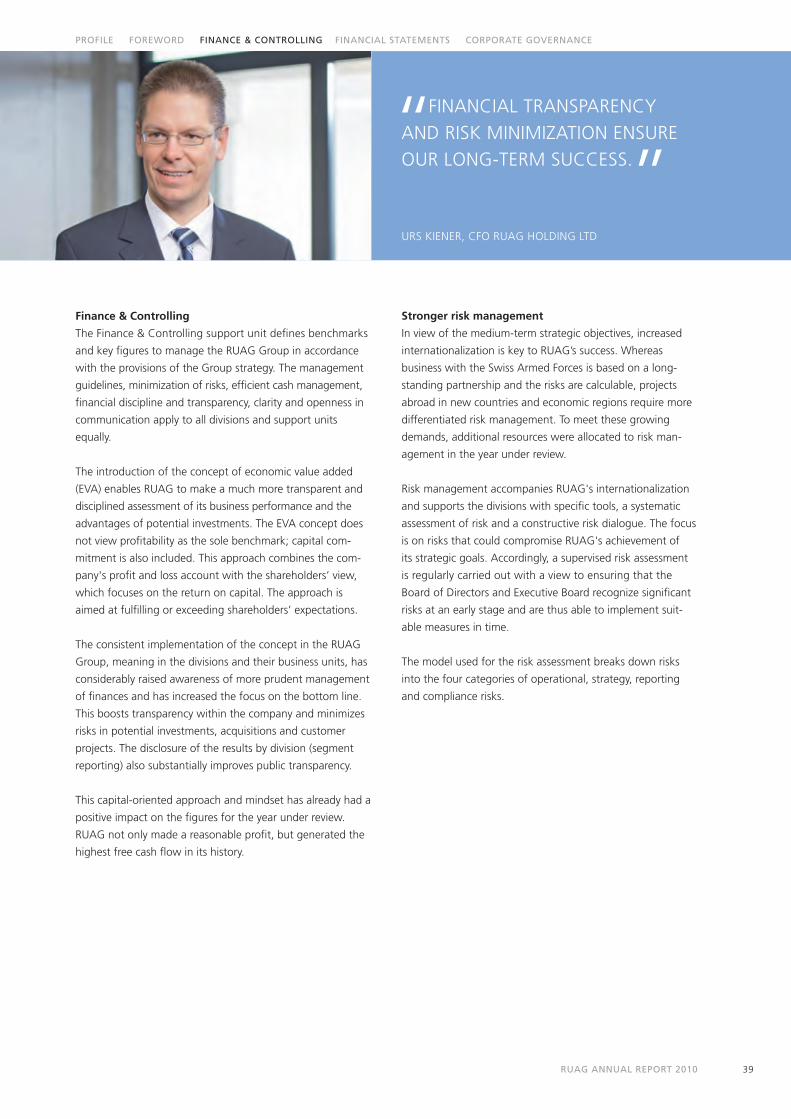
39RUAG AnnUAl RepoRt 2010
pRofile foRewoRd finAnce & contRollinG finAnciAl stAtements coRpoRAte GoveRnAnce
“FInAnCIAL TRAnSpAREnCy
And RISk MInIMIzATIon EnSURE
oUR LonG-TERM SUCCESS.”URS kIEnER, CFo RUAG HoLdInG LTd
Finance & Controlling
The Finance & Controlling support unit defines benchmarks
and key figures to manage the RUAG Group in accordance
with the provisions of the Group strategy. The management
guidelines, minimization of risks, efficient cash management,
financial discipline and transparency, clarity and openness in
communication apply to all divisions and support units
equally.
The introduction of the concept of economic value added
(EvA) enables RUAG to make a much more transparent and
disciplined assessment of its business performance and the
advantages of potential investments. The EvA concept does
not view profitability as the sole benchmark; capital com-
mitment is also included. This approach combines the com-
pany's profit and loss account with the shareholders’ view,
which focuses on the return on capital. The approach is
aimed at fulfilling or exceeding shareholders’ expectations.
The consistent implementation of the concept in the RUAG
Group, meaning in the divisions and their business units, has
considerably raised awareness of more prudent management
of finances and has increased the focus on the bottom line.
This boosts transparency within the company and minimizes
risks in potential investments, acquisitions and customer
projects. The disclosure of the results by division (segment
reporting) also substantially improves public transparency.
This capital-oriented approach and mindset has already had a
positive impact on the figures for the year under review.
RUAG not only made a reasonable profit, but generated the
highest free cash flow in its history.
Stronger risk management
In view of the medium-term strategic objectives, increased
internationalization is key to RUAG’s success. Whereas
business with the Swiss Armed Forces is based on a long-
standing partnership and the risks are calculable, projects
abroad in new countries and economic regions require more
differentiated risk management. To meet these growing
demands, additional resources were allocated to risk man-
agement in the year under review.
Risk management accompanies RUAG's internationalization
and supports the divisions with specific tools, a systematic
assessment of risk and a constructive risk dialogue. The focus
is on risks that could compromise RUAG's achievement of
its strategic goals. Accordingly, a supervised risk assessment
is regularly carried out with a view to ensuring that the
Board of directors and Executive Board recognize significant
risks at an early stage and are thus able to implement suit-
able measures in time.
The model used for the risk assessment breaks down risks
into the four categories of operational, strategy, reporting
and compliance risks.

RUAG ANNUAL REPORT 201040
PROFILE FOREWORD BUSINESS PERFORMANCE FINANCIAL STATEMENTS CORPORATE GOVERNANCEPROFILE FOREWORD BUSINESS PERFORMANCE FINANCIAL STATEMENTS CORPORATE GOVERNANCE
Financial Statements.

RUAG ANNUAL REPORT 2010 41
Contents.
Financial Statements
Key fi gures
Five-year overview
Consolidated income statement
Consolidated statement of comprehensive income
Consolidated statement of fi nancial position
Consolidated statement of cash fl ows
Consolidated statement of changes in equity
Notes to the consolidated fi nancial statements
1 Business activities and relationship
with the Swiss Confederation
2 Key accounting principles
3 Risk management and assessment
4 Critical accounting estimates
and assumptions
5 One-time charges
6 Acquisitions, disposals and mergers
7 Net sales
8 Staff costs
9 Other operating expenses
10 Research and development expenses
11 Finance income / fi nance costs
12 Income tax expense
13 Deferred tax income
14 Cash and cash equivalents
15 Financial assets
16 Receivables and prepayments
17 Inventories and work in progress
18 Percentage of Completion (POC)
19 Property, plant and equipment
20 Investment property
21 Intangible assets / goodwill
22 Associates
23 Financial liabilities
24 Other current liabilities
25 Trade accounts payable and prepayments
26 Other non-current liabilities
27 Provisions
28 Contingent liabilities towards third parties
29 Additional contingent liabilities
not stated at the balance sheet
30 Assets pledged as collateral
31 Fire insurance values
32 Share capital
33 Events after the balance sheet date
34 Related party transactions
35 Compensation of
key management personnel
36 Future minimum lease obligations
37 Financial instruments
38 Employee benefi ts
39 Segment information
40 Consolidated companies, associates
and non-controlling interests
Auditors’ report on the
consolidated fi nancial statements of RUAG
Financial statements of RUAG Holding Ltd
Proposed allocation of profi t
Auditors’ report on the fi nancial statements
of RUAG Holding Ltd
42
43
44
45
46
47
48
49
49
49
57
59
61
62
64
65
65
65
65
66
67
68
68
69
70
70
71
72
73
74
75
76
76
77
77
77
78
78
79
79
79
79
79
80
81
83
86
88
89
91
95
96

RUAG ANNUAL REPORT 201042
PROFILE FOREWORD BUSINESS PERFORMANCE FINANCIAL STATEMENTS CORPORATE GOVERNANCE
1 One-time charges are described in Note 5 to the consolidated fi nancial statements.2 EBITDA = Earnings before interest, taxes, depreciation, amortization and goodwill impairment.3 EBIT = Earnings before interest and taxes.4 Net profi t as a percentage of average equity.5 Depreciation of property, plant and equipment and amortization of intangible assets.6 Dividend paid as a ratio of consolidated net profi t / (loss) in the relevant year-back period.
Key fi guresin CHF m 2010 2009
Order infl ow 1 713 1 872
Order backlog 1 653 1 783
Net sales 1 796 1 696
Operating income 1 837 1 722
Cost of materials and purchased services (648) (650)
Staff costs (820) (776)
Other operating (expenses) income (174) (258)
EBITDA before one-time charges1 168 125
EBITDA2 194 38
EBITDA in % of operating income 10.6% 2.2%
EBIT before one-time charges1 93 45
EBIT3 98 (113)
EBIT in % of operating income 5.3% (6.6%)
Net profi t (loss) 92 (107)
Net profi t (loss) in % of operating income 5.0% (6.2%)
Cash fl ows from operating activities 130 131
Cash fl ows from investing activities (50) (230)
Free cash fl ow 80 (99)
Cash fl ows from fi nancing activities (78) 87
Equity before non-controlling interests 725 661
Equity in % of total assets 40.8% 37.3%
Return on equity 4 13.2% (15.0%)
Depreciation and amortization5 90 143
Goodwill impairment 6 9
Research and development expenses 190 149
in % of operating income 10.3% 8.6%
Net sales per employee in CHF 233 563 233 781
Value added per employee in CHF 141 875 127 867
Number of employees at end-December 7 719 7 534
Number of employees (annual average) 7 689 7 253
Number of registered shares (par value CHF 1000) 340 000 340 000
Earnings (loss) per registered share 269.26 (314.02)
Dividend per registered share 0.00 29.41
Distribution ratio6 0.0% 19.7%
Book value per registered share in CHF 2 132 1 943

RUAG ANNUAL REPORT 2010 43
Five-year overviewin CHF m 2010 2009 2008 2007 2006
Order infl ow 1 713 1 872 1 582 1 684 1 659
Order backlog 1 653 1 783 1 508 1 394 1 112
Net sales 1 796 1 696 1 537 1 409 1 247
EBIT1 98 (113) 57 76 71
EBIT in % of operating income 5.3% (6.6%) 3.7% 5.4% 5.7%
Net profi t (loss) 92 (107) 51 76 69
Net profi t (loss) in % of operating income 5.0% (6.2%) 3.2% 5.4% 5.6%
Cash fl ows from operating activities 130 131 81 52 105
Cash fl ows from investing activities (50) (230) (121) (80) (100)
Free cash fl ow 80 (99) (40) (28) 5
Cash fl ows from fi nancing activities (78) 87 32 53 (48)
Equity before non-controlling interests 725 661 763 784 729
Equity in % of total assets 40.8% 37.3% 48.1% 54.5% 59.4%
Return on equity2 13.2% (15.0%) 6.6% 10.0% 9.5%
Research and development expenses 190 149 123 85 76
in % of operating income 10.3% 8.6% 7.9% 6.0% 6.1%
Number of employees at end-December 7 719 7 534 6 687 6 104 5 720
Number of employees (annual average) 7 689 7 253 6 310 6 050 5 677
1 EBIT = Earnings before interest and taxes.2 Net profi t as a percentage of average equity.
SUMMARY

RUAG ANNUAL REPORT 201044
PROFILE FOREWORD BUSINESS PERFORMANCE FINANCIAL STATEMENTS CORPORATE GOVERNANCE
Consolidated income statement 1 January to 31 Decemberin CHF m Note 2010 2009
Net sales 7 1 796 1 696
Own work capitalized 5 13
Changes in inventories and work in progress 36 13
Operating income 1 837 1 722
Cost of materials and purchased services (648) (650)
Staff costs 8 (820) (776)
Other operating expenses 9 (174) (258)
EBITDA1 194 38
Depreciation and amortization 5, 19, 20, 21 (90) (143)
Goodwill impairment 5 (6) (9)
EBIT2 98 (113)
Finance income 11 1 1
Finance costs 11 (15) (5)
Share of profi t (loss) of associates 22 4 2
Profi t (loss) before tax 88 (116)
Income tax expense 12 (14) (1)
Deferred tax income 13 18 10
Net profi t (loss) 92 (107)
Attributable to:
Shareholders of RUAG Holding Ltd 92 (107)
Non-controlling interests (0) 0
Net profi t (loss) 92 (107)
The notes to the consolidated fi nancial statements on
pages 49 to 88 form an integral part of the consolidated
fi nancial statements.
1 EBITDA = Earnings before interest, taxes, depreciation, amortization and goodwill impairment. 2 EBIT = Earnings before interest and taxes.

RUAG ANNUAL REPORT 2010 45
Consolidated statement of comprehensive income 1 January to 31 December in CHF m 2010 2009
Hedge accounting 9 13
Other effects recognized in other comprehensive income1 (0) (2)
Exchange differences (36) 4
Tax effects (0) (0)
Other comprehensive income (27) 15
Net profi t (loss) reported in the income statement 92 (107)
Total comprehensive income 65 (92)
Attributable to:
Shareholders of RUAG Holding Ltd 65 (92)
Non-controlling interests (0) 0
Total comprehensive income 65 (92)
The notes to the consolidated fi nancial statements on
pages 49 to 88 form an integral part of the consolidated
fi nancial statements.
CONSOLIDATED FINANCIAL STATEMENTS
1 Owing to the application of IAS 19, Nitrochemie Wimmis AG (equity company) recognized changes in equity in fi nancial year 2009. The proportional effect for RUAG is shown under “Other effects recognized in other comprehensive income”.

RUAG ANNUAL REPORT 201046
PROFILE FOREWORD BUSINESS PERFORMANCE FINANCIAL STATEMENTS CORPORATE GOVERNANCE
Consolidated statement of fi nancial position at 31 December in CHF m Note 2010 2009
Cash and cash equivalents 14 70 69
Current fi nancial assets 15 17 9
Receivables and prepayments 16 338 383
Tax assets 2 5
Prepaid expenses and deferred charges 11 18
Inventories and work in progress 17 535 443
Current assets 972 927
Property, plant and equipment 19 461 474
Investment property 20 83 83
Intangible assets 21 97 120
Goodwill 21 78 88
Associates 22 39 38
Non-current fi nancial assets 15 3 3
Deferred tax assets 13 42 27
Non-current assets 804 833
Assets held for sale — 10
Total assets 1 776 1 770
Current fi nancial liabilities 23 49 247
Other current liabilities 24 39 23
Trade accounts payable and prepayments 25 378 359
Tax liabilities 10 11
Deferred income and accrued charges 165 161
Current provisions 27 103 132
Current liabilities 744 934
Non-current fi nancial liabilities 23 123 1
Other non-current liabilities 26 3 3
Non-current provisions 27 119 110
Deferred tax liabilities 13 60 61
Non-current liabilities 306 174
Share capital 32 340 340
Additional paid-in capital 10 10
Retained earnings 422 331
Other reserves 7 (2)
Exchange differences (53) (18)
Equity before non-controlling interests 725 661
Non-controlling interests 1 1
Total equity after non-controlling interests 726 662
Total equity and liabilities 1 776 1 770
The notes to the consolidated fi nancial statements on
pages 49 to 88 form an integral part of the consolidated
fi nancial statements.

RUAG ANNUAL REPORT 2010 47
Consolidated statement of cash fl ows 1 January to 31 Decemberin CHF m Note 2010 2009
Net profi t (loss) 92 (107)
Depreciation and amortization 5,19, 20, 21 90 143
Goodwill impairment 5 6 9
Change in non-current provisions and deferred taxes 7 1
Utilization of non-current provisions (4) (3)
Share of profi t (loss) of associates 22 (4) (2)
Other non-cash items (3) (2)
Change in working capital1 (54) 86
Adjustment for net gain (loss) on disposal of non-current assets (11) 1
Foreign exchange effect on loans 5 —
Finance income received (1) (1)
Finance costs paid 7 6
Cash fl ows from operating activities2 130 131
Acquisition of plant and equipment3 19 (62) (46)
Acquisition of property 19, 20 (8) (39)
Acquisition of intangible assets 21 (1) (3)
Acquisition of investments 6 (3) (146)
Disposal of plant and equipment 4 1
Disposal of property 20 0
Disposal of intangible assets 0 0
Disposal of investments — —
Dividends received from associates 22 1 3
Dividends received from other investments 0 0
Cash fl ows from investing activities (50) (230)
Free cash fl ow 80 (99)
Net increase (decrease) in capital 0 (0)
Increase in third-party fi nancial assets — 0
Decrease in third-party fi nancial assets 0 2
Increase in third-party fi nancial liabilities — 125
Decrease in third-party fi nancial liabilities (71) (20)
Repayment of fi nance leases (1) (5)
Finance income received 1 1
Finance costs paid (7) (6)
Dividends to shareholders — (10)
Cash fl ows from fi nancing activities (78) 87
Effect of exchange rate changes on cash and cash equivalents (2) 0
Cash and cash equivalents acquired (disposed) 6 — 16
Change in cash and cash equivalents 1 4
Cash and cash equivalents at beginning of year 69 65
Cash and cash equivalents at end of year 70 69
CONSOLIDATED FINANCIAL STATEMENTS
1 Excludes current fi nancial assets and current fi nancial liabilities and other non-current liabilities. 2 Including income taxes of CHF 10 million (CHF 9 million) paid in the year under review. 3 Actual leasing payments accounted for in the case of leases.

RUAG ANNUAL REPORT 201048
PROFILE FOREWORD BUSINESS PERFORMANCE FINANCIAL STATEMENTS CORPORATE GOVERNANCE
In 2009, a dividend of CHF 10 million was paid to
the owner. This is equivalent to a dividend per share of
CHF 29.41. In 2010, no dividend was paid.
The notes to the consolidated fi nancial statements on
pages 49 to 88 form an integral part of the consolidated
fi nancial statements.
Consolidated statement of changes in equityin CHF m
Share capital
Additional paid-in capital
Retained earnings
Otherreserves1
Exchange differences
Non-controlling
interestsTotal
equity
Balance at 1 January 2009 340 10 449 (15) (21) 1 763
Change — — — — — (0) (0)
Net profi t (loss) — — (107) — — (0) (107)
Other comprehensive income — — (2) 13 — — 11
Exchange differences — — 0 — 4 — 4
Total comprehensive income for 2009 — — (109) 13 4 (0) (92)
Dividends from 2008 result — — (10) — — 0 (10)
Buyout of non-controlling interests — — (0) — — — (0)
Initial consolidation of non-controlling interests — — — — — 1 1
Balance at 31 December 2009 340 10 330 (2) (18) 1 662
Balance at 1 January 2010 340 10 330 (2) (18) 1 662
Change — — 0 0 — 0 0
Net profi t (loss) — — 92 — — 0 92
Other comprehensive income — — (0) 9 — — 9
Exchange differences — — (0) — (36) (0) (36)
Total comprehensive income for 2010 — — 92 9 (36) 0 65
Dividends from 2009 result — — — — — — —
Buyout of non-controlling interests — — — — — — —
Initial consolidation of non-controlling interests — — — — — — —
Balance at 31 December 2010 340 10 422 7 (53) 1 726
1 Other reserves comprise the positive and negative replacement values of the open hedging instruments. In the year under review, due to the occurrence of the underlying transactions, CHF 9 million was transferred from other reserves to other operating expenses (in the previous year, CHF 9 million was recognized in operating income). Further information is given in Note 37, Financial instruments.
RUAG ANNUAL REPORT 2010 49
This fi nancial report is a translation from the
original German version. In case of any inconsistency
the German version shall prevail.
1 Business activities and relationship
with the Swiss Confederation
RUAG Holding Ltd is a Swiss joint-stock company head-
quartered in Berne. It is wholly owned by the Swiss
Confederation. RUAG Holding Ltd and its subsidiary compa-
nies (hereinafter referred to as “RUAG”) are bound by
the owner’s strategy of the Swiss Federal Council. In March
2007, the Federal Council approved a new owner’s strategy
for RUAG, the state-owned defence technology company,
for the period 2007 to 2010. According to this strategy,
the Federal Council expects RUAG to direct its activities
towards the key defence equipment and technologies –
in particular system technologies – that are essential to
Switzerland’s national defence capability.
Relationship with the Swiss Confederation The Swiss
Confederation is the sole shareholder of RUAG. Under
the terms of the Federal Act on State-Owned Defence
Technology Companies, any reduction in the Confederation’s
shareholding to less than the majority would require a
change in law. Such an amendment would require a vote
in the Federal Assembly and under certain circumstances
would also be subject to a referendum of the Swiss
electorate. As sole shareholder, the Confederation exercises
control over all decisions taken at the General Meeting,
including the election and remuneration of members of
the Board of Directors and dividend resolutions.
Transactions with the Confederation RUAG provides
maintenance services and produces defence equipment
for the Federal Department of Defence, Civil Protection and
Sport (DDPS), and procures services from the same. The
DDPS is RUAG’s largest customer. The procurement contracts
awarded by the DDPS for defence equipment and services
are subject to civil law. The process of awarding contracts is
subject to the Swiss Confederation’s provisions regarding
public procurement. These provisions apply to all suppliers of
goods and services, and are based on the principle of
free competition.
2 Key accounting principles
2.1 Format of presentation
RUAG’s consolidated fi nancial statements have been
drawn up in accordance with the latest International Finan-
cial Reporting Standards (IFRS) produced by the Interna-
tional Accounting Standards Board (IASB) and Interpretations
of the IFRS Interpretations Committee (IFRS IC), as well
as the provisions of Swiss law. The consolidated fi nancial
statements are presented in Swiss francs (CHF).
All fi gures are given in millions of Swiss francs, unless
stated otherwise.
2.2 New and revised accounting standards
Revised International Financial Reporting Standards
and Interpretations adopted for the fi rst time in the year
under review:
• IAS 32 (revised) “Financial Instruments: Presen-
tation” IAS 32 states that certain subscription rights
such as options and warrants in foreign currency
are to be presented as equity by the issuer of the
equity instruments to which these rights relate and
are no longer recognized as liabilities.
• IAS 39 (revised) “Financial Instruments: Recognition
and Measurement”: IAS 39 contains a clarifi cation
of the principles of application in relation to the
designation of infl ation risk as a hedged item and
the designation of one-sided risk in a hedged item.
• “Amendments to IFRSs”: The amendments to IFRSs
comprise minor changes to various IFRS Standards.
Amendments to existing International Financial
Reporting Standards (IFRS) and Interpretations have
also entered into force that have no effect on
RUAG’s fi nancial reporting:
• IFRS 1 (revised) “First-time Adoption of
International Financial Reporting Standards”
• IFRS 2 (revised) “Share-based Payment”
• IFRIC 17 “Distributions of Non-cash Assets to
Owners”
• IFRIC 19 “Extinguishing Financial Liabilities with
Equity Instruments”
NOTES TO THE CONSOLIDATED FINANCIAL STATEMENTS
RUAG ANNUAL REPORT 201050
PROFILE FOREWORD BUSINESS PERFORMANCE FINANCIAL STATEMENTS CORPORATE GOVERNANCE
Changes to International Financial Reporting Standards
and Interpretations that are not yet mandatory. The
following International Financial Reporting Standards and
Interpretations, which were published prior to the end
of 2010, must be adopted either from fi nancial year 2011
or at a later date:
• IFRS 7 (revised) “Financial Instruments: Disclosures”
(effective 1 July 2011) contains changes concerning the
disclosure of derecognized fi nancial instruments.
RUAG will adopt the new disclosure obligations in its
fi nancial reporting, effective 31 December 2011.
• IFRS 9 “Financial Instruments” (effective 1 January 2013):
IFRS 9 replaces the current IAS 39 ”Financial Instruments:
Recognition and Measurement”. RUAG will review
its reporting in light of the entry into force of this new
Standard.
• IAS 12 (revised) “Income Taxes” (effective 1 January 2012)
contains changes concerning deferred taxes in connec-
tion with investment property measured at fair value.
RUAG does not expect this revised standard to have any
effect on its reporting.
• IAS 24 (revised) “Related Party Disclosures” (effective
1 January 2011) contains amendments to the defi nition
of a related party together with a simplifi cation of
disclosure requirements for government-related entities.
RUAG does not expect adoption of this revised Standard
to have any effect on its reporting.
• IFRIC 14 (revised) “The Limit on a Defi ned Benefi t Asset,
Minimum Funding Requirements and Their Interaction”
(effective 1 January 2011): This amendment relates to
situations where an entity is subject to minimum funding
requirements and prepays its contributions in order
to meet these requirements. The amendment enables
the benefi ts arising from such prepayment to be recog-
nized as an asset. RUAG does not expect adoption
of this revised Interpretation to have any effect on its
reporting.
2.3 Use of benchmarks such as EBITDA, EBIT,
free cash fl ow and net debt
In the company’s opinion, EBITDA, EBIT, free cash fl ow
and net debt are important benchmarks that are of
special signifi cance to RUAG. EBITDA, EBIT, free cash fl ow
and net debt do not constitute IFRS-compliant bench-
marks for operating performance or liquidity, however,
since the benchmarks have not been defi ned on a uniform
basis. For this reason, the reported EBITDA, EBIT, free
cash fl ow and net debt may not comparable with similarly
termed benchmarks used by other companies.
2.4 Consolidation principles
RUAG’s consolidated fi nancial statements include all
subsidiary companies that it directly or indirectly controls
by a majority of the votes or by any other means.
An overview of all major subsidiaries and associates is
provided in Note 40.
Capital is consolidated in accordance with the purchase
method. The assets, liabilities, equity, income and expenses
of fully consolidated subsidiary companies, are included in
their entirety in the consolidated fi nancial statements.
Non-controlling interests in equity and profi t are stated
separately.
Subsidiaries and associates are consolidated with effect
from the date of their acquisition, and eliminated from the
consolidated fi nancial statements in the event of a loss
of control.
All intra-Group receivables, liabilities, expenses and income,
as well as unrealized interim profi ts, are eliminated on
consolidation.
Annual reporting for all subsidiaries ends on 31 December.
Associates on which RUAG exerts a signifi cant infl uence
(normally 20 to 50 percent of direct or indirect voting rights),
but which it does not control, are recognized using the
equity method. An equity investment is initially recorded at
cost (except in the case of negative goodwill to fair value).
In the reporting periods following the acquisition, this
fi gure is adjusted to take account of RUAG’s share in the
additional capital generated or losses incurred.
Signifi cant positions and transactions with associates
recognized using the equity method are shown separately
as “Associates”.
Other investments on which RUAG does not exercise
signifi cant infl uence (less than 20 percent of direct or indirect
voting rights) are stated at fair value and shown under
“Non-current fi nancial assets”.

RUAG ANNUAL REPORT 2010 51
2.6 Cash and cash equivalents
Cash and cash equivalents comprise cash and the balances
in postal checking and demand deposit accounts with
banks. They also include term deposits held with fi nancial
institutions and short-term money market investments
with an initial term of max. three months. They are stated
at par value.
2.7 Current fi nancial assets
Current fi nancial assets comprise term deposits held with
fi nancial institutions and short-term money market
investments with an initial term of more than three months
but no longer than twelve months (par value), the
equivalent amount of open foreign currency hedging
transactions (fair value) and lendings.
2.8 Receivables and prepayments
Trade receivables are measured at the original invoiced
amount (amortized cost), minus a valuation allowance for
doubtful accounts which is estimated on the basis
of an analysis of receivables outstanding at the end of
the reporting period. Receivables judged to be non-
recoverable are shown in the income statement under
“Other operating expenses”.
2.9 Inventories and work in progress
Inventories are measured at the lower of cost and net
realizable value. Cost includes all production costs including
pro rata production overheads. All foreseeable exposures
to loss from orders in progress are accounted for by econo-
mically reasonable valuation allowances. The valuation
of inventories follows the weighted average method
or standard cost accounting. Standard costs are regularly
monitored and, if any major discrepancies are observed,
adjusted to the latest conditions. Impairment losses
are reported for hard-to-sell or slow-moving inventories.
Non-saleable inventories are written off in full.
2.5 Foreign currencies
RUAG’s consolidated fi nancial statements are presented
in Swiss Francs (CHF).
Transactions in foreign currencies are translated into the
functional currency at the exchange rate applicable at the
time of the transaction. Foreign-currency receivables
and liabilities are converted into the functional currency
at the exchange rate applicable at the end of the reporting
period. The resulting exchange differences are recog-
nized in the income statement.
Differences arising in the year under review from the
conversion of equity and non-current intra-Group fi nancial
transactions related to net investments in foreign operations,
in addition to retained earnings and other equity items,
are assigned directly to cumulative exchange differences
under equity.
The assets and liabilities of subsidiaries and asso-
ciates recognized using the equity method, whose functio-
nal currency is not the Swiss Franc, are converted into
Swiss francs on consolidation at the exchange rate
applicable at the end of the reporting period. The income
statement, cash fl ow statements and other fl uctuating
items are translated at the average exchange rate for the
reporting period. The effects of exchange differences
resulting from the translation of the fi nancial statements of
foreign subsidiaries or associates are recognized in other
comprehensive income and are shown separately as
cumulative exchange differences. In the event of the disposal
of a foreign operation or associate, cumulative translation
differences are recognized in the income statement as
a component of the profi t or loss from disposals.
The exchange rates of signifi cance to the consolidated
fi nancial statements in the reporting years were:
NOTES TO THE CONSOLIDATED FINANCIAL STATEMENTS
Exchange rates Currency Annual average
2010End-of-year rate
2010Annual average
2009End-of-year rate
2009
Euro EUR 1.38 1.25 1.51 1.48
Swedish krona SEK 14.47 13.95 14.23 14.45
US dollar USD 1.04 0.94 1.09 1.03
Pound Sterling GBP 1.61 1.45 1.70 1.66
Hungarian forinth HUF 0.50 0.45 0.54 0.55
RUAG ANNUAL REPORT 201052
PROFILE FOREWORD BUSINESS PERFORMANCE FINANCIAL STATEMENTS CORPORATE GOVERNANCE
Long-term construction contracts are measured according
to the percentage of completion method. Subject to
the fulfi lment of certain conditions, receivables and sales
are stated in accordance with the percentage of completion
method. Long-term construction contracts are defi ned
as manufacturing orders where completion of the order
extends over at least two reporting periods, calculated from
the time the order is awarded to the time it is essentially
completed.
The percentage of completion is derived from the relation-
ship between the costs incurred by the order and the
overall estimated cost of the order (cost-to-cost method).
Losses from long-term construction contracts are recognized
immediately and in full in the fi nancial year in which the
losses are identifi ed, irrespective of the percentage of
completion. Order costs and pro rata profi ts from long-term
construction contracts which are valued according to
the percentage of completion method are shown as work in
progress (percentage of completion) as a component
of inventories and work in progress. They are stated at cost
plus a pro rata profi t that corresponds to the percentage
of completion achieved.
In the Space division, the milestone method is applied.
Here, project milestones are defi ned on the basis of indivi-
dual customer contracts; upon reaching these milestones,
services performed are invoiced to the customer and
sales and income are realized on a pro-rata basis. If the
conditions for applying the percentage of completion
method are not fulfi lled, valuation follows the completed
contract method. In this case realization of income is
generally permitted only when the associated risks have
been transferred and the service has been provided.
Semi-fi nished products and services in progress are stated
under “inventories of fi nished goods and work in
progress item”.
Sales from services provided are recognized in the income
statement on the basis of the stage of completion
at the end of the reporting period.
2.10 Property, plant and equipment and intangible
assets with a fi nite useful life
Property, plant and equipment and intangible assets are
measured at cost minus accumulated depreciation calculated
on a straight-line basis. Repair and maintenance costs
are stated as an expense. Major renovations and other value-
enhancing expenses are recognized under property, plant
and equipment and depreciated over their estimated useful
life. Land is shown at cost.
RUAG applies the following estimated useful life:
Useful life in years
Operating properties 20 to 60
Plant and equipment 5 to 12
Fixtures and fi ttings 10
Motor vehicles 5 to 10
Computer hardware/software 3 to 5
Intangible assets 1 to 10
2.11 Investment properties
Investment properties are measured at cost minus accumu-
lated depreciation calculated on a straight-line basis.
Repair and maintenance costs are stated as an expense.
Major renovations and other value-enhancing costs
are recognized under property, plant and equipment and
depreciated over their estimated useful life. Investment
properties are depreciated over a useful life of 40 of 60 years
with the exception of land, which is not depreciated.
Sites that are majority-leased to third parties are classifi ed
as investment properties. The fair value of the properties is
calculated solely for disclosure reasons and is based
on capitalized rental income. No expert market appraisal
was carried out in the reporting period.
2.12 Leases
Leased assets where the benefi ts and risk arising from
ownership are essentially transferred to RUAG are recog-
nized at the lower of fair value of the leased asset and
present value of the minimum lease payments on inception
of the lease. Correspondingly, the estimated net present
value of future, non-cancellable lease payments is carried
under liabilities from fi nance leases. Assets under
fi nance leases are amortized over the shorter of their
estimated useful life or the duration of the lease. All other
lease transactions are classifi ed as operating leases.

RUAG ANNUAL REPORT 2010 53
NOTES TO THE CONSOLIDATED FINANCIAL STATEMENTS
2.13 Intangible assets and goodwill
Acquired companies are consolidated in accordance with
the purchase method. The acquisition costs comprise
the sum of the fair values of the assets transferred to the
seller and liabilities incurred or assumed on the trans-
action date.
Identifi able acquired assets, liabilities and contingent
liabilities are reported in the balance sheet at their fair
values on the date of acquisition, irrespective of the
extent of any minority interests. Goodwill is measured by
the Group as the excess of the cost of the acquisition
over its share of the fair values of the identifi able net assets.
Companies acquired or disposed during the fi nancial
year are recognized in the consolidated fi nancial statements
as of the date of acquisition or disposal.
2.14 Impairment
Impairment of goodwill For impairment testing purposes,
goodwill is allocated to cash generating units. The impair-
ment test is performed in the fourth quarter following
completion of the business plan. If there are indications of
a possible impairment during the year, an impairment
test is performed for the cash generating unit at such time.
Where the recoverable amount of the cash generating
unit is less than the carrying amount, an impairment
is recognized. The recoverable amount is the higher of
fair value less costs to sell or value in use. An impairment
loss of goodwill cannot be offset in future periods.
Impairment of property, plant and equipment and
other intangible assets The current value of property,
plant and equipment and other intangible assets is
reassessed whenever changes in circumstances or events
indicate that the carrying amount may be overesti-
mated. Where there is an indication of a possible over-
estimate, the Group measures fair value on the basis
of expected future cash fl ows from use and eventual sale,
minus any cost of disposal. Where the carrying amount
exceeds the higher of fair value less costs to sell and value
in use, an impairment loss equivalent to the difference
is recorded. The impairment assessment is based on the
smallest group of assets for which independent cash
generating units are identifi able. The estimation of future
discounted cash fl ows is based on the forecasts and
assumptions of the Executive Board. Accordingly,
the actual cash fl ows generated may differ signifi cantly
from these estimates.
2.15 Research and development expenses
Research expenses are not capitalized and are expensed
as incurred. The Group examines the capitalization of
development costs in each individual case and in
the process assesses the inherent risk of new products
and their development in the light of the uncertain
nature of future benefi ts and the timing of returns.
Contributions from third parties arising from contract
development work are recognized as sales and
assigned to the period in which the corresponding
development costs are incurred.
2.16 Provisions
Provisions are recognized where, due to a past event:
a) RUAG has a current liability;
b) it is likely that an outfl ow of resources
embodying economic benefi ts will be required
to settle the liability; and
c) a reliable estimate can be made of the amount
of the liability.
Provisions for restructuring Costs arising in con-
nection with staff reduction programmes are treated as
an expense when Management has decided on a
programme from which a probable liability has arisen
and the amount of this liability can be estimated
reliably. The terms and the number of employees affec-
ted must be determined, and the employees or
their representatives must be informed about the staff
reduction programme.
Provisions for losses on contracts Losses on contracts
are calculated immediately and in full in the fi nancial
year in which the losses are identifi ed.
Provisions for warranties Provisions for warranties
are made in accordance with standard business practices.
These are based on services provided in the past and on
current contracts.
Provisions for leave and overtime credits Employees’
entitlements to leave and overtime credits are recognized
and deferred at the end of the reporting period.
RUAG ANNUAL REPORT 201054
PROFILE FOREWORD BUSINESS PERFORMANCE FINANCIAL STATEMENTS CORPORATE GOVERNANCE
2.17 Employee benefi t obligations
The projected unit credit method is used throughout
the Group. This method takes account of the number of
completed years of service and the salary growth
of the insured individuals up to the cut-off date for the
calculation.
The majority of RUAG employees are insured in defi ned
benefi t plans according to IAS 19 (revised). For its staff in
Switzerland, RUAG pays contributions to VORSORGE
RUAG, an employee benefi t fund set up in line with the
Swiss defi ned contribution system. This provides statutory
coverage for retirement, death and disability. The expenses
and obligations arising from the employee benefi t fund
are calculated using the actuarial principles of the projected
unit credit method. This takes account of the numbers
of years in service of employees up to the cut-off date for
the calculation and makes assumptions as to future
development of salaries.
Annual benefi t expenses are calculated on an actuarial
basis. The latest actuarial appraisal was carried out on the
basis of data as at 1 January 2010. Current benefi t entitle-
ments are stated in the period of the income statement
in which they arise. The effects of changes in the actuarial
assumptions are stated on an equal basis in the income
statement via the assumed average remaining service years
of the insured individuals. The actuarial gains and losses
to be stated on a pro rata basis correspond to the cumulati-
ve, non-recognized actuarial gains and losses at the
end of the previous reporting period that exceeded the
higher of the following amounts: 10% of the present value
of the defi ned benefi t obligations at the time (prior to
deduction of the scheme assets) and 10% of the fair value
of the fund’s assets at the time. The past service cost
arising from changes in the scheme is stated as an expense
on a straight-line basis over the average period until the
vesting period. Insofar as qualifying rights are immediately
vested, the corresponding expense is recognized imme-
diately.
RUAG pays premiums to various employee benefi t
plans for its subsidiaries abroad (essentially Germany
and Sweden).
2.18 Other long-term employee benefi ts
Other long-term employee benefi ts include long-service
awards. These are calculated using the projected unit
credit method and are reported in the item “Provisions
for loyalty bonuses and anniversary benefi ts”.
2.19 Income taxes /deferred taxes
Income taxes are recognized on an accrual basis. Deferred
taxes are recognized in accordance with the comprehensive
liability method. The calculation is based on the temporary
differences between the values of assets or liabilities
as recognized by the revenue authorities and the values
as stated in the consolidated fi nancial statements, unless
such temporary difference relates to investments in
subsidiaries or associates where the timing of the reversal
can be controlled and it is likely that this will not occur
in the foreseeable future. Furthermore, provided no
profi t distributions are anticipated, withholding taxes and
other taxes on possible subsequent distributions are not
measured since profi ts are generally reinvested. The Group’s
deferred tax assets or liabilities, as calculated on the
basis of corresponding local tax rates, are stated under non-
current assets (deferred tax assets) or non-current liabilities
(deferred tax liabilities). The change in this item over the
course of the year is recognized in the income statement,
provided it relates to a position that is included in or
disclosed under equity. Deferred tax claims on a company’s
tax-deductible losses are taken into account to the extent
that there are likely to be future profi ts against which
they can be used. The tax rates are determined by the actual
and anticipated tax rates in the relevant legal units.
2.20 Net sales
Net sales include the fair value of the consideration
received from the sale of goods and the rendering of ser-
vices by RUAG in its ordinary business operations.
The amount is shown after any deductions for value
added tax, price reductions, rebates and discounts and
intra-Group sales.
RUAG records its sales when the amounts can be mea-
sured reliably, future cash fl ows are likely and the specifi c
criteria described below have been fulfi lled.
Sale of goods Sales from the sale of goods are
stated at the time of delivery or performance, i.e. when
the relevant opportunities and risks are transferred to
the buyer.
Rendering of services Sales from the rendering
of services are determined on the basis of either time
material or a fi xed price contract.
Sales on the basis of time and material, which are typical
for service agreements in the maintenance business
for the Federal Department of Defence, Civil Protection
and Sport (DDPS), are measured on the basis of contrac-
tually agreed rates and direct costs.
RUAG ANNUAL REPORT 2010 55
NOTES TO THE CONSOLIDATED FINANCIAL STATEMENTS
Sales from fi xed price agreements, when both the
full costs incurred up to completion of the order and the
percentage of completion at the end of the reporting
period can be reliably measured, are reported on the basis
of the percentage of completion method (POC).
If the proceeds of a construction contract cannot be
reliably measured, sales are recognized only to the extent of
the potentially recoverable costs incurred by the contract
recognized as an expense in the relevant period.
Other income RUAG’s other income, such as rental
income and interest income, is stated on a time-
proportionate basis, as is dividend income where the legal
entitlement to payment has arisen.
2.21 Advance payments received
Advance payments are deferred and then realized when
the corresponding services are provided.
2.22 Segment information
Reportable operating segments are determined on the
basis of the management approach. The segment
information is consistent with RUAG’s organizational and
management structure as well as internal fi nancial
reporting to RUAG’s Chief Operating Decision Maker.
The Chief Operating Decision Maker (CODM) at RUAG
is the Chief Executive Offi cer (CEO). Reporting is based on
the Space, Aviation, Technology, Defence and Ammotec
divisions. In addition, Services – comprising central
services such as IT and real estate management, as well
as RUAG’s corporate units – is presented separately.
Services between the segments are invoiced at market
prices. Unrealized gains or losses may be incurred
as a result of services or disposal of assets between the
individual segments. They are eliminated and stated
in segment information, in the “Intercompany” column.
The segment assets contain all the assets required
for operations that can be assigned to a specifi c operating
segment. The segment assets primarily comprise
receivables, inventories, property, plant and equipment
and intangible assets. The segment investments
contain additions to property, plant and equipment
and other intangible assets.
Space division RUAG Space is an independent space
supplier, providing services in the product areas of
launch vehicle structures and separation systems, satellite
structures, mechanisms and mechanical equipment,
digital electronics for satellites and launch vehicles,
satellite communications equipment and satellite instru-
ments.
Aviation division RUAG Aviation is a centre of excellence
for civil and military aircraft maintenance and for aviation
systems development, manufacturing and integration. In
addition to MRO and fi nal assembly, its services also include
engineering, especially for upgrade programmes and
electronic subsystems, and developing electronic counter
measure systems. Its customers are the Swiss Air Force and
international air forces and aircraft operators.
Technology division RUAG Technology provides services
in aerostructures, with a focus on manufacturing aircraft tail
sections, wing and control components and sophisticated
component assemblies and parts for civil and military aircraft.
RUAG Technology is also active in the areas of Mechanical
Engineering, Coatings and Environment.
Ammotec division RUAG Ammotec specializes in high-
quality pyrotechnic products for military and civil markets and
for industry. Activities include developing and manufacturing
small-calibre ammunition for hunting and sport as well as
armies and government agencies.
Defence division RUAG Defence is primarily active
in the areas of simulation and training of land forces, inte-
gration, operation and maintenance of IT-based
systems, as well as heavy weapons systems, protection and
command and control. Its services include consulting,
engineering, development, support and operation. RUAG
Defence’s main partner is the Swiss Army.
On 1 January 2010, the divisions were partially restructured.
Due to these restructuring, the segment information contains
only the fi gures for 2010. Sales and operating expenses
in the new segment structure are not available for prior years
and the cost to develop it would be excessive.

RUAG ANNUAL REPORT 201056
PROFILE FOREWORD BUSINESS PERFORMANCE FINANCIAL STATEMENTS CORPORATE GOVERNANCE
2.23 Related party transactions
RUAG provides maintenance services and produces
defence equipment for the Federal Department of Defence,
Civil Protection and Sport (DDPS), and procures services
from the same. The DDPS is RUAG’s largest customer.
The procurement contracts awarded by the DDPS for
defence products and services are subject to civil law.
The process of awarding such contracts is subject
to the Swiss Confederation’s provisions regarding public
procurement. These provisions apply to all suppliers
of goods and services, and are based on the principle
of free competition.
2.24 Derivative fi nancial and hedging instruments
Derivative fi nancial instruments are initially recognized
in the balance sheet at cost, and thereafter re-measured at
fair value. The way in which the gain or loss is measured
depends on whether the instrument is used for the
purpose of hedging a specifi c risk and the conditions for
hedge accounting are met. The objective of hedge
accounting is to ensure the change in value of the hedged
item and hedge instrument is included in the income
statement at the same time. To qualify for hedge
accounting, a hedge transaction must meet strict condi-
tions in terms of documentation, the probability of
occurrence, the effectiveness of the hedging instrument
and the accuracy of measurement.
When concluding a hedge transaction, the Group
documents the relationship between hedging instruments
and hedged items, as well as the purpose and strategy
of the hedge. The process also involves linking all
hedging derivatives with specifi c assets and liabilities,
or fi rm commitments and forecast transactions.
At inception as well as during the life of the hedge,
the Group documents the extent to which the derivatives
used for the hedge offset the change in fair value of
the hedged item. When a contract is concluded, a
derivative instrument qualifying for hedge accounting
is defi ned as:
a) a hedge on the change in the fair value
of a stated asset or a liability (fair value hedge),
or as
b) a hedge on cash fl ows from a forecast
transaction or fi rm commitment (cash fl ow hedge),
or as
c) a hedge on a net investment in a
foreign operation.
Changes in the fair value of hedging instru-
ments used to hedge the cash fl ows from a fore-
cast transaction or fi rm commitment and that
offer an effective hedge are recognized as cash fl ow
hedges.
Cash fl ow hedges are measured at fair value; the effec-
tive portion of the change in fair value of the cash
fl ow hedge is recognized under other reserves in other
comprehensive income, while the ineffective portion
is recognized in profi t or loss in the income statement
under other operating expenses. Upon occurrence
of the underlying transaction, the relevant hedging
instrument is reclassifi ed from equity to the income
statement.
The only current hedges of RUAG are for payment
fl ows from forecast transactions or fi rm commitments
(cash fl ow hedge).
2.25 Fair value measurement
The fair value of a fi nancial instrument is the price
at which a party would accept the rights and/or
obligations arising from the fi nancial instrument from
another party. The fair values of fi nancial instruments
are measured based on the following hierarchy:
a) Quoted prices (unadjusted) in
active markets for identical assets or liabilities
(Level 1).
b) Inputs other than quoted prices included
within Level 1 that are observable for the asset
or liability, either directly (i.e. as prices)
or indirectly (i.e. derived from prices)
(Level 2).
c) Inputs for assets or liabilities that are not based
on observable market data (unobservable inputs)
(Level 3).
The recognized fi nancial instruments are measured
on the following basis:
Financial assets Fair values are obtained from
stock market prices.
Financial liabilities The fair values of long-term fi nancial
liabilities are calculated as the present value of future
cash fl ows. The current market interest rates for bonds
with corresponding maturities are used for discounting
purposes. Due to their short terms, it is assumed that
the carrying amounts for current fi nancial liabilities corres-
pond closely to fair values.
Derivative Instruments The fair value of foreign
currency forward transactions is determined on the basis of
current benchmark prices at the end of the reporting
RUAG ANNUAL REPORT 2010 57
NOTES TO THE CONSOLIDATED FINANCIAL STATEMENTS
period, taking account of forward premiums and dis-
counts. Foreign currency options are valued using option
pricing models. Fair values of interest rate hedging
instruments are calculated on the basis of discounted,
expected future cash fl ows. In this case, the market
interest rates for the residual maturity of the fi nancial
instruments are used. Options are valued on the basis of
generally recognized option pricing models.
3 Risk management and assessment
The risk management system of RUAG differentiates
between strategic and operational risks and focuses
on relevant topics. Risks are identifi ed, assessed and moni-
tored in the individual business units at all levels of the
management structure. In order to minimize individual risks,
appropriate measures are defi ned and implemented.
The most signifi cant risks aggregated from the divisions are
monitored and controlled by the Executive Board.
Identifi ed risks are quantifi ed (in terms of probability of
occurrence and impact) and entered on a risk map. This risk
map is discussed periodically by the Board of Directors and
the Audit Committee. Ongoing risk monitoring, supervision
and control is the responsibility of Management.
3.1 Financial Risk Management
Financial risk management is a corporate function and is
carried out by the Group Treasury department in compliance
with the directives issued by the Board of Directors. Group
Treasury identifi es, evaluates and hedges fi nancial risks in
close cooperation with the operating units.
Market risk RUAG is exposed to market risks, notably
those associated with changes in exchange rates, interest
rates and fair values of investments in cash and cash
equivalents. The company monitors these risks continuously.
The Group employs a number of derivative fi nancial
instruments to manage the volatility associated with these
risks. The Group’s objective is to reduce where appropriate
fl uctuations in earnings and cash fl ows associated with
changes in interest rates, exchange rates and the value
of fi nancial assets and the exchange rate risks of certain
net investments in Group companies abroad.
In compliance with company policy, the company employs
derivative fi nancial instruments (e.g. foreign currency
forward transactions, interest rate swaps, etc.) to manage
risk. RUAG avoids any fi nancial transaction in which the risk
cannot be gauged at the time the transaction is concluded.
The Group does not sell any assets that it does not own
or does not know that it will own. RUAG sells only existing
assets and hedges only existing transactions and (in the
case of forward hedges) forecast transactions that can be
expected to materialize on the basis of past experience.
Currency risk The consolidated fi nancial statements are
presented in Swiss Francs (CHF). The company is mainly
subject to changes in the exchange rates of the USD, EUR and
SEK. In the case of transaction risk, it faces the risk of fl uctu-
ations in the value of foreign currencies between the date

RUAG ANNUAL REPORT 201058
PROFILE FOREWORD BUSINESS PERFORMANCE FINANCIAL STATEMENTS CORPORATE GOVERNANCE
of a contractual agreement and the actual date of pay-
ment. Accordingly, RUAG employs different contracts to
compensate for exchange rate-induced changes in asset
values, fi rm commitments and forecast transactions.
RUAG also employs forward transactions and currency
options to hedge certain cash fl ows anticipated in
foreign currency.
Net investments in foreign operations are long-term invest-
ments. Their fair value changes as exchange rates fl uctuate.
Over the very long term, however, differences in infl ation
rates should offset the exchange rate fl uctuations, with the
result that adjustments in the fair value of tangible
investments abroad should compensate for any exchange
rate-induced changes in value. For this reason, RUAG
hedges its investments in foreign Group companies only
in exceptional cases.
RUAG uses hedge accounting as defi ned in IAS 39.
Further information on the application of hedge accounting
is given in Note 2.24.
Commodity price risk In buying commodities (particu-
larly copper, zinc, lead, aluminium, steel, etc.) to be used as
raw materials in production, the company is sometimes
subject to a price risk. Commodity price changes can
affect the gross profi t margins of the operations concerned.
Therefore, RUAG uses commodity futures transactions
to manage the price fl uctuation risk of planned purchases.
Interest rate risk RUAG is exposed to interest rate risks
arising from the volatility of market interest rates. Demand
deposits and money-market investments are subject to
an interest rate risk that can impact on net profi t. Financial
liabilities largely comprise loans from fi nancial institutions
with variable interest rates. For the purpose of hedging
interest rate risk, RUAG concluded swaps corresponding to
the term of the fi nancial liabilities.
Credit risk Credit risks arise when customers are not in
a position to fulfi l their contractual commitments. To
manage this risk, RUAG periodically evaluates customers’
solvency. Sales from transactions with the DDPS amount
to 35% of total sales. No other customer accounts
for more than 10% of the combined sales of all operating
segments. Trade and other receivables from the DDPS
account for 34% (previous year: 15%) of total trade and
other receivables as per 31 December 2010. This is
the only concentrated credit risk that exceeds 5% of total
trade and other receivables. The nominal value of
receivables (less any valuation allowance) is assumed to
approximate their fair values.
Counterparty risk Counterparty risk comprises the risk
of default on derivative fi nancial instruments and
money market transactions and the credit risk on current
account balances and time deposits. RUAG reduces default
risk and credit risk by choosing as counterparties only
banks and fi nancial institutions that have a minimum credit
rating when the transaction is concluded. These risks
are strictly monitored to ensure that they remain within
the prescribed parameters. Group guidelines ensure that
the credit risk in respect of fi nancial institutions is
limited. RUAG does not expect any losses arising from
counterrparties’ non-fulfi lment of their contractual
obligations.
Liquidity risk Liquidity risk describes the risk that arises
if the company is not in a position to fulfi l its obligations
when due or at a reasonable price. The Group Treasury
is responsible for monitoring liquidity, fi nancing and
repayment. In addition, Management controls processes
and guidelines in this connection. To maintain fl exibility,
RUAG manages its liquidity risk on a consolidated basis,
drawing on social, tax and fi nancial considerations
and, if necessary, various funding sources. RUAG maintains
on principle a liquidity reserve that exceeds the daily
and monthly operating cash requirements. This includes
maintaining adequate reserves of cash and cash equi-
valents as well as the availability of adequate open lines
of credit. A rolling liquidity plan is drawn up on the basis
of expected cash fl ows and is regularly updated.
RUAG ANNUAL REPORT 2010 59
NOTES TO THE CONSOLIDATED FINANCIAL STATEMENTS
3.2 Capital risk management
In managing capital, RUAG’s aims are to ensure that
the company can continue its operating activities, that the
owner receives an adequate return and that the balance
sheet structure is optimized with regard to the cost
of capital. RUAG can achieve these objectives by adjusting
the dividends paid, by returning capital to the share-
holder, by issuing new shares or disposing of assets for
the purpose of repaying debt. RUAG monitors its capital
structure on the basis of net debt and equity, by measuring
the ratio of net debt to equity. Net debt is the sum of
cash and cash equivalents, current- and non-current fi nancial
assets minus current and non-current fi nancial liabilities and
other non-current liabilities.
Total capital is the sum of equity and net debt. RUAG has
set itself the long-term target of keeping net debt
below 40% of equity. At the end of 2010 the fi gure was
12.9% (previous year: 21.8%).
4 Critical accounting estimates and assumptions
Preparation of the consolidated fi nancial statements in
accordance with generally recognized accounting principles
requires the use of estimates and assumptions that infl uence
the stated amounts of assets and liabilities, income and
expenses and the associated disclosure of contingent assets
and liabilities at the end of the reporting period. At the
same time, the Group makes estimates and assumptions
relating to the future. Estimates made for accounting
purposes may by defi nition differ from actual results.
Estimates and assessments are continuously analysed and
are based partly on historical experience and partly
also on other factors including the occurrence of possible
future events. Key estimates and assumptions are made
in particular about the following items:
Property, plant and equipment, goodwill and
intangible assets Property, plant and equipment and
intangible assets are reviewed annually for signs of
impairment. If there are signs that these assets are over-
valued, an estimate is made of the future cash fl ows
expected to result from the utilization of these assets or
their possible disposal. Actual cash fl ows may differ from
the discounted future cash fl ows based on these estimates.
Factors such as changes in the planned use of property,
plant and equipment, site closures, technical obsolescence
or lower-than-forecast sales of products, the rights to
which have been recognized, may shorten the estimated
useful life or result in impairment.
The Group reviews the value of its recognized goodwill
annually. The recoverable amount of cash-generating units
is determined on the basis of value-in-use. At the same
time estimates are made of future cash fl ows and assump-
tions are made to determine the capitalization rate. The
main assumptions are described in Note 21, Intangible
assets. As at 31 December 2010, goodwill of CHF 78 million
was recognized. An impairment loss of CHF 6 million
was recognized in the year under review. For more infor-
mation, see Note 21, “Intangible assets” and Note 5,
“One-time charges”.
Inventories and work in progress
The current value of inventories and work in progress
is reassessed periodically. This involves classifying the indi-
vidual items in terms of inventory sales ratios and valuing
them accordingly.
Construction contracts Estimates with a signifi cant in-
fl uence are made in evaluating long-term construction
contracts by the percentage of completion method (POC).

RUAG ANNUAL REPORT 201060
PROFILE FOREWORD BUSINESS PERFORMANCE FINANCIAL STATEMENTS CORPORATE GOVERNANCE
Although the estimates, such as the stage of completion
and estimated cost to complete the projects, are made to
the best of Management’s knowledge about current
events and possible future measures, the actual results may
ultimately differ from these estimates. As at 31 Decem-
ber 2010, CHF 61 million was recognized for construction
contracts (see Note 18, “Percentage of completion”).
In addition, provisions totalling CHF 49 million were recog-
nized for anticipated losses on contracts.
Provisions As part of their ordinary business operations,
Group companies are exposed to various risks. These are
continuously assessed and provisions are set aside
accordingly in light of the available information on the
basis of the cash fl ow that can realistically be expected. For
example, provisions for warranties are determined on
the basis of empirical values and provisions for litigation
by means of a legal assessment.
Deferred tax assets The possible application of existing
and available loss carry-forwards is periodically assessed
and measured. The basis for measuring the tax loss carry-
forwards is realistic performance planning on the part
of the taxable entity. The assessment of future performance
is based on a wide range of assumptions and estimates.
If the actual values differ from the estimates, this can lead
to a change in the fair value assessment of deferred tax
assets. As at 31 December 2010, recognized deferred
tax assets from tax loss carryforwards totalled CHF 19 million
(previous year: CHF 15 million). For more information,
see Note 12, “Income tax expense”.
Employee benefi t obligations Various actuarial assump-
tions are made in calculating benefi t obligations and
the surplus or shortage of cover in accordance with IAS 19,
e.g. the discount rate, the annual expected wage increases
and pension adjustments, anticipated return on pension
assets, probability of withdrawal and expected mortality, etc.
The assumptions used in these statements are explained
in Note 38, “Employee benefi ts”.
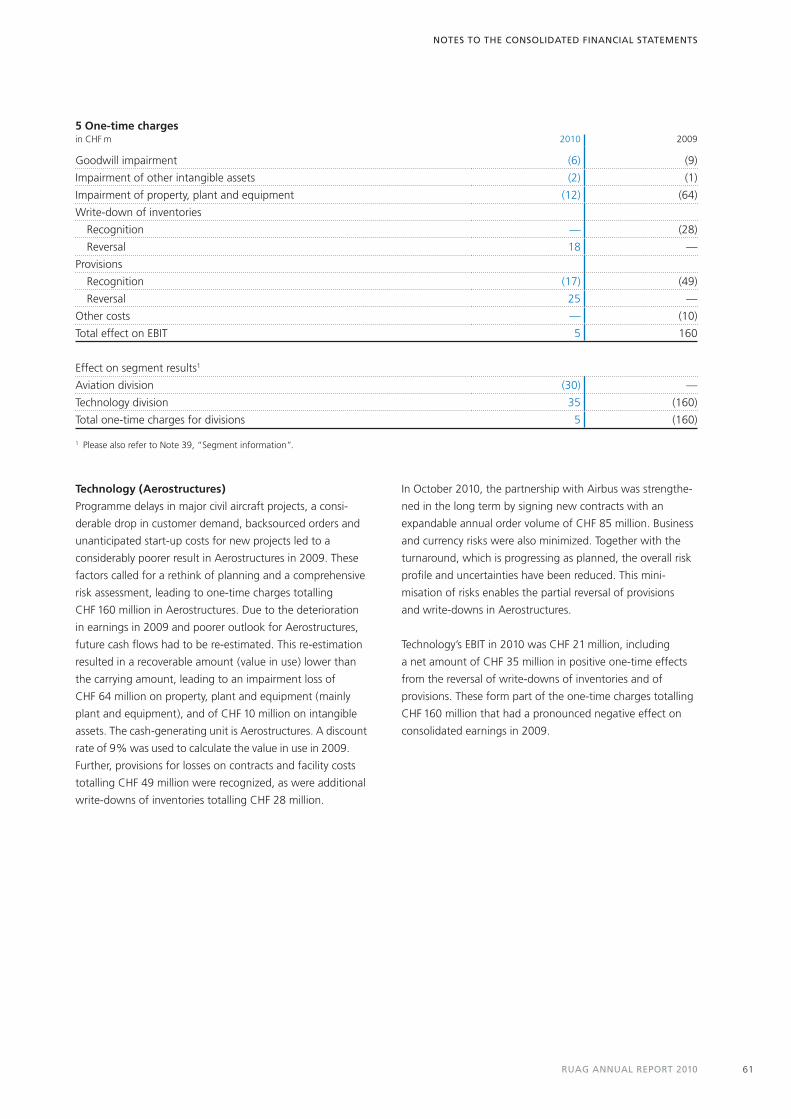
RUAG ANNUAL REPORT 2010 61
Technology (Aerostructures)
Programme delays in major civil aircraft projects, a consi-
derable drop in customer demand, backsourced orders and
unanticipated start-up costs for new projects led to a
considerably poorer result in Aerostructures in 2009. These
factors called for a rethink of planning and a comprehensive
risk assessment, leading to one-time charges totalling
CHF 160 million in Aerostructures. Due to the deterioration
in earnings in 2009 and poorer outlook for Aerostructures,
future cash fl ows had to be re-estimated. This re-estimation
resulted in a recoverable amount (value in use) lower than
the carrying amount, leading to an impairment loss of
CHF 64 million on property, plant and equipment (mainly
plant and equipment), and of CHF 10 million on intangible
assets. The cash-generating unit is Aerostructures. A discount
rate of 9% was used to calculate the value in use in 2009.
Further, provisions for losses on contracts and facility costs
totalling CHF 49 million were recognized, as were additional
write-downs of inventories totalling CHF 28 million.
In October 2010, the partnership with Airbus was strengthe-
ned in the long term by signing new contracts with an
expandable annual order volume of CHF 85 million. Business
and currency risks were also minimized. Together with the
turnaround, which is progressing as planned, the overall risk
profi le and uncertainties have been reduced. This mini-
misation of risks enables the partial reversal of provisions
and write-downs in Aerostructures.
Technology’s EBIT in 2010 was CHF 21 million, including
a net amount of CHF 35 million in positive one-time effects
from the reversal of write-downs of inventories and of
provisions. These form part of the one-time charges totalling
CHF 160 million that had a pronounced negative effect on
consolidated earnings in 2009.
NOTES TO THE CONSOLIDATED FINANCIAL STATEMENTS
5 One-time charges in CHF m 2010 2009
Goodwill impairment (6) (9)
Impairment of other intangible assets (2) (1)
Impairment of property, plant and equipment (12) (64)
Write-down of inventories
Recognition — (28)
Reversal 18 —
Provisions
Recognition (17) (49)
Reversal 25 —
Other costs — (10)
Total effect on EBIT 5 160
Effect on segment results1
Aviation division (30) —
Technology division 35 (160)
Total one-time charges for divisions 5 (160)
1 Please also refer to Note 39, “Segment information”.

RUAG ANNUAL REPORT 201062
PROFILE FOREWORD BUSINESS PERFORMANCE FINANCIAL STATEMENTS CORPORATE GOVERNANCE
Aviation
The division looks back on a challenging year. While
the military aviation business in Switzerland remained stable
and international growth was strong, the effects of defence
budget cuts in Germany were palpable. The resulting
decline in Bell UH-1D maintenance work already began to
impact on the site’s order volume. Aviation reported
EBIT of CHF −11 million, including one-time charges of
CHF 30 million in the form of impairment losses and restruc-
turing provisions, since capacity adjustments in Ober-
pfaffenhofen due to defence budget cuts and delayed sales
successes of the Do 228NG take place in 2011.
Due to the poorer outlook in Germany, future cash fl ows
had to be re-estimated. This re-estimation resulted in a
recoverable amount (value in use) lower than the carrying
amount, leading to an impairment loss of CHF 12 million on
property, plant and equipment and of CHF 8 million on
intangible assets and goodwill. A discount rate of 8% was
used to calculate the value in use in 2010.
6 Acquisitions, disposals and mergers
Acquisitions On 1 July 2009, RUAG took over the
Space business unit of OC Oerlikon by acquiring 100% of
Oerlikon Space AG. The purchase signifi cantly strengthens
RUAG’s position in the European and US aerospace
industry. With headquarters in Zurich, Oerlikon Space is
one of the most important manufacturers of payload
fairings using composite materials technology. The company
is also among the European suppliers of satellite structures
as well as mechanical and electro-optical subsystems
for space.
Following the completion of the acquisition, Oerlikon Space
was renamed RUAG Space Ltd. The cash purchase price
was CHF 133 million. In the fi rst year, the companies acqui-
red generated revenue of CHF 89 million.
On 1 January 2009, RUAG acquired 100% of MFS 2000.
The purchase of the Hungarian company bolsters
RUAG’s international position in the small-calibre ammu-
nition business.
In 2009, RUAG acquired an additional 26% shareholding
in GEKE Schutztechnik GmbH, with headquarters in
Lichtenau, Germany. The company has been fully consoli-
dated since the acquisition of the majority shareholding.
The previous 25% interest in GEKE Schutztechnik GmbH
had been stated as an equity investment as of the
purchase date in 2008. GEKE develops innovative solu-
tions in the protection and ammunition areas.
The Environment business unit acquired an additional
24% of SwissRepair AG, which is based in Dietikon,
in 2009. SwissRepair AG has been fully consolidated since
the acquisition of the majority shareholding. The previous
28% interest in SwissRepair AG had been stated as
an equity investment as of the purchase date in 2008.
The Environment business unit operates plants that
recycle retail, commercial, trade and household electrical
and electronic waste and offers successful integral
disposal strategies for companies.
Mergers Effective 1 January 2010, RUAG Space Ltd
was merged with RUAG Switzerland Ltd and the merged
company continued as RUAG Switzerland Ltd.
In 2009, RUAG Aerospace Ltd was merged with
RUAG Components Ltd to form RUAG Switzerland Ltd.
Sintro Electronics AG was also merged with
RUAG Electronics Ltd.
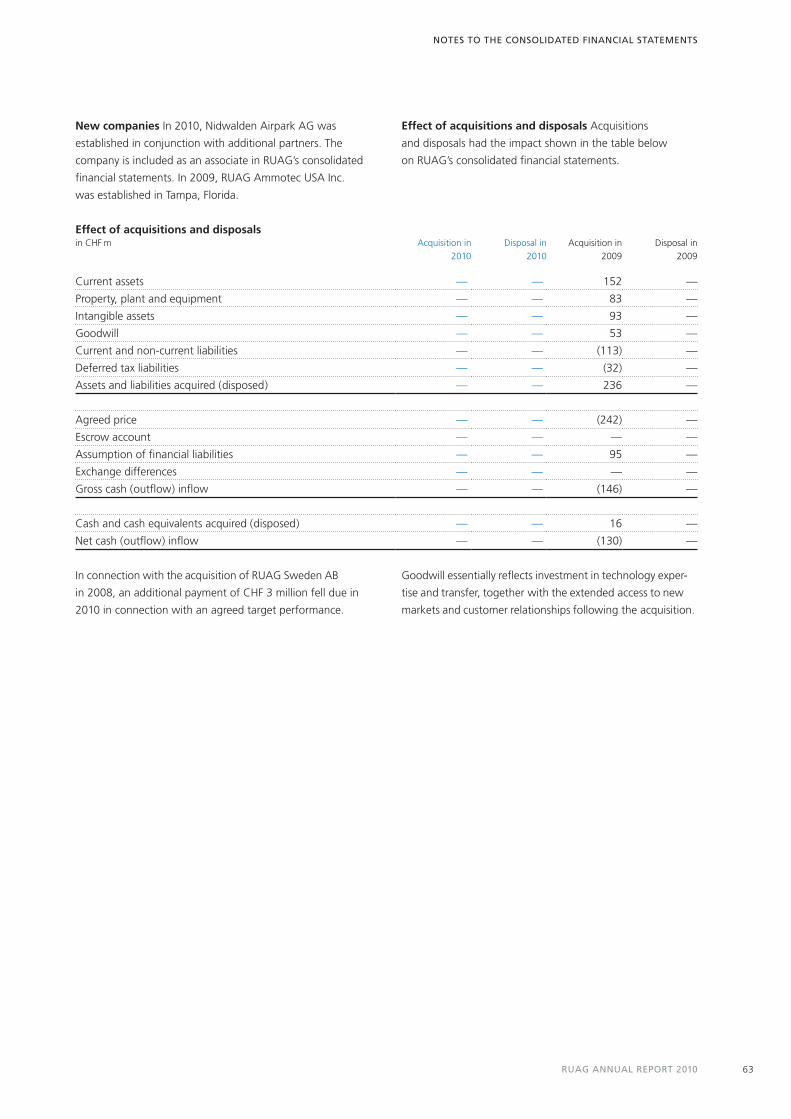
RUAG ANNUAL REPORT 2010 63
Effect of acquisitions and disposals in CHF m Acquisition in
2010Disposal in
2010Acquisition in
2009Disposal in
2009
Current assets — — 152 —
Property, plant and equipment — — 83 —
Intangible assets — — 93 —
Goodwill — — 53 —
Current and non-current liabilities — — (113) —
Deferred tax liabilities — — (32) —
Assets and liabilities acquired (disposed) — — 236 —
Agreed price — — (242) —
Escrow account — — — —
Assumption of fi nancial liabilities — — 95 —
Exchange differences — — — —
Gross cash (outfl ow) infl ow — — (146) —
Cash and cash equivalents acquired (disposed) — — 16 —
Net cash (outfl ow) infl ow — — (130) —
In connection with the acquisition of RUAG Sweden AB
in 2008, an additional payment of CHF 3 million fell due in
2010 in connection with an agreed target performance.
Goodwill essentially refl ects investment in technology exper-
tise and transfer, together with the extended access to new
markets and customer relationships following the acquisition.
NOTES TO THE CONSOLIDATED FINANCIAL STATEMENTS
New companies In 2010, Nidwalden Airpark AG was
established in conjunction with additional partners. The
company is included as an associate in RUAG’s consolidated
fi nancial statements. In 2009, RUAG Ammotec USA Inc.
was established in Tampa, Florida.
Effect of acquisitions and disposals Acquisitions
and disposals had the impact shown in the table below
on RUAG’s consolidated fi nancial statements.
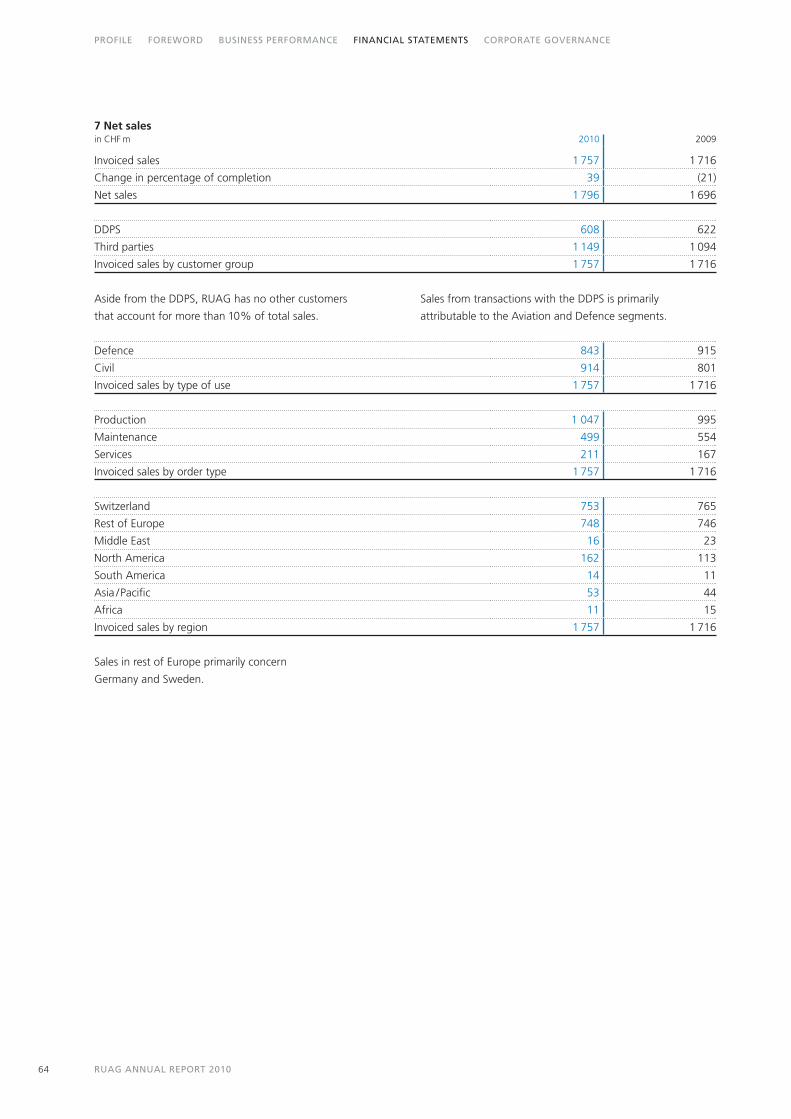
RUAG ANNUAL REPORT 201064
PROFILE FOREWORD BUSINESS PERFORMANCE FINANCIAL STATEMENTS CORPORATE GOVERNANCE
Defence 843 915
Civil 914 801
Invoiced sales by type of use 1 757 1 716
Production 1 047 995
Maintenance 499 554
Services 211 167
Invoiced sales by order type 1 757 1 716
Switzerland 753 765
Rest of Europe 748 746
Middle East 16 23
North America 162 113
South America 14 11
Asia /Pacifi c 53 44
Africa 11 15
Invoiced sales by region 1 757 1 716
Aside from the DDPS, RUAG has no other customers
that account for more than 10% of total sales.
Sales from transactions with the DDPS is primarily
attributable to the Aviation and Defence segments.
Sales in rest of Europe primarily concern
Germany and Sweden.
7 Net salesin CHF m 2010 2009
Invoiced sales 1 757 1 716
Change in percentage of completion 39 (21)
Net sales 1 796 1 696
DDPS 608 622
Third parties 1 149 1 094
Invoiced sales by customer group 1 757 1 716

RUAG ANNUAL REPORT 2010 65
NOTES TO THE CONSOLIDATED FINANCIAL STATEMENTS
8 Staff costsin CHF m 2010 2009
Salaries and wages (630) (589)
Employee benefi t contributions (39) (39)
Other social security expenses (90) (89)
Contract personnel (48) (33)
Other staff costs (13) (27)
Total (820) (776)
9 Other operating expensesin CHF m 2010 2009
Premises costs (27) (33)
Maintenance and repairs of property, plant and equipment (56) (55)
Cost of energy and waste disposal (13) (15)
Insurance and duties (8) (8)
Administration and IT costs (51) (48)
Advertising costs (19) (17)
Miscellaneous other operating expenses / income 1 (83)
Total (174) (258)
Miscellaneous other operating expenses include in
particular expenses for operational security and
surveillance, tax on capital and the recognition and
reversal of provisions.
10 Research and development expensesin CHF m 2010 2009
Total (190) (149)
Research and development expenses include all own
work and work carried out by third parties or services
required from third parties that was recognized as
an expense during the year under review. The increase in
2010 is primarily attributable to the acquisition of the Space
business operations of OC Oerlikon as per 1 July 2009.
11 Finance incomein CHF m 2010 2009
Interest income 1 1
Realized exchange gains — —
Realized securities gains — —
Total fi nance income 1 1
Finance costs
Interest expense (10) (5)
Realized exchange losses (5) —
Realized securities losses 0 0
Impairment of fi nancial assets — —
Total fi nance costs (15) (5)
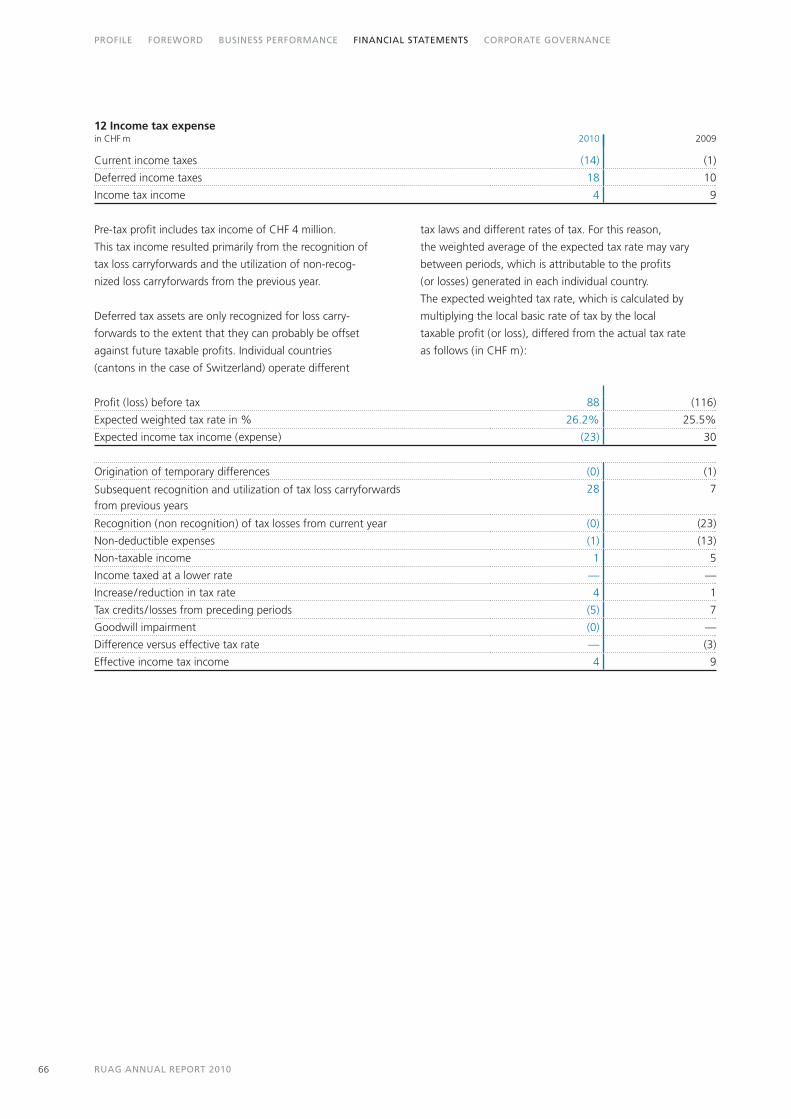
RUAG ANNUAL REPORT 201066
PROFILE FOREWORD BUSINESS PERFORMANCE FINANCIAL STATEMENTS CORPORATE GOVERNANCE
Profi t (loss) before tax 88 (116)
Expected weighted tax rate in % 26.2% 25.5%
Expected income tax income (expense) (23) 30
Origination of temporary differences (0) (1)
Subsequent recognition and utilization of tax loss carryforwards
from previous years
28 7
Recognition (non recognition) of tax losses from current year (0) (23)
Non-deductible expenses (1) (13)
Non-taxable income 1 5
Income taxed at a lower rate — —
Increase/reduction in tax rate 4 1
Tax credits / losses from preceding periods (5) 7
Goodwill impairment (0) —
Difference versus effective tax rate — (3)
Effective income tax income 4 9
12 Income tax expensein CHF m 2010 2009
Current income taxes (14) (1)
Deferred income taxes 18 10
Income tax income 4 9
Pre-tax profi t includes tax income of CHF 4 million.
This tax income resulted primarily from the recognition of
tax loss carryforwards and the utilization of non-recog-
nized loss carryforwards from the previous year.
Deferred tax assets are only recognized for loss carry-
forwards to the extent that they can probably be offset
against future taxable profi ts. Individual countries
(cantons in the case of Switzerland) operate different
tax laws and different rates of tax. For this reason,
the weighted average of the expected tax rate may vary
between periods, which is attributable to the profi ts
(or losses) generated in each individual country.
The expected weighted tax rate, which is calculated by
multiplying the local basic rate of tax by the local
taxable profi t (or loss), differed from the actual tax rate
as follows (in CHF m):
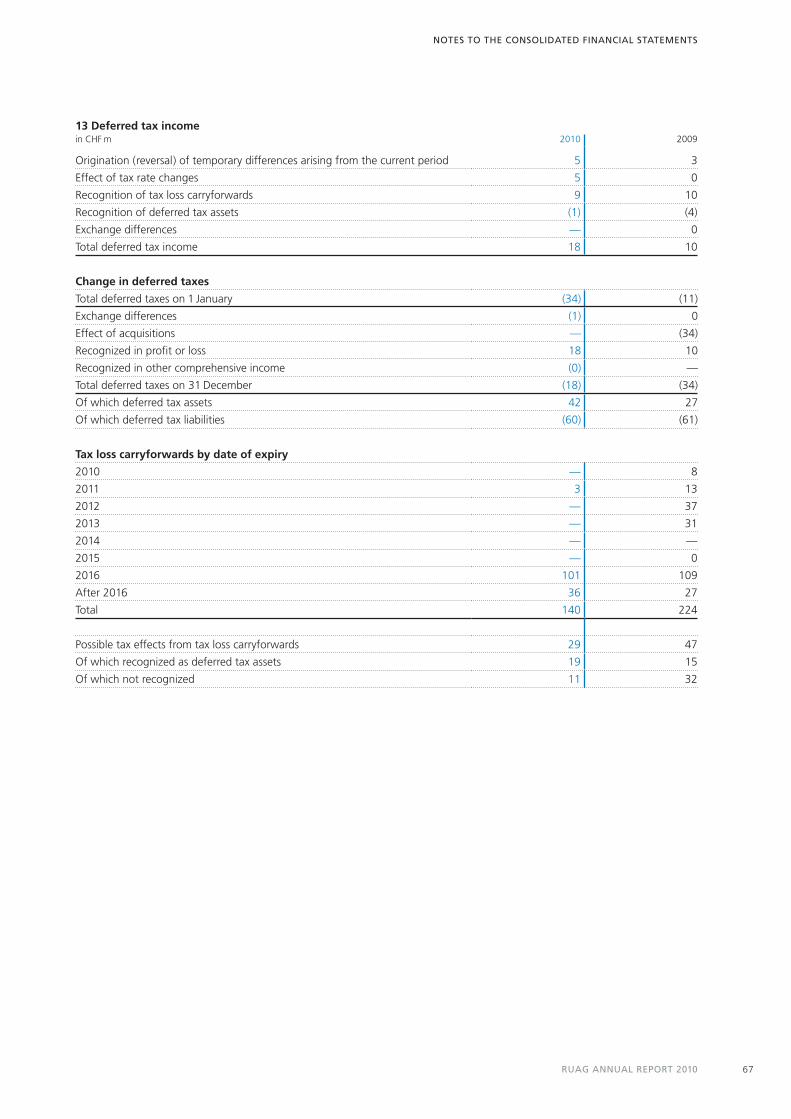
RUAG ANNUAL REPORT 2010 67
13 Deferred tax incomein CHF m 2010 2009
Origination (reversal) of temporary differences arising from the current period 5 3
Effect of tax rate changes 5 0
Recognition of tax loss carryforwards 9 10
Recognition of deferred tax assets (1) (4)
Exchange differences — 0
Total deferred tax income 18 10
Change in deferred taxes
Total deferred taxes on 1 January (34) (11)
Exchange differences (1) 0
Effect of acquisitions — (34)
Recognized in profi t or loss 18 10
Recognized in other comprehensive income (0) —
Total deferred taxes on 31 December (18) (34)
Of which deferred tax assets 42 27
Of which deferred tax liabilities (60) (61)
Tax loss carryforwards by date of expiry
2010 — 8
2011 3 13
2012 — 37
2013 — 31
2014 — —
2015 — 0
2016 101 109
After 2016 36 27
Total 140 224
Possible tax effects from tax loss carryforwards 29 47
Of which recognized as deferred tax assets 19 15
Of which not recognized 11 32
NOTES TO THE CONSOLIDATED FINANCIAL STATEMENTS
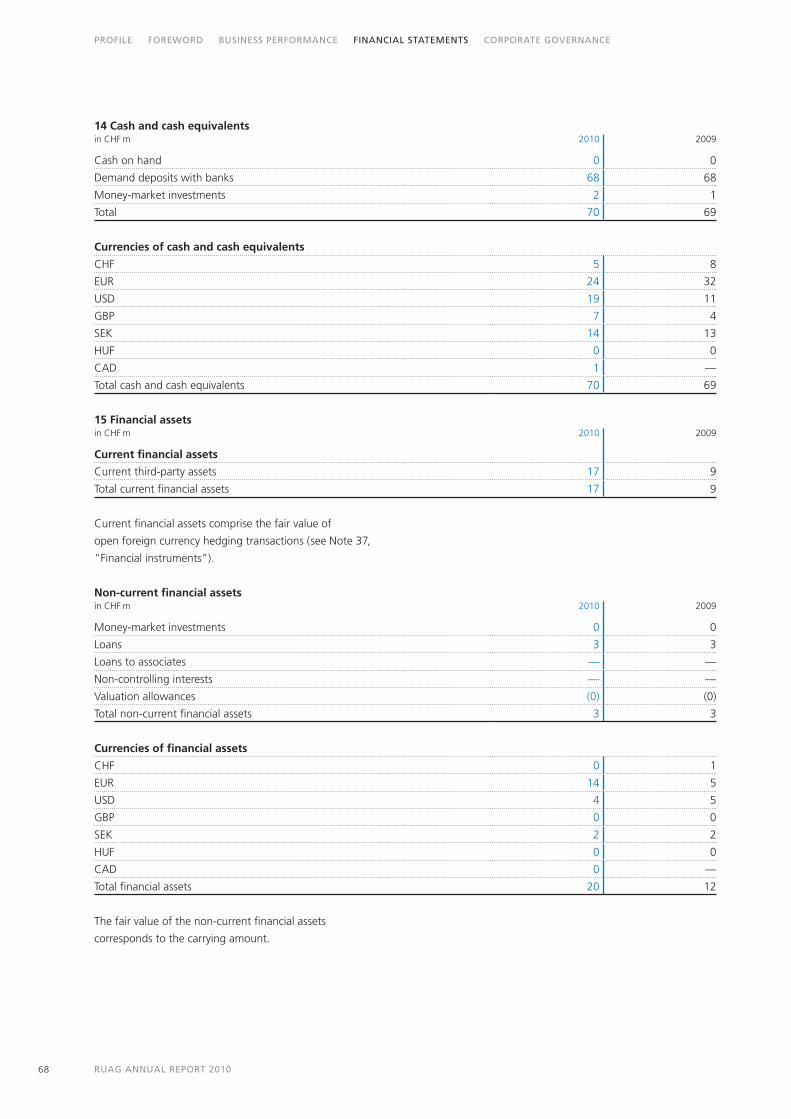
RUAG ANNUAL REPORT 201068
PROFILE FOREWORD BUSINESS PERFORMANCE FINANCIAL STATEMENTS CORPORATE GOVERNANCE
Non-current fi nancial assetsin CHF m 2010 2009
Money-market investments 0 0
Loans 3 3
Loans to associates — —
Non-controlling interests — —
Valuation allowances (0) (0)
Total non-current fi nancial assets 3 3
Currencies of fi nancial assets
CHF 0 1
EUR 14 5
USD 4 5
GBP 0 0
SEK 2 2
HUF 0 0
CAD 0 —
Total fi nancial assets 20 12
The fair value of the non-current fi nancial assets
corresponds to the carrying amount.
15 Financial assets in CHF m 2010 2009
Current fi nancial assets
Current third-party assets 17 9
Total current fi nancial assets 17 9
Current fi nancial assets comprise the fair value of
open foreign currency hedging transactions (see Note 37,
“Financial instruments”).
14 Cash and cash equivalentsin CHF m 2010 2009
Cash on hand 0 0
Demand deposits with banks 68 68
Money-market investments 2 1
Total 70 69
Currencies of cash and cash equivalents
CHF 5 8
EUR 24 32
USD 19 11
GBP 7 4
SEK 14 13
HUF 0 0
CAD 1 —
Total cash and cash equivalents 70 69

RUAG ANNUAL REPORT 2010 69
NOTES TO THE CONSOLIDATED FINANCIAL STATEMENTS
16 Receivables and prepaymentsin CHF m 2010 2009
Trade and other receivables 305 318
Receivables from associates 0 0
Prepayments to suppliers 29 54
Prepayments to associates — —
Valuation allowances (9) (9)
Total trade and other receivables and prepayments 325 363
Current receivables from shareholders — —
Current receivables from government bodies 5 12
Other current receivables 8 8
Total receivables and prepayments 338 383
Currencies of receivables and prepayments
CHF 154 179
EUR 133 156
USD 45 44
GBP 2 3
SEK 3 1
HUF 0 0
CAD 0 —
Total 338 383
Maturity structure of receivables
Not past-due 248 283
Past due 1–30 days 49 64
Past due 31–60 days 13 14
Past due 61–90 days 7 5
Past due 91–180 days 10 5
Past due over 180 days 11 11
Total 338 383
The allowance for doubtful receivables contains
individual valuation allowances totalling CHF 9 million
(previous year: CHF 9 million).
Effective losses on receivables in each of the past
two years were less than 0.2% of net sales.

RUAG ANNUAL REPORT 201070
PROFILE FOREWORD BUSINESS PERFORMANCE FINANCIAL STATEMENTS CORPORATE GOVERNANCE
The carrying amount of inventories at fair value
less costs to sell is CHF 254 million (previous year:
CHF 184 million). In the year under review, a total of
CHF 460 million was recognized as cost of material
(CHF 420 million). The write-down of inventories
recognized as an expense totalled CHF 42 million
(CHF 59 million).
Reversals of write-downs of inventories recognized
in a prior period, arising from an increase in net realizable
value, totalled CHF 26 million in the year under review
(CHF 8 million).
Changes in write-downs of inventories from Aerostructures
are detailed in Note 5, “One-time charges”.
18 Percentage of Completion (POC)in CHF m 2010 2009
Contract sales and costs of ongoing projects at the end of the reporting period
Aggregate contract sales 1 465 866
Aggregate contract costs (1 254) (705)
Realized margin of ongoing projects at the end of the reporting period 211 161
Cumulative balance at the end of the reporting period
Gross amount due from customers for contract work 125 84
Gross amount due to customers for contract work (65) (51)
Net position at the end of the reporting period 61 33
Advances received from customers 139 121
17 Inventories and work in progressin CHF m 2010 2009
Materials and supplies 246 245
Work in progress at cost of conversion 99 81
Work in progress (percentage of completion)1 125 84
Semi-fi nished goods 118 106
Finished goods 64 62
Valuation allowances (117) (135)
Total 535 443
1 The key fi gures for work in progress, which is measured using the percentage of completion method, are detailed below.
Allowance for doubtful receivables in CHF m 2010 2009
Balance at 1 January (9) (10)
Initial consolidation — —
Increase in allowance (2) (7)
Utilization of allowance 0 3
Reversal of allowance 2 5
Disposals — —
Currency differences (0) 0
Balance at 31 December (9) (9)
Allowance for doubtful receivables (9) (9)
Interest on doubtful receivables — —
Allowances for doubtful receivables are held in an allowance
account. Charges are recognized in other operating expenses.
No value allowances are required for fi nancial instruments
in categories other than loans or receivables. Receivables
judged as non-recoverable are written off as losses.

RUAG ANNUAL REPORT 2010 71
19 Property, plant and equipmentin CHF m Plant and
equipment Other1 Land Buildings
Assets under construction
Property, plant and
equipment
At cost
As at 1 January 2009 490 170 50 545 12 1 266
Initial consolidation 15 22 33 121 2 192
Eliminations from the consolidated Group — (1) (0) 1 0 (0)
Additions 30 16 0 12 23 82
Disposals (8) (2) (0) (4) — (14)
Upward revaluation — — — — — —
Reclassifi cations 9 2 (7) (43) (6) (44)
Exchange differences 1 0 0 0 (0) 1
As at 31 December 2009 538 207 76 631 31 1 483
Accumulated depreciation and impairment
As at 1 January 2009 331 132 0 370 — 833
Initial consolidation 13 18 — 78 — 109
Eliminations from the consolidated Group — (0) — 0 — (0)
Depreciation 29 14 0 17 — 60
Impairment 61 2 — 0 — 64
Disposals (7) (2) — (4) — (13)
Depreciation of net carrying amount — — — — — —
Reclassifi cations (0) 0 — (45) — (45)
Exchange differences 1 0 0 0 — 1
As at 31 December 2009 427 164 0 418 — 1 009
At cost
As at 1 January 2010 538 207 76 631 31 1 483
Initial consolidation — — — — — —
Eliminations from the consolidated Group 0 (0) — — — 0
Additions 32 29 (0) 2 7 70
Disposals (20) (11) (0) (7) — (38)
Upward revaluation — — — — — —
Reclassifi cations 12 2 1 (5) (21) (10)
Exchange differences (14) (9) (0) (3) (2) (28)
As at 31 December 2010 548 219 77 618 16 1 478
Accumulated depreciation and impairment
As at 1 January 2010 427 164 0 418 — 1 009
Initial consolidation — — — — — —
Eliminations from the consolidated Group 0 (0) — — — 0
Depreciation 20 15 0 18 0 53
Impairment 2 9 — 1 — 12
Disposals (19) (9) — (7) — (35)
Depreciation of net carrying amount — — — — — —
Reclassifi cations 5 0 — (10) (0) (5)
Exchange differences (9) (7) (0) (1) (0) (17)
As at 31 December 2010 427 172 0 419 0 1 017
Net carrying amount
As at 1 January 2010 111 43 76 213 31 474
As at 31 December 2010 121 47 77 200 16 461
NOTES TO THE CONSOLIDATED FINANCIAL STATEMENTS
1 Fixtures and fi ttings, computer hardware and software, motor vehicles.
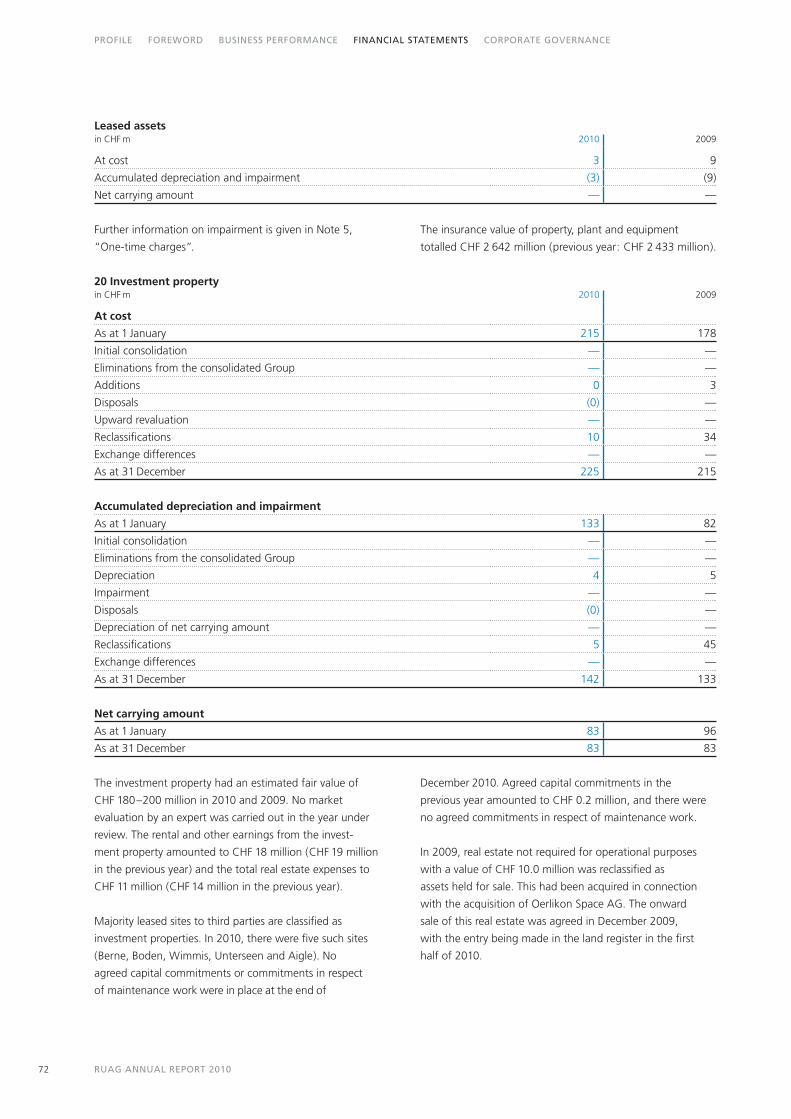
RUAG ANNUAL REPORT 201072
PROFILE FOREWORD BUSINESS PERFORMANCE FINANCIAL STATEMENTS CORPORATE GOVERNANCE
20 Investment property in CHF m 2010 2009
At cost
As at 1 January 215 178
Initial consolidation — —
Eliminations from the consolidated Group — —
Additions 0 3
Disposals (0) —
Upward revaluation — —
Reclassifi cations 10 34
Exchange differences — —
As at 31 December 225 215
Accumulated depreciation and impairment
As at 1 January 133 82
Initial consolidation — —
Eliminations from the consolidated Group — —
Depreciation 4 5
Impairment — —
Disposals (0) —
Depreciation of net carrying amount — —
Reclassifi cations 5 45
Exchange differences — —
As at 31 December 142 133
Net carrying amount
As at 1 January 83 96
As at 31 December 83 83
The investment property had an estimated fair value of
CHF 180–200 million in 2010 and 2009. No market
evaluation by an expert was carried out in the year under
review. The rental and other earnings from the invest-
ment property amounted to CHF 18 million (CHF 19 million
in the previous year) and the total real estate expenses to
CHF 11 million (CHF 14 million in the previous year).
Majority leased sites to third parties are classifi ed as
investment properties. In 2010, there were fi ve such sites
(Berne, Boden, Wimmis, Unterseen and Aigle). No
agreed capital commitments or commitments in respect
of maintenance work were in place at the end of
December 2010. Agreed capital commitments in the
previous year amounted to CHF 0.2 million, and there were
no agreed commitments in respect of maintenance work.
In 2009, real estate not required for operational purposes
with a value of CHF 10.0 million was reclassifi ed as
assets held for sale. This had been acquired in connection
with the acquisition of Oerlikon Space AG. The onward
sale of this real estate was agreed in December 2009,
with the entry being made in the land register in the fi rst
half of 2010.
Leased assets in CHF m 2010 2009
At cost 3 9
Accumulated depreciation and impairment (3) (9)
Net carrying amount — —
Further information on impairment is given in Note 5,
“One-time charges”.
The insurance value of property, plant and equipment
totalled CHF 2 642 million (previous year: CHF 2 433 million).

RUAG ANNUAL REPORT 2010 73
NOTES TO THE CONSOLIDATED FINANCIAL STATEMENTS
21 Intangible assets / goodwill in CHF m
PatentsBrands
and modelsLicences
and rights
Order backlog and
customer listsIntangible
assets Goodwill
At cost
As at 1 January 2009 8 11 12 26 57 44
Initial consolidation — 2 2 88 93 52
Eliminations from the consolidated Group — — (0) — (0) —
Additions 0 — 3 — 3 1
Disposals — — (1) — (1) —
Upward revaluation — — — — — —
Reclassifi cations — — — — — —
Exchange differences (0) 1 (0) (0) 1 0
As at 31 December 2009 8 14 16 115 153 97
Accumulated amortization and impairment
As at 1 January 2009 4 5 8 2 20 —
Initial consolidation — — 0 — 0 —
Eliminations from the consolidated Group — — 0 — 0 —
Depreciation 1 2 2 9 13 —
Impairment — — 1 — 1 9
Disposals — — (1) — (1) —
Reclassifi cations — — — — — —
Exchange differences (0) 0 (0) (0) 0 —
As at 31 December 2009 5 7 10 11 33 9
At cost
As at 1 January 2010 8 14 16 115 153 97
Initial consolidation — — — — — —
Eliminations from the consolidated Group — — — — — —
Additions — — 1 — 1 —
Disposals (0) — (0) — (0) (0)
Upward revaluation — — — — — —
Reclassifi cations 0 (1) 0 1 0 —
Exchange differences (0) (2) (2) (2) (6) (4)
As at 31 December 2010 7 11 15 114 147 94
Accumulated amortization and impairment
As at 1 January 2010 5 7 10 11 33 9
Initial consolidation — — — — — —
Eliminations from the consolidated Group — — — — — —
Depreciation 1 2 1 15 18 —
Impairment — — 2 — 2 6
Disposals — — (0) — (0) —
Reclassifi cations 0 (0) 0 (0) 0 —
Exchange differences (0) (1) (1) (1) (3) —
As at 31 December 2010 5 7 12 25 50 15
Net carrying amount
As at 1 January 2010 3 7 6 104 120 88
As at 31 December 2010 2 4 2 88 97 78
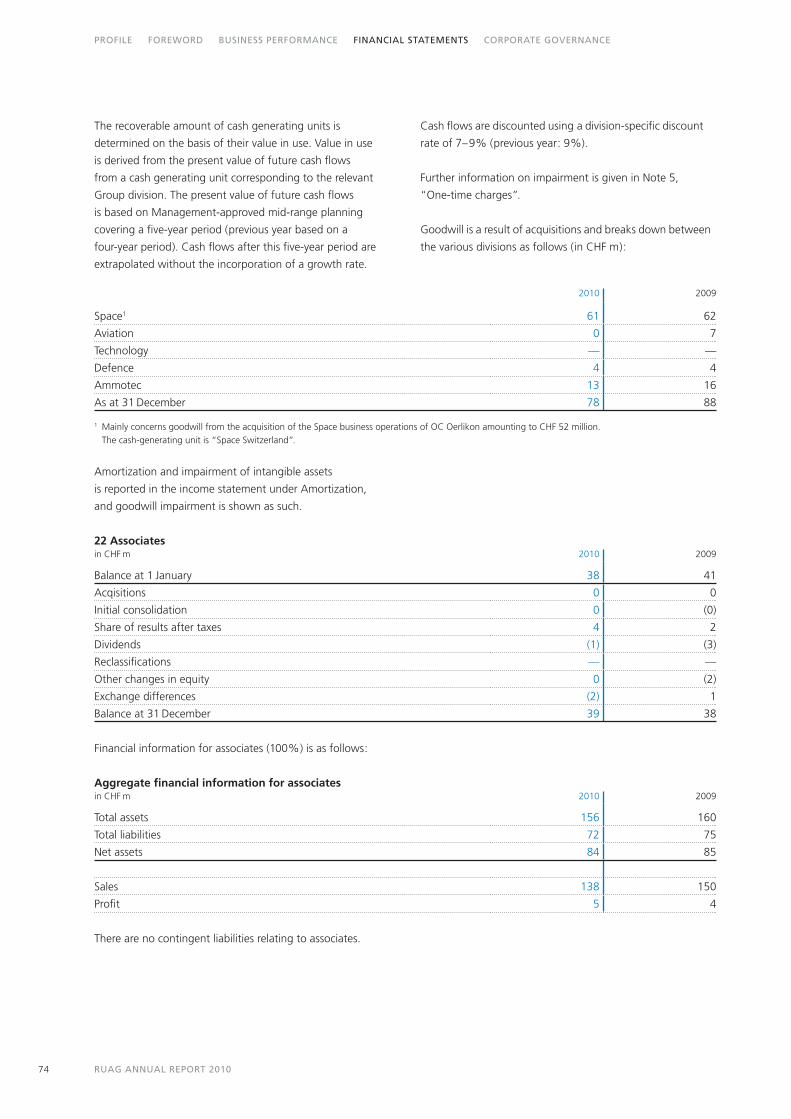
RUAG ANNUAL REPORT 201074
PROFILE FOREWORD BUSINESS PERFORMANCE FINANCIAL STATEMENTS CORPORATE GOVERNANCE
The recoverable amount of cash generating units is
determined on the basis of their value in use. Value in use
is derived from the present value of future cash fl ows
from a cash generating unit corresponding to the relevant
Group division. The present value of future cash fl ows
is based on Management-approved mid-range planning
covering a fi ve-year period (previous year based on a
four-year period). Cash fl ows after this fi ve-year period are
extrapolated without the incorporation of a growth rate.
Cash fl ows are discounted using a division-specifi c discount
rate of 7–9% (previous year: 9%).
Further information on impairment is given in Note 5,
“One-time charges”.
Goodwill is a result of acquisitions and breaks down between
the various divisions as follows (in CHF m):
Amortization and impairment of intangible assets
is reported in the income statement under Amortization,
and goodwill impairment is shown as such.
2010 2009
Space1 61 62
Aviation 0 7
Technology — —
Defence 4 4
Ammotec 13 16
As at 31 December 78 88
22 Associates in CHF m 2010 2009
Balance at 1 January 38 41
Acqisitions 0 0
Initial consolidation 0 (0)
Share of results after taxes 4 2
Dividends (1) (3)
Reclassifi cations — —
Other changes in equity 0 (2)
Exchange differences (2) 1
Balance at 31 December 39 38
Aggregate fi nancial information for associates in CHF m 2010 2009
Total assets 156 160
Total liabilities 72 75
Net assets 84 85
Sales 138 150
Profi t 5 4
Financial information for associates (100%) is as follows:
There are no contingent liabilities relating to associates.
1 Mainly concerns goodwill from the acquisition of the Space business operations of OC Oerlikon amounting to CHF 52 million. The cash-generating unit is “Space Switzerland”.
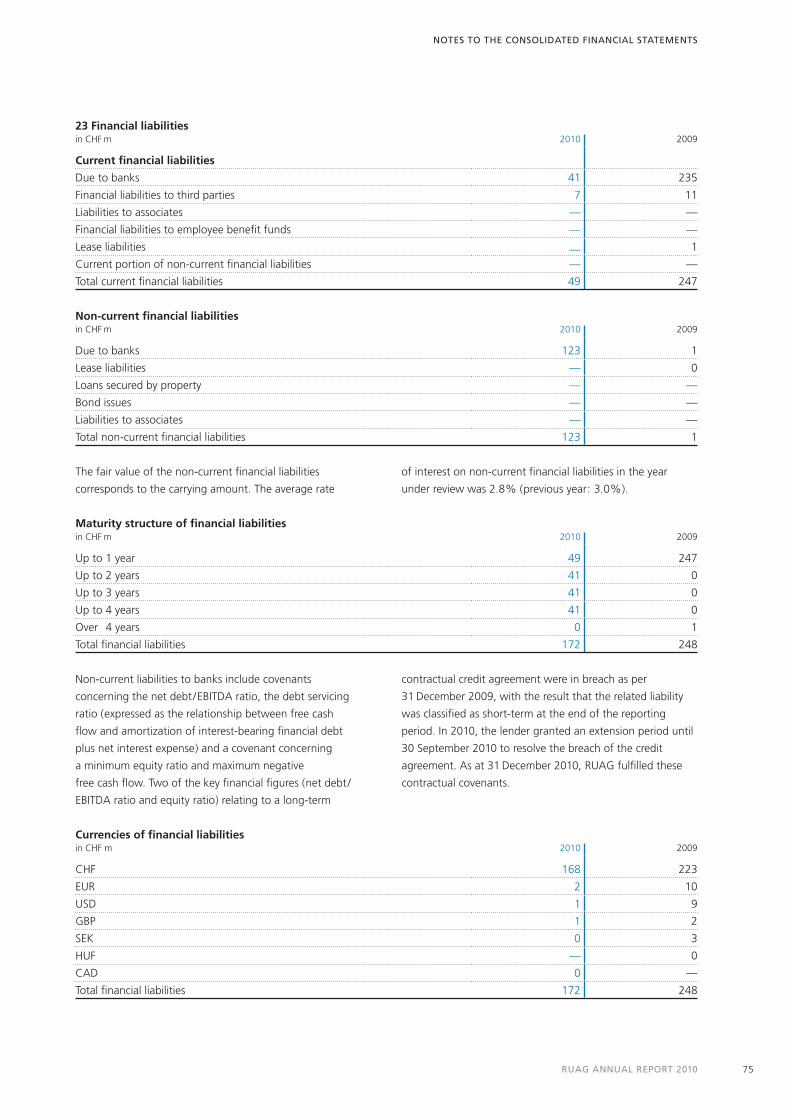
RUAG ANNUAL REPORT 2010 75
NOTES TO THE CONSOLIDATED FINANCIAL STATEMENTS
23 Financial liabilities in CHF m 2010 2009
Current fi nancial liabilities
Due to banks 41 235
Financial liabilities to third parties 7 11
Liabilities to associates — —
Financial liabilities to employee benefi t funds — —
Lease liabilities — 1
Current portion of non-current fi nancial liabilities — —
Total current fi nancial liabilities 49 247
Non-current fi nancial liabilities in CHF m 2010 2009
Due to banks 123 1
Lease liabilities — 0
Loans secured by property — —
Bond issues — —
Liabilities to associates — —
Total non-current fi nancial liabilities 123 1
The fair value of the non-current fi nancial liabilities
corresponds to the carrying amount. The average rate
of interest on non-current fi nancial liabilities in the year
under review was 2.8% (previous year: 3.0%).
Currencies of fi nancial liabilities in CHF m 2010 2009
CHF 168 223
EUR 2 10
USD 1 9
GBP 1 2
SEK 0 3
HUF — 0
CAD 0 —
Total fi nancial liabilities 172 248
Non-current liabilities to banks include covenants
concerning the net debt/EBITDA ratio, the debt servicing
ratio (expressed as the relationship between free cash
fl ow and amortization of interest-bearing fi nancial debt
plus net interest expense) and a covenant concerning
a minimum equity ratio and maximum negative
free cash fl ow. Two of the key fi nancial fi gures (net debt/
EBITDA ratio and equity ratio) relating to a long-term
contractual credit agreement were in breach as per
31 December 2009, with the result that the related liability
was classifi ed as short-term at the end of the reporting
period. In 2010, the lender granted an extension period until
30 September 2010 to resolve the breach of the credit
agreement. As at 31 December 2010, RUAG fulfi lled these
contractual covenants.
Maturity structure of fi nancial liabilities in CHF m 2010 2009
Up to 1 year 49 247
Up to 2 years 41 0
Up to 3 years 41 0
Up to 4 years 41 0
Over 4 years 0 1
Total fi nancial liabilities 172 248
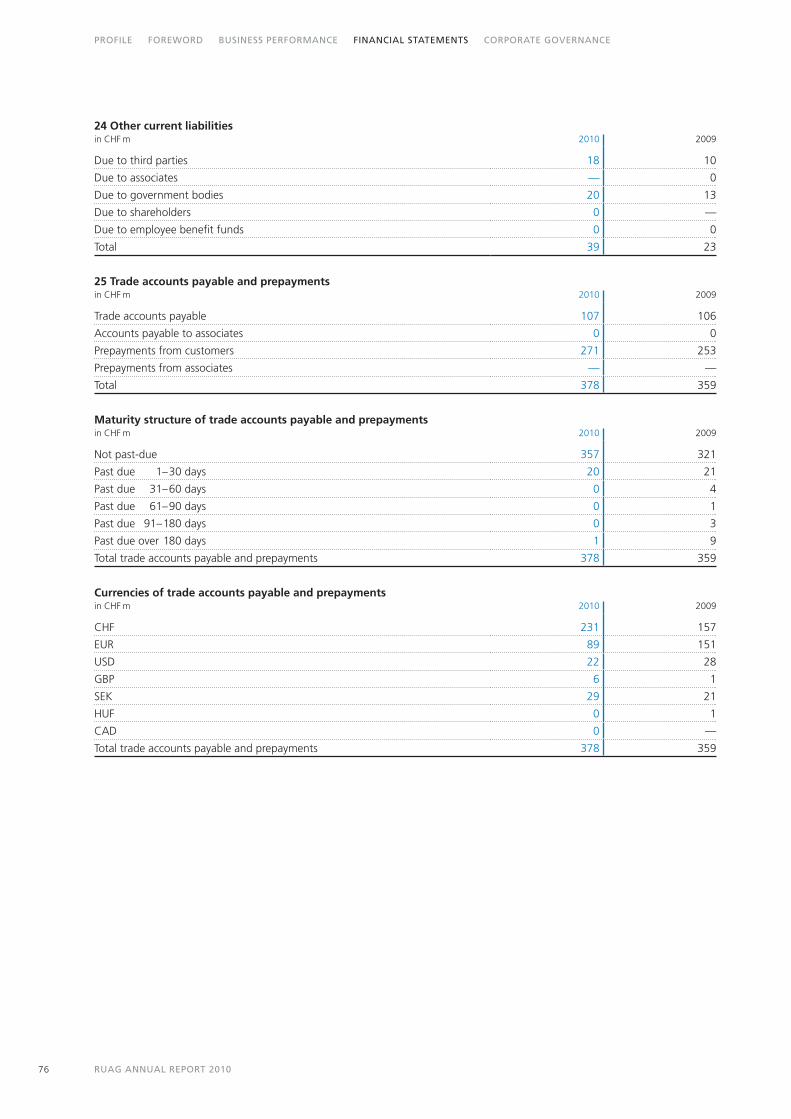
RUAG ANNUAL REPORT 201076
PROFILE FOREWORD BUSINESS PERFORMANCE FINANCIAL STATEMENTS CORPORATE GOVERNANCE
24 Other current liabilities in CHF m 2010 2009
Due to third parties 18 10
Due to associates — 0
Due to government bodies 20 13
Due to shareholders 0 —
Due to employee benefi t funds 0 0
Total 39 23
25 Trade accounts payable and prepayments in CHF m 2010 2009
Trade accounts payable 107 106
Accounts payable to associates 0 0
Prepayments from customers 271 253
Prepayments from associates — —
Total 378 359
Maturity structure of trade accounts payable and prepayments in CHF m 2010 2009
Not past-due 357 321
Past due 1–30 days 20 21
Past due 31–60 days 0 4
Past due 61–90 days 0 1
Past due 91–180 days 0 3
Past due over 180 days 1 9
Total trade accounts payable and prepayments 378 359
Currencies of trade accounts payable and prepayments in CHF m 2010 2009
CHF 231 157
EUR 89 151
USD 22 28
GBP 6 1
SEK 29 21
HUF 0 1
CAD 0 —
Total trade accounts payable and prepayments 378 359
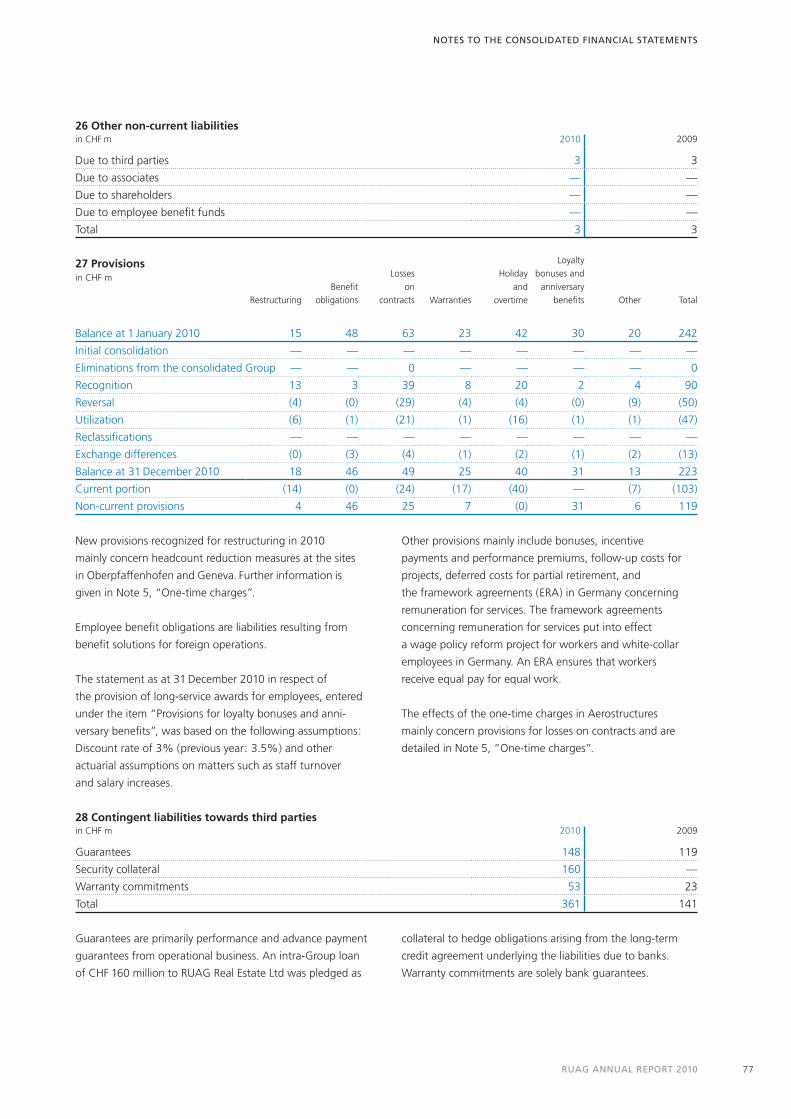
RUAG ANNUAL REPORT 2010 77
NOTES TO THE CONSOLIDATED FINANCIAL STATEMENTS
26 Other non-current liabilities in CHF m 2010 2009
Due to third parties 3 3
Due to associates — —
Due to shareholders — —
Due to employee benefi t funds — —
Total 3 3
27 Provisionsin CHF m
RestructuringBenefi t
obligations
Losses on
contracts Warranties
Holiday and
overtime
Loyalty bonuses and
anniversary benefi ts Other Total
Balance at 1 January 2010 15 48 63 23 42 30 20 242
Initial consolidation — — — — — — — —
Eliminations from the consolidated Group — — 0 — — — — 0
Recognition 13 3 39 8 20 2 4 90
Reversal (4) (0) (29) (4) (4) (0) (9) (50)
Utilization (6) (1) (21) (1) (16) (1) (1) (47)
Reclassifi cations — — — — — — — —
Exchange differences (0) (3) (4) (1) (2) (1) (2) (13)
Balance at 31 December 2010 18 46 49 25 40 31 13 223
Current portion (14) (0) (24) (17) (40) — (7) (103)
Non-current provisions 4 46 25 7 (0) 31 6 119
New provisions recognized for restructuring in 2010
mainly concern headcount reduction measures at the sites
in Oberpfaffenhofen and Geneva. Further information is
given in Note 5, “One-time charges”.
Employee benefi t obligations are liabilities resulting from
benefi t solutions for foreign operations.
The statement as at 31 December 2010 in respect of
the provision of long-service awards for employees, entered
under the item “Provisions for loyalty bonuses and anni-
versary benefi ts”, was based on the following assumptions:
Discount rate of 3% (previous year: 3.5%) and other
actuarial assumptions on matters such as staff turnover
and salary increases.
Other provisions mainly include bonuses, incentive
payments and performance premiums, follow-up costs for
projects, deferred costs for partial retirement, and
the framework agreements (ERA) in Germany concerning
remuneration for services. The framework agreements
concerning remuneration for services put into effect
a wage policy reform project for workers and white-collar
employees in Germany. An ERA ensures that workers
receive equal pay for equal work.
The effects of the one-time charges in Aerostructures
mainly concern provisions for losses on contracts and are
detailed in Note 5, “One-time charges”.
28 Contingent liabilities towards third partiesin CHF m 2010 2009
Guarantees 148 119
Security collateral 160 —
Warranty commitments 53 23
Total 361 141
Guarantees are primarily performance and advance payment
guarantees from operational business. An intra-Group loan
of CHF 160 million to RUAG Real Estate Ltd was pledged as
collateral to hedge obligations arising from the long-term
credit agreement underlying the liabilities due to banks.
Warranty commitments are solely bank guarantees.
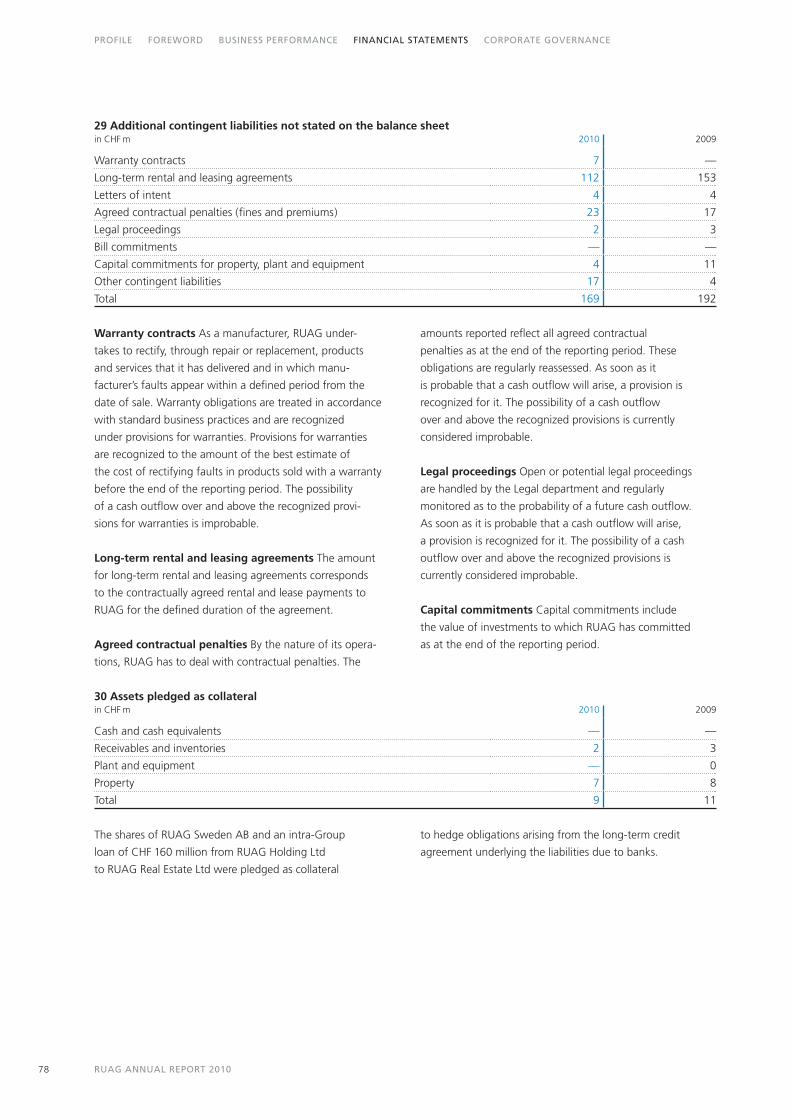
RUAG ANNUAL REPORT 201078
PROFILE FOREWORD BUSINESS PERFORMANCE FINANCIAL STATEMENTS CORPORATE GOVERNANCE
Warranty contracts As a manufacturer, RUAG under-
takes to rectify, through repair or replacement, products
and services that it has delivered and in which manu-
facturer’s faults appear within a defi ned period from the
date of sale. Warranty obligations are treated in accordance
with standard business practices and are recognized
under provisions for warranties. Provisions for warranties
are recognized to the amount of the best estimate of
the cost of rectifying faults in products sold with a warranty
before the end of the reporting period. The possibility
of a cash outfl ow over and above the recognized provi-
sions for warranties is improbable.
Long-term rental and leasing agreements The amount
for long-term rental and leasing agreements corresponds
to the contractually agreed rental and lease payments to
RUAG for the defi ned duration of the agreement.
Agreed contractual penalties By the nature of its opera-
tions, RUAG has to deal with contractual penalties. The
amounts reported refl ect all agreed contractual
penalties as at the end of the reporting period. These
obligations are regularly reassessed. As soon as it
is probable that a cash outfl ow will arise, a provision is
recognized for it. The possibility of a cash outfl ow
over and above the recognized provisions is currently
considered improbable.
Legal proceedings Open or potential legal proceedings
are handled by the Legal department and regularly
monitored as to the probability of a future cash outfl ow.
As soon as it is probable that a cash outfl ow will arise,
a provision is recognized for it. The possibility of a cash
outfl ow over and above the recognized provisions is
currently considered improbable.
Capital commitments Capital commitments include
the value of investments to which RUAG has committed
as at the end of the reporting period.
29 Additional contingent liabilities not stated on the balance sheet in CHF m 2010 2009
Warranty contracts 7 —
Long-term rental and leasing agreements 112 153
Letters of intent 4 4
Agreed contractual penalties (fi nes and premiums) 23 17
Legal proceedings 2 3
Bill commitments — —
Capital commitments for property, plant and equipment 4 11
Other contingent liabilities 17 4
Total 169 192
The shares of RUAG Sweden AB and an intra-Group
loan of CHF 160 million from RUAG Holding Ltd
to RUAG Real Estate Ltd were pledged as collateral
to hedge obligations arising from the long-term credit
agreement underlying the liabilities due to banks.
30 Assets pledged as collateral in CHF m 2010 2009
Cash and cash equivalents — —
Receivables and inventories 2 3
Plant and equipment — 0
Property 7 8
Total 9 11

RUAG ANNUAL REPORT 2010 79
NOTES TO THE CONSOLIDATED FINANCIAL STATEMENTS
31 Fire insurance values in CHF m 2010 2009
Plant and equipment 1 448 1 423
Property 1 507 1 319
Total 2 954 2 743
34 Related party transactions in CHF m 2010 2009
Receivables from related parties 111 54
Liabilities to related parties 0 1
Prepayments 84 122
Current liabilities to employee benefi t funds 1 1
Non-current liabilities to employee benefi t funds — —
32 Share capital
There are a total of 340 000 fully paid-up shares with a
par value of CHF 1000 each. There is no conditional
share capital. All shares in RUAG Holding Ltd are owned by
the Swiss Confederation.
33 Events after the balance sheet date
The Board of Directors of RUAG Holding Ltd approved the
consolidated fi nancial statements for publication on
9 March 2011. The Annual General Meeting has the right
to approve the consolidated fi nancial statements.
In the year under review, CHF 111 million of receivables
from related parties (previous year: CHF 54 million) and
CHF 0.2 million of liabilities to related parties (CHF 0.6 million)
were attributable to the DDPS. Invoiced sales to the DDPS
totalled CHF 608 million (CHF 623 million) as stated in
Note 7, “Net sales”. There were no loans between the
Group companies and members of the Board of Directors.
Employee benefi t obligations totalled CHF 1 million
(CHF 1 million). In the year under review, no raw materials
were ordered from associates (CHF 1 million).
35 Compensation of key management personnel
The overall emoluments (excluding employer contributions
to statutory retirement and survivors’ insurance) paid
to the non-executive members of the Board of Directors for
the 2010 fi nancial year amounted to CHF 499 000
(previous year: CHF 525 000). The overall emoluments
(including all employer contributions to employee benefi t
funds, excluding employer contributions to statutory
retirement and survivors’ insurance or similar state social
insurance contributions) paid to the CEO and the other
members of the Executive Board for the 2010 fi nancial year
amounted to CHF 4 818 000 (CHF 4 207 000). The
2009 total includes the former CEO, Toni J. Wicki, up to
31 May 2009, and the new CEO, Dr Lukas Braunschweiler,
from 1 June 2009 onwards.
The overall emoluments (including all employer contri-
butions to employee benefi t funds, excluding employer
contributions to statutory retirement and survivors’ insurance
or similar state social insurance contributions) paid to the
CEO for the 2010 fi nancial year amounted to CHF 848 000
(previous year: CHF 859 000). The 2009 total includes
former CEO Toni J. Wicki (CHF 460 000) up to 31 May 2009
and new CEO Dr Lukas Braunschweiler (CHF 399 000)
from 1 June 2009 onwards.

RUAG ANNUAL REPORT 201080
PROFILE FOREWORD BUSINESS PERFORMANCE FINANCIAL STATEMENTS CORPORATE GOVERNANCE
in CHF 1000Board of Directors Highest total compensation2
2010 2009 2010 2009
Basic salary
Cash compensation1 499 525 140 140
Employer contributions to employee benefi t funds — — — —
Payments in kind — — — —
Performance-related component
Cash compensation1 — — — —
Shares — — — —
Options — — — —
Total compensation 499 525 140 140
Compensation of key management personnel
Executive Board Highest total compensation2
2010 2009 2010 2009
Basic salary
Cash compensation1 2 915 2 810 442 484
Employer contributions to employee benefi t funds 378 440 65 107
Payments in kind 43 57 8 8
Performance-related component
Cash compensation1 1 482 900 333 260
Shares — — — —
Options — — — —
Total compensation 4 818 4 207 848 859
Relation between performance-related component and cash compensation
51% 32% 75% 54%
36 Future minimum obligations under fi nance leases in CHF m 2010 2009
Within 1 year — 1
Between 1 and 5 years — 0
In more than 5 years — —
Total — 1
Less interest — (0)
Total lease liabilities — 1
Future minimum obligations under operating leases
Within 1 year 1 3
Between 1 and 5 years 3 8
In more than 5 years 1 2
Total 5 13
These items relate exclusively to non-recognized liabilities
arising from operating leases. Future leasing liabilities are not
reported on the balance sheet.
1 Excluding employer contributions to statutory retirement and survivors’ insurance or similar state social insurance contributions.2 For the Board of Directors, the amount includes compensation paid to the Chairman of the Board of Directors Konrad Peter for both the year under
review and previous year; for the Executive Board, the amount includes compensation paid to CEO Dr Lukas Braunschweiler for the year under review and, for the previous year, compensation paid to CEO Dr Lukas Braunschweiler (from 1 June 2009) and to former CEO Toni J. Wicki (up to 31 May 2009).

RUAG ANNUAL REPORT 2010 81
NOTES TO THE CONSOLIDATED FINANCIAL STATEMENTS
37 Financial instruments in CHF m 2010 2009
Financial assets in current assets
Hedging transactions
Financial derivatives at fair value 17 9
Loans and receivables
Receivables and prepayments 325 383
Current fi nancial assets — 0
Other current assets — —
Total 342 392
Financial assets in non-current assets
Loans and receivables
Non-current fi nancial assets 3 3
Total 3 3
Current fi nancial liabilities
At amortized cost
Current fi nancial liabilities 41 239
Trade accounts payable and prepayments 378 359
Hedging transactions — —
Financial derivatives at fair value 7 9
Total 427 606
Non-current fi nancial liabilities
At amortized cost
Non-current fi nancial liabilities 123 1
Total 123 1
Foreign currency hedging contracts with banks – positive 260 360
Foreign currency hedging contracts with banks – negative (54) (41)
Interest rate hedging contracts 214 244
The fi nancial derivatives measured at fair value consist
exclusively of Level 2 instruments in accordance with
IFRS 7.27 and are measured on the basis of models with
mainly market-observable parameters. Financial derivatives
are held by RUAG exclusively for hedging purposes.
The nominal volume of all derivative instruments is arrived
at by multiplying the contract volumes by the agreed
contract prices. The individual nominal volumes partly
comprise opposing buy and sell contracts. Therefore, RUAG
is only exposed to a market price risk at the substantially
lower volume at which the buy and sell volumes differ at
the peak.
As at 31 December, the hedged nominal volumes of all
derivatives amounted to (in CHF m):
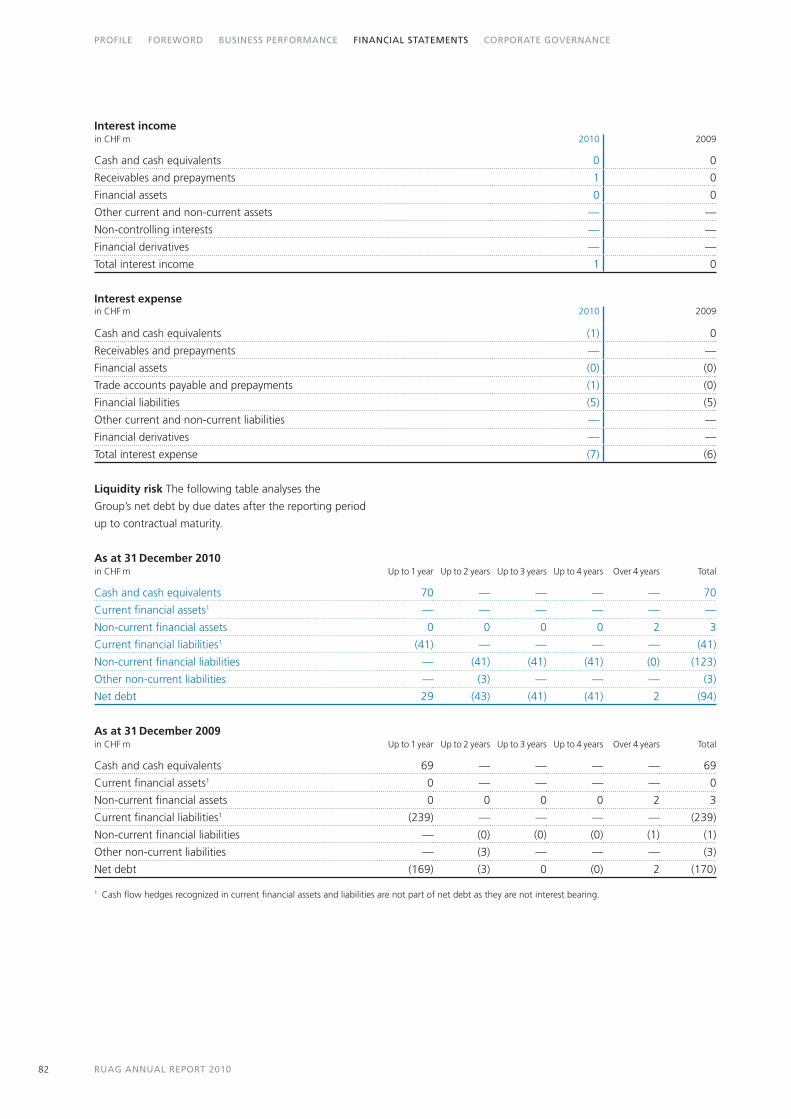
RUAG ANNUAL REPORT 201082
PROFILE FOREWORD BUSINESS PERFORMANCE FINANCIAL STATEMENTS CORPORATE GOVERNANCE
Interest income in CHF m 2010 2009
Cash and cash equivalents 0 0
Receivables and prepayments 1 0
Financial assets 0 0
Other current and non-current assets — —
Non-controlling interests — —
Financial derivatives — —
Total interest income 1 0
Interest expensein CHF m 2010 2009
Cash and cash equivalents (1) 0
Receivables and prepayments — —
Financial assets (0) (0)
Trade accounts payable and prepayments (1) (0)
Financial liabilities (5) (5)
Other current and non-current liabilities — —
Financial derivatives — —
Total interest expense (7) (6)
As at 31 December 2010 in CHF m Up to 1 year Up to 2 years Up to 3 years Up to 4 years Over 4 years Total
Cash and cash equivalents 70 — — — — 70
Current fi nancial assets1 — — — — — —
Non-current fi nancial assets 0 0 0 0 2 3
Current fi nancial liabilities1 (41) — — — — (41)
Non-current fi nancial liabilities — (41) (41) (41) (0) (123)
Other non-current liabilities — (3) — — — (3)
Net debt 29 (43) (41) (41) 2 (94)
As at 31 December 2009 in CHF m Up to 1 year Up to 2 years Up to 3 years Up to 4 years Over 4 years Total
Cash and cash equivalents 69 — — — — 69
Current fi nancial assets1 0 — — — — 0
Non-current fi nancial assets 0 0 0 0 2 3
Current fi nancial liabilities1 (239) — — — — (239)
Non-current fi nancial liabilities — (0) (0) (0) (1) (1)
Other non-current liabilities — (3) — — — (3)
Net debt (169) (3) 0 (0) 2 (170)
Liquidity risk The following table analyses the
Group’s net debt by due dates after the reporting period
up to contractual maturity.
1 Cash fl ow hedges recognized in current fi nancial assets and liabilities are not part of net debt as they are not interest bearing.

RUAG ANNUAL REPORT 2010 83
NOTES TO THE CONSOLIDATED FINANCIAL STATEMENTS
Two of the key fi nancial fi gures (net debt/EBITDA ratio
and equity ratio) relating to a long-term contractual credit
agreement were in breach as per 31 December 2009, with
the result that the related liability was classifi ed as short-
term at the end of the reporting period. In 2010, the lender
granted an extension period until 30 September 2010 to
resolve the breach of the credit agreement. As at 31 Decem-
ber 2010, RUAG fulfi lled these contractual covenants.
Currency risk The important currencies for RUAG are
the euro, Swedish krona and the US dollar. An appreciation
of 5% in the value of the Swiss franc against the euro,
Swedish krona and US dollar compared to its value on
31 December 2010 would have reduced RUAG’s earnings by
an estimated CHF 3 million (previous year: CHF 3 million);
a corresponding appreciation would have improved RUAG’s
earnings by CHF 3 million (CHF 3 million).
Commodity price risk RUAG uses primarily non-ferrous
metals (copper, zinc and lead) and aluminium, steel and
titanium. An across-the-board increase of 5% on 31 Decem-
ber 2010 in the prices of these commodities would have
reduced RUAG’s earnings by less than CHF 2 million (previous
year: CHF 1 million), while the value of RUAG’s inventories
would have risen by at most CHF 2 million (CHF 1 million).
Interest rate risk At present RUAG is not subject to
any notable interest rate risk.
38 Employee benefi ts
The company has a number of independent employee
benefi t plans in addition to statutory social security.
Most of these plans are fi nanced externally, in units that are
legally separate from the company. Group companies
without suffi cient assets in their plans to cover employee
benefi ts recognize appropriate provisions in the statement
of fi nancial position.
Major employee benefi t plans that are classed as defi ned
benefi t plans under IAS 19 are evaluated by an inde-
pendent insurance actuary every year. The most recent
actuarial appraisal in accordance with IAS 19 was carried
out on 1 January 2010.
All employee benefi t plans are based on local statutory
provisions. CHF 44 million in total contributions was paid in
the 2010 fi nancial year (previous year: CHF 39 million).
The following fi gures give an overview of the status of
the defi ned benefi t plans with and without fund coverage
as at 31 December 2010 and 2009.
Net employee benefi t expenses in CHF m 2010 2009
Benefi ts granted 69 58
Interest on employee benefi t obligations 55 52
Expected return on plan assets (76) (66)
Amortized gains / losses — —
Employee contributions (23) (20)
Increase (decrease) in non-recognized plan assets plus recognition of gain (loss) in accordance with IAS 19.58A 11 11
Total 36 34

RUAG ANNUAL REPORT 201084
PROFILE FOREWORD BUSINESS PERFORMANCE FINANCIAL STATEMENTS CORPORATE GOVERNANCE
Employee benefi t obligation in CHF m 2010 2009
Benefi t obligations at beginning of year 1 619 1 438
Current service cost 47 37
Employee contributions 23 20
Interest on employee benefi t obligations 55 52
Actuarial loss (gain) 92 (8)
Exchange differences (3) 1
Plan amendments — 0
Changes in the consolidated Group — 117
Benefi ts paid (44) (39)
Present value of benefi t obligations at end of year 1 788 1 619
Fair value of plan assets 1 677 1 618
(Defi cient) / surplus cover (112) (1)
Plan assets in CHF m 2010 2009
Fair value of plan assets at beginning of year 1 618 1 327
Actual return on plan assets 47 165
Exchange differences — —
Employer contributions 34 31
Employee contributions 23 20
Changes in the consolidated Group — 114
Net employee benefi ts paid (44) (39)
Fair value of plan assets at end of year 1 677 1 618
Allocation of plan assets at 31 December in % Long-term target 2010 2009
Cash and cash equivalents 0–6% 1% 3%
Debt instruments (bonds) 44–62% 50% 48%
Equity instruments (shares) 20–38% 33% 33%
Other assets 13–22% 16% 16%
Total plan assets 100% 100%
The following table presents the cover of the performance-
related employee benefi t obligations and the infl uence
of deviations between expected and actual return on
the plan assets for the past fi ve years.
Employer contributions for the 2011 fi nancial year are
expected to total CHF 30 million.
As per 31 December 2010 (as was also the case at the
end of the previous year) actuarial losses not yet amortized
exceeded the present value of pension obligations by
less than 10% and were thus within the corridor stipulated
by IAS 19.
The following table shows the changes in projected
employee benefi t obligations and the benefi t plan assets as
at 31 December 2010 and 2009 in Switzerland, Germany
and Sweden:

RUAG ANNUAL REPORT 2010 85
Multi-year overviewin CHF m 2010 2009 2008 2007 2006
Present value of benefi t obligations at end of year 1 788 1 619 1 438 1 393 1 459
Fair value of plan assets 1 677 1 618 1 327 1 533 1 510
(Defi cient) / surplus cover (112) (1) (111) 140 51
Difference between expected and actual return on plan assets (29) 99 (284) (70) 7
Gain on revaluation of benefi t obligations 24 19 29 31 13
NOTES TO THE CONSOLIDATED FINANCIAL STATEMENTS
Summary of fi nancial situation at year-end in CHF m 2010 2009
(Defi cient) / surplus cover IAS 19 (112) (1)
Non-amortized loss (gain) 70 10
Non-amortized fi rst-time difference — —
Unrecognized plan assets (1) (51)
Employee benefi t obligation (42) (43)
Change in employee benefi t obligation in CHF m 2010 2009
Employee benefi t obligation at beginning of year (43) (33)
Net benefi t expenses (36) (34)
Changes in the consolidated Group — (5)
Employer contributions 34 31
Exchange differences 3 (2)
Employee benefi t obligation at end of year (42) (43)
Employee benefi t obligations are included
in non-current provisions.
As at 31 December 2010, the employee benefi t funds
owned no shares in RUAG Holding Ltd.
Employee benefi t obligations are measured based on the
following actuarial assumptions:
Actuarial assumptions in % 2010 2009
Discount rate 3.00% 3.50%
Anticipated long-term return on plan assets 4.75% 4.75%
Annual salary increases 2.00% 2.00%
Annual employee benefi t adjustments 0.75% 0.75%
To estimate the anticipated return on plan assets, periodic
expectations – based on long-term empirical fi gures from the
fi nancial markets – are made regarding the long-term
return and risk characteristics (volatility) of the various invest-
ment categories. The interdependencies between
investment categories have also been estimated and taken
into account.
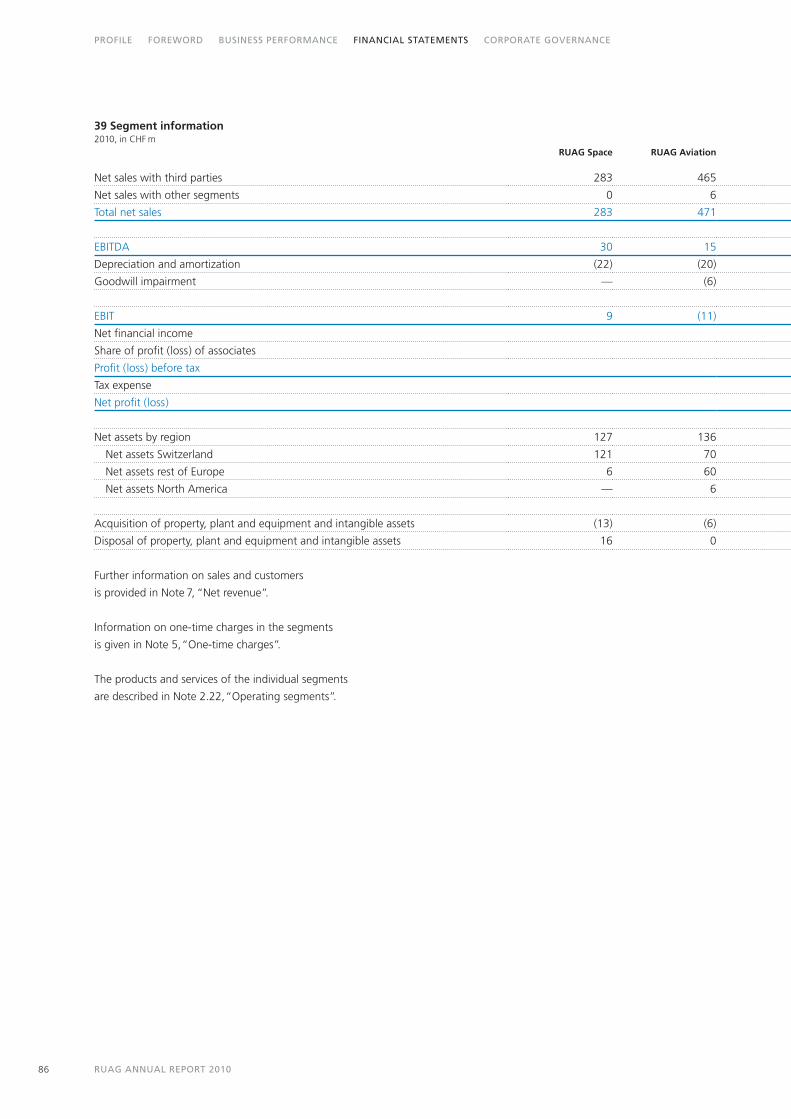
RUAG ANNUAL REPORT 201086
PROFILE FOREWORD BUSINESS PERFORMANCE FINANCIAL STATEMENTS CORPORATE GOVERNANCE
39 Segment information2010, in CHF m
RUAG Space RUAG Aviation
Net sales with third parties 283 465
Net sales with other segments 0 6
Total net sales 283 471
EBITDA 30 15
Depreciation and amortization (22) (20)
Goodwill impairment — (6)
EBIT 9 (11)
Net fi nancial income
Share of profi t (loss) of associates
Profi t (loss) before tax
Tax expense
Net profi t (loss)
Net assets by region 127 136
Net assets Switzerland 121 70
Net assets rest of Europe 6 60
Net assets North America — 6
Acquisition of property, plant and equipment and intangible assets (13) (6)
Disposal of property, plant and equipment and intangible assets 16 0
Further information on sales and customers
is provided in Note 7, “Net revenue”.
Information on one-time charges in the segments
is given in Note 5, “One-time charges”.
The products and services of the individual segments
are described in Note 2.22, “Operating segments”.

RUAG ANNUAL REPORT 2010 87
NOTES TO THE CONSOLIDATED FINANCIAL STATEMENTS
RUAG Technology RUAG Ammotec RUAG Defence RUAG Services Intercompany Group total
270 319 433 26 — 1 796
3 1 6 126 (141) —
273 320 438 152 (141) 1 796
30 42 38 39 (0) 194
(8) (10) (6) (24) — (90)
— — — — — (6)
21 31 32 15 0 98
(14)
4 4
88
4
92
90 179 (35) 275 771
77 37 (47) 279 537
13 123 12 (3) 210
— 19 — — 25
(11) (20) (4) (17) (71)
2 0 1 5 24
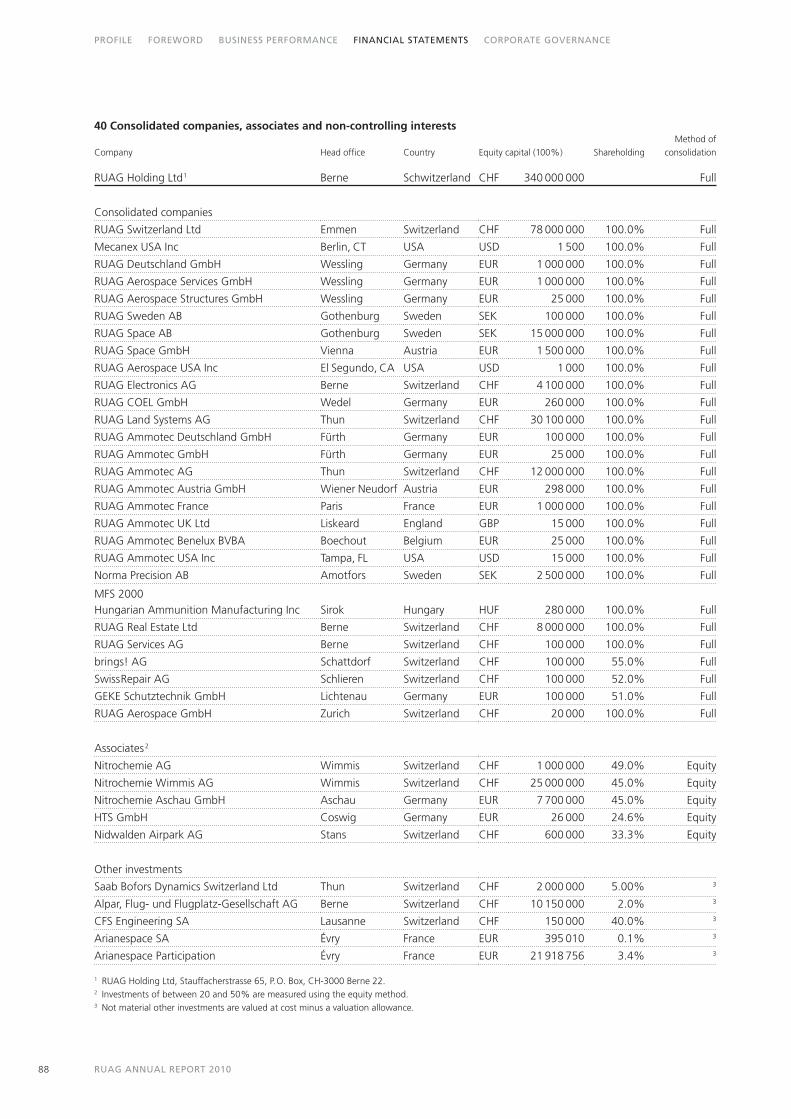
RUAG ANNUAL REPORT 201088
PROFILE FOREWORD BUSINESS PERFORMANCE FINANCIAL STATEMENTS CORPORATE GOVERNANCE
40 Consolidated companies, associates and non-controlling interests
Company Head offi ce Country Equity capital (100%) ShareholdingMethod of
consolidation
RUAG Holding Ltd1 Berne Schwitzerland CHF 340 000 000 Full
Consolidated companies
RUAG Switzerland Ltd Emmen Switzerland CHF 78 000 000 100.0% Full
Mecanex USA Inc Berlin, CT USA USD 1 500 100.0% Full
RUAG Deutschland GmbH Wessling Germany EUR 1 000 000 100.0% Full
RUAG Aerospace Services GmbH Wessling Germany EUR 1 000 000 100.0% Full
RUAG Aerospace Structures GmbH Wessling Germany EUR 25 000 100.0% Full
RUAG Sweden AB Gothenburg Sweden SEK 100 000 100.0% Full
RUAG Space AB Gothenburg Sweden SEK 15 000 000 100.0% Full
RUAG Space GmbH Vienna Austria EUR 1 500 000 100.0% Full
RUAG Aerospace USA Inc El Segundo, CA USA USD 1 000 100.0% Full
RUAG Electronics AG Berne Switzerland CHF 4 100 000 100.0% Full
RUAG COEL GmbH Wedel Germany EUR 260 000 100.0% Full
RUAG Land Systems AG Thun Switzerland CHF 30 100 000 100.0% Full
RUAG Ammotec Deutschland GmbH Fürth Germany EUR 100 000 100.0% Full
RUAG Ammotec GmbH Fürth Germany EUR 25 000 100.0% Full
RUAG Ammotec AG Thun Switzerland CHF 12 000 000 100.0% Full
RUAG Ammotec Austria GmbH Wiener Neudorf Austria EUR 298 000 100.0% Full
RUAG Ammotec France Paris France EUR 1 000 000 100.0% Full
RUAG Ammotec UK Ltd Liskeard England GBP 15 000 100.0% Full
RUAG Ammotec Benelux BVBA Boechout Belgium EUR 25 000 100.0% Full
RUAG Ammotec USA Inc Tampa, FL USA USD 15 000 100.0% Full
Norma Precision AB Amotfors Sweden SEK 2 500 000 100.0% Full
MFS 2000
Hungarian Ammunition Manufacturing Inc Sirok Hungary HUF 280 000 100.0% Full
RUAG Real Estate Ltd Berne Switzerland CHF 8 000 000 100.0% Full
RUAG Services AG Berne Switzerland CHF 100 000 100.0% Full
brings! AG Schattdorf Switzerland CHF 100 000 55.0% Full
SwissRepair AG Schlieren Switzerland CHF 100 000 52.0% Full
GEKE Schutztechnik GmbH Lichtenau Germany EUR 100 000 51.0% Full
RUAG Aerospace GmbH Zurich Switzerland CHF 20 000 100.0% Full
Associates2
Nitrochemie AG Wimmis Switzerland CHF 1 000 000 49.0% Equity
Nitrochemie Wimmis AG Wimmis Switzerland CHF 25 000 000 45.0% Equity
Nitrochemie Aschau GmbH Aschau Germany EUR 7 700 000 45.0% Equity
HTS GmbH Coswig Germany EUR 26 000 24.6% Equity
Nidwalden Airpark AG Stans Switzerland CHF 600 000 33.3% Equity
Other investments
Saab Bofors Dynamics Switzerland Ltd Thun Switzerland CHF 2 000 000 5.00% 3
Alpar, Flug- und Flugplatz-Gesellschaft AG Berne Switzerland CHF 10 150 000 2.0% 3
CFS Engineering SA Lausanne Switzerland CHF 150 000 40.0% 3
Arianespace SA Évry France EUR 395 010 0.1% 3
Arianespace Participation Évry France EUR 21 918 756 3.4% 3
1 RUAG Holding Ltd, Stauffacherstrasse 65, P.O. Box, CH-3000 Berne 22.2 Investments of between 20 and 50% are measured using the equity method.3 Not material other investments are valued at cost minus a valuation allowance.
RUAG ANNUAL REPORT 2010 89
AUDITORS’ REPORT

RUAG ANNUAL REPORT 201090
PROFILE FOREWORD BUSINESS PERFORMANCE FINANCIAL STATEMENTS CORPORATE GOVERNANCE
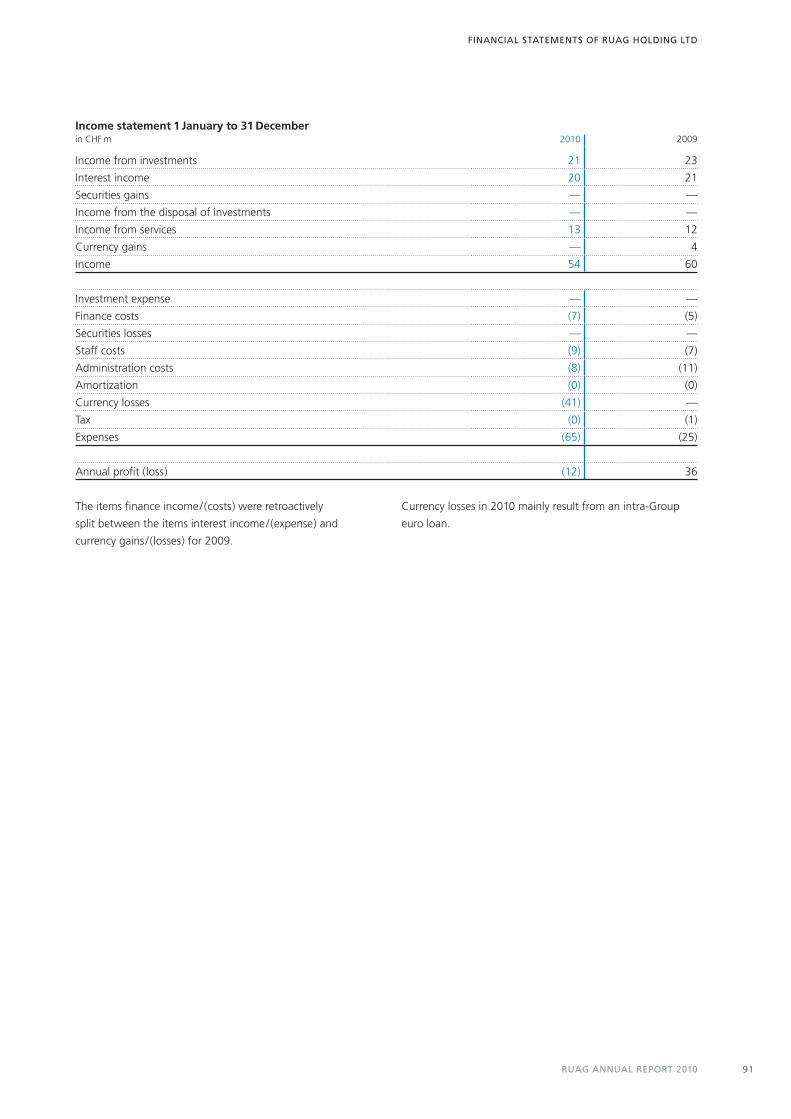
RUAG ANNUAL REPORT 2010 91
Income statement 1 January to 31 Decemberin CHF m 2010 2009
Income from investments 21 23
Interest income 20 21
Securities gains — —
Income from the disposal of investments — —
Income from services 13 12
Currency gains — 4
Income 54 60
Investment expense — —
Finance costs (7) (5)
Securities losses — —
Staff costs (9) (7)
Administration costs (8) (11)
Amortization (0) (0)
Currency losses (41) —
Tax (0) (1)
Expenses (65) (25)
Annual profi t (loss) (12) 36
FINANCIAL STATEMENTS OF RUAG HOLDING LTD
The items fi nance income/(costs) were retroactively
split between the items interest income/(expense) and
currency gains/ (losses) for 2009.
Currency losses in 2010 mainly result from an intra-Group
euro loan.

RUAG ANNUAL REPORT 201092
PROFILE FOREWORD BUSINESS PERFORMANCE FINANCIAL STATEMENTS CORPORATE GOVERNANCE
Statement of fi nancial position before allocation of profi t at 31 December in CHF m 2010 2009
Cash and cash equivalents 30 15
Receivables
Third parties 0 0
Group companies 370 608
Prepaid expenses and deferred charges
Third parties 1 1
Group companies — —
Current assets 401 624
in % of total assets 33.5% 49.5%
Investments 637 637
Financial assets
Third parties — —
Group companies 160 —
Plant and equipment 0 0
Non-current assets 798 638
in % of total assets 66.5% 50.5%
Total assets 1 199 1 262
Current fi nancial liabilities
Third parties 43 236
Group companies 295 276
Deferred income and accrued charges
Third parties 2 1
Group companies 0 —
Non-current fi nancial liabilities
Third parties 123 —
Group companies — —
Provisions 0 1
Liabilities 463 514
in % of total equity and liabilities 38.6% 40.7%
Equity capital 340 340
Statutory reserve 26 24
Statutory reserve from capital contribution 10 10
Voluntary reserve — —
Retained earnings brought forward 372 338
Annual profi t (12) 36
Equity 736 748
in % of total equity and liabilities 61.4% 59.3%
Total equity and liabilities 1 199 1 262

RUAG ANNUAL REPORT 2010 93
Contingent liabilities towards third parties in CHF m 2010 2009
Guarantees 162 108
Warranty commitments 35 5
Total 196 113
Fire insurance values of property, plant and equipment in CHF m 2010 2009
Plant and equipment 1 1
Property — —
Total 1 1
Additional contingent liabilities not stated on the balance sheet in CHF m 2010 2009
Warranty contracts — —
Long-term rental and leasing agreements 0 0
Letters of intent — —
Agreed contractual penalties (fi nes and premiums) — —
Legal proceedings — —
Contingent liabilities — —
Subordinated receivables from Group companies — —
Capital commitments — —
Total 0 0
Assets pledged as collateral in CHF m 2010 2009
Cash and cash equivalents — —
Receivables — —
Financial assets to Group companies 160 —
Property, plant and equipment — —
Investments 19 247
Total 179 247
NOTES TO THE FINANCIAL STATEMENTS OF RUAG HOLDING LTD
Guarantees are primarily performance and advance
payment guarantees from operational business.
The valuation is conducted on the basis of the
probability and extent of future unilateral payments and
costs exceeding the provisions recognized.
The shares of RUAG Sweden AB and an intra-Group
loan of CHF 160 million from RUAG Holding Ltd to RUAG
Real Estate Ltd were pledged as collateral to hedge
obligations arising from the long-term credit agreement
underlying the liabilities due to banks.

RUAG ANNUAL REPORT 201094
PROFILE FOREWORD BUSINESS PERFORMANCE FINANCIAL STATEMENTS CORPORATE GOVERNANCE
Liabilities to employee benefi t funds in CHF m 2010 2009
Current liabilities to employee benefi t funds — —
Non-current liabilities to employee benefi t funds — —
Total 0 0
Treasury shares of RUAG Holding
All shares of RUAG Holding Ltd are owned by the
Swiss Confederation.
Events after the balance sheet date The Board of
Directors of RUAG Holding Ltd approved the consolidated
fi nancial statements for publication on 9 March 2011.
The Annual General Meeting has the right to approve the
consolidated fi nancial statements.
Risk management and risk assessment RUAG has a
risk management system that differentiates between
strategic and operational risks and focuses on the relevant
topics. Risks are identifi ed, assessed and monitored in
the individual business units at all levels of the management
structure. In order to minimize the individual risks, the
appropriate measures are defi ned and implemented. The
most signifi cant risks aggregated from the divisions are
monitored and controlled by the Executive Board. The risks
identifi ed are quantifi ed (in terms of probability of occur-
rence and impact) and entered on a risk map. This risk map is
discussed periodically by the Board of Directors and the
Audit Committee. Ongoing risk monitoring, supervision and
control is the responsibility of the Management.
Investments (as at 31 December 2010)Company Head offi ce Country Equity capital (100%) Shareholding
RUAG Switzerland Ltd Emmen Switzerland CHF 78 000 000 100.0%
RUAG Aerospace Deutschland GmbH Wessling Germany EUR 1 000 000 100.0%
RUAG Electronics AG Berne Switzerland CHF 4 100 000 100.0%
RUAG Land Systems AG Thun Switzerland CHF 30 100 000 100.0%
RUAG Ammotec AG Thun Switzerland CHF 12 000 000 100.0%
RUAG Real Estate Ltd Berne Switzerland CHF 8 000 000 100.0%
RUAG Services AG Berne Switzerland CHF 100 000 100.0%
RUAG Sweden AB Gothenburg Sweden SEK 100 000 100.0%
Nitrochemie AG Wimmis Switzerland CHF 1 000 000 49.0%
Nitrochemie Wimmis AG Wimmis Switzerland CHF 25 000 000 45.0%
Nitrochemie Aschau GmbH Aschau Germany EUR 7 700 000 45.0%
Saab Bofors Dynamics Switzerland Ltd Thun Switzerland CHF 2 000 000 5.0%
Alpar, Flug- und Flugplatz-Gesellschaft AG Berne Switzerland CHF 10 150 000 2.0%
Foreign currency forward transactions in CHF m 2010 2009
Volume of contracts with banks 260 360
Volume of contracts with banks (54) (41)
Volume of contracts with Group companies 63 27
Volume of contracts with Group companies (300) 353
Positive replacement value banks 17 6
Negative replacement value banks (3) (2)
Positive replacement value Group companies 3 2
Negative replacement value Group companies (17) (6)
Total replacement values 0 0
In the fi nancial statements prepared under commercial
law, the net principle is used for foreign currency forward
transactions.
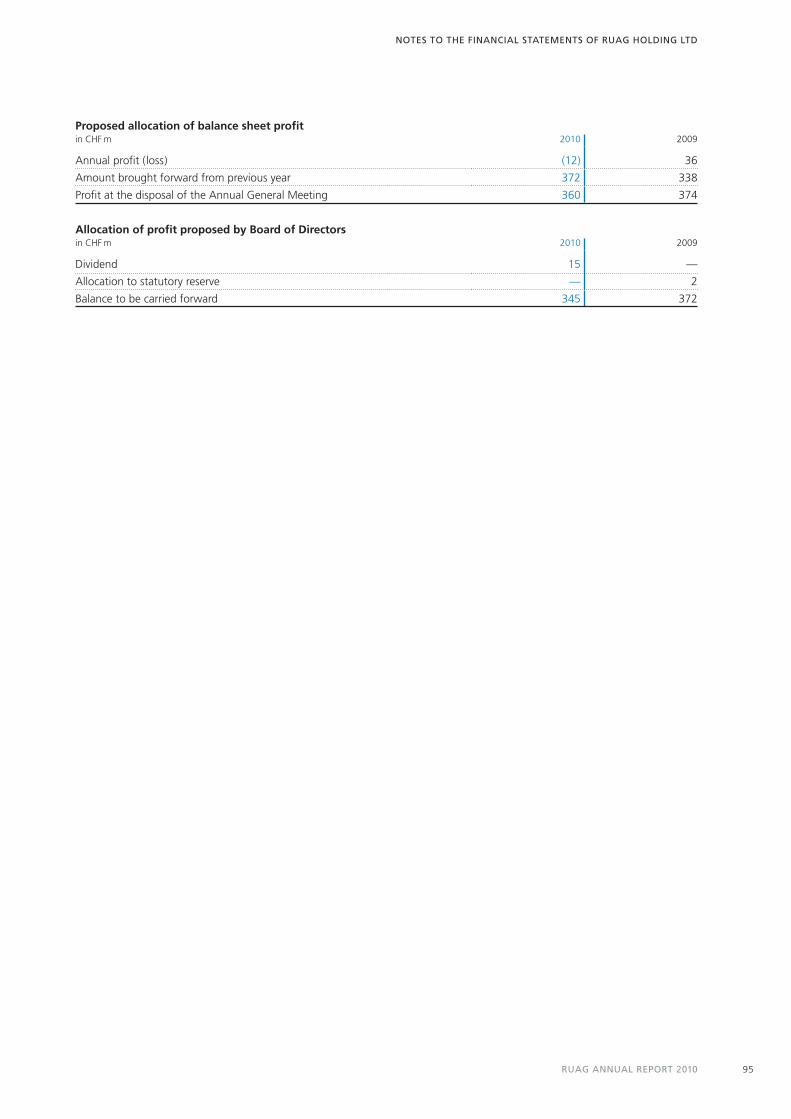
RUAG ANNUAL REPORT 2010 95
Proposed allocation of balance sheet profi t in CHF m 2010 2009
Annual profi t (loss) (12) 36
Amount brought forward from previous year 372 338
Profi t at the disposal of the Annual General Meeting 360 374
Allocation of profi t proposed by Board of Directors in CHF m 2010 2009
Dividend 15 —
Allocation to statutory reserve — 2
Balance to be carried forward 345 372
NOTES TO THE FINANCIAL STATEMENTS OF RUAG HOLDING LTD

RUAG ANNUAL REPORT 201096
PROFILE FOREWORD BUSINESS PERFORMANCE FINANCIAL STATEMENTS CORPORATE GOVERNANCE
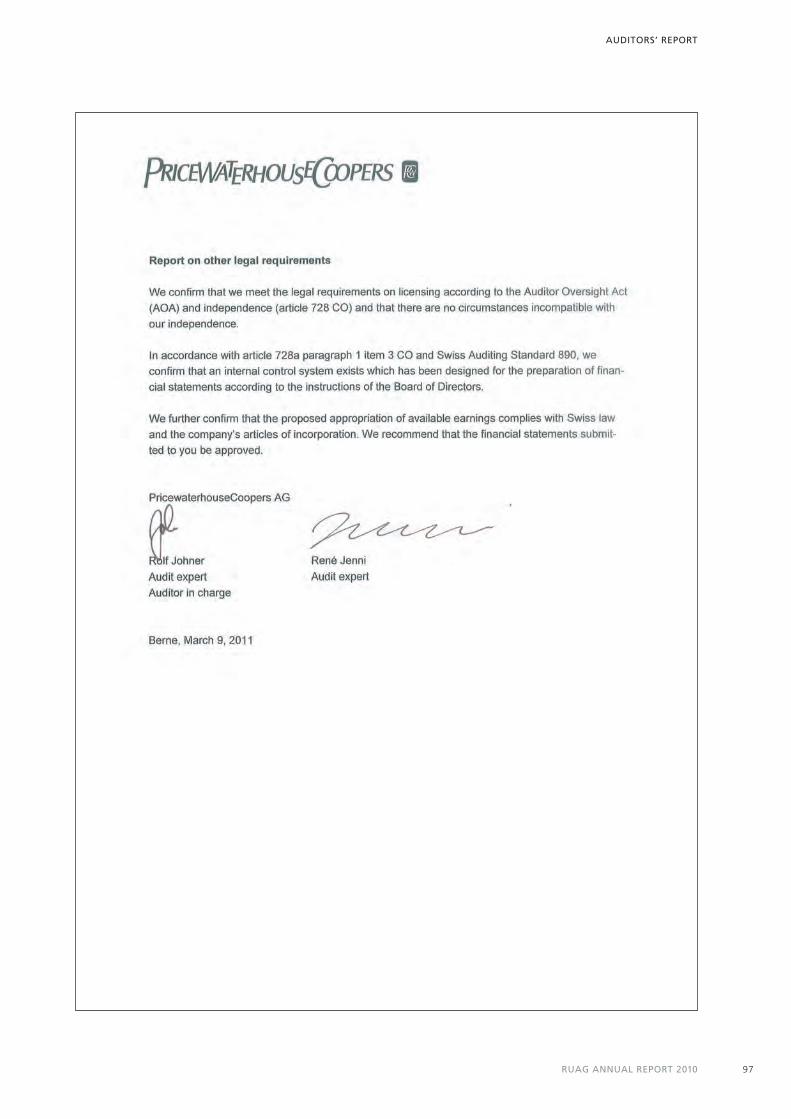
RUAG ANNUAL REPORT 2010 97
AUDITORS’ REPORT
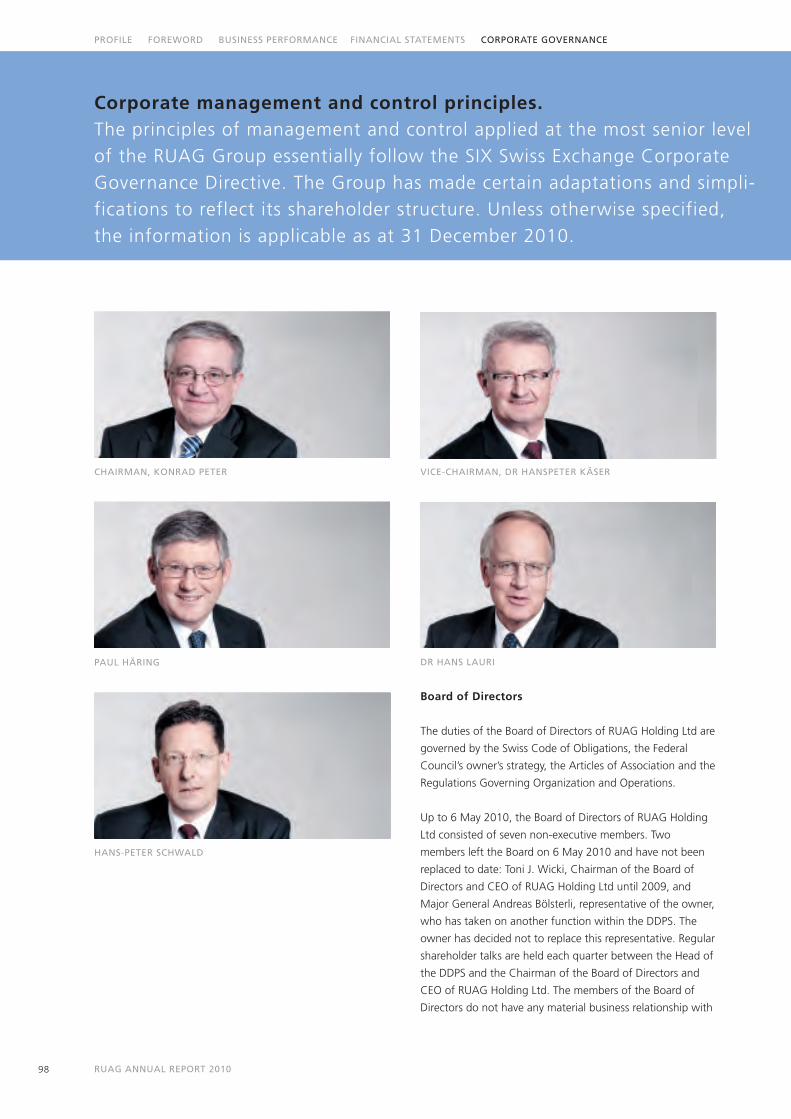
RUAG AnnUAl RepoRt 201098
pRofile foRewoRd bUsiness peRfoRmAnce finAnciAl stAtements coRpoRAte GoveRnAnce
Corporate management and control principles. The principles of management and control applied at the most senior level
of the RUAG Group essentially follow the SIX Swiss Exchange Corporate
Governance Directive. The Group has made certain adaptations and simpli-
fications to reflect its shareholder structure. Unless otherwise specified,
the information is applicable as at 31 December 2010.
Board of Directors
The duties of the Board of Directors of RUAG Holding Ltd are
governed by the Swiss Code of Obligations, the Federal
Council’s owner’s strategy, the Articles of Association and the
Regulations Governing Organization and Operations.
Up to 6 May 2010, the Board of Directors of RUAG Holding
Ltd consisted of seven non-executive members. Two
members left the Board on 6 May 2010 and have not been
replaced to date: Toni J. Wicki, Chairman of the Board of
Directors and CEO of RUAG Holding Ltd until 2009, and
Major General Andreas Bölsterli, representative of the owner,
who has taken on another function within the DDPS. The
owner has decided not to replace this representative. Regular
shareholder talks are held each quarter between the Head of
the DDPS and the Chairman of the Board of Directors and
CEO of RUAG Holding Ltd. The members of the Board of
Directors do not have any material business relationship with
chAiRmAn, KonRAd peteR vice-chAiRmAn, dR hAnspeteR KäseR
pAUl häRinG dR hAns lAURi
hAns-peteR schwAld
RUAG AnnUAl RepoRt 2010 99
the RUAG Group. The list lower down on this page provides
details of the name, age, position, date of joining and
remaining term in office of each member of the Board of
Directors.
Other activities
There are no reciprocal memberships between the Board of
Directors of RUAG Holding Ltd and that of a listed company.
Election and term of office
The Board of Directors of RUAG Holding Ltd is elected by
the Annual General Meeting (AGM). In accordance with the
Articles of Association, the Board of Directors consists of
at least three individuals. A majority of the members of the
Board of Directors must be Swiss nationals domiciled in
Switzerland. The Articles of Association of RUAG Holding Ltd
were revised in 2010, with the term of office of members
of the Board of Directors being shortened from four years to
one. The members of the Board of Directors are elected
individually and may be re-elected.
Internal organization and tasks
The Board of Directors holds ultimate responsibility for
the business strategy and overall management of the RUAG
Group. It possesses supreme decision-making powers and
determines the guidelines for strategy, organization, finance
and accounting. The Board of Directors has delegated the
management of day-to-day business to the Chief Executive
Officer (CEO) and Executive Board. Together with the
Executive Board, the CEO is responsible for the overall
management of the RUAG Group and for all matters not
delegated to another governing body of the company by law,
the Articles of Association, the Federal Council’s owner’s
strategy or the Regulations Governing Organization and
Operations.
The main duties of the Board of Directors under the terms
of the Swiss Code of Obligations and Articles of Association
of RUAG Holding Ltd are:
• ThestrategicorientationandmanagementoftheRUAG
Group in accordance with the owner’s strategy of the
Federal Council
• Thestructuringoftheaccountingsystem,financial
controlling and financial planning
• TheappointmentanddismissaloftheCEO,other
members of the Executive Board and other senior
executives
• Supremeoversightofbusinessactivities
• ProductionoftheAnnualReport,preparationoftheAGM
and implementation of resolutions passed by the latter
Decisions are taken by the Board of Directors as a whole.
To assist the Board in its role, two committees have been
Board of DirectorsName Born Position Joined Elected until
Konrad Peter 1946 Chairman, non-executive 2002 2011
Dr Hanspeter Käser 1943 Vice-Chairman, non-executive 1999 2011
Hans-Peter Schwald 1959 Member, non-executive 2002 2011
Paul Häring 1957 Member, non-executive 2004 2011
Dr Hans Lauri 1944 Member, non-executive 2008 2011

RUAG AnnUAl RepoRt 2010100
pRofile foRewoRd bUsiness peRfoRmAnce finAnciAl stAtements coRpoRAte GoveRnAnce
formed: an Audit Committee and a Nomination & Compen-
sation Committee. In the 2010 financial year, the Board
of Directors held regular meetings on six occasions and two
extraordinary meetings. In addition, the committees held
seven ordinary and four extraordinary meetings. The agenda
for meetings of the Board of Directors is set by the Chair-
man in consultation with the CEO. Any member of the Board
of Directors may request that an item be included on the
agenda. The members are provided with documentation
prior to each meeting to enable them to prepare for the
items to be discussed.
The Board of Directors maintains an exchange dialogue with
the senior operating executives of the company and regularly
visits one or more of RUAG’s sites.
Committees
The Board of Directors has formed an Audit Committee
and a Nomination & Compensation Committee and elected
chairmen. The committees meet regularly and prepare
business for the full Board of Directors, draft proposals in
respect thereof and implement resolutions of the Board of
Directors as required. The agenda of each committee’s
meetings is set by its chairman. The members of the
committees are provided with documentation prior to the
meetings to enable them to prepare for the items to be
discussed.
Audit Committee
The Audit Committee is composed of (at least) three
non-executive members of the Board of Directors:
Dr Hanspeter Käser (Chairman), Konrad Peter and Paul
Häring. The members of the Audit Committee are ex-
perienced in financial and accounting matters. The Audit
Committee meets regularly, although it may also be
convened by the Chairman as and when business requires.
As a rule, the meetings are also attended by the CEO,
Chief Staff Coordinator (until 31 January 2011), CFO,
internal auditor and representatives of the statutory auditor.
The main task of the Audit Committee is to ensure a compre-
hensive and efficient audit strategy for RUAG Holding Ltd and
the RUAG Group. The duties of the Audit Committee include:
• Assessingprocessesintheriskandcontrolenvironment
(internal control system)
• Monitoringfinancialreporting
• Assessingtheinternalandexternalauditor
• Definingandapprovingthefocalpointsoftheaudit
• Acceptingtheauditreportandanyrecommendationsof
the statutory auditor prior to submission of the annual
financial statements (individual and consolidated) to the
full Board of Directors for approval
• SubmittingaproposaltothefullBoardofDirectorsas
which external auditor should be recommended to
the AGM for appointment; assessing the performance,
fees and independence of the external auditor and
examining the compatibility of audit activities with any
consultancy mandates. The representatives of the
statutory auditor recuse themselves during deliberation
of these matters
The Audit Committee regulates, supervises and commissions
the internal auditor. It provides the full Board of Directors
with a regular report on its activities and immediately informs
the Board of any important matters.
Nomination & Compensation Committee
The Nomination & Compensation Committee is composed of
(at least) three non-executive members of the Board of
Directors: Dr Hans Lauri (Chairman), Konrad Peter and
Hans-Peter Schwald. The Nomination & Compensation
Committee meets regularly, although it may also be
convened by the Chairman as and when business requires.
As a rule, the meetings are also attended by the CEO and
Senior Vice President Corporate HR.

RUAG AnnUAl RepoRt 2010 101
The main task of the Nomination & Compensation Commit-
tee is to propose the outlines of human resource policies
and planning to the full Board of Directors and to present
proposals on the selection and compensation of Executive
Board members. This also includes preparing necessary
decisions for the full Executive Board in the areas of
management development, compensation system and
policies, objective setting, pension fund matters and social
partnership.
Finally, the Committee is tasked with proposing the compen-
sation of members of the Board of Directors. The final
decision is taken by the AGM at the proposal of the Board of
Directors in line with the guidelines set forth by the Swiss
Confederation.
Information and control instruments
The Management Information System (MIS) of the RUAG
Group is structured as follows: The separate financial
statements (balance sheet, income statement and cash flow
statement) of the individual subsidiaries/divisions are
compiled on a monthly, quarterly, semi-annual and an-
nual basis. These figures are consolidated for each segment
and for the Group as a whole and compared with the
budget. The budget, which represents the first year of a
rolling five-year plan, is examined in the form of a feasi-
bility forecast based on quarterly results. The CEO submits a
written monthly report on budget compliance to the Board
of Directors.
Executive Board
Management organization
The Board of Directors has appointed an Executive Board
under the chairmanship of the CEO. Its powers and duties
are set out in the Regulations Governing Organization
and Operations and in the job description of the CEO.
The members of the Executive Board report to the CEO,
who is responsible for overall management and cross-divi-
sional cooperation.
Executive Board as at 1.1.2011Name Born Position Joined
Dr Lukas Braunschweiler 1956 CEO 2009
Dr Peter Guggenbach 1962 Member, CEO RUAG Space 2009
Phillipp M. Berner 1966 Member, CEO RUAG Aviation* 2010
Dr Viktor Haefeli 1966 Member, CEO RUAG Technology 2006
Cyril Kubelka 1963 Member, CEO RUAG Ammotec 2004
Urs Breitmeier 1963 Member, CEO RUAG Defence** 2006
Urs Kiener 1965 Member, CFO 2002
Hans Bracher 1962 Member, Senior Vice President Corporate HR 2008
Oliver Meyer 1976 Member, CIO and CEO RUAG Services 2011
Thomas Kopp 1955 Member, Secretary General and Director of Legal Services 2011
Christiane Schneider 1967 Member, Senior Vice President Communication and Marketing 2011
* Took over management of the division from Dr Peter Guggenbach on 1 December 2010
** RUAG Electronics and RUAG Land Systems were merged on 1 January 2011 to form RUAG Defence
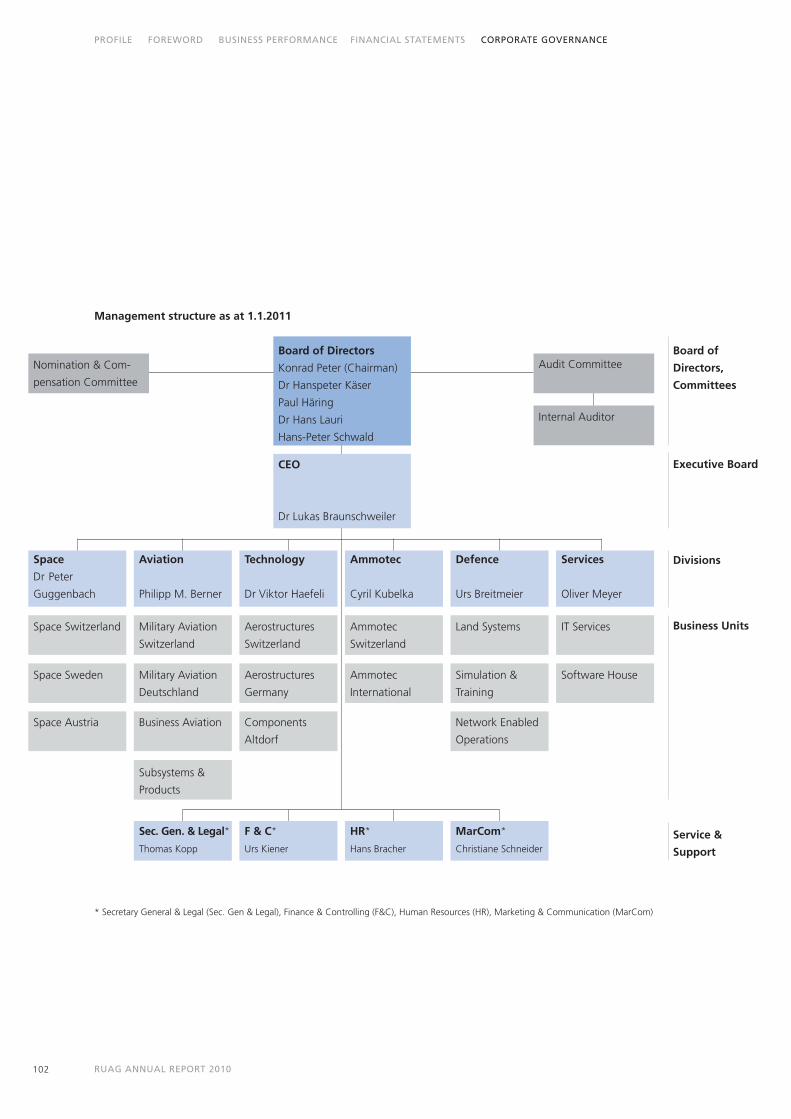
RUAG AnnUAl RepoRt 2010102
pRofile foRewoRd bUsiness peRfoRmAnce finAnciAl stAtements coRpoRAte GoveRnAnce
Aviation
Philipp M. Berner
Defence
Urs Breitmeier
Services
Oliver Meyer
Technology
Dr Viktor Haefeli
Ammotec
Cyril Kubelka
Space
Dr Peter
Guggenbach
Management structure as at 1.1.2011
Board of
Directors,
Committees
Executive Board
Divisions
Business Units
Service &
Support
Board of Directors
Konrad Peter (Chairman)
Dr Hanspeter Käser
Paul Häring
Dr Hans Lauri
Hans-Peter Schwald
CEO
Dr Lukas Braunschweiler
F & C*
Urs Kiener
HR*
Hans Bracher
MarCom*
Christiane Schneider
Sec. Gen. & Legal*
Thomas Kopp
Space Switzerland Military Aviation
Switzerland
Aerostructures
Switzerland
Land SystemsAmmotec
Switzerland
Space Sweden Military Aviation
Deutschland
Aerostructures
Germany
Simulation &
Training
Ammotec
International
Space Austria Business Aviation Components
Altdorf
Network Enabled
Operations
Subsystems &
Products
* Secretary General & Legal (Sec. Gen & Legal), Finance & Controlling (F&C), Human Resources (HR), Marketing & Communication (MarCom)
Audit Committee
Internal Auditor
Nomination & Com-
pensation Committee
IT Services
Software House

RUAG AnnUAl RepoRt 2010 103
The Group CEO, Divisional CEOs, CFO, Chief Staff Coordi-
nator and Senior Vice President Corporate HR sat on
the Executive Board in 2010. Martin Stahel, Member of the
Executive Board and Chief Staff Coordinator, entered
retirement on 31 January 2011, without being replaced.
As of 1 January 2011, those responsible for Service &
Support joined the Executive Board. Dr Peter Guggenbach,
who had been CEO of RUAG Aviation and RUAG Space since
2009, handed over management of the Aviation division
to Philipp M. Berner on 1 December 2010. Urs Breitmeier,
who has been CEO of RUAG Land Systems since 2006,
additionally took over the management of RUAG Electronics on
1 October 2010. RUAG Electronics and RUAG Land Systems
were merged to form RUAG Defence on 1 January 2011.
CEO
The CEO manages the RUAG Group. He submits the RUAG
Group’s strategy, long- and medium-term objectives and
management guidelines to the full Board of Directors for
their approval.
At the proposal of the CEO, the full Board of Directors
decides on the five-year corporate plan, annual budget,
individual projects, separate and consolidated financial
statements and human resource issues.
The CEO regularly reports to the Board of Directors on
business performance, anticipated business matters
and risks, as well as changes at the next management level.
The members of the Board of Directors may request and
review further information on operations as provided by the
law and the Articles of Association. The CEO must inform
the Chairman of the Board of Directors immediately of any
significant unanticipated events and developments.
The CEO regularly assesses whether the Articles of Associa-
tion and the regulations and signatory powers issued by
the Board of Directors require amendment, and applies for
such amendments to be made.
Members of the Executive Board
The list on page 101 provides information on the name, age,
position and date of joining of each member of the Executive
Board.
Management contracts
No management contracts have been concluded by RUAG
Holding Ltd and its subsidiaries with any third parties.

RUAG AnnUAl RepoRt 2010104
pRofile foRewoRd bUsiness peRfoRmAnce finAnciAl stAtements coRpoRAte GoveRnAnce
Compensation, profit-sharing and loans
Compensation report
The following details correspond to the guidelines provided
in the SIX Swiss Exchange Corporate Governance Directive
concerning compensation paid to members of the Board of
Directors and Executive Board, taking the transparency
provisions of the Swiss Code of Obligations (Arts 663bbis and
Art. 663c) into account. Compensation paid in ac cordance
with these provisions of the Swiss Code of Obligations is listed
in the financial statements in Note 35 “Compensation of key
management personnel”, with further details provided.
Compensation policy
RUAG’s HR policy includes the principle that employee
per formance and company success are the main factors that
determine compensation. The policy is aimed at imple-
menting simple, clearly structured compensation systems
that ensure fair pay and are transparent for employees.
RUAG bases its salary level on market wages in the specific
salary market concerned and checks it regularly. Individual
compensation is based on job requirements, skills, perfor-
mance and the company's financial success. Wherever pos-
sible, RUAG applies success and performance-based compen-
sation systems with an additional performance-based variable
component. These principles also apply in setting the com-
pensation policy for the Executive Board, which is determined
by the Board of Directors at the request of the Nomination &
Compensation Committee.
Board of Directors
The members of the Board of Directors receive compensa-
tion for their work that is determined annually by the
Annual General Meeting in accordance with the guidelines
set forth by the Swiss Confederation. The criteria for
determining compensation paid to the Board of Directors is
based on the responsibility accorded to its members, the
complexity of the task, the specialist and personal demands
placed on the individual and the expected, average time
required to fulfil the task. Compensation consists of the
following:
• Cashcomponent
• Otherbenefits
Each member of the Board of Directors receives a fixed mon-
etary sum as part of his or her basic compensation. Other
benefits comprise employer’s contributions to social security
funds and expenses paid by RUAG Holding Ltd.
No compensation was paid to former Board members.
Further details of compensation paid in the year under review
can be found in the financial statements in Note 35 “Com-
pensation of key management personnel”.
Executive Board
The composition and amount of compensation are based
on the industry and labour market environment and are
regularly checked. To this end, publicly available information
on companies of a similar size from Swiss industry and,
where applicable, the results of surveys and external studies
are taken into account. The performance-based bonus
for members of the Executive Board depends on the extent
to which individual performance objectives are reached,
and on the company’s financial success. Compensation
consists of the following:
• Fixedbasicsalaryincash
• Performance-basedbonusincash
• Otherbenefits

RUAG AnnUAl RepoRt 2010 105
The fixed basic salary is determined primarily by the task,
responsibility, qualifications and experience of the Board
members, as well as the market environment. The perfor-
mance-based bonus is determined based on the extent to
which individual performance objectives are reached, and
on the company's financial success. As part of the objective-
setting process, measurable individual goals are set at the
beginning of each year between the Chairman of the Board
of Directors/Nomination & Compensation Committee and
the CEO, and between the CEO and the members of the
Executive Board. At the end of the financial year, the extent
to which these objectives have been met is assessed. The
financial success of the RUAG Group overall and of the
individual divisions is measured based on three financial
value drivers:
• Operatingresult(EBIT)
• Netoperatingassets
• Netcashflowsfrominvestingactivities
The target figures are set for one year and are weighted
according to strategic priorities. A lower and an upper
threshold are defined for each of the three value drivers.
If the lower threshold is not reached for the criterion
concerned, the proportion of the bonus related to it is ruled
out. In contrast, exceeding the upper threshold does not
lead to a further increase in the bonus amount.
The amount of the bonus is based on reaching objectives. For
all members of the Executive Board, the bonus in 2010
ranged from 29% to a maximum of 75% of the annual basic
salary. The extent to which objectives are reached is weighted
for all members of the Executive Board as follows: 20% can
be achieved for personal goals and 80% for financial goals.
In the case of the divisional CEOs, the financial goals are
defined per division. In the case of the Group CEO and heads
of Service & Support, the financial goals of the RUAG Group
apply.
Other benefits comprise employer contributions paid
to social security and for mandatory and extra-mandatory
employee benefits.
The same regulations on expenses apply for the members of
the Executive Board as for all other employees of the RUAG
Group. Additional regulations also apply to the members of
the Executive Board and all members of management in
Switzerland concerning a lump-sum allowance for entertain-
ment and other incidental expenses. Both regulations have
been approved by the tax authorities concerned. A company
car is provided to the members of the Executive Board.
No appreciable compensation was paid to former Executive
Board members.
Further details of compensation paid in the year under
review can be found in the financial statements in Note 35
“Compensation of key management personnel”.
Other compensation
Severance payments: Members of the Board of Directors
or Executive Board are not contractually entitled to any
severance payments. In the 2010 financial year, no severance
payments were paid to persons who terminated their
function as a Board member in the year under review or
earlier.
Shares and options: No shares and/or options are allocated to
members of the Executive Board and Board of Directors.
Additional fees: During the 2010 financial year, the members
of the Board of Directors and Executive Board received no
appreciable fees or other compensation for additional services
rendered to RUAG Holding Ltd or any of its subsidiaries.
RUAG AnnUAl RepoRt 2010106
pRofile foRewoRd bUsiness peRfoRmAnce finAnciAl stAtements coRpoRAte GoveRnAnce
Loans to Board members: RUAG and its subsidiaries have not
provided any securities, loans, advances or credits to the
members of the Board of Directors or Executive Board and
related parties, nor waived any amounts receivable.
Capital structure
The equity capital of RUAG Holding Ltd amounts to
CHF 340 million, comprising 340 000 fully paid-up regis-
tered shares, each with a par value of CHF 1000. As
at 31 December 2010, RUAG Holding Ltd did not have
any conditional or authorized capital, nor had it issued
parti cipation or dividend right certificates. The registered
shares of RUAG Holding Ltd are not listed.
Changes in capital
No changes in capital were decided upon in the last three
reporting periods.
Shares, share register
Each registered share entitles its bearer to one vote at the
AGM of RUAG Holding Ltd. The voting right may only
be exercised provided that the shareholder is recorded in
the RUAG Holding Ltd share register as a shareholder
with voting rights. The registered shares carry full entitlement
to dividends.
In place of shares, the Company may issue certificates. It may
also elect to issue neither shares nor certificates. In this case,
the shareholder is entitled at any time to demand issuance of
a statement of shares held.
The Board of Directors keeps a share register.
Shareholder structure
Shareholder
The Swiss Confederation holds 100% of shares and thus all
voting rights to RUAG Holding Ltd. The Federal Depart-
ment of Defence, Civil Protection and Sport (DDPS) exercises
the Confederation’s shareholder interests.
Owner’s strategy of the Federal Council
The 2007–2010 owner’s strategy of the Federal Council
establishes the transparent, binding framework that enables
RUAG Holding Ltd and its subsidiaries to fulfil their duties
profitably while taking account of overarching interests. The
owner’s strategy is enshrined in the Articles of Association
of RUAG Holding Ltd.
In its owner’s strategy, the Federal Council lays down strategic
objectives in the interest of Swiss national defence, its
expectations regarding cooperation and investments as well
as human resource policy and financial objectives.
RUAG AnnUAl RepoRt 2010 107
Cross-shareholdings
The RUAG Group has not entered into any cross-sharehold-
ings with other companies, either in terms of capital or votes.
Codetermination rights of shareholders
Voting right
At the AGM of RUAG Holding Ltd, each registered share
carries one vote. A shareholder may be represented by
another shareholder only by written proxy.
The AGM is convened and its agenda set as governed by law
and by the Articles of Association.
Qualified majorities
The following resolutions are subject to decision by qualified
majority in accordance with the Swiss Code of Obligations
(Art. 704):
• Changestothepurposeofthecompany
• Introductionofvotingshares
• Restrictionsonthetransferabilityofregisteredshares
• Approvedorconditionalcapitalincrease
• Capitalincreaseoutofequityinconsiderationofa
contribution in kind or for the purpose of acquisition in
kind and the granting of special benefits
• Restrictionorabolitionofsubscriptionrights
• Relocationofthecompany’sregisteredoffice
• Dissolutionofthecompanywithoutliquidation
Convening and setting agenda of AGM
The AGM is convened and its agenda set as governed by law
and by the Articles of Association.
Change in control and defensive measures
Obligation to make an offer
The Articles of Association contain no provisions concerning
opting-out and opting-up as specified in the Federal Act
on Stock Exchanges and Securities Trading (SESTA Art. 22).
Change of control clauses
Any disposal of the capital or voting majority of the Swiss
Confederation in RUAG Holding Ltd to third parties requires
the approval of Swiss parliament (by simple federal decree,
not subject to referendum, Art. 3 Para. 3, Federal Act on
State-Owned Defence Companies (BGRB)). In all other
respects, there are no specific clauses concerning a change of
control of RUAG Holding Ltd.
Employee benefits
The pension fund cover ratio as at 31 December 2010 was
103% (previous year: 101%). The fund’s financial situation
thus continued to stabilize in 2010. A suitable reserve is
being established with a view to ensuring financial stability
in the long term.
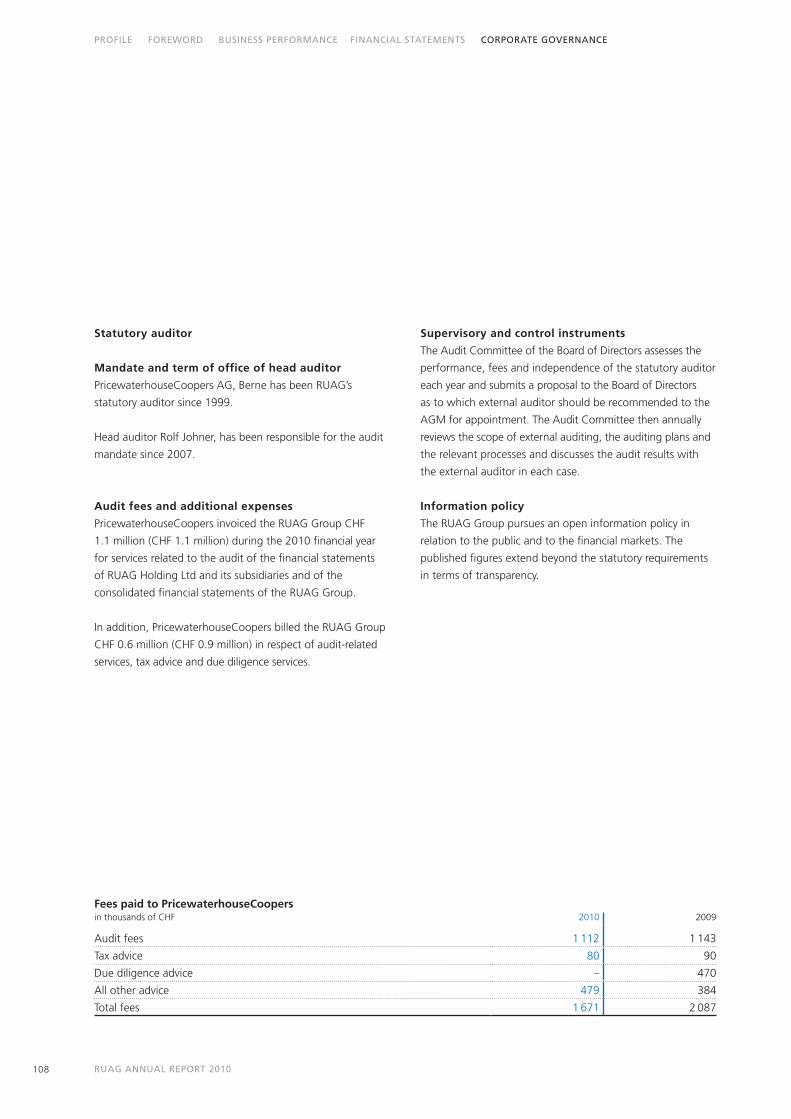
RUAG AnnUAl RepoRt 2010108
pRofile foRewoRd bUsiness peRfoRmAnce finAnciAl stAtements coRpoRAte GoveRnAnce
Fees paid to PricewaterhouseCoopersin thousands of CHF 2010 2009
Audit fees 1 112 1 143
Tax advice 80 90
Due diligence advice – 470
All other advice 479 384
Total fees 1 671 2 087
Statutory auditor
Mandate and term of office of head auditor
PricewaterhouseCoopers AG, Berne has been RUAG’s
statutory auditor since 1999.
Head auditor Rolf Johner, has been responsible for the audit
mandate since 2007.
Audit fees and additional expenses
PricewaterhouseCoopers invoiced the RUAG Group CHF
1.1 million (CHF 1.1 million) during the 2010 financial year
for services related to the audit of the financial statements
of RUAG Holding Ltd and its subsidiaries and of the
consolidated financial statements of the RUAG Group.
In addition, PricewaterhouseCoopers billed the RUAG Group
CHF 0.6 million (CHF 0.9 million) in respect of audit-related
services, tax advice and due diligence services.
Supervisory and control instruments
The Audit Committee of the Board of Directors assesses the
performance, fees and independence of the statutory auditor
each year and submits a proposal to the Board of Directors
as to which external auditor should be recommended to the
AGM for appointment. The Audit Committee then annually
reviews the scope of external auditing, the auditing plans and
the relevant processes and discusses the audit results with
the external auditor in each case.
Information policy
The RUAG Group pursues an open information policy in
relation to the public and to the financial markets. The
published figures extend beyond the statutory requirements
in terms of transparency.

RuAG AnnuAl REPoRt 2010 109
Forthcoming events
Annual results 31/12/2010
Annual Press Conference 31/03/2011
AGM 3/05/2011
The Annual Report containing the financial statements for
the year ended 31 December 2010 is sent to the shareholder
together with an invitation to the AGM.
RUAG Holding Ltd
Stauffacherstrasse 65 [email protected]
3000 Berne 22 www.ruag.com
Switzerland +41 31 376 64 50
Recommended