annual general meeting of shareholders 2013
Randstad Holding nv March 28, 2013
supervisory board executive board

annual general meeting of shareholders 2013 2
disclaimer & definitions
Certain statements in this document concern prognoses about the future financial condition, risks, investment plans and the results of operations of Randstad Holding and its operating companies as well as certain plans and objectives. Obviously, such prognoses involve risks and a degree of uncertainty since they concern future events and depend on circumstances that will apply then. Many factors may contribute to the actual results and developments differing from the prognoses made in this document. These factors include, but are not limited to, general economic conditions, a shortage on the job market, changes in the demand for (flexible) personnel, changes in legislation (particularly in relation to employment, staffing and tax laws), the role of industry regulators, future currency and interest fluctuations, our ability to identify relevant risks and mitigate their impact, the availability of credit on financially acceptable terms, the successful completion of company acquisitions and their subsequent integration, successful disposals of companies and the rate of technological developments. These prognoses therefore apply only on the date on which this document was compiled. Quarterly figures are unaudited.
--------------------------------------------------------------------------------------------------------------
EBITA: operating profit before amortization and impairment acquisition-related intangible assets and goodwill, integration costs and one-offs.
organic growth is measured excluding the impact of currency effects, acquisitions, disposals and reclassifications. When calculating growth, SFN Group is included on pro forma basis in 2011 and therefore not excluded as acquisition effect.
diluted EPS is measured before amortization and impairment acquisition-related intangible assets and goodwill, integration costs and one-offs.
March 28, 2013

March 28, 2013 annual general meeting of shareholders 2013 3
agenda
1. opening
2. review 2012
3. discharge of liability
4. shares
5. remuneration
6.- 7. other corporate affairs
8. any other business
9.closing

March 28, 2013 annual general meeting of shareholders 2013 4
agenda
1. opening
2. review 2012
3. discharge of liability
4. shares
5. remuneration
6.- 7. other corporate affairs
8. any other business
9.closing

March 28, 2013 annual general meeting of shareholders 2013 5
strategy and operational performance
Ben Noteboom CEO and chairman of the executive board

March 28, 2013 annual general meeting of shareholders 2013 6
divergent growth trends across regions: - growth in North America, Asia, Latin America, and Japan
- gradual decline in Europe
focus on key priorities: - profitability over market share:
- mainly visible in US, Poland, France, UK, and Belgium
- focus on costs:
- aligning overhead, head office and back-offices with field
- cost savings materialized across most European countries
- growth opportunities and improving business mix:
- focus on perm, professionals, and SME
- continued good growth in LATAM and Asia
- better mix due to strong growth in RPO and Payroll Services
quarterly cost level down € 30M (CC) since Q2 2012 - stemming from field steering, restructuring and other cost reductions
refinancing process almost completed
FY 2012: focus on key priorities

7
helping people to work
averages 2012 2011 2012 2011
North America 105,900 73,900 6,370 4,210
France 83,400 92,700 3,880 3,950
the Netherlands 85,400 88,300 4,730 5,180
Germany 50,600 56,000 2,770 2,970
Belgium/Lux. 42,300 46,500 2,020 2,120
United Kingdom 20,400 24,000 1,750 1,950
Iberia 45,000 49,700 1,350 1,470
Other Europe 36,300 39,200 1,780 1,800
Rest of world 112,400 106,500 4,480 4,880
Corporate 190 170
total 581,700 576,800 29,320 28,700
annual general meeting of shareholders 2013 March 28, 2013
staffing employees corporate employees
8
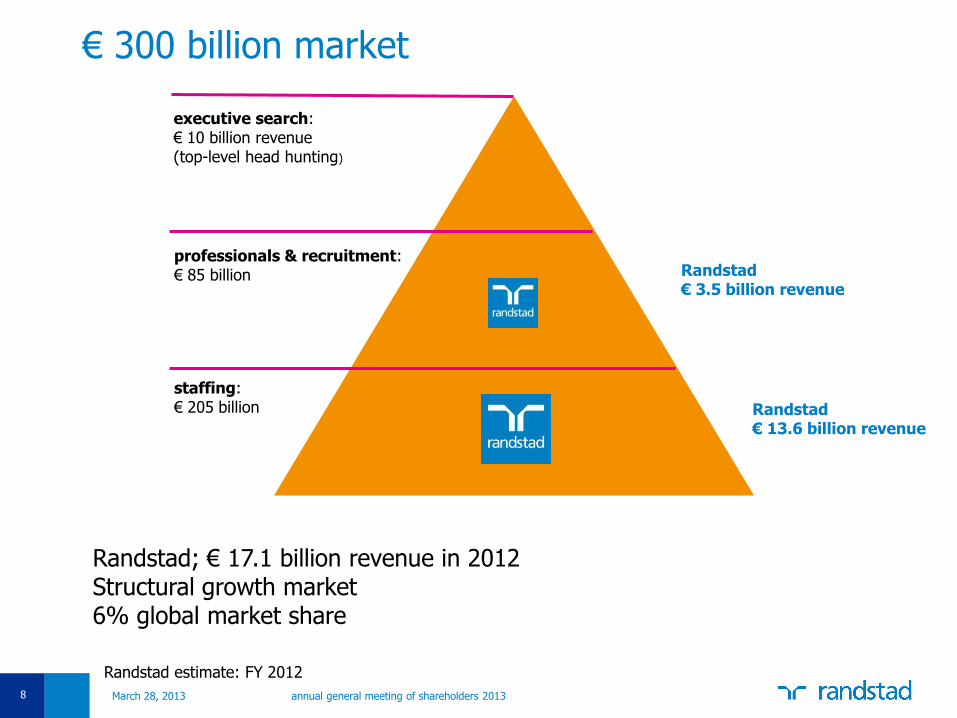
€ 300 billion market
executive search: € 10 billion revenue (top-level head hunting)
professionals & recruitment: € 85 billion
staffing: € 205 billion
Randstad estimate: FY 2012
Randstad; € 17.1 billion revenue in 2012 Structural growth market 6% global market share
Randstad € 3.5 billion revenue
Randstad € 13.6 billion revenue
annual general meeting of shareholders 2013 March 28, 2013

9 9
growth drivers & strategy: updated targets
annual general meeting of shareholders 2013 March 28, 2013

March 28, 2013 annual general meeting of shareholders 2013 10
focus on client profitability & diversification of portfolio HR Solutions now 9.0% of Group gross profit (7.6% in 2011)
ensuring the right delivery model - transfer from Staffing to Inhouse
focus on SME and specialties
increase share perm in Staffing and Professionals
capturing profitable growth in new HR services:
- RPO and MSP
- Outsourcing
- Outplacement
- Payroll services
- Inhouse for Professionals

11
divergent trends continued
annual general meeting of shareholders 2013 March 28, 2013
continued growth in Japan, slowdown in North America
stable rate of decline in Europe
organic growth per working day from -/-6% in October to -/-5% in January
-40%
-30%
-20%
-10%
0%
10%
20%
30%
Q1 2009
Q2 2009
Q3 2009
Q4 2009
Q1 2010
Q2 2010
Q3 2010
Q4 2010
Q1 2011
Q2 2011
Q3 2011
Q4 2011
Q1 2012
Q2 2012
Q3 2012
Q4 2012
Group Europe North America Rest of World
YoY Randstad growth development

12
growth trends in 2012
annual general meeting of shareholders 2013 March 28, 2013
€ million Q1 Q2 Q3 Q4 2012
North America 8 7 4 0 5
France (5) (3) (11) (14) (8)
Netherlands (2) (1) (3) (3) (2)
Germany 3 (2) (5) (9) (4)
Belgium/Lux. (6) (6) (7) (8) (7)
United Kingdom (9) (8) (9) (7) (9)
Iberia (8) (10) (12) (13) (11)
Other Europe (3) (6) (5) (1) (4)
Rest of world 7 6 7 5 6
total 0 (1) (4) (5) (2)
Staffing (4) (7) (9) (9) (7)
Inhouse 17 15 13 14 15
Professionals 5 (1) (3) (4) (1)
organic growth (in %)

Staffing in € M 2012 2011 % organic
revenue 10,566.0 10,550.2
EBITA 352.7 407.8
EBITA margin 3.3% 3.9%
-14
23
-15
-1
15
-7
13
segment performance
annual general meeting of shareholders 2013 March 28, 2013
Inhouse in € M 2012 2011 % organic
revenue 3,026.7 2,585.3
EBITA 130.3 104.1
EBITA margin 4.3% 4.0%
Professionals in € M 2012 2011 % organic
revenue 3,494.1 3,089.4
EBITA 127.8 133.7
EBITA margin 3.7% 4.3%
US, France & NL main drivers
focus on client profitability
improved performance
transfer of SFN business to inhouse (adjusted organic growth is +3%)
growth in North America, but slowdown towards the end of 2012
lower demand across Europe
decline in perm fees in Europe
continued investments in RoW
continued growth in North America, led by admin, perm and HRS
good growth in RoW
stable slowdown across Europe, mainly driven by industrial segments
strong profitability in HRS

14
revenue split FY 2012
annual general meeting of shareholders 2013 March 28, 2013
geographical area revenue categories
23%
18%
17%
11%
8%
5%
5%
5%
9%
North America
France
NL
Germany
Belgium
UK
Iberia
RoE
RoW
62% 18%
20%
staffing inhouse professionals

Q2 2012: € 648M
March 28, 2013 annual general meeting of shareholders 2013 15
field steering - supported by staff turnover > 20%
- optimizing distribution network
synergies SFN
implementation restructuring programs - overhead & head office
- back-offices
- branch consolidation
cost reduction initiatives
cost saving Q2 -> Q4 constant currencies
total restructuring/synergies field steering Others % field steering
Europe 31.1 8.2 20.2 2.7 65%
North America 4.6 2.0 3.4 (0.8) 74%
RoW (5.8) - (3.7) (2.1) N/A
Corporate 0.2 - - 0.2 N/A
Total 30.1 10.2 19.9 - 66%
Q3 2012: € 638M
Q4 2012: € 616M
FX: + € 8 M
FX: - € 10 M

16
EBITA breakdown by geography
annual general meeting of shareholders 2013 March 28, 2013
2012 2011
21%
12%
16%
16%
28%
20%
10%
0% 3%
4%
1%
28%
14%
25%
15%
9%
1% 3%
5%
1%
North America
France
NL
Germany
Belgium
UK
Iberia
RoE
RoW

March 28, 2013 annual general meeting of shareholders 2013 17
financial performance
Robert Jan van de Kraats CFO and vice-chairman of the executive board

18
income statement FY 2012 € million FY 2012 FY 2011 % Y-o-Y % organic
revenue 17,087 16,225 5% -/-3%
gross profit 3,102 2,957 5% -/-4%
gross margin 18.2% 18.2%
operating expenses* 2,539 2,357 8% -/-3%
opex as % of revenue 14.9% 14.5%
underlying EBITA 563 601 -/-6% -/-11%
underlying EBITA margin 3.3% 3.7%
one-offs -/- 99 -/- 48
reported EBITA 464 553
amortization & impairment -/- 336 -/- 303
net finance costs -/- 18 -/- 17
income before taxes 110 233
tax -/-73 -/-54
net income 37 179
adjusted net income** 366 400
underlying diluted EPS 2.11 2.32 -/-9%
* before amortization/impairment acquisition-related intangible assets and goodwill & one-offs
** attributable to holders of ordinary shares annual general meeting of shareholders 2013 March 28, 2013

19
FY 2012: financial key points
annual general meeting of shareholders 2013 March 28, 2013
gradual (organic) revenue decline throughout the year
productivity (GP/FTE) up 2% YoY (Q4: +5%)
strong recovery ratio in HY2 2012
underlying EBITA down 6%:
- strong cost control in HY2 2012
- focus on client profitability
- investments in Latin America and Asia
underlying diluted EPS down 9% to € 2.11 per ordinary share
moving average DSO from 54 days in Q4 2011 to 52 days in Q4 2012
leverage ratio at 1.7, within our targeted range, refinancing almost complete
proposed dividend of € 1.25 per ordinary share (2011: € 1.25), payout 59%

March 28, 2013 annual general meeting of shareholders 2013 20
operating expenses down
in Europe costs down € 32M
investing in profitable growth in NA/RoW
FTE reduction of 1,780 YoY
branch network rationalization
638 614
+11
-2 -5 -32 +4 +3
Q4 2011 FX disposals synergies SFN organic EU organic NA organic RoW organic corp. Q4 2012
YoY OPEX development in € M
616
616

21
net debt level reduced by € 200M
€ M December 31, 2012 December 31, 2011
trade and other receivables 2,871 3,109
less: trade and other payables -/- 2,343 -/- 2,478
operating working capital* 528 632
cash & cash equivalents 192 339
less: current borrowings -/- 83 -/- 39
less: ST part long-term borrowings -/- 1,205 -/- 1,603
net debt 1,096 1,303
free cash flow 467 435
DSO, days sales outstanding 52 54
leverage ratio 1.7 1.8
annual general meeting of shareholders 2013 March 28, 2013
* operating working capital is trade and other receivables minus current part financial fixed assets
minus trade and other payables
March 28, 2013 annual general meeting of shareholders 2013 22
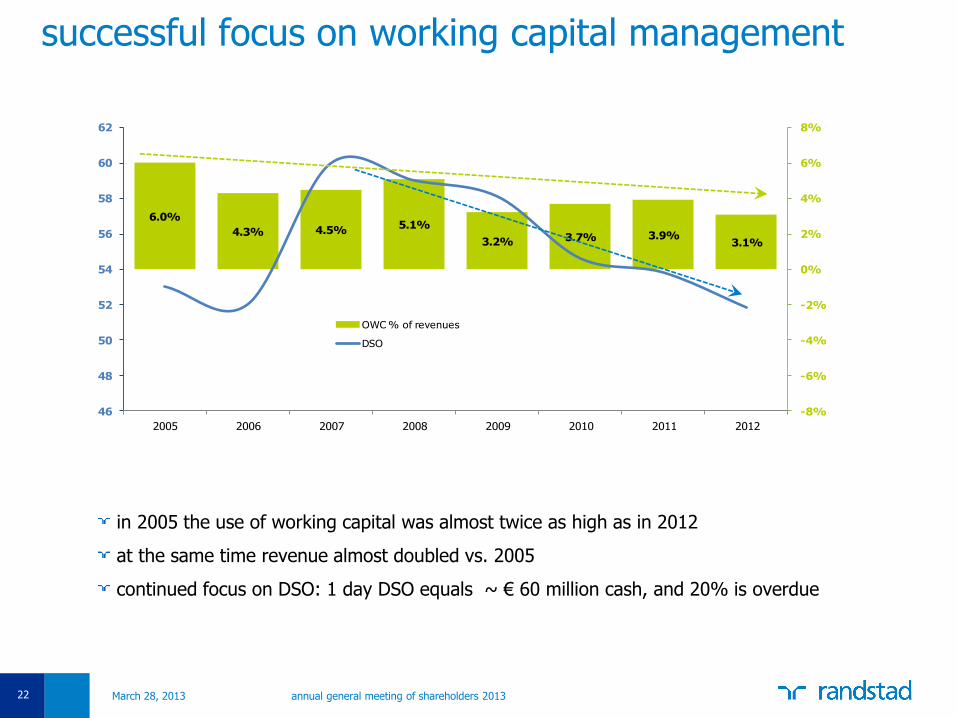
6.0%
4.3% 4.5%5.1%
3.2% 3.7% 3.9%3.1%
-8%
-6%
-4%
-2%
0%
2%
4%
6%
8%
46
48
50
52
54
56
58
60
62
2005 2006 2007 2008 2009 2010 2011 2012
OWC % of revenues
DSO
in 2005 the use of working capital was almost twice as high as in 2012
at the same time revenue almost doubled vs. 2005
continued focus on DSO: 1 day DSO equals ~ € 60 million cash, and 20% is overdue
successful focus on working capital management

our financing policy
March 28, 2013 annual general meeting of shareholders 2013 23
financing policy
Randstad aims at a sound financial position
- leverage ratio in between 0 and 2x EBITDA
- financing in place for expected long-term needs
- using our balance sheet to finance organic growth and acquisitions
committed financing syndicated credit facility has been in place since 2008
- currently around € 1.6 billion to mature in May 2013
- fully floating interest rates as natural hedge
- max leverage ratio of 3.5x EBITDA in July ‘11 we secured a forward start syndicated credit facility of € 1.3 billion as per today, refinancing up to € 1.8 billion almost completed

March 28, 2013 annual general meeting of shareholders 2013 24
new financing size status
uncommitted credit lines
~ € 300M available
standby facilities receivables
€ 275M available
forward-start syndicated credit
facility
€ 1,420M
available
Japanese syndicated credit
facility ~ € 70M available
other credit facilities ~ € 200M in progress
medium term note program
available
preference shares € 140M available indefinite
medium-term
medium-term
long-term
< 5 years
< 10 years
indefinite
refinancing process almost completed

dividend policy

our dividend policy
history
annual general meeting of shareholders 2013 26 March 28, 2013
dividend policy until 2006: 40% of net income (basic EPS)
dividend policy since 2007: € 1.25 per ordinary share
- payout ratio between 30% and 60% of adjusted EPS (amortization, etc)
- financial position must allow for it
dividend policy was designed to:
- provide clarity and stability to all shareholders (“creating a floor”)
- built on our strategy -> 5-6% EBITA margin with a floor of 4%
- designed in a period of net cash and buyback program discussion
divergent trends in our business resulted in limited profitability improvements and lower free cash flow than anticipated

March 28, 2013 annual general meeting of shareholders 2013 27
dividend policy 2012 1
objective
• aiming at consistent dividend growth through the cycle
• aiming at a floor in the dividend of € 1.25 per ordinary share
• if earnings capacity and the financing policy allow for it
pay-out
• flexible payout ratio
• indicative range: minimum payout 30% - maximum payout 60%
• dividend > € 1.25 if payout of 30% implies a higher amount
• dividend < € 1.25 if payout of 60% implies a lower amount
dividend 2012
• leverage ratio supports payment of dividend over 2012
• payout ratio is 59% of adjusted net profit
• we propose to pay € 1.25 per ordinary share
• choice between cash and shares, default is cash

change in our dividend policy
dividend policy maintained for 2012:
- € 1.25 per ordinary share, unless payout exceeds 60% of adjusted EPS
- optional dividend
proposed dividend policy as of 2013:
- change strategic targets
- payout of 40-50% of adjusted EPS
- optional dividend:
- leverage ratio < 2.0x: optional dividend
- leverage ratio < 2.5x: optional dividend with premium on stock dividend
- leverage ratio > 2.5x: stock dividend
anti-dilution measures when financial position allows for it
- performance share plans
- optional dividend
annual general meeting of shareholders 2013 28 March 28, 2013

anti-dilution measures – performance share plans purchasing shares to offset dilution
March 28, 2013 annual general meeting of shareholders 2013 29
performance share plans available for senior management
executive board has authorization to issue shares up to 3% of issued ordinary share capital
dilution of existing shareholders
anti-dilution clause on preference shares
events in 2013
at EGM January 2013, executive board authorized to repurchase shares up to 3% of issued authorized share capital (purpose: performance share plans)
on February 14, 2013, Randstad issued 295,560 shares, which were repurchased already
intention to purchase shares in 2013 to cover allocation in February 2014
criteria for repurchasing shares for performance share plans
intention to buy back shares if size of issue is < € 25M
if size exceeds € 25M, leverage ratio will be indicative for decision to buy back
leverage ratio should remain between 0 and 2

anti-dilution measures – stock dividend repurchasing shares to offset dilution
March 28, 2013 annual general meeting of shareholders 2013 30
stock dividend will lead to dilution for shareholders
intention to repurchase shares over time to offset dilution when financial position allows it
financial position: a leverage ratio in between 0 and 2
proposal to extent authority for executive board to purchase shares up to 10% of the issued share capital of ordinary shares to cover dilution from stock dividend, performance share plans and option plans
mandate applicable for a period of 18 months (until September 28, 2014)
purchase of shares for the purpose of performance share plans and option plans will continue based on set criteria
intention to repurchase shares to offset dilution from stock dividend over time

sustainability

March 28, 2013 annual general meeting of shareholders 2013 32
sustainability at the core of our business
since 1960 Randstad has been playing a key role in society:
finding suitable jobs for our candidates and providing flexibility and agility to our clients
assisting candidates to find a job who didn’t have one before
temporary work serves as a stepping stone to permanent jobs (1/3 via temp agencies in NL*)
over 95% of our total cost base consists of people-related expenses
continuous focus on increasing candidate, employee and client engagement:
career advancement and training
high health, safety and security standards
satisfaction surveys
our ambition is to ‘shape the world of work’:
contributing to labor participation and social inclusion
offering flexible employment solutions to address the growing challenges in the world:
- structural skills shortages
- declining population growth
- aging workforce
influencing deregulation in our markets
1
* source: Ciett economic report 2011

our sustainability framework integral part of our strategy
March 28, 2013 annual general meeting of shareholders 2013 33
1

our sustainability framework integral part of our strategy
March 28, 2013 annual general meeting of shareholders 2013 34
framework reflects our ambition and approach going forward
progress 2012:
- first year of sustainability reporting through the financial system
- more data available to report on KPIs, examples:
- number of candidate matches
- internal management appointments per geography
- employee engagement scores
- reporting on understanding of business principles
focus on:
- reliability of data, alignment on definitions and review of KPIs
- implementation, alignment and improvement of initiatives
- gradual approach
2

questions VEB & Eumedion
March 28, 2013 annual general meeting of shareholders 2013 35
impact new pension regulations (IAS 19):
- limited number of defined benefit plans across the Group
- impact not material
impairment testing goodwill:
- goodwill allocation based on reporting segments (geographies)
- revenue and profit development not in line with projections
- full disclosure in financial statements
disclosure dividend policy
boilerplate language in the annual report and accounts
supervisory board reporting
2

36
Q & A
annual general meeting of shareholders 2013 March 28, 2013

March 28, 2013 annual general meeting of shareholders 2013 37
2. review 2012
2b. proposal to adopt the financial statements

March 28, 2013 annual general meeting of shareholders 2013 38
2d. proposal to determine the dividend over the financial year 2012
Dividend on ordinary shares: € 1.25 per share • optional cash dividend or stock dividend
Preference shares B: € 0.271 per share
2. review 2012

process in 2013
March 28, 2013: approval shareholders in AGM 2013 April 3, 2013: ex-dividend date April 5, 2013: record date Election period runs from April 8 up to and including April 19, 2013 April 19, 2013: determination stock dividend conversion rate - on the basis of the volume weighted average share price of Randstad in the period
April 15 up to and including April 19, 2013
- value of stock dividend will be around the same as the value of the cash dividend
April 24, 2013: payment of cash dividend and delivery of shares
annual general meeting of shareholders 2013 39 March 28, 2013

March 28, 2013 annual general meeting of shareholders 2013 40
2d. proposal to determine the dividend over the financial year 2012
Dividend on ordinary shares: € 1.25 per share • optional cash dividend or stock dividend
Preference shares B: € 0.271 per share
2. review 2012

March 28, 2013 annual general meeting of shareholders 2013 41
agenda
1. opening
2. review 2012
3. discharge of liability
4. shares
5. remuneration
6.- 7. other corporate affairs
8. any other business
9.closing

March 28, 2013 annual general meeting of shareholders 2013 42
3. discharge of liability
3a. discharge of liability of the members of the executive board for the management

March 28, 2013 annual general meeting of shareholders 2013 43
3. discharge of liability
3b. discharge of liability of the members of the supervisory board for the supervision of the management

March 28, 2013 annual general meeting of shareholders 2013 44
agenda
1. opening
2. review 2012
3. discharge of liability
4. shares
5. remuneration
6.- 7. other corporate affairs
8. any other business
9.closing
March 28, 2013 annual general meeting of shareholders 2013 45
4. shares
4a. proposal to extend the authority of the executive board to issue shares
• valid for a period of 18 months (September, 2014)
• approval by the supervisory board
• yearly allocation of performance shares and options not more than 1%
• yearly maximum authorization of 3% of the issued capital (ordinary shares)
• on average over last 5 years: 0.3% issued shares

March 28, 2013 annual general meeting of shareholders 2013 46
4. shares
4b. proposal to extend the authority of the executive board to restrict or exclude the pre-emptive right to any issue of shares
• valid for a period of 18 months (September, 2014)
• approval by the supervisory board
• yearly maximum authorization of 3% of the issued capital (ordinary shares)

March 28, 2013 annual general meeting of shareholders 2013 47
4. shares
4c. proposal to extend the authority of the executive board to repurchase ordinary shares

anti-dilution measures – performance share plans purchasing shares to offset dilution
March 28, 2013 annual general meeting of shareholders 2013 48
performance share plans available for senior management
executive board has authorization to issue shares up to 3% of issued ordinary share capital
dilution of existing shareholders
anti-dilution clause on preference shares
events in 2013
at EGM January 2013, executive board authorized to repurchase shares up to 3% of issued authorized share capital (purpose: performance share plans)
on February 14, 2013, Randstad issued 295,560 shares, which were repurchased already
intention to purchase shares in 2013 to cover allocation in February 2014
criteria for repurchasing shares for performance share plans
intention to buy back shares if size of issue is < € 25M
if size exceeds € 25M, leverage ratio will be indicative for decision to buy back
leverage ratio should remain between 0 and 2

anti-dilution measures – stock dividend repurchasing shares to offset dilution
March 28, 2013 annual general meeting of shareholders 2013 49
stock dividend will lead to dilution for shareholders
intention to repurchase shares over time to offset dilution when financial position allows it
financial position: a leverage ratio in between 0 and 2
repurchase shares to offset dilution from stock dividend to be assessed in connection to other investment decisions to support organic growth and acquisitions
proposal to extent authority for executive board to purchase shares up to 10% of the issued share capital of ordinary shares to cover dilution from stock dividend, performance share plans and option plans
mandate applicable for a period of 18 months (until September 28, 2014)
purchase of shares for the purpose of performance share plans and option plans will continue based on set criteria
intention to repurchase shares to offset dilution from stock dividend over time

March 28, 2013 annual general meeting of shareholders 2013 50
4. shares
4c. proposal to extend the authority of the executive board to repurchase ordinary shares

March 28, 2013 annual general meeting of shareholders 2013 51
agenda
1. opening
2. review 2012
3. discharge of liability
4. shares
5. remuneration
6.- 7. other corporate affairs
8. any other business
9.closing

March 28, 2013 annual general meeting of shareholders 2013 52
5. remuneration
5a. proposal to amend the remuneration policy of the executive board

March 28, 2013
remuneration executive board
remuneration policy approved by AGM in 2007
no changes despite different profile & increased size of Randstad
base salaries increased moderately in line with peer group
full remuneration review in 2012
proposal is update, no revolutionary changes or extensions
53 annual general meeting of shareholders 2013

March 28, 2013
remuneration proposal executive board
international labor market peer group: include Hays, TUI, G4S and Sodexo
base salaries, including annual bonus, level at between median and 75% of international labor market peer group
include AEX sanity check
discontinue performance options (performance shares only)
amend the payout range for performance share plans
TSR payout range
current proposed
Position 1 250% 250%
Position 2 200% 200%
Position 3 150% 150%
Position 4 125% 100%
Position 5 100% 50%
Position 6 75% 0%
Position 7 50% 0%
Position 8 25% 0%
Position 9 0% 0%
Position 10 0% 0%
54 annual general meeting of shareholders 2013

March 28, 2013
remuneration proposal executive board
LTI at target allocation: from 80% to 100% of base salary
Annual cash bonus targets:
current: at target 70%, max 100% of base salary
- revenue or market share (12.5% threshold, 27.5% on target, 40% max) - EBITA/EPS (12.5% threshold, 27.5% on target, 40% max) - individual targets (10% max) - discretion supervisory board (10% max)
new: - revenue, gross profit, market share (10% threshold, 15% on target, 25% max) - EBITA/EPS (10% threshold, 15% on target, 25% max) - leverage ratio/working capital efficiency (10% threshold, 15% on target, 25% max) - individual targets (15% max) - discretion supervisory board (10% max)
Severance: one year annual base salary
55 annual general meeting of shareholders 2013

March 28, 2013 annual general meeting of shareholders 2013 56
5. remuneration
5a. proposal to amend the remuneration policy of the executive board

March 28, 2013 annual general meeting of shareholders 2013 57
5. remuneration
5b. proposal to approve the performance related remuneration of the executive board in performance shares

March 28, 2013 annual general meeting of shareholders 2013 58
agenda
1. opening
2. review 2012
3. discharge of liability
4. shares
5. remuneration
6.- 7. other corporate affairs
8. any other business
9.closing

March 28, 2013 annual general meeting of shareholders 2013 59
other corporate affairs
6. proposal to reappoint Mr. Risseeuw as director A of Stichting Administratiekantoor Preferente aandelen Randstad Holding
Dutch nationality, born in 1936
first appointment in 1999
appointment for 2 years

March 28, 2013 annual general meeting of shareholders 2013 60
other corporate affairs
7. proposal to reappoint PricewaterhouseCoopers as external auditor for the financial year 2014
AGM 2012 appointed PwC for financial year 2013

March 28, 2013 annual general meeting of shareholders 2013 61
agenda
1. opening
2. review 2012
3. discharge of liability
4. shares
5. remuneration
6.- 7. other corporate affairs
8. any other business
9.closing

March 28, 2013 annual general meeting of shareholders 2013 62
agenda
1. opening
2. review 2012
3. discharge of liability
4. shares
5. remuneration
6.- 7. other corporate affairs
8. any other business
9. closing
Recommended