Annotation and Analysis of Microarray Data
A primer for NERC researchers
Environmental Genomics Thematic ProgrammeData Centre
http://envgen.nox.ac.uk

Data and the NERC
Environmental Genomics Thematic ProgrammeData Centre
http://envgen.nox.ac.uk
• Data is an asset
• Data may have unforeseen uses
• Analysis loses information
• Bulk analysis and data mining needs “uniform” data
• Data stored without adequate annotation is useless
• Data rescue is expensive and unreliable

Metadata and Microarrays
• Sequence data is static• Post-genome is very state-dependant
– Transcriptome = no. of cell types * no. of environmental conditions
– Annotation matters
– Data comparisons matter
• We need to take lessons from the gene debacle– Protein-tyrosine phosphatase, non-receptor type 6, Protein-tyrosine
phosphatase 1C, PTP-1C, Hematopoietic cell protein-tyrosine phosphatase, SH-PTP1, Protein-tyrosine phosphatase SHP-1
– LARD, death receptor 3 beta, WSL-1R protein, lymphocyte associated receptor of death, death receptor 3
Environmental Genomics Thematic ProgrammeData Centre
http://envgen.nox.ac.uk

Metadata standards and data repositories
•Repository needs to keep all relevant metadata associated with a data set
•To be easily submitted, and to be searchable, data must adhere to standards, both in content and format
Thus, have to decide:•What should be captured and how?•What format should data be in for submission?
Environmental Genomics Thematic ProgrammeData Centre
http://envgen.nox.ac.uk

What is MIAME?
• MIAME is the internationally adopted standard for the Minimal Information About a Microarray Experiment.
• The result of a MGED (www.mged.org) driven effort to codify the description of a microarray experiment.
• MIAME aims to define the core that is common to most experiments.
• Ultimately, it tries to specify the collection of information that would be needed to allow somebody to completely reproduce an experiment that was performed elsewhere.
Environmental Genomics Thematic ProgrammeData Centre
http://envgen.nox.ac.uk

The Six Parts of MIAME1. Experimental design: the set of hybridization
experiments as a whole
2. Array design: each array used and each element (spot, feature) on the array
3. Samples: samples used, extract preparation and labeling
4. Hybridizations: procedures and parameters
5. Measurements: images, quantification and specifications
6. Normalization controls: types, values and specifications
Environmental Genomics Thematic ProgrammeData Centre
http://envgen.nox.ac.uk

MIAME definitions
• Available from www.mged.org• All details mentioned in MIAME should be
captured • Latest draft: Version 1.1 (Draft 5, March 5, 2002)• See also: A. Brazma, et al., Nature Genetics, vol
29 (December 2001), pp 365 - 371
Environmental Genomics Thematic ProgrammeData Centre
http://envgen.nox.ac.uk

Environmental Genomics Thematic ProgrammeData Centre
http://envgen.nox.ac.uk
But…• Environmental genomics is a diverse,
heterogeneous discipline, often involving multi-factorial experiments that can have an almost infinite number of experimental parameters.
• Describing this sort of data is hard.
• MIAME does not have the required vocabulary.
• However, NERC has made a commitment to making MIAME compliance a de-facto standard within its Science Programmes.
• NERC has invested in reconciling these…

MIAME/Env
• MIAME/Env is an initiative spearheaded by the EGTDC to extend MIAME standards for annotation of environmental genomic data
• Includes the development of controlled vocabularies / ontologies to describe environmental genomic experiments.
• MIAME/Env developed with the support of MGED society and in collaboration with MIAME/Tox and members of the EBI.
Environmental Genomics Thematic Programme
Data Centrehttp://envgen.nox.ac.uk
Microarray Annotation for Environmental Researchers
• use the Standard – MIAME/Env model is developed in communication
with EG funded researchers to ensure that environmental genomics experiments and data can be adequately described to MIAME standards
• use the Software – maxdLoad2 is software developed by EGTDC
partners facilitating • MIAME/Env annotation• Export in an appropriate format for submission to
ArrayExpress
Environmental Genomics Thematic ProgrammeData Centre
http://envgen.nox.ac.uk
Do I have to?
Simple Answer:
YES!!!More specifically:• You need to adhere to metadata standards to submit to a public
repository• You need to submit to a public repository (e.g. ArrayExpress) to get
an accession number for your data• You need to have an accession number for your data in order to
publish on it in major journals
The final word:• NERC requires grant holders to comply with MIAME standards
for microarray data
Environmental Genomics Thematic ProgrammeData Centre
http://envgen.nox.ac.uk
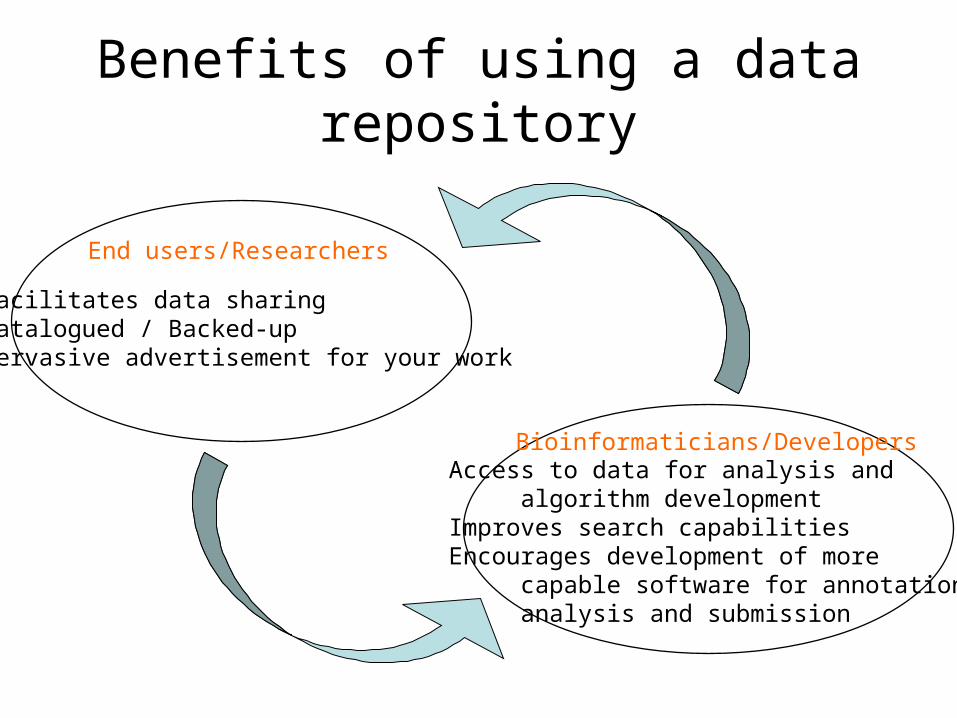
Benefits of using a data repository
Facilitates data sharingCatalogued / Backed-upPervasive advertisement for your work
End users/Researchers
Access to data for analysis and algorithm developmentImproves search capabilitiesEncourages development of more capable software for annotation, analysis and submission
Bioinformaticians/Developers

Bio-LinuxThe EGTDC distribution system for bioinformatics solutions
• Key bioinformatics software and documentation in a Linux environment
• Aim: to maximise the benefits of a pre-installed analysis system.
• provision of key software• tools for automation of analysis and other
customisations• computing power• ensure that what is provided can be reasonably
maintained and supported
Environmental Genomics Thematic ProgrammeData Centre
http://envgen.nox.ac.uk

Software on Bio-Linux
Includes programs for:
• Sequence analysis • Similarity searching• Sequence alignment• Phylogenetics• Genome annotation and analysis• Est’s• Transcriptomics
Environmental Genomics Thematic ProgrammeData Centre
http://envgen.nox.ac.uk

Bio-Linux
Transcriptomics DatabasesmaxdLoad2GeNet access
Transcriptomics AnalysismaxdViewGeneSpringR/BioConductor
MIAME/Env annotation and MAGE/ML exportmaxdLoad2
Environmental Genomics Thematic ProgrammeData Centre
http://envgen.nox.ac.uk
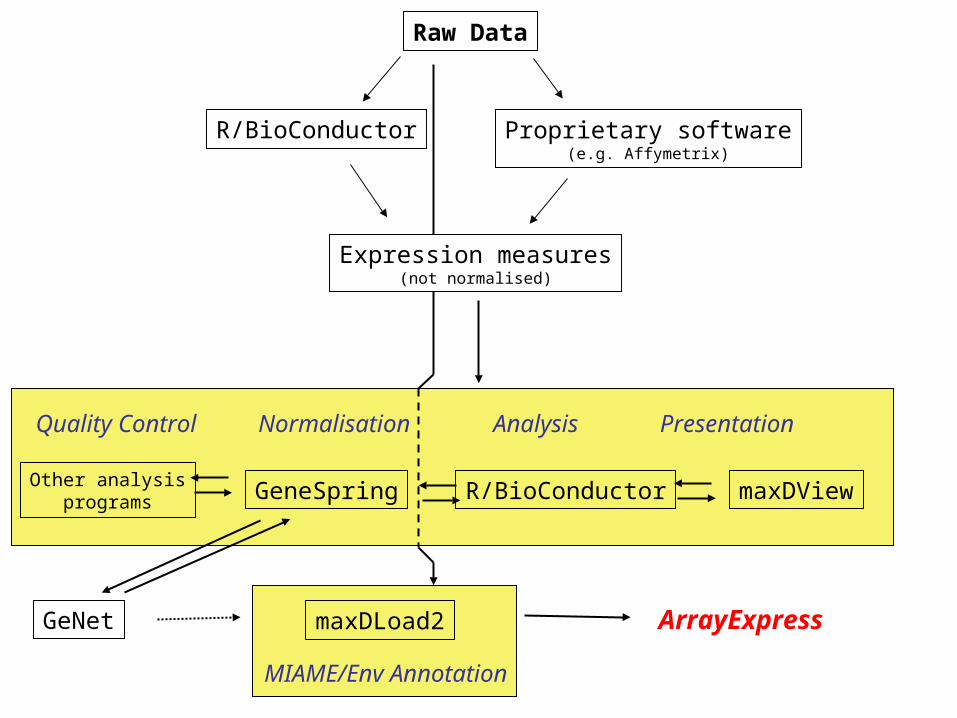
GeNet maxDLoad2
R/BioConductor
ArrayExpress
Raw Data
Expression measures(not normalised)
Proprietary software(e.g. Affymetrix)
GeneSpring maxDViewR/BioConductor
Quality Control Normalisation Analysis Presentation
Other analysisprograms
MIAME/Env Annotation

GeNet
R/BioConductor
ArrayExpress
Raw Data
Expression measures(not normalised)
Proprietary software(e.g. Affymetrix)
GeneSpring maxDViewR/BioConductorOther analysisprograms
Bio-LinuxmaxDLoad2
MIAME/Env Annotation
Quality Control Normalisation Analysis Presentation
Transcriptomics Databases
Tools on Bio-Linux
maxdLoad2
GeNet access
Environmental Genomics Thematic ProgrammeData Centre
http://envgen.nox.ac.uk

maxdLoad2
Navigator
Top level user interface

GeNet
Via Web Interface
Via GeneSpring
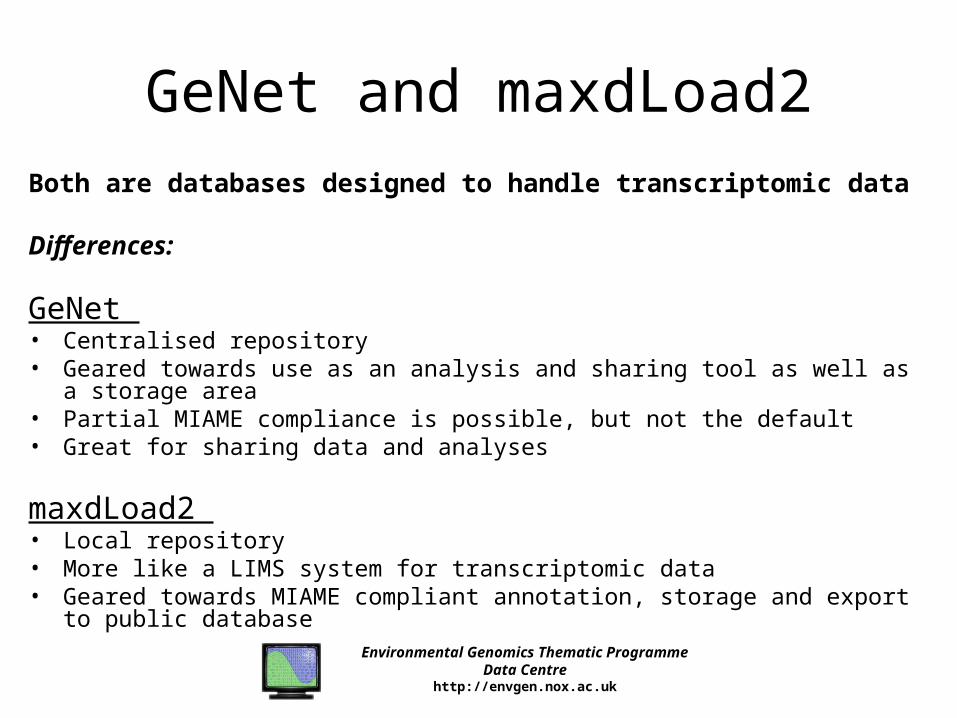
GeNet and maxdLoad2Both are databases designed to handle transcriptomic data
Differences:
GeNet • Centralised repository• Geared towards use as an analysis and sharing tool as well as a storage area• Partial MIAME compliance is possible, but not the default• Great for sharing data and analyses
maxdLoad2 • Local repository• More like a LIMS system for transcriptomic data• Geared towards MIAME compliant annotation, storage and export to public
database
Environmental Genomics Thematic ProgrammeData Centre
http://envgen.nox.ac.uk

Transcriptomic Analysis
Tools on Bio-Linux
maxdView
GeneSpring
R/BioConductor
Environmental Genomics Thematic ProgrammeData Centre
http://envgen.nox.ac.uk

Which software should I use??
Commercial vs. Open SourceGeneSpring maxdView R/BioConductor
Ease of UseGeneSpring > maxdView > R/BioConductor
Fine tuned controlR/BioConductor > maxdView > GeneSpring
Environmental Genomics Thematic ProgrammeData Centre
http://envgen.nox.ac.uk

Why use just one??
E.g.Fine Tuned Control R/BioConductorEase of Use +GeneSpring
Pre-analysis Choices R/BioConductorEasy but fine tuned manipulation +maxdView
Alternatively:maxdView + GeneSpringAll of them…
Environmental Genomics Thematic ProgrammeData Centre
http://envgen.nox.ac.uk

GeneSpring
Benefits:• Graphical interface• Choices of views • Venn diagram
visualisations• Intuitive interface for
filtering• Extensive documentation• Context dependent help

maxdView
Benefits:• Graphical interface• Quality control options• Many analyses possible
via menus or “calculator”• Strong filtering
capabilities• Context dependent help

R/BioConductor
Command line packageBenefits:• flexible• many, many functions to choose
from • take advantage of the full
functionality of the R stats package• high degree of control• great plotting facilities• promotes thinking about data• lots of documentation and help
available• automation possibilities• some graphical facilities available
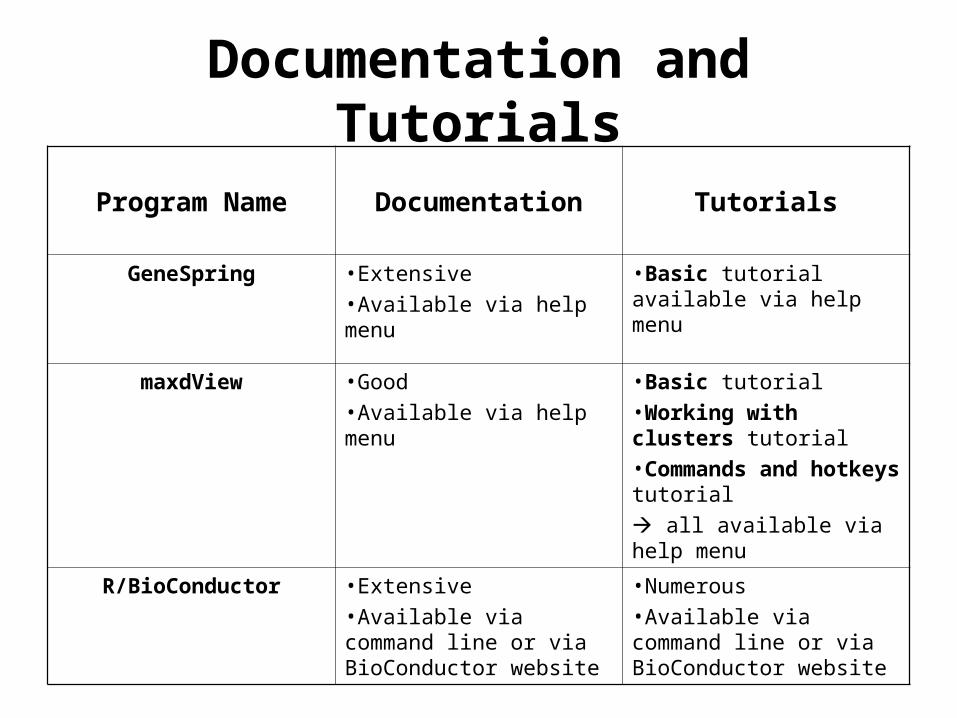
Documentation and Tutorials
Program Name Documentation Tutorials
GeneSpring •Extensive•Available via help menu
•Basic tutorial available via help menu
maxdView •Good•Available via help menu
•Basic tutorial•Working with clusters tutorial•Commands and hotkeys tutorial
all available via help menu
R/BioConductor •Extensive•Available via command line or via BioConductor website
•Numerous•Available via command line or via BioConductor website

Overview of Microarray Analysis Steps
Load Data
Apply Filters
Normalise
Analyse
QualityControl
Step 1
Text, GPR file,etc…
Step 2
Step 3
Step 4
Step 5

Raw Data
Expression measures(not normalised)
•The raw microarray data scanned from images needs to be translated into some measurement of expression.
•The measurement used depends on the technology – e.g. relative measures (cDNA chips), or absolute measures (e.g. GeneChip).
•The measurements calculated depend on the algorithm used (e.g. MAS 5.0 vs. RMA for GeneChips).
•Background correction happens at this point
tran
slat
ion into
Environmental Genomics Thematic ProgrammeData Centre
http://envgen.nox.ac.uk
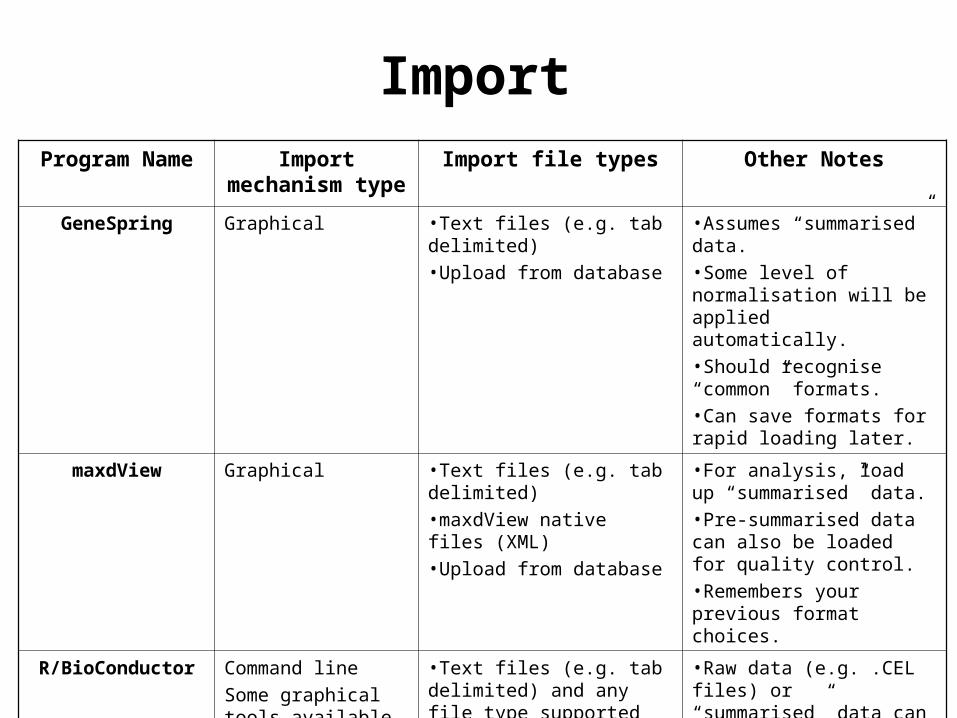
ImportProgram Name Import
mechanism typeImport file types Other Notes
GeneSpring Graphical •Text files (e.g. tab delimited) •Upload from database
•Assumes “summarised” data. •Some level of normalisation will be applied automatically.•Should recognise “common” formats.•Can save formats for rapid loading later.
maxdView Graphical •Text files (e.g. tab delimited)•maxdView native files (XML)•Upload from database
•For analysis, load up “summarised” data.•Pre-summarised data can also be loaded for quality control.•Remembers your previous format choices.
R/BioConductor Command line
Some graphical tools available
•Text files (e.g. tab delimited) and any file type supported by R
•Raw data (e.g. .CEL files) or “summarised” data can be loaded.

ExportProgram Name Export
mechanism typeExport options Other Notes
GeneSpring Menu •Upload to database•Use External Programming Interface to transfer to another program (e.g. R)•Graphical files (e.g. plots)
•Difficult to retrieve pre-normalised data from GeneSpring.
maxdView Menu •Text files (e.g. tab delimited)•maxdView native files (XML)•Download to database•Graphical files (e.g. plots)
•Can choose the columns of data to save.•Text files and database data includes your data only.•maxdView native files include information about all the viewing options, etc., you had set when you saved the file.
R/BioConductor Command line •Text files (e.g. tab delimited) •Graphical files (e.g. plots)

Quality ControlVery Important!
Generating high quality microarray data requires vigorous quality control measures at each individual step of the process:
• experimental design of the study• the generation of samples• extraction of RNA• labeling of the probe• microarray hybridization• analysis
Systematic, reproducible errors can be minimized by applying various normalisations…BUT:
You should not try to rescue low quality hybridizations with mathematical techniques!
Environmental Genomics Thematic ProgrammeData Centre
http://envgen.nox.ac.uk

Quality Control
Do the arrays look alright?Look at the actual image scans – are there quality issues to
be addressed on any of the chips?
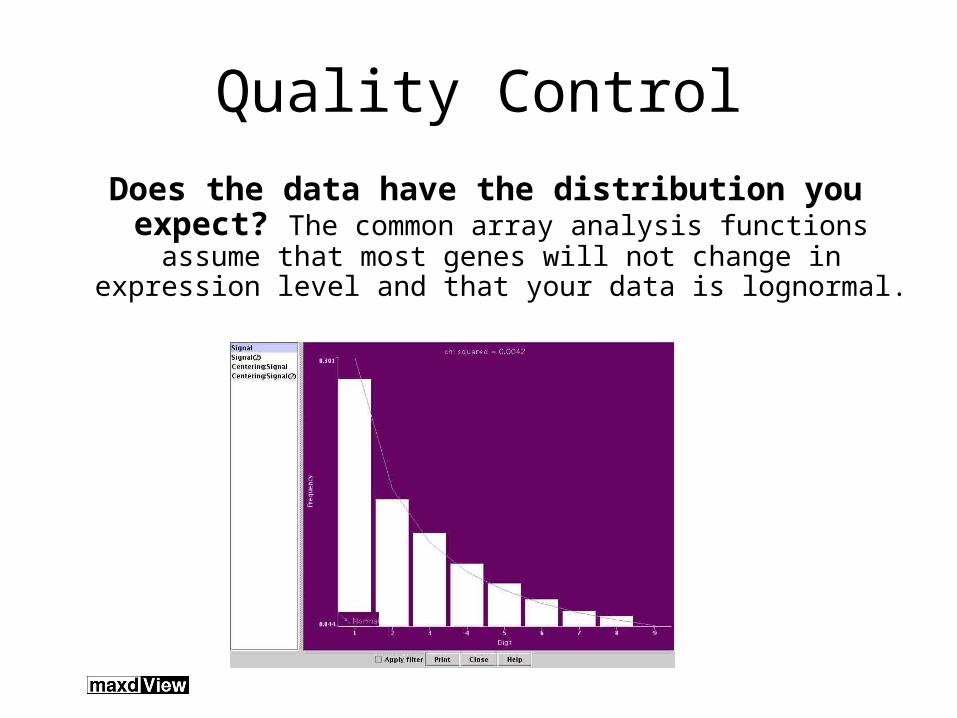
Quality Control
Does the data have the distribution you expect? The common array analysis functions assume that most genes will not change in expression level and that your
data is lognormal.
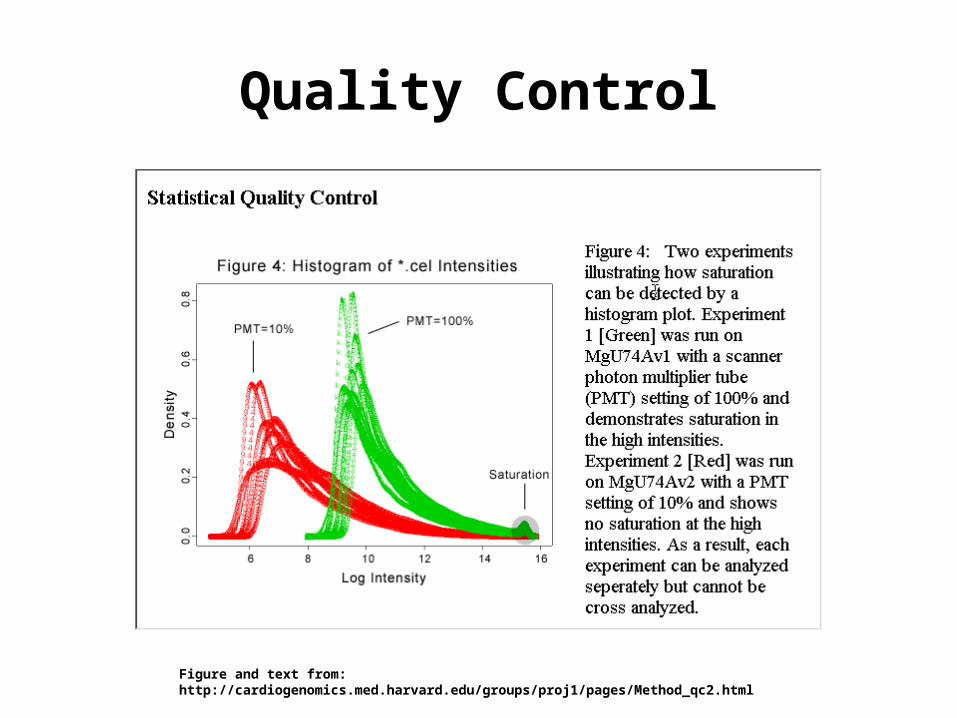
Quality Control
Figure and text from: http://cardiogenomics.med.harvard.edu/groups/proj1/pages/Method_qc2.html

Quality ControlProgram Name Functions
AvailableExamples Other Notes
GeneSpring Few •Can filter out spots with particular features (e.g. very high or very low intensity) before further manipulation.
•Ideally, more extensive quality control should take place before uploading data into GeneSpring.
maxdView Some •Benford Analyser•Distograms of data•Easy methods to generate means, std. dev’s, etc, and filter on these•Flexible filtering system
•Good levels of quality control can be achieved using maxdView•requires good knowledge of the application to get full benefit
R/BioConductor Extensive •Many quality control functions for different types of data
•Many, many options•Highly recommended•Not user friendly at first!
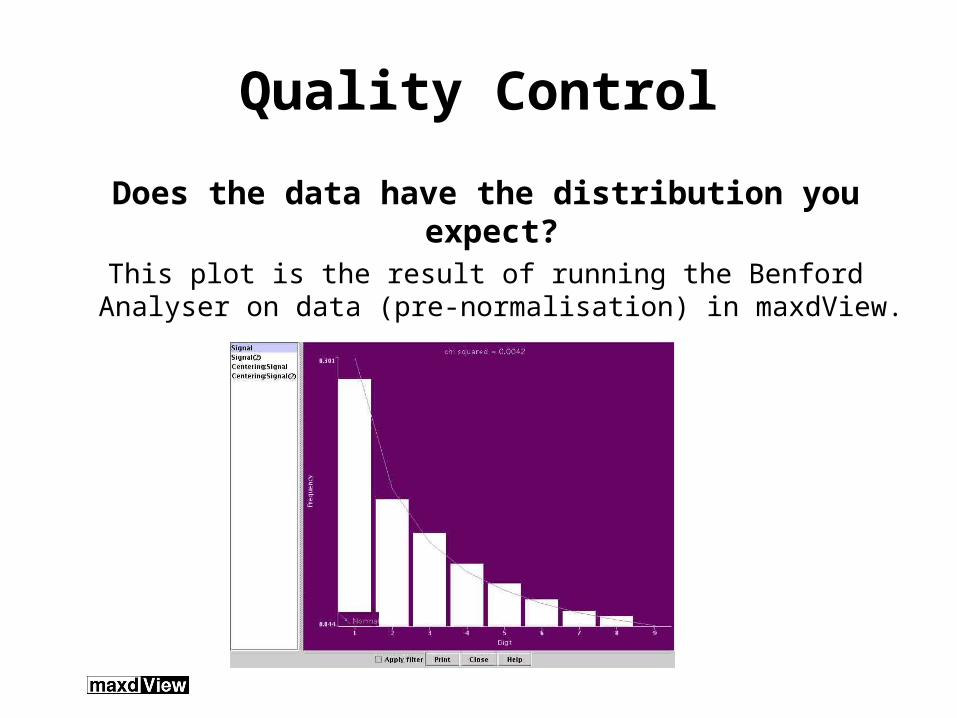
Quality Control
Does the data have the distribution you expect? This plot is the result of running the Benford Analyser on
data (pre-normalisation) in maxdView.

Fit your data and take a look at the reconstructed image surface using R/BioConductor:
>library(affyPLM)
>pset fitPLM(myData)
>image(pset)
Quality Control
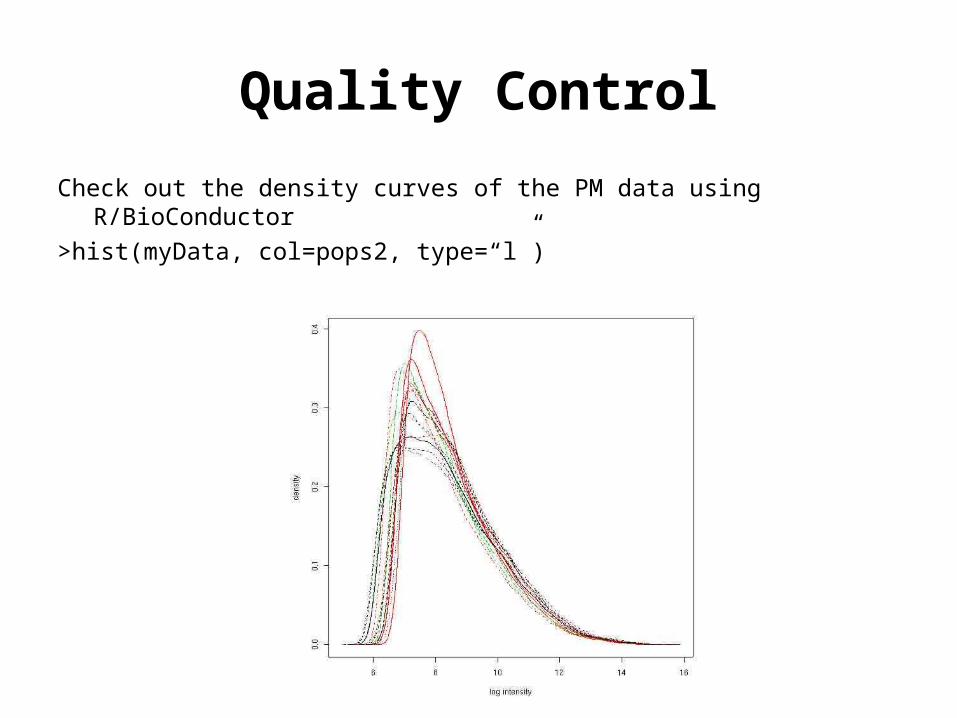
Quality Control
Check out the density curves of the PM data using R/BioConductor
>hist(myData, col=pops2, type=“l”)

Normalisation
Program Name Available
GeneSpring •Graphical menu system•Hints about effects of normalisations given in window
maxdView •Graphical menu system•Hints about effects of normalisations given in window
R/BioConductor •Extensive choice•Need to read about before applying
General advice:
• Apply normalisations that make sense for your data
• Use plotting facilities to view your data before and after normalisation to check
Environmental Genomics Thematic ProgrammeData Centre
http://envgen.nox.ac.uk

GeneSpring
maxdView
Normalisation

Normalisation
>pops2 pData(myData)[,2]
>boxplot(myData, col = pos2 +1)
Pre-normalisation
R/BioConductor>eset myData, bgcorrect=“rma”,
normalize.method = “quantile”, pmcorrect.method=“pmonly”, summary.method = “medianpolish”)
>boxplot(eset, col = pos2 +1)
Post-normalisation

Filters
• A Filter is a rule applied to each Spot
• Spots which do not pass through the filter are ignored in downstream steps
• Filters are useful for reducing the complexity of analyses or visualisations by discarding uninteresting Spots. They can also be used to locate Spots which match particular criteria.
Environmental Genomics Thematic ProgrammeData Centre
http://envgen.nox.ac.uk

GeneSpring
Environmental Genomics Thematic ProgrammeData Centre
http://envgen.nox.ac.uk
Filter on Error

maxdView
Environmental Genomics Thematic ProgrammeData Centre
http://envgen.nox.ac.uk
MultiFilter

R/BioConductor
Environmental Genomics Thematic ProgrammeData Centre
http://envgen.nox.ac.uk
>library(genefilter)
Have to define your filter and then apply it.
Filters can be saved and used again.

Statistics and clusteringMost statistical tests have underlying
assumptions – know what these are and whether they are valid for your data!
GeneSpring, maxdView and R/BioConductor all provide facilities to run various statistical analyses and clustering algorithms.
R provides the most extensive choice.
Environmental Genomics Thematic ProgrammeData Centre
http://envgen.nox.ac.uk

GeneSpring

maxdView
Environmental Genomics Thematic ProgrammeData Centre
http://envgen.nox.ac.uk
TTest

R/BioConductor
Environmental Genomics Thematic ProgrammeData Centre
http://envgen.nox.ac.uk
>library(multtest)…designed for microarray data
Many clustering functions available within R libraries
Other topics to consider
• Potential for automation• Statistical choices• Plotting choices• Ability to interface with other programs• No doubt lots of other things…
Environmental Genomics Thematic ProgrammeData Centre
http://envgen.nox.ac.uk

The danger of the black box
User friendly software is:
a) easy to use
b) easy to abuse
c) both of the above
Environmental Genomics Thematic ProgrammeData Centre
http://envgen.nox.ac.uk

What is your aim?
Looking for genes to test biologically? • How many false positives can you afford?
• How many false negatives can you afford?• How many replicates (technical?
biological?) will you need to use the appropriate analysis methods?
Your analysis methods should take these issues into account.
Environmental Genomics Thematic ProgrammeData Centre
http://envgen.nox.ac.uk

Example: What is significant change?
Is a 2-fold change in expression meaningful?
• Do you have enough replicates to justify your claims statistically?
• Is it meaningful if the absolute expression level is low?
– What is the std. dev. of your measurements?
– Noise envelope diagrams – precision is an issue
• Is it meaningful if the absolute expression level is high?
– Saturation effects
– Accuracy issues
Environmental Genomics Thematic ProgrammeData Centre
http://envgen.nox.ac.uk

The moral
Experimental design is more important than which analysis package you choose to use.
Plan your experiments! Your experimental design will affect what meaningful analyses you can
do.
Plan your analyses! There are many steps to carrying out transcriptomic analysis properly.
Don’t give in to the temptation of the black box!
Environmental Genomics Thematic ProgrammeData Centre
http://envgen.nox.ac.uk
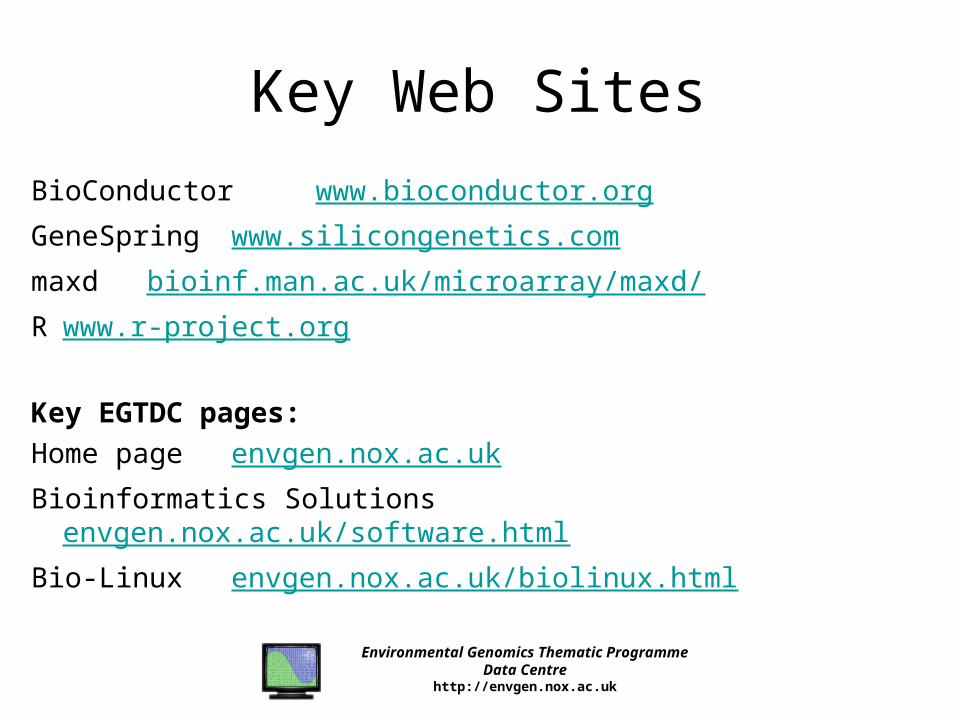
Key Web Sites
BioConductor www.bioconductor.org
GeneSpring www.silicongenetics.com
maxd bioinf.man.ac.uk/microarray/maxd/
R www.r-project.org
Key EGTDC pages:
Home page envgen.nox.ac.uk
Bioinformatics Solutions envgen.nox.ac.uk/software.html
Bio-Linux envgen.nox.ac.uk/biolinux.html
Environmental Genomics Thematic ProgrammeData Centre
http://envgen.nox.ac.uk


Normalisation
IntrachipInterchip
E.g. expt with Affy – may need to normalise regionally (intrachip) and across chips (interchip) before data comparable
Expt with cDNA – normalise intrachip and interchip?

Distogram
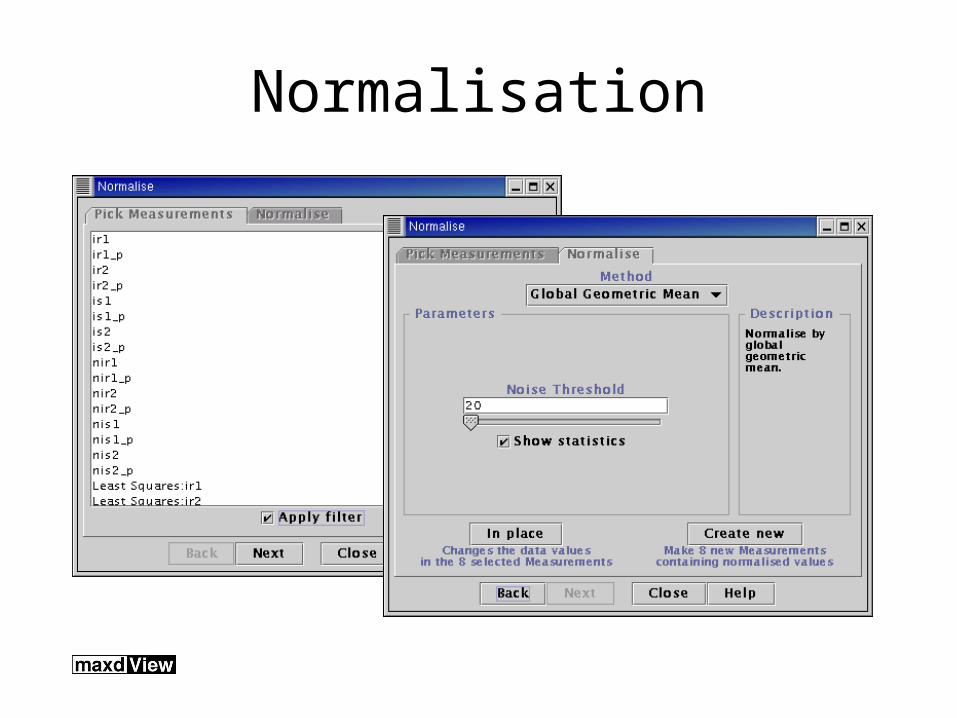
Normalisation
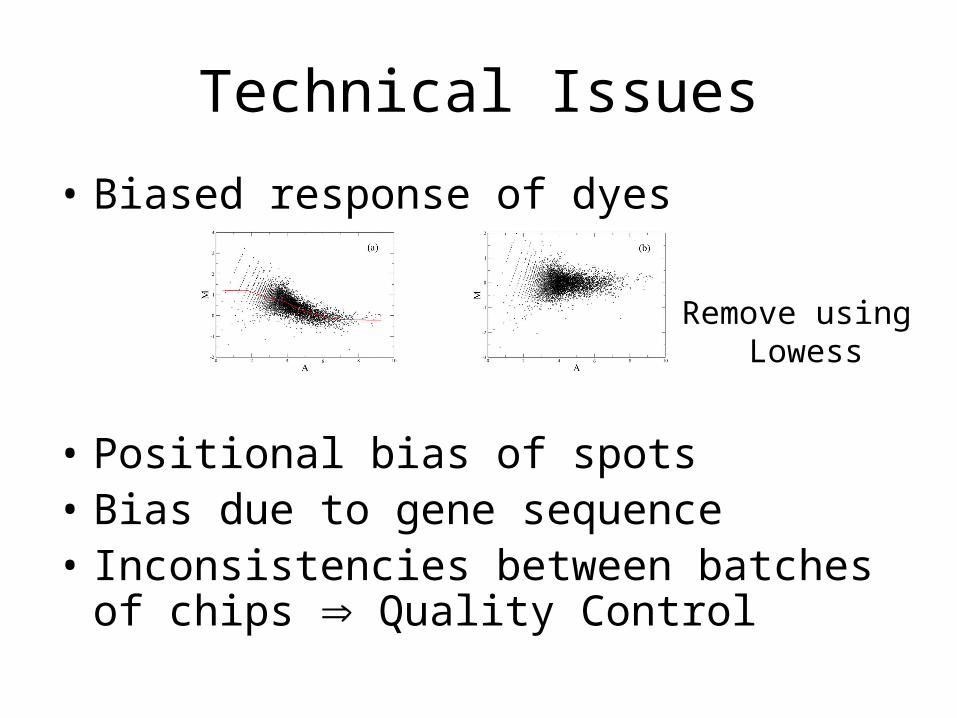
Technical Issues
• Biased response of dyes
• Positional bias of spots• Bias due to gene sequence• Inconsistencies between batches of chips
Quality Control
Remove using Lowess

SVD & PCA

Help Documentation

GeneSpring
Color Barfor gene coloring (default coding: expression level)
Genome Browserto view expression data
Navigatorfor project file management
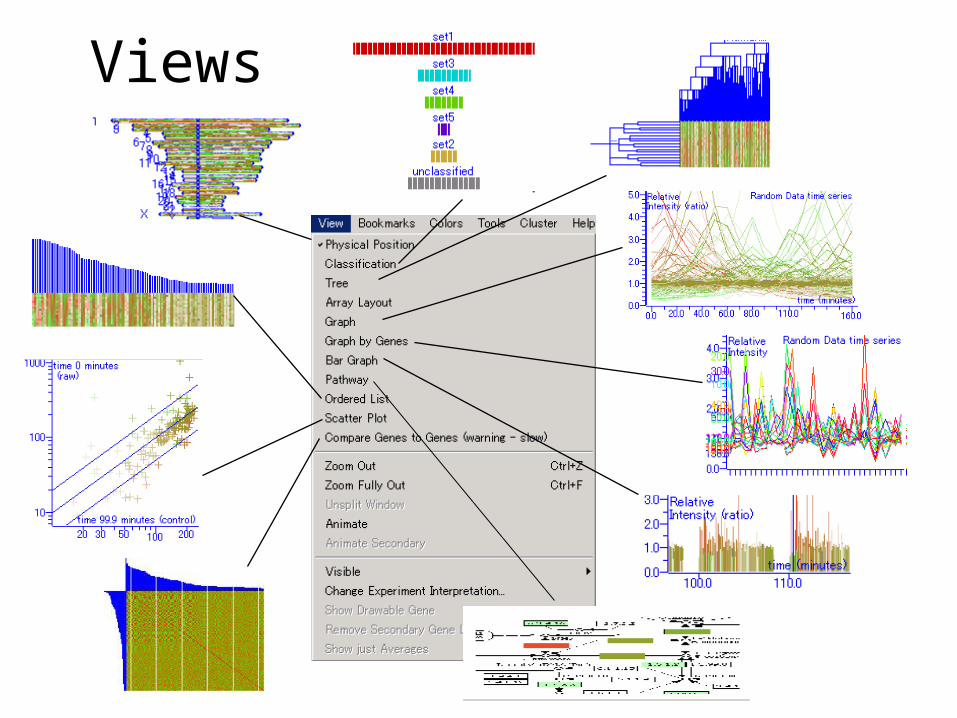
Views

R/BioConductor
Command line statistics packagePros:• flexible• lots of functionality• high degree of control• great plotting facilities• promotes thinking about data• lots of documentation and help availableCons• STEEP learning curve at beginning
R/BioConductor
E.g. With Affymetrix data
Can load data at various stages• summary values• raw values• transformed values• etc.…
Can then apply relevant functions using various libraries

R/BioConductor
E.g. With Affymetrix data>library(affy)>listocelfiles = list.celfiles(filenames = “/home/user1/myfiles/”)>myData = read.affybatch(filenames = listocelfiles)>phenodata read.phenoData(“phenodata.txt”)>phenoData(myData) phenodata
UGLY!
Mitigating factors:Environment can be saved so you do not have to recreate objects from scratch
each timeFiles with sets of commands can be “sourced” so that many tasks are
automatically run on starting R, or can be started up easily when in RYou can do things like this…
Recommended