1
November 2016 Investor Presentation
© 2016 Anixter Inc.
November 2016 Investor Presentation
Table of Contents
2
Page
Safe Harbor Statement and Non-GAAP Financial Measures 3
Anixter at a Glance 4
Repositioned and Strengthened Business 5 -7
Business Model Overview 8 - 12
NSS Overview 13 - 18
EES Overview 19 – 24
UPS Overview 25 – 29
Driving Excellence in Execution 30 - 34
Cash Flow and Capital Allocation Priorities 35 – 36
Compelling Customer and Investor Value Proposition 37
Supplemental Information – Billing Days and Average Copper Prices 38

© 2016 Anixter Inc.
Safe Harbor Statement and
Non-GAAP Financial Measures
3
Safe Harbor Statement
The statements in this release other than historical facts are forward-looking statements made in reliance upon the safe harbor of the Private Securities Litigation Reform Act of 1995. These forward-
looking statements are subject to a number of factors that could cause our actual results to differ materially from what is indicated here. These factors include but are not limited to general economic
conditions, the level of customer demand particularly for capital projects in the markets we serve, changes in supplier relationships or in supplier sales strategies or financial viability, risks associated with
the sale of nonconforming products and services, political, economic or currency risks related to foreign operations, inventory obsolescence, copper price fluctuations, customer viability, risks associated
with accounts receivable, the impact of regulation and regulatory, investigative and legal proceedings and legal compliance risks, information security risks, risks associated with substantial debt and
restrictions contained in financial and operating covenants in our debt agreements, the impact and the uncertainty concerning the timing and terms of the withdrawal by the United Kingdom from the
European Union, and risks associated with integration of acquired companies, including, but not limited to, the risk that the acquisitions may not provide us with the synergies or other benefits that were
anticipated. These uncertainties may cause our actual results to be materially different than those expressed in any forward looking statements. We do not undertake to update any forward looking
statements. Please see our Securities and Exchange Commission (“SEC”) filings for more information.
Non-GAAP Financial Measures
In addition to the results provided in accordance with U.S. Generally Accepted Accounting Principles (“GAAP”) above, this release includes certain financial measures computed using non-GAAP
components as defined by the SEC. Specifically, net sales comparisons to the prior corresponding period, both worldwide and in relevant segments, are discussed in this release both on a GAAP and
non-GAAP basis. We believe that by providing non-GAAP organic growth, which adjusts for the impact of acquisitions (when applicable), foreign exchange fluctuations, copper prices and the number of
billing days, both management and investors are provided with meaningful supplemental sales information to understand and analyze our underlying trends and other aspects of our financial performance.
We calculate the year-over-year organic sales growth and operating expenses impact relating to the Power Solutions acquisition by including its 2015 comparable period results prior to the acquisition with
our results (on a "pro forma" basis) as we believe this represents the most accurate representation of organic growth, considering the nature of the company we acquired and the synergistic revenues that
have been or will be achieved. Historically and from time to time, we may also exclude other items from reported financial results (e.g., impairment charges, inventory adjustments, restructuring charges,
tax items, currency devaluations, pension settlements, etc.) in presenting adjusted operating expense, adjusted operating income, adjusted income taxes and adjusted net income so that both
management and financial statement users can use these non-GAAP financial measures to better understand and evaluate our performance period over period and to analyze the underlying trends of our
business. As a result of the recent acquisitions we have also excluded amortization of intangible assets associated with purchase accounting from acquisitions from the adjusted amounts for comparison
of the non-GAAP financial measures period over period.
EBITDA is defined as net income from continuing operations before interest, income taxes, depreciation and amortization. Adjusted EBITDA is defined as EBITDA before foreign exchange and other non-
operating expense and non-cash stock-based compensation, excluding the other items from reported financial results, as defined above. We believe that adjusted operating income, EBITDA and Adjusted
EBITDA provide relevant and useful information, which is widely used by analysts, investors and competitors in our industry as well as by our management in assessing both consolidated and business
segment performance. Adjusted operating income provides an understanding of the results from the primary operations of our business by excluding the effects of certain items that do not reflect the
ordinary earnings of our operations. We use adjusted operating income to evaluate our period-over-period operating performance because we believe this provides a more comparable measure of our
continuing business excluding certain items that are not reflective of expected ongoing operations. This measure may be useful to an investor in evaluating the underlying performance of our business.
EBITDA provides us with an understanding of earnings before the impact of investing and financing charges and income taxes. Adjusted EBITDA further excludes the effects of foreign exchange and
other non-cash stock-based compensation, and certain items that do not reflect the ordinary earnings of our operations and that are also excluded for purposes of calculating adjusted net income,
adjusted earnings per share and adjusted operating income. EBITDA and Adjusted EBITDA are used by our management for various purposes including as measures of performance of our operating
entities and as a basis for strategic planning and forecasting. Adjusted EBITDA may be useful to an investor because this measure is widely used to evaluate a company’s operating performance without
regard to items excluded from the calculation of such measure, which can vary substantially from company to company depending on the accounting methods, book value of assets, capital structure and
the method by which the assets were acquired, among other factors. They are not, however, intended as an alternative measure of operating results or cash flow from operations as determined in
accordance with generally accepted accounting principles.
Non-GAAP financial measures provide insight into selected financial information and should be evaluated in the context in which they are presented. These non-GAAP financial measures have limitations
as analytical tools, and should not be considered in isolation from, or as a substitute for, financial information presented in compliance with GAAP, and non-GAAP financial measures as reported by us
may not be comparable to similarly titled amounts reported by other companies. The non-GAAP financial measures should be considered in conjunction with the Condensed Consolidated Financial
Statements, including the related notes, and Management’s Discussion and Analysis of Financial Condition and Results of Operations included in this release. Management does not use these non-
GAAP financial measures for any purpose other than the reasons stated above.

© 2016 Anixter Inc.
Key Metrics
Anixter at a Glance: 2015 Pro Forma After Three Strategic Actions
4
2015PF
Sales $7.7B
Adjusted EBITDA $432M
Adjusted EBITDA margin 5.6%
Countries 50
Cities 300+
SKUs ~450k
Inventory $1.2B
Warehouses/Branches ~320
Anixter 2015 PF Consolidated Sales
$7.7B
NSS: $4.0B
52%
EES: $2.2B
29%
UPS: $1.5B
19%

© 2016 Anixter Inc.
Repositioned and Strengthened Business
1. Strategic actions taken in 2014 and 2015 transformed the business
2. Created a more focused mix with new segment structure
3. Improved geographic mix
4. Increased the breadth and depth of product portfolio
5. 2016 Update: Delivering on synergy goals
5

© 2016 Anixter Inc.
Enhanced geographic reach
Increased customer penetration
Leveraged purchasing scale
IT and G&A savings
Expanded service offerings
Expanded product offerings
Repositioned and Strengthened Business Strategic Actions Create Synergy and Accretion Opportunities
Revenues
Gross margin
Operating expense
EBITDA Synergy Targets:
• Tri-Ed: ~$15M by 2017
• PS: ~$25M by 2018
CUMULATIVE: ~$40M by 2018
6

© 2016 Anixter Inc.
Repositioned and Strengthened Business
Strategic Actions Change Financial Profile, Driving Increased ROTC
Tri-Ed and Power Solutions: Higher ROTC
• Lower gross margin
• Lower operating expense
• Lower working capital
Key Changes to Our Financial Profile
Fasteners: Lower ROTC
• Higher gross margin
• Higher operating expense
• Higher working capital
7

© 2016 Anixter Inc.
Business Model Overview
Key Platform Strengths
8
1. Leading positions in attractive businesses
2. Strong, diverse and global suppliers and customers
3. Competitive advantages and barriers to entry
4. Digital marketing capabilities enhance our value proposition

© 2016 Anixter Inc.
Business Model Overview
Leading Positions in Attractive Businesses
Network & Security
Solutions
Electrical &
Electronic Solutions
Utility Power
Solutions
Leading Position Global #1 Global Top 3 North America #1
Large ~$55B TAM ~$450B TAM ~$31B TAM
Growing 3 - 4% CAGR 2 - 3% CAGR ~4% CAGR
Fragmented ~7% Share <1% Share <4% Share
Diverse
and Global
END USERS
Commercial, Data Center, Defense, Education,
Electronics, Government, Healthcare, Industrial, Oil and Gas,
Retail, Semi-conductor, Transportation, Utility
CHANNELS
Contractors, Integrators, EPCs
$ Billions
9

© 2016 Anixter Inc.
Business Model Overview
Strong, Diverse & Global Suppliers and Customers
CUSTOMERS SUPPLIERS
10

© 2016 Anixter Inc.
Business Model Overview
Competitive Advantages and Barriers to Entry
Key Differentiators
• Global Capabilities with Local Presence •
• Customized and Scalable Supply Chain Solutions •
• Technical Expertise •
Network & Security Solutions
Electrical & Electronic Solutions
Utility Power Solutions
11

© 2016 Anixter Inc.
Business Model Overview
Counter-Cyclical Free Cash Flow
Provides Financial Flexibility
Generate Strong Free Cash Flow Throughout the Economic Cycle
Note: Free cash flow is not restated for acquisitions and divestitures
12
© 2016 Anixter Inc.
NSS Overview
3Q16 NSS Sales Overview
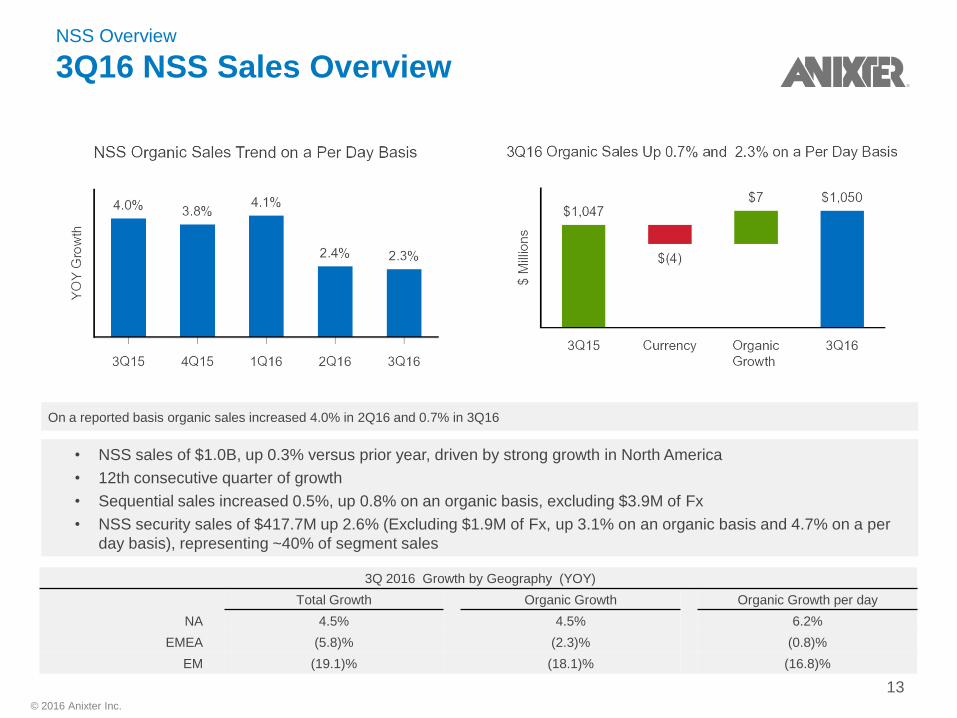
• NSS sales of $1.0B, up 0.3% versus prior year, driven by strong growth in North America
• 12th consecutive quarter of growth
• Sequential sales increased 0.5%, up 0.8% on an organic basis, excluding $3.9M of Fx
• NSS security sales of $417.7M up 2.6% (Excluding $1.9M of Fx, up 3.1% on an organic basis and 4.7% on a per
day basis), representing ~40% of segment sales
On a reported basis organic sales increased 4.0% in 2Q16 and 0.7% in 3Q16
3Q 2016 Growth by Geography (YOY)
Total Growth Organic Growth Organic Growth per day
NA 4.5% 4.5% 6.2%
EMEA (5.8)% (2.3)% (0.8)%
EM (19.1)% (18.1)% (16.8)%
13

© 2016 Anixter Inc.
NSS Overview
Products are Critical Components of the Connected Infrastructure
14
Network Infrastructure
60%
Security Solutions
40%
Copper & fiber optic cabling
Racks, cabinets & cable management
Voice & data networking
Wireless
Power and cooling
Professional Audio/Visual
Video surveillance
Fire and intrusion detection
Servers and storage
Security infrastructure
Access control and door locking hardware
LOW GROWTH HIGH GROWTH
MEDIUM GROWTH

© 2016 Anixter Inc.
2012 – 2016 organic growth CAGR
Network Infrastructure Security Solutions
NSS OVERVIEW
NSS: A LEADING PLAYER IN ATTRACTIVE MARKETS
15
Total Addressable Market:
~$55 billion
Growing 3 - 4% Annually
~7% Anixter
Projected Market CAGR
5 Year Outlook
2014-2019
Network Infrastructure
Security Solutions
0-3%
CAGR
4-6% CAGR*

© 2016 Anixter Inc.
NSS Overview
Capitalize on Growth Opportunities
16
• Greater growth in “Low Share” markets:
– Professional Audio/Visual
– Power
– Small to medium-sized business
• Increasing Supply Chain
outsourcing by large customers
• Wireless / Mobility explosion
• Data center / Cloud growth
• Global Account growth and
increased spending
• Security expansion
– Utility customers
– Tri-Ed model global expansion
– Product cross selling
Growth
opportunities

© 2016 Anixter Inc.
NSS Overview
Tri-Ed Synergies Ahead of Target
$5M
$10M
$15M
$7M
Target Actual
Cumulative Tri-Ed EBITDA Synergies
2015 EBITDA synergies
exceeded $5M target
FY 15 FY 16 FY 17
17

© 2016 Anixter Inc.
18
1
2
Access Control
Intrusion Detection
3
4
Video Surveillance
Power and Protection
5
6
Industrial Networking
Infrastructure
7
8
Industrial Enclosures
Lighting
NSS Overview
Protecting Utility Environments

© 2016 Anixter Inc.
EES Overview
3Q16 EES Sales Overview Y
OY
Gro
wth
$ M
illio
ns
* 3Q15 organic growth not restated for Power Solutions acquisition. On a reported basis organic sales (1.9)% in 2Q16 and (3.1)% in 3Q16
$(8) $535
EES Organic Sales Trend on a Per Day Basis
(1.6)%
(3.4)%
(5.8)%
(7.1)%
(8.1)%
3Q15 4Q15 1Q16 2Q16 3Q16
3Q16 Sales Organic Sales (3.1)% and (1.6)% on a Per Day Basis
$569
$(8)
$(18)
3Q15 Currency Copper Organic 3Q16 PF Growth
• Strengthening foundation of day to day activity
• Focus on share growth
• Cross selling opportunities driving improvements in industrial segment
• Building pipeline with account penetration and broader customer base
19

© 2016 Anixter Inc.
EES Overview
Broadened Relevance
• Outperforming cross-selling commitments
• US trends have accelerated throughout fiscal 2016
− Enhanced US supplier relationships
• Larger product portfolio strengthens relationships with existing customers
− OEM lighting audits
20
$5
$10
$19
2016 2017 2018
($ in millions)
EES EBITDA SYNERGY TARGETS

© 2016 Anixter Inc.
EES Overview
Growth in New Markets
• Execute on share-take program in high growth / low share markets
• Gear and lighting product set allows us to diversify away from industrial into commercial markets
− Increase focus on faster growing verticals
• Recent success with datacenters and renewable energy
21

© 2016 Anixter Inc.
EES Overview
Global Growth Opportunities
• Global success and new contract awards allow us to grow revenue even as manufacturing output declines
• Enhanced relationships for both legacy Anixter and PS suppliers
− Leverage and develop to grow outside of North America
22
Customer Customer
Revenue
AXE Sales
YTD Sept
Customer A 10% 13%
Customer B 6% 9%
Customer C 5% 6%
Customer D 16% 41%
Customer E 6% 46%
(1) Source: Public company filings through June 2016

© 2016 Anixter Inc.
EES Overview
Global & Complex Account Program
Global capabilities are driving stronger existing and new supply partnerships
23
• Complex OEM Program enhancement
and expansion
• Global EPC Program with coordinated
action and communication
• Dedicated global account sales teams
• Global and consistent Supply Chain
Services and Project Management Team
• One operating platform
• Global Technical Services Team
• Local presence and resources
Key growth area for OEM and Industrial segments
Anixter is the only
truly global supplier, on
one operating platform,
delivering a consistent
solution anywhere
around the globe

EES Overview
Supply Chain Differentiators
PARAPLEX
READY! Grip
READY! Layer
PARAPULL
READY! Phase
SPEEDPULL®
PARASPIN
• Enhancing value proposition through supply chain differentiators
− Reduce labor costs and installation time
− Improve jobsite safety
− Reduce reel footprint on jobsite
− Lower onsite waste and cleanup
24

© 2016 Anixter Inc.
UPS Overview
3Q16 UPS Sales Overview
25
• Awarded $750 million, 5-year contract to be distributor of utility products and services serving a large investor-owned
electric utility company
• UPS segment includes high voltage business from Power Solutions acquisition
• Sales of $371.3M were (8.8)% on an organic basis, which was (7.3)% on a per day basis, negatively impacted by
timing of utility customers' major project spend and ramping of sales with new customers
• Sequential sales increased 4.6% on an organic basis, excluding $0.9M of Fx
• Strong momentum exiting the quarter as 3Q16 sequential sales increased by $15M, or 6.0% on a per day basis,
versus 2Q16
3Q15 results are pro forma for Power Solutions acquisition, previously disclosed and available on our Investor Relations website
© 2016 Anixter Inc.
UPS Overview
UPS: Synergy Initiatives and Targets
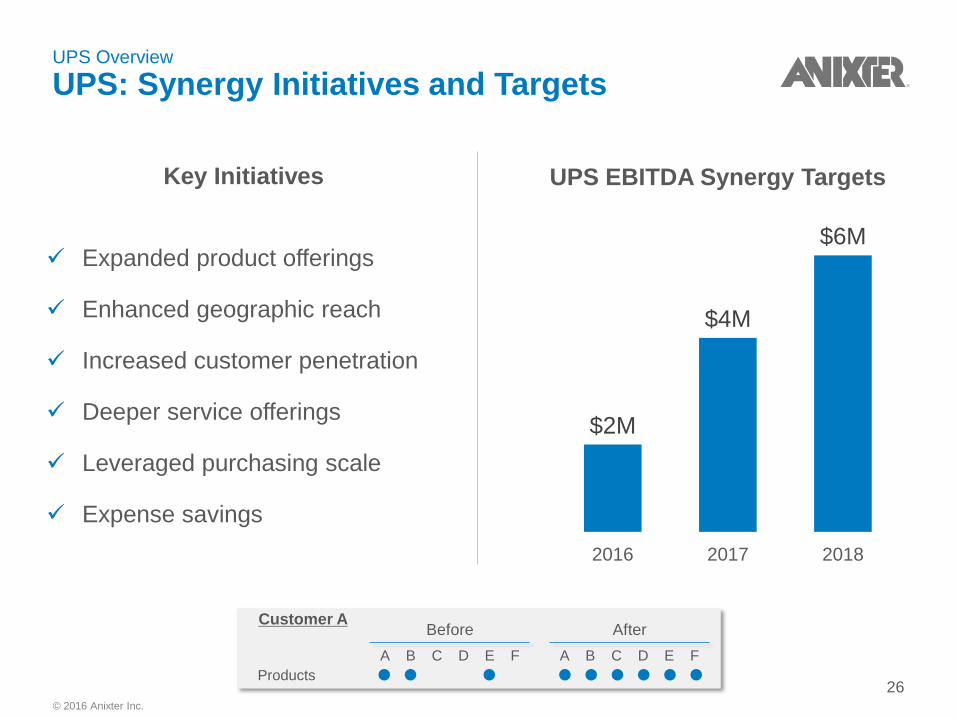
UPS EBITDA Synergy Targets
Expanded product offerings
Enhanced geographic reach
Increased customer penetration
Deeper service offerings
Leveraged purchasing scale
Expense savings
$2M
$4M
$6M
2016 2017 2018
Key Initiatives
26 Products
A B C D E F
Before
A B C D E F
After Customer A

© 2016 Anixter Inc.
UPS Overview
Strategic Overview
27
2016 Market down compared to 2015
˗ Customer and supplier feedback
2017 Market flat to up on 2016
˗ UPS share gain
Customer landscape changing
˗ M&A / Consolidation- IPO’s
Customer behaviors changing
˗ Value add / working capital / cost
Customer A
Customer B
Customer C
Customer D
Customer E
Customer F
2016 2017
Customer Sales Growth YoY

© 2016 Anixter Inc.
UPS Overview
Realigned for Growth
28
Ian Clarke
IOU Public Power Canada Strategic
Sourcing
Synergy
Growth
Deep
Customer
Focus
Expand
Wallet Share
Penetrate
White Space
New
Customer
Development
Strategic
Services
Supplier
Relationship
Management
Vendor
Strategy
Spend
Governance
Synergy
Optimization
Customer
Product
Expansion
One Anixter
Supply Chain
TCO
Deep
Customer
Focus
Expand
Wallet Share
Penetrate
White Space
Deep
Customer
Focus
Expand
Wallet Share
Penetrate
White Space
Value Creation
Functional Support – Driving Operational Excellence
Business
Development

© 2016 Anixter Inc.
UPS Overview
First Year Milestones
29
Align low voltage business with EES (4Q’15)
Implementation of synergy strategy (4Q’15)
Identified organizational cost saving opportunities (2Q’16)
˗ Leverage shared services
Realigned for growth (2Q’16)
Established strategic sourcing and supplier alignment (2Q’16)
Won $750 million, 5 year contract serving a large, investor owned
electric utility company (3Q’16)

© 2016 Anixter Inc.
Driving Excellence in Execution
Capitalize on all available
growth levers
Deliver $40M in cumulative run
rate synergies by 2018
Achieve long term financial
goals
Execute on operational
performance levers
1
2
3
4
30

© 2016 Anixter Inc.
Driving Excellence in Execution
Capitalize on all Available Growth Levers
• Security products • Low voltage electrical
products • Industrial Communication
and Control • Wireless • Professional audio/visual
• Data and mobility usage • Physical security • Non-residential construction • Residential construction • Electrical grid infrastructure • Oil and gas headwinds • Deflationary pressures
• One Anixter • Synergistic cross-selling • Multi-tenant data centers • Small and mid-sized
customers • Digital marketing and
eCommerce
Core Market Growth
Product Line & Service
Offering Expansion
Market Share Gains
• Expansion of security and low voltage products into Canada, Mexico and EMEA
• Expansion of utility products into Western Canada and Mexico
Geographic Growth
Organic Growth Goals:
150 - 250 bps above market
4 - 6% CAGR
31

© 2016 Anixter Inc.
Driving Excellence in Execution
Execute on Operational Performance Levers
• Working capital ratio of 18.6% represents an all time low and a 280 basis point improvement from
year end, driven by working capital initiatives
• Improved adjusted ROTC of 27.9% driven by both adjusted EBTIDA margin growth and working
capital efficiency
32

© 2016 Anixter Inc.
FY 15 FY 16 FY 17 FY 18
Driving Excellence in Execution
Deliver $40 Million in Cumulative Run Rate EBITDA Synergies by 2018
NSS: Tri-Ed and
utility security
EES: Low Voltage
UPS: High Voltage
$40M +
$30M
$17M
$7M
• Tri-Ed: $80 Million
• Power Solutions: $200 Million
Year 3 Run Rate Sales Synergy Goals
33
© 2016 Anixter Inc.
Driving Excellence in Execution
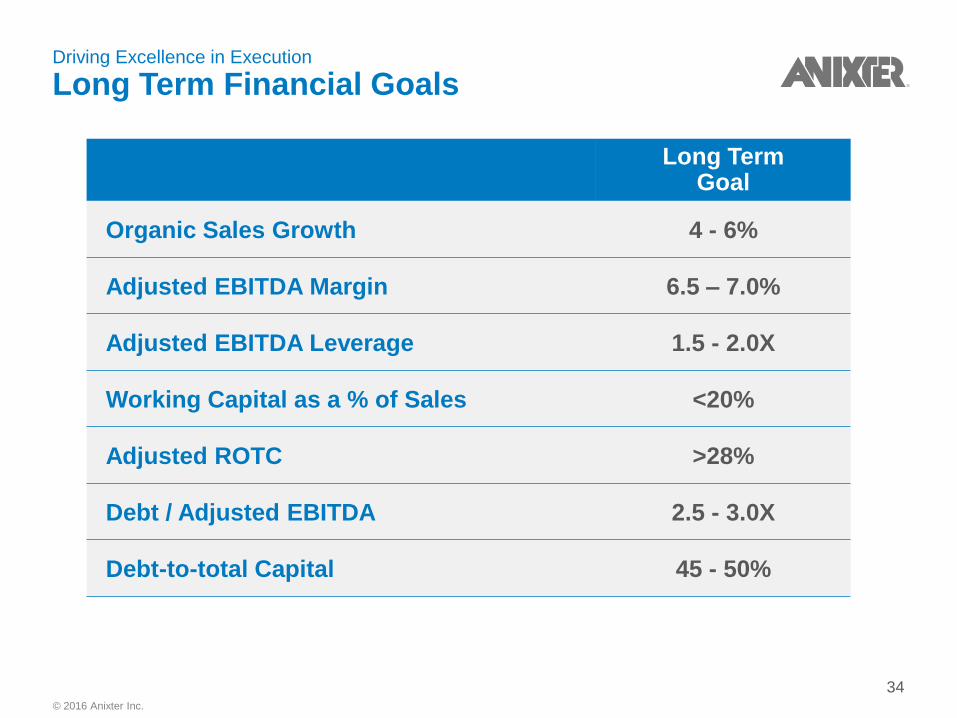
Long Term Financial Goals
Long Term Goal
Organic Sales Growth 4 - 6%
Adjusted EBITDA Margin 6.5 – 7.0%
Adjusted EBITDA Leverage 1.5 - 2.0X
Working Capital as a % of Sales <20%
Adjusted ROTC >28%
Debt / Adjusted EBITDA 2.5 - 3.0X
Debt-to-total Capital 45 - 50%
34

© 2016 Anixter Inc.
Cash Flow and Capital Allocation Priorities
Near Term Cash Flow Allocation Priority is
to Return to Target Debt Levels
*2015 includes 12 months of Power Solutions earnings on a pro forma basis
Target range:
2.5 - 3.0x
Target range:
45 - 50%
35

© 2016 Anixter Inc.
Free Cash Flow
Cash Flow and Capital Allocation Priorities
Strong Record of Returning Value to Shareholders
Growth and Debt Reduction Returned to Shareholders
• Fund organic growth
• Debt reduction
• Acquisitions
• Return value to
shareholders through
share repurchases
and dividends
• Short term goal is to return to target leverage range
• Long term goal is to resume historical capital allocation pattern
~2/3 ~1/3
Note: for 20-year period ending 2014 Anixter returned approximately 2/3 of free cash flow to shareholders 36

© 2016 Anixter Inc.
In Summary
Compelling Customer and Investor Value Proposition
Customer value proposition
− Reduce cost, complexity and risk in our customers’ supply chains
− Key Competitive Differentiators:
• Global capabilities with local presence
• Customized and scalable supply chain solutions
• Technical expertise
Investor value proposition
− Leading positions in attractive businesses
− Competitive advantage and barriers to entry
− Globally scalable business model
− Financial strength and capital efficiency
− Visibility to growth, ability to deliver synergies
− Committed to delivering shareholder value
37

© 2016 Anixter Inc.
Supplemental Information
Billing Days and Average Copper Prices
Billing Days
Q1 Q2 Q3 Q4 FY
2015 65 63 64 61 253
2016 65 64 63 62 254
2017 64 64 63 62 253
Average Copper Prices
Q1 Q2 Q3 Q4 FY
2015 $2.67 $2.77 $2.39 $2.20 $2.50
2016 $2.11 $2.13 $2.16
Increase (Decrease) $(0.56) $(0.64) $(0.23)
% Increase (Decrease) (21.0)% (23.0)% (9.6)%
Recommended