Journal of Electron Spectroscopy and Related Phenomena, ~(1988) 337-342 Elsevier Science Publishers B.V., Amsterdam - Printed in The Netherlands
ANGLERESOLVEDELECTBONSPECTROSCOPYFOR MEASUREMENT OF SURFACE SEGREGATION PHENOMENA IN LIQUIDS AND SOLUTIONS*
SVEN HOLMBERG, ROBERT MOBERG, ZHONG CAI YUAN** and HANS SIEGBAHN
Department of Physics, University of Uppsala, Uppsala (Sweden)
(Received 3 July 1988)
ABSTRACT
The technique of variable take-off electron spectroscopy is applied for the first time to the investigation of surface segregation phenomena in solutions. It is shown that this approach yields quantitative information on depth concentration profiles in electrolytic solutions. In particular, the mean segregation depth and the solute concentration at the solution-vacuum interface is obtained from measured relative intensity data. This is exemplified for the system tetrabutylam- monium iodide in formamide.
INTRODUCTION
The techniques for the application of electron spectroscopy to liquids and solutions have advanced considerably during recent years resulting in the successive improvement of spectral quality. Applications so far have been concerned mainly with the bulk structure of liquids and solutions (see for example ref. 1 for a review). The use of electron spectroscopy for surface studies of liquid systems offers a novel tool on the microscopic scale for more detailed information than can be made available with traditional methods such as, for example, surface tension measurements. In the early work performed in this laboratory on liquid phase samples [2] prominent spectral features were obser- ved due to the surface activity, indicating the potential of electron spectro- scopy in this field. Another example of this reported recently [3] is .Penning ionization of liquid surfaces. In this way extreme surface sensitivity is obtained where the information is sampled mainly from the outermost molecular layer.
The present paper describes the first application of angle-dependent electron spectroscopy on liquid surfaces. By means of this approach the surface sensitiv- ity can be varied between the extreme, for example obtainable in Penning ionization, to probing depths more characteristic of bulk structure, i.e. 25-30 A. Thus, measurements of the variation of relative intensities with respect to
*Dedicated to Prof. E. Heilbronner on the occasion of his 85th birthday. ** Permanent address: Changchun Institute of Applied Chemistry, Changchun, People’s Republic of China.
0 1986 Elsevier Science Publishers B.V.
338
electron take-off angle from the surface allows the evaluation of concentration depth profiles. It is naturally of considerable importance for the complete understanding of liquid surface activity phenomena to obtain direct experi- mental information on such profiles. Since basic interactions reponsible for surface activity are different in different systems it is to be expected that this will be manifested in characteristic features in the depth composition profile of a given system. For example, the most common example of surface activity, that of a hydrocarbon in a polar solvent, implies that the energy of the system is minimized (and hence the surface tension of the solution lowered) by the segregation of the solute hydrocarbon towards the surface. In an electrolyte, on the other hand, the opposite will generally occur, i.e. the surface will be depleted of the solute ions. Thus, electrolytes commonly exhibit a slight in- crease in surface tension with electrolyte concentration. The surface tension increase for these systems is however generally very small and often within the experimental error limits [4]. Theoretical treatment of the surface properties of electrolytes is difficult in view of the complex nature of the interactions bet- ween the participating particles. Model calculations exist [5] which, however, involve significant simplifications. Experimentally determined concentration profiles using electron spectroscopy may thus fill an urgent need as a testing ground for more complete theories.
EXPERIMENTAL
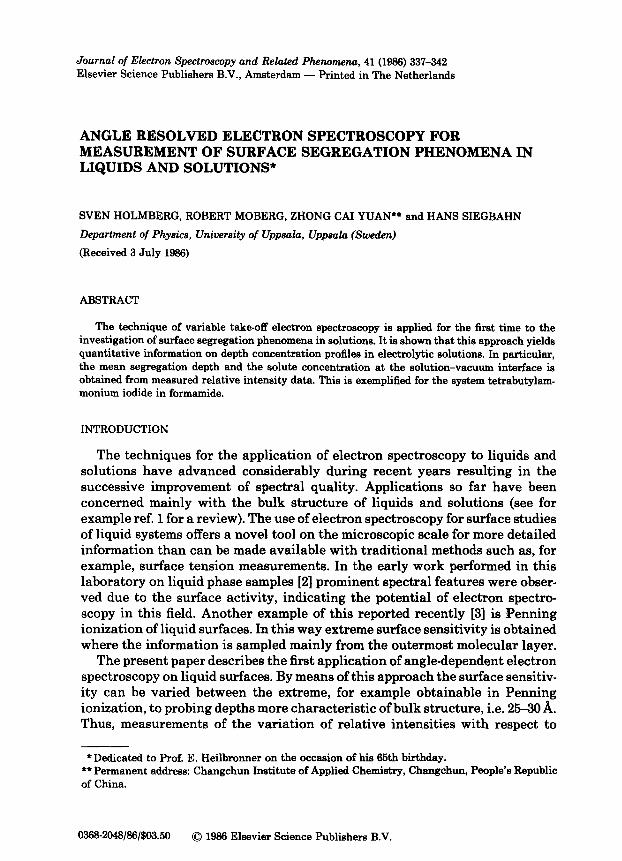
Figure 1 shows schematically the liquid sample arrangement. The liquid surface is created by rotation of the steeltrundle substrate into a cup contain- ing the sample. The object of this study was to monitor the solute-to-solvent
X- R,AYS
TER
Fig. 1. Geometry for variation of electron take&t? angle (0). The angle is varied by changing between different substrates having different inclination angles with respect to the rotation axis.
339
intensity ratio as a function of electron take-off angle (0 in Fig. 1). 8 was varied by changing between different trundles with different surface inclination ang- les with respect to the rotation axis. The angular resolution, set by the accep tance of the s~ctrometer in the z direction, was A@ = + 8O. The system studied was tetrabutylammonium iodide (0.5 M) in formamide and spectra were recor- ded at a solution temperature of 7°C. At this temperature the vapor pressure is low enough to contribute only marginally to the observed spectra. In order to effectively eliminate possible influences of the vapor signal on the solut-ol- vent relative intensity ratios, spectra were recorded with a potential applied between the liquid surface and the entrance slit to the spectrometer. As previously shown [6] the vapor signal can thus be reduced to a negligible level.
For a polar solvent such as formamide there is a tendency to hydrocarbon contamination of the surface. This may disturb the analysis, since the hydro- carbon peak of a possible contamination coincides with part of the butyl peak of the solute. In order to avoid such artifacts, spectra were carefully checked for time-dependence in the relative intensities (which we have previously found to be characteristic of hydrocarbon contamination of liquid surfaces) as well as for repeatability. Also, in several spectra it was possible to experimentally resolve the solute C 1s signal into two components with a ratio 1:3, the smaller component corresponding to the nitrogen-attached carbon.
The anion I 3d peak was also monitored with reference to the 0 1s peak of the solvent and the observed relative intensity changes in this peak were found to agree with those of the solute C 1s signal.
RESULTS AND DISCUSSION
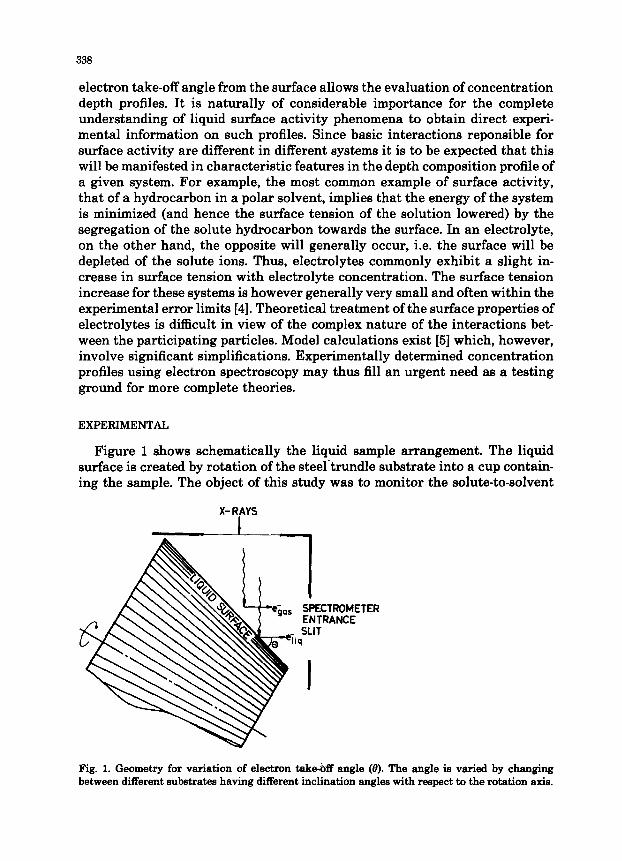
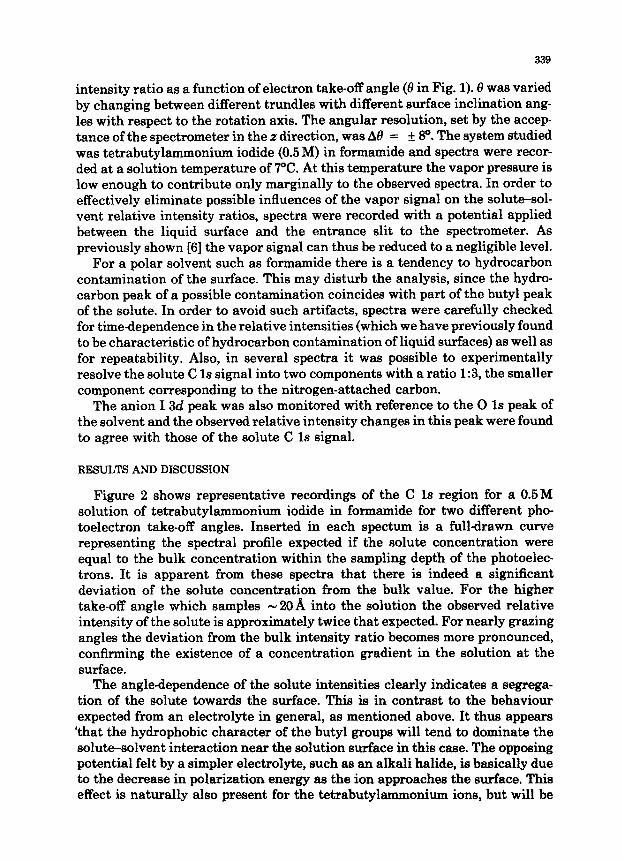
Figure 2 shows representative recordings of the C 1s region for a 0.5M solution of tetrabutyl~oni~ iodide in formamide for two different pho- toelectron take-off angles. Inserted in each spectum is a full-drawn curve representing the spectral profile expected if the solute concentration were equal to the bulk concentration within the sampling depth of the photoelec- trons. It is apparent from these spectra that there is indeed a significant deviation of the solute concentration from the bulk value. For the higher take-off angle which samples N 20 A into the solution the observed relative intensity of the solute is approximately twice that expected. For nearly grazing angles the deviation from the bulk intensity ratio becomes more pronounced, confirming the existence of a concentration gradient in the solution at the surface.
The angl~e~ndence of the solute inte~ities clearly indicates a segrega- tion of the solute towards the surface. This is in contrast to the behaviour expected from an electrolyte in general, as mentioned above. It thus appears ‘that the hydrophobic character of the butyl groups will tend to dominate the solute-solvent interaction near the solution surface in this case. The opposing potential felt by a simpler electrolyte, such as an alkali halide, is basically due to the decrease in polarization energy as the ion approaches the surface. This effect is naturally also present for the tetrabutylammonium ions, but will be
340
But +
[ 1 But-&But I- in HCONH2
EL solute
solvent ..
e- L! 55’
eV 295 2’
. . L . . . . . . . . . . .’ . . .
. .
k_ ‘. I.....
*:
I
BINDING ENERG’!
Fig. 2. C 1s spectra for two different take-off angles (fl = 66’ and 0 = loo) for the system (ButN): I- in HCONH, (0.6 M). The full-drawn curves represent in both spectra the profile expected for the bulk concentration relation between the two components (peak area ratio 1:3). The spectra show a very pronounced surface segregation of the solute within the sampling depth of the photoelec- trons.
expected to be less important due to the large size of these ions. The different behaviour of the tetrabutylammonium salt with respect to other salts is confir- med by measurement of the surface tension of the solutions showing a siguifi-
341
cant decrease for the former case and slight increases for other inorganic salts [7]. In the latter cases the disappearance of signals from the solute was also noted in electron spectra excited with UV-radiation [7].
As indicated above the present recordings of the C 1s spectra as a function of angle allow quantitative information to be extracted regarding the surface segregation in terms of depth concentration profiles. We have thus fitted to our data an expression for the solute concentration of the form
Xm*(r) = X,(CQ) + (X,(O) - X~~(~))e-X’k
where the characteristic parameters describing the solute concentration ver- sus depth are k, the mean segregation depth and X,(O) and X,(co) which are, respectively, the mole ratios of the solute at the surface and in the bulk. For calculation of the angular intensity variation of the solute C 1s signal this expression should be multiplied with the number of carbon atoms per molecule (N, = 16 in this case) as well as an exponential attenuation factor exp( - x/ I sin 0) and the resulting expression integrated over the depth to give
m
JrBA(~b I i&X, (2) exp ( - x/n sin 0) dx 0
A corresponding expression holds for the solvent intensities. Thus, given the measured solute-to-solvent C 1s intensity ratios for different angles the par- ameters k (or rather K/A) and X,(O) can be evaluated (NcXr,(co) is given by the chosen molarity of the solution).
100
Y s ci i? 8 IEw 0 s SOLVENT [HCONH~]
S m
9 u
10 20 30 40 50
DISTANCE BELOW LIQUID SURFACE(A)
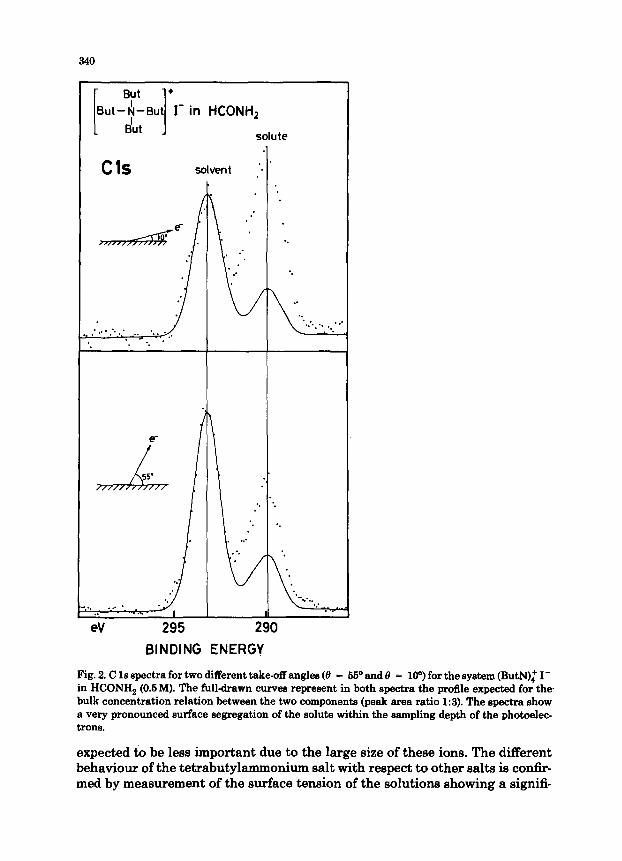
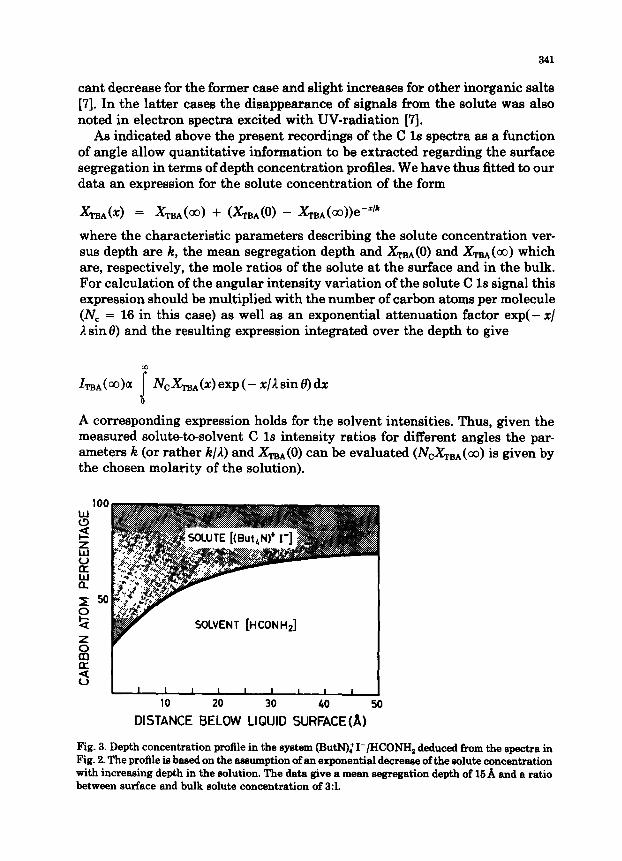
Fig. 3. Depth concentration profile in the system (ButN):I-/HCONH, deduced from the spectra in Fig. 2. The profile is based on the assumption of an exponential decrease of the solute concentration with increasing depth in the solution. The data give a mean segregation depth of 16 A and a ratio between surface and bulk solute concentration of 3:l.
Figure 3 shows a plot of the concentration profile obtained from the above analysis. In this figure we have chosen to plot the carbon atomic percentage since this is strictly the distribution primarily obtained from the analysis of the data. There is reason to point out this distinction because there may exist a tendency for the solute molecular ions near to the surface to align with three butyl chains pointing preferentially towards the surface. This may tend to skew the carbon atom distribution of the solute towards the surface compared to the ion distribution itself. The numerical outcome of the analysis is a k/1 value of 0.58 and a surface concentration of solute carbons of 76%. With an electron escape depth of A = 25A this implies a mean segregation depth of k = 15A. This corresponds to approximately three monolayers of solvent molecules, indicating a rather long-range character of the segregation of the solute. The surface concentration obtained implies a threefold increase of the solute over the bulk value. As mentioned above, estimates of the anion surface segregation based on 13d: 0 1s intensity ratios agree with the cation results within experi- mental error. Thus, no differential effect between the anion and cation segrega- tion could be detected for this system.
REFERENCES
1 H. Siegbahn, J. Phys. Chem., 89 (1966) 897. 2 H. Fellner-Feldegg, H. Siegbahn, L. Asplund, P. Kelfve and K. Siegbahn, J. Electron Spec-
trosc. Relat. Phenom., 7 (1976) 421. 3 W. Keller, H. Morgner and W.A. Miiller, personal communication, 1966. 4 R. Aveyard and D.A. Haydon, An Introduction to the Principles of Surface Chemistry,
Cambridge Chemistry Texts, 1973. 5 (a) L. Onsager and N.N.T. Samaras, J. Chem. Phys., 2 (1934) 526.
(b) T. Croxton, D.A. McQuarrie, G.N. Patey, G.M. Torrie and J.P. VaReau, Can. J. Chem., 59 (1981) 1998. (c) J.P. Valleau and G.M. Torrie, Can. J. Chem., (1962) 4623.
6 H. Siegbahn and M. Lundhohn, J. Electron Spectrosc. Relat. Phenom., 29 (1932) 136. 7 R.E. Ballard, J. Jones and E. Sutherland, Chem. Phys. Lett., 112 (1964) 310.
Recommended