ACCEPTED VERSION
Andreas Cebulla The social orientations and ideologies of UK finance employees at the onset of the Global Financial Crisis Capital & Class, 2016; OnlinePubl:1-23 © The Author(s) 2016
The final, definitive version of this paper has been published in Capital & Class, OnlinePubl, 2016, published by SAGE Publishing, All rights reserved. Published version available via DOI: http://dx.doi.org/10.1177/0309816816678574
http://hdl.handle.net/2440/102974
PERMISSIONS
https://au.sagepub.com/en-gb/oce/copyright-and-permissions#AuthorRights
It is important to check the policy for the journal to which you are submitting or publishing to establish your rights as Author. SAGE's standard policies allow the following re-use rights:
Version 2 - original submission to the journal with your revisions after peer review, often the version accepted by the editor
Version 3 - copy-edited and typeset proofs and the final published version
Once the article has been accepted for publication, you may post the accepted version (Version 2) of the article on your own personal website, your department's website or the repository of your institution without any restrictions.
You may not post the accepted version (Version 2) of the article in any repository other than those listed above (i.e. you may not deposit in the repository of another institution or a subject-matter repository) until 12 months after publication of the article in the journal.
When posting or re-using the article please provide a link to the appropriate DOI for the published version of the article on SAGE Journals
5 December 2016
date ‘rights url’ accessed / permission obtained: (overwrite text)

The Social Orientations and Ideologies of UK Finance Employees at the Onset of the Global Financial Crisis Andreas Cebulla Forthcoming in Capital & Class
Abstract
Debates about the Global Financial Crisis (GFC) of 2007 have pointed at institutional and
individual-behavioural factors as its causes. Using the British Household Panel Survey, this
paper highlights marked differences in perceptions of societal and economic fairness among
financial services employees in investment or management positions in the UK, and the
general working population at the brink of the GFC. Panel data analysis suggests that financial
services and occupations did not necessarily attract employees with pro-market attitudes, but
that employment in these institutions and occupations made it more likely that employees
came to display these perceptions, contributing to the construction of a distinct attitudinal
profile of finance employees.
Keywords: financial crisis, financial services, United Kingdom, ideology, investment banking,
panel analysis
1
Introduction
The Global Financial Crisis (GFC) that started in 2007 triggered a very public soul-searching in
Europe and the USA as to who may need to bear responsibility for the manifest economic and
fiscal calamities brought about by a collapsing and bailed-out banking sector. Early culprits
included the banking institutions themselves, including mainstream banks and their highly
paid chief executives, but also hedge funds and other shadow banking operators. For some,
the GFC came about as a result of lack of oversight or due diligence, loose monetary policy
especially in the United States, and irresponsible lending practices (Cassidy 2009). For others,
the root cause was the financialisation of economies that helped to spread these lending
practices worldwide (Freeman 2010); unsustainable and irresponsible credit-seeking by, and
lending to, increasingly indebted private consumers (Hamnett 2009); the erosion of faith in
debt-driven national economies (Reinhart and Rogoff 2009); excessive incentives and the
rent-seeking behaviour of financial elites (Hodgson et al. 2010); or indeed flawed economic
theories (UN 2009). This list is not exhaustive, and none of the above interpretations are
necessarily mutually exclusive. As of late, however, the public discourse has settled for
blaming the public and, notably, the public sector of countries affected by the GFC, many of
which had only just rescued the private banking sector from collapse (Blyth 2014).
The puzzle remains as to whether institutions or individuals and their reckless
behaviour brought down the global economy so soon after the last crisis of the ‘dot-com’
industry in 2001. Typically, explorations of the role of individuals in economic crises have
focussed on top-level ‘wheelers-and-dealers’, on the power and influence of the super-rich
(Armstrong 2010), those who mistakenly thought they were geniuses (Lowenstein 2002) or
the ‘smartest guys in the room’ (McLean & Elkind 2004) that could set no foot wrong; and on
the ‘rogue’ elements in the sector.
This paper widens the net to take a look at the attitudes towards social and economic
issues prevalent among ‘average’ bankers and financial executives in the UK in the years
2
leading up to the GFC. Drawing on longitudinal survey data, the paper analyses social
preferences and perceptions of people working in financial occupations in the UK and
compares them to other populations. Collectively, those working in financial occupations will
be referred to as ‘financial services employees’, or FSE.
Specifically, the paper examines, first, the extent to which social perceptions and
attitudes among the UK’s FSE at the start of the crisis differed from those of the British
population at large. The analysis seeks to shed a little more light on the validity of ‘blaming’
excessive risk-taking and ‘greed’ for the GFC: were FSE’s attitudes towards risk, money, or
economic principles really that different from the rest of the working population to warrant
singling out the former as possible perpetrators of crisis-inducing behaviour?
Second, the study exploits the availability of longitudinal survey data to test the
association between social perceptions on the one hand, and job duration, that is, extended
exposure to working in financial services occupations, on the other. Specifically, this will allow
some judgement as to whether working in finance amplifies social orientations in ways not
observed among other populations. The analysis will also ask whether financial services
occupations attract employees with social orientation that are already different from those of
the working population at large. In other words, if we were to find distinct or distinctly
prominent social attitudes among FSE, is that because people with such social perceptions
self-select into financial services occupations or because working in these occupations leads
FSE to acquire such perceptions?
Empirically confirming one or both effects has significant implications for our
understanding and ability of explain the GFC in terms of individualised-behavioural or
structural, institutional models. In the following section, key features of these two models are
reviewed, before turning to presenting, first, the data and, then, the analysis and its findings.

3
Overview of the literature
This section is divided into two parts, commencing with a review of the literature purporting
‘individualistic’ interpretations of the crisis, which is followed by a review of the corporate-
institutional interpretations of the origins of the GFC.
Individual-behavioural theories of the crisis in the making
Individual-behavioural theories of the crisis have a strong focus on the actions of investment
bankers and working in top-level managerial positions in financial institutions. References are
made to the evident misdemeanour of so-called rogue traders, including, to name but a few,
Société Generale’s Jerome Kerviel who was convicted of defrauding his employer and clients
in the run up to the GFC, and UBS’s Kweku Adoboli whose fraudulent trading behaviour was
detected in the early years of the GFC.
Whereas these and other rogue traders were largely acting on their own (or teaming
up in twos), banking corporations have allowed more systematic and systemic fraudulent
manipulations of the financial system to be committed, as in the case affecting the London
Interbank Offered Rate (LIBOR). Here bankers and traders of some of the world’s largest
financial institutions colluded in rigging interest rates at which the banks would lend to each
other, to their collective benefit and that of their derivative traders (Hou & Skeie 2014, H.M.
Treasury 2012).
Martin Lewis’s ‘Liar’s Poker’ (1989), ‘The Big Short’ (2010) and ‘Boomerang’ (2011) are
awash with examples of reckless and self-centred rent-seeking behaviours in financial
investment circles. Similar stories were recounted by Lowenstein (2002) and McLean and
Elkind (2004) in their studies of the rises and falls of the hedge fund, Long-Term Capital
Management, and the energy giant, Enron in the late 1990s and early 2000s. Case studies like
these share one story line, namely the sidelining and derision of risk managers and whistle-
blowers whose concerns and words of caution and warning were dismissed and ignored (see
4
also Godechot 2007). Finance corporations disregard, isolate and boot out those expressing
dissenting views. Thus Rajan (2010: 141) cites investment bankers according to whom
management risk managers concerned about highly leveraged lending practices had been
‘”fired long ago’”; while Augar (2009: 164) recalls the ‘iron grip’ of Adam Applegarth, then
Chief Executive of Northern Rock. Applegarth’s expansionist business strategy brought about
the death of a bank that only a few years earlier had been a sedate building society owned by
its customers and members. Martin (2013) portrays another former bank Chief Executive
Officer, Fred Goodwin, as someone whose attention to corporate representation and
commercial imperial ambitions overstretched and eventually brought on the collapse of the
Royal Bank of Scotland (RBS). Goodwin’s behaviour has been likened to a psychopathic
disorder not atypical for senior corporate management (Kets de Vries 2012). In influential
positions, people with these traits become ’seductive operational bullies’ (or ‘SOB’, ibid.) who
instil fear and quell any prospect of an alternative business or behavioural model.
There is little systematic knowledge of what attracts such risk-takers or corporate
bullies into financial services occupations. Much research on job choices has focussed on
comparisons of private and public sector preferences and selections (e.g. Smith & Cowley
2011, Buelens & Van den Broeck 2007). Factors such as pay, responsibility, self-development,
job autonomy are known to affect these choices. A survey of finance professionals in the City
of London, however, found that salary and bonuses were the main attractions for
professionals working in the financial sector (St Paul’s Institute 2011).
Not all authors who examined the roots of the GFC hold the view that uncontrolled,
irresponsible individual behaviour was to blame for the crisis. Rajan (2010: 121) notes that
business people’s ‘willingness to exploit any advantages that will help them make money…
stems partly from the nature of competitive banking…and partly from the way banker
performance is measured’. Similarly, Tett (2009: x) argues that ‘(t)he story of the great credit
boom and bust is not a saga that can be neatly blamed on a few greedy or evil individuals’.
5
The real issue was ‘the finance world’s lack of interest in wider social matters’ (Tett 2009:
298), its misguided belief in the infallibility of mathematical models (ibid: 299), a lack of top
managerial control over traders (ibid: 156) and the disregard that investment traders paid to
their management colleagues (ibid: 186) who were ultimately responsible for internal risk
management.
Structural explanations
Tett’s and Rajan’s conclusions are echoed in the international literature on the structural
causes of banking crisis. Here low interest rates and libertarian economic policy (Augar 2009,
Cooper 2008) fuelled speculators’ ‘irrational exuberance’ (Shiller 2000). They created artificial
consumer markets (Demyanyk & Van Hemert 2008) facilitated by a patchy understanding of
new financial products (Barnett-Hall 2009). In Britain, efforts by the Labour Party to attract
the traditionally conservative corporate world of finance into its political realm saw it promote
consumerism and public service marketization (Lee 2007, Taylor-Gooby 2008), and soft-touch,
arms-length regulation of the financial sector. The socially destructive side effects of growing
inequality were often ignored or tolerated (Picketty 2013, Wilkinson & Pickett 2009), while
public opinion increasingly turned away from supporting the redistribution of wealth
(Georgiadis & Manning 2007). The ‘triumph of the city’ (Lee 2007: 88), however, could not
prevent the return of economic bust. Danger signs were spotted early, as, for instance, in
Munro et al (2005). This study highlighted the risks of subprime lending to housing in the UK.
Remarkably, its warnings appear to have been barely noted at the time.
In the United States, subprime mortgaging had been driven by misleading, if not
falsified information provided by mortgage sellers to home buyers about asset values (Piskorki
et al 2013). These lending practices exposed banks to assets of questionable, indeterminable
value, whilst these same banks lacked the assets to balance the risk of financial loss. Credit
rating agencies did little to alert banks or the public to the rapidly growing risk of ‘progressive
illiquidity’ of a financial system increasingly reliant on imaginary finance and speculation

6
(Nesvetailova 2008). That soft-touch regulation played a significant part in allowing this to
happen would not have gone unnoticed by the authorities in charge. Already in 2004, research
by the UK’s Financial Services Authority had found that regulatory requirements affected the
amount of capital held by banks and building societies (Alfon et al 2004). As this regulatory
influence vaned, so did the amount of ‘real’ money retained by the speculating banks.
Making a connection
Individualist and structural explanations for the crisis are not mutually exclusive and can be
used to inform each other. Individual misdemeanour or corporate malfeasance, for instance,
are easily condoned when they are alleged to be the result of some inescapable, if
inconvenient, competitive or regulatory force. Disregarding rules then becomes institutionally
permissible as illustrated in a review of conditions at Barclay’s Bank in the wake and aftermath
of the Libor scandal (Salz 2013). It found that, after two decades of corporate growth, the bank
had ‘no common purpose’ and no ‘shared values’ (Salz 2013: 6-7), and demonstrated a lack of
corporate leadership. A lack of corporate oversight had allowed investment traders’ ‘animal
instincts’ to take charge, encouraged by their generous financial rewards, which ‘contributed
significantly to a sense among a few that they were somehow unaffected by the ordinary
rules’ (Salz 2013: 9). With hindsight, the influence of both organisational structure and
individual agency in the construction of the banking crisis appeared obvious.
The question of the role of bonus payments in the GFC has recently moved off the
political and public agenda, despite evidence that they did much to distort the lending market
in the run up to the GFC. Agarwal and Wang (2009), for instance, found that incentive
packages increased small business loan approvals by an unnamed major commercial bank by
47 per cent and, tragically, the default rate by 24 per cent. In London’s financial district, as
already noted, salaries and bonuses were the most important motivation for professionals
working in financial services (St Paul’s Institute 2011).
7
Vested interests also shaped the political response to the GFC in the UK as
Government commissions charged with reviewing the banking sector in the wake of the crisis
were headed by individuals with close connections to the financial sector (CRESC 2009).
Independent voices, in particular of those critical of the business and political elite, appeared
excluded (Froud et al. 2011). This ‘democratic disconnect’ (ibid.) may well have served to
protect the financial sector, as the thus generated exclusivity by virtue of exclusion
perpetuated difference that eventually consolidated the status quo (Khan 2012).
The present study lends some support to the plausibility of this thesis as it highlights
a marked dissonance between the social perceptions of those working in managerial or
investment positions in the financial services, whose voices have been most clearly heard and
listened to before and after the onset of the GFC, compared with those in other occupations
and sectors.
Data sources and preparation
The study used data from the British Household Panel Survey (BHPS), a longitudinal survey of
households in Britain (and more recently also including Northern Ireland) that commenced in
1991 and continues to the present day with an increased sample and now known as
‘Understanding Society’. The BHPS covers about 5,000 households and some 10,000
individuals, recording household characteristics and changes, labour market experiences, a
broad range of social and social justice attitudes, including risk perceptions, and voting
preferences and behaviours. It also gathers information on occupations, income and earnings,
and bonus payments.
The BHPS sample has been updated since its inception to allow for attrition and
households entering or leaving the panel. Longitudinal and cross-sectional weights are
available to enhance the representativeness of the datasets for the UK population.
8
In the longitudinal analysis of the BHPS, the study focuses on the period from 2001 to
2008. This was for a number of reasons. First, 2008 was the natural end point for this analysis,
as it signalled the final, full-blown arrival of the GFC and the recognition that this crisis
required intensive state and banking sector crisis management. Second, 2001 was selected as
the start date because by that year, the global economy had begun to cast aside, if not
repaired, the damage caused by the previous crisis, namely the bursting of the dotcom bubble
in 1999/2000 (e.g. Lowenstein 2004), starting a new economic cycle. Third, the selection
needed to ensure appropriate survey questions were available for analysis. Each year, the
BHPS includes different sets of attitudinal questions, which were repeated at different
intervals, thus allowing the analysis of responses over time. Finally, the selection of the
observation period was informed by the need to ensure a sufficiently large sample after
allowing for attrition and non-responses. Small case numbers inevitably affected the detail of
the analyses. However, validation checks, including the use of different analysis methods and
changes to the samples that were studied, produce very similar results, confirming the
robustness of the main findings that are reported here.
Case identification
The BHPS data include variables identifying current and past occupations of panel members.
For the present study, we used the UK Standard Occupational Classification (SOC) 1990 for
data pertaining to the year 2001 to identify those working in the financial services sector. For
later years, the UK SOC 2000 was used. Every effort was made to match sub-major and major
level categories, drawing on ONS (2000) and ONS (2006).
The case identification distinguished between two main groups of FSE, who, for ease
and brevity of description will be referred to as investment and management (or managerial)
employees. Investment FSE were drawn from the SOC unit group of Business and Finance
Associate Professionals (353) and included brokers (SOC 2000 minor group: 3532), insurance
underwriters (3533), finance and investment analysts/advisers (3534), and business and
9
related associate professionals n.e.c. (3539). Managerial FSE were identified in the two SOC
2000 unit group of functional manager (113) and financial institutions and office managers
(115). From the former occupation, we included financial managers and chartered secretaries
(1131); from the latter, financial institution managers (1151).
Bonus payment
Since 1997 (wave G), the BHPS has recorded whether, in the previous 12 months, respondents
had ‘received any bonuses such as a Christmas or quarterly bonus, profit-related pay or profit
sharing bonus, or an occasional commission’. Those who had were then asked about the total
amount of bonus payments received during that period, and whether the amount was before
or after tax. Each year, around 90 per cent of those who had indicated they had received a
bonus payment also provided the amount. In combination with earnings data also reported in
the BHPS, this information was used to estimate the share of bonus payments as of total
earnings. All monetary values used in this study were inflated to 2008 GB Pounds using CPI
data.
Attitudes and Opinions
The BHPS contains a range of social and political attitude questions that survey respondents
have been asked in different waves. Most of these questions have been included in several,
but not consecutive waves of the BHPS. The sole notable exception are questions on voting
behaviour, which had been included in all waves.
The present study focussed on a sub-set of recently asked questions that allowed
testing for socio-cultural differences between FSE and other sections of the working
population. It analysed responses to questions eliciting attitudes towards money and risk
taking; about social trust and social justice. The measures pertaining to social justice allowed
respondents to express agreement or disagreement with a range of statements often

10
fundamental to underlying social and economic beliefs, including in the efficiency and
equitable nature of the market economy, and its effectiveness in sharing outputs.
The exact wording of the questions and associated answer options was as follows:
The importance of money
‘I'm going to read you a list of things that different people value. For each one I'd like
you to tell me on a scale from 1 to 10 how important each one is to you, where ‘1'
equals ‘Not important at all' and '10' equals ‘Very important'.’
o ‘Having a lot of money’
Risk taking
‘Are you generally a person who is fully prepared to take risks or do you try to avoid
taking risks?
Response options on scale 1-10, where
o 1 = ‘Unwilling to take risks’
o 10=‘Fully prepared to take risks’
Trust
‘Generally speaking, would you say that most people can be trusted, or that you can't
be too careful in dealing with people?’
o ‘Most people can be trusted’
o ‘Can’t be too careful ‘
o ‘Depends’
Social Justice and Preferences
‘People have different views about society. I'm going to read out some things people
have said about the UK today and I'd like you to tell me which answer off the card
comes closest to how you feel about each statement.’
Response options on scale 1-5, where
o 1 = ‘Strongly agree’ and

11
o 5 = ‘Strongly disagree’
The statements were:
o ‘Ordinary people get their fair share of the nation's wealth’
o ‘There is one law for the rich and one for the poor’
o ‘Private enterprise is the best way to solve the UK's economic problems’
o ‘Major public services and industries ought to be in state ownership’
o ‘It is the government's responsibility to provide a job for everyone who wants
one’
o ‘Strong trade unions are needed to protect the working conditions and wages
of employees’
The questions on money and trust were covered in the BHPS in 1998, 2003 and 2008,
whereas those on social justice attitudes and preferences were asked in 2000, 2004 and in
2007. The risk question, on the other hand, had been included in the BHPS for the first time
in 2008.
Profiling financial services employees
This section starts with a description of the socio-demographic characteristics of those
working in higher level financial occupations in the UK based on BHPS data for 2008. This is
followed by summaries of the findings from statistical tests of differences in social attitudes
among employees in financial service occupations and others in the workforce. Using
multivariate regression, the analyses controlled for a range of socio-demographic and other
characteristics that are explained below.
All analyses focussed on individuals in employment at the expense of those
temporarily or permanently outside the labour market. This helped the study to focus on
12
examining the influence of continuous employment with an organisation on socio-cultural
values. Unless otherwise indicated, only statistically significant results are reported.
Socio-Demographics
For the analysis of socio-demographics, we used cross-sectional data from the 2008 BHPS. In
that year, investment and management FSE each accounted for about 1.2 per cent of
employees in employment in that year. 1 In both FSE groups only about half were employed
in the financial services sector (45 per cent), while almost a quarter was working in production
(23 per cent), one fifth in private services other than the financial sector (19 per cent) and the
remainder was employed in public services (13 per cent).
Employees in financial services occupations differed from others in employment on a
range of characteristics. Although there were no statistically significant differences in the
mean ages, FSE tended to concentrate in the two lower age categories of those aged 26-35 or
aged 36-45 (Table 1). FSE were more likely to be married and to have at least undergraduate
qualifications. On average, they had spent fewer years (3.9) with their current employer than
others had (5). They were more likely to have received a bonus payment in the previous 12
months, and these bonus payments tended to be significantly higher in that year and but also
when summed over the previous five years (2003-2008). FSE had received bonus payments
more often during that period than others had. FSE were also more likely to be living in London
and England’s South-East.
<Table 1 about here>
Within the group of FSE, that is, comparing investment and management FSE, there
were fewer statistically significant socio-demographic differences, although small case
numbers may have disguised some of them. The main difference between the two groups was
the lower average age of investment FSE (38 years, compared to 43 years) who included a
13
greater proportion of employees under the age of 26. Investment FSE were also less likely to
be married.
Although investment FSE had, on average, received bonus payments less frequently
than managerial FSE, this barely dented their bonus income. When compared with their
management peers, investment FSE had received higher bonus payment over the last five
years as well as the previous year alone. The top bonus payment received by an investment
FSE amounted to £125,000; that of a management FSE came to an average of £107,500. The
highest single bonus payment in 2008 amounting to £200,000, however, had been paid to
someone not in a financial services occupation.
These statistics again demonstrate this study’s concern not with top bonus earners in
financial occupations whose reported bonus income can equate to several multiples of the
amounts reported here. Instead, the study is concerned with the occupational average. The
probability that the elite of very high-bonus earning FSE would be captured in a social survey
is very small indeed. This said, the study identified a distinct group of high earners in finance
whose income would have ranked them in the top percentile of all earners in the UK at the
time.
Attitudes and Opinions
Whilst FSE were, on average, higher earners, their attitudes to money or risk were not
dissimilar to those of the rest of the working population. For instance, 27 per cent of FSE and
31 per cent of others in employment and interviewed in 2008 considered it important to have
money (measured as rated 8 or higher on the 10-point scale) (Table 2). Similarly, 20 per cent
of FSE and 18 per cent of others in employment considered themselves willing to take risks
(rated 8 or higher). In neither case were the nominal differences statistically significant.
<Table 2 about here>
14
In contrast, FSE were more likely than others to express trust. 2 More than half of FSE
thought that ‘most people can be trusted’, compared with only a third of other people in
employment. Further differences emerged with respect to socio-political and socio-economic
orientations recorded by the BHPS in 2007. These suggested a greater prevalence of support
for private capital over public intervention among FSE when compared with other employees.
Thus, FSE were more likely than others to agree that ‘ordinary people get a fair share
of the nation’s wealth’ (27 per cent versus 14 per cent) and that ‘private enterprise is the best
way to solve the UK’s economic problems’ (40 per cent; 18 per cent). FSE thus indicated a
stronger than otherwise typical belief in the fairness of the current economic system and a
preference for market-based approach to economic development. The latter was also
reflected in FSE’s lower propensity to support the view that public services should be state
owned (30 per cent; 34 per cent), or that government had an obligation to provide jobs (24
per cent; 38 per cent). Conversely, FSE were less likely to believe that ‘there was one law for
the rich, and one for the poor’ (37 per cent; 58 per cent), suggesting a stronger belief in the
fairness of the current system of legal and social justice.
Differences were also again apparent between the opinions of investment and
management FSE. Here, management FSE more frequently expressed non-interventionist,
pro-market values than their investment FSE peers. They were more likely to agree with the
statement that private enterprise would solve the UK’s economic problem (53 per cent versus
28 per cent), but less convinced that the government should be expected to provide jobs for
people 15 per cent; 33 per cent). They were also less likely to believe that trade unions
protected working conditions and wages (45 per cent; 63 per cent).
Cross-sectional logistic regression
These relationships or lack thereof also held after controlling for socio-demographic and
employment characteristics. Cross-sectional logistical regression analyses, which, for space
reasons, cannot be described in detail here, highlighted sex and age as key factors associated
15
with most attitudes and perceptions examined here. Furthermore, whereas no independent
statistical relationships were found between FSE status and the importance attached to
money or to self-perceptions as risk takers, trust and social justice perceptions remained
independently associated with FSE status.
Social attitudes, self-selection and employment
Having established that FSE expressed social values and preferences that were different from
those of other employees, we are left with exploring how these orientations relate to
employment in financial services occupations or the financial services sector. The remainder
of the paper examines whether people with the given attitudes were particularly likely to be
working and especially likely to choose to be working in these occupations or sector, or
whether working in these occupations or sector made it more likely that someone adopted
these values and perceptions over time. To do so, a series of panel data analyses were
conducted, focussing on FSE’s assessment of economic fairness and of private enterprise as
those most distinctively shared by FSE. Panel analysis made it possible to study the dynamics
of these social attitudes and, in this instance, employment in financial services occupations
since the previous economic and stock market crisis of the early 2000s.
The analysis combined data for the years 2001, 2004 and 2007, generating over
15,000 observations or data points available for analysis, including 337 pertaining to FSE.
Multivariate random-effects probit models were run to estimate the effects of FSE status,
employment and socio-demographic factors on respondents’ perceptions of economic
fairness and their attitudes to private enterprise. Four new variables were added to the
variable set used in the initial analyses in order to refine the estimations. These new variables
captured the influence of earnings risk, earlier social attitudes, sectoral variations and newly
entering a financial services occupation.

16
Bringing risk back in
‘Risk’ was brought back in to control for variations in the ‘attraction’ that working in a specific
occupation may present. Research by Bonin et al. (2007) and Pollmann (2011) had shown an
association between attitudes to risk and occupational choices. The authors found that people
with more positive attitudes towards risk taking tended to select into occupations with higher
levels of wage dispersion, which they interpreted as an indication of a greater readiness to
work in a volatile and potentially insecure job environment. Introducing earnings risk thus
helped to control for self-selection into these types of occupations, which may have been
driven by a tolerance, acceptance or indeed expectation of risk – and commensurate reward.
Above all, the earnings dispersion variable helped to control for differences between
occupations, which, on the basis of the above literature, should exert a matching pull on
employment seekers with similar risk orientations and associated expectation from their job.
Following the above authors, a basic Mincer regression3 (Mincer 1974) of the
occupation-specific variance of earnings residuals was estimated in order to capture this
volatility and, if indirectly, occupational risk. The resulting data were coded into a variable that
identified occupations whose variance of the earnings residual was below, within or above
one standard deviation of the mean of all occupations’ residuals. It turned out that the
earnings dispersion in the financial services occupations typically ranged within one standard
deviation of the residual means, whilst about 10 per cent of employees had selected into
occupations one standard deviation below the residual mean and a further 10 per cent had
selected into occupations one standard deviation above the residual mean.
Time lag
A lag of the outcome variable of interest was introduced to account for the fact that past
status is known to shape current status in most observed social phenomena. Introducing
lagged variable meant that analyses drew other explanatory variable from just the last two

17
occasions that they were observed. This resulted in a shrinking of the total number of data
points to just under 13,000.
Highlighting the sector
Whilst our analyses so far focussed on FSE, as already noted, only about half of them were
employed in the financial services sector. As this study was also and specifically concerned
with identifying social orientations in the UK banking sector, a further variable was added to
mark respondents’ industrial sector of employment.
Identifying FSE entrants
A further new variable identified individuals in the samples who were working in a financial
services occupation in one of the survey waves when the relevant attitude questions were
asked (e.g. 2007), but not in any of the previous ones when these questions had also been
asked (i.e. 2004 and 2001). This variable therefore identified those who entered a financial
occupation during the period covered by the analysis.
The time lag and sector variables, and the new entrant identifier were added
sequentially to the probit model, which initially only included socio-demographic variables
and the Mincer occupational risk indicator.
Findings I – economic fairness
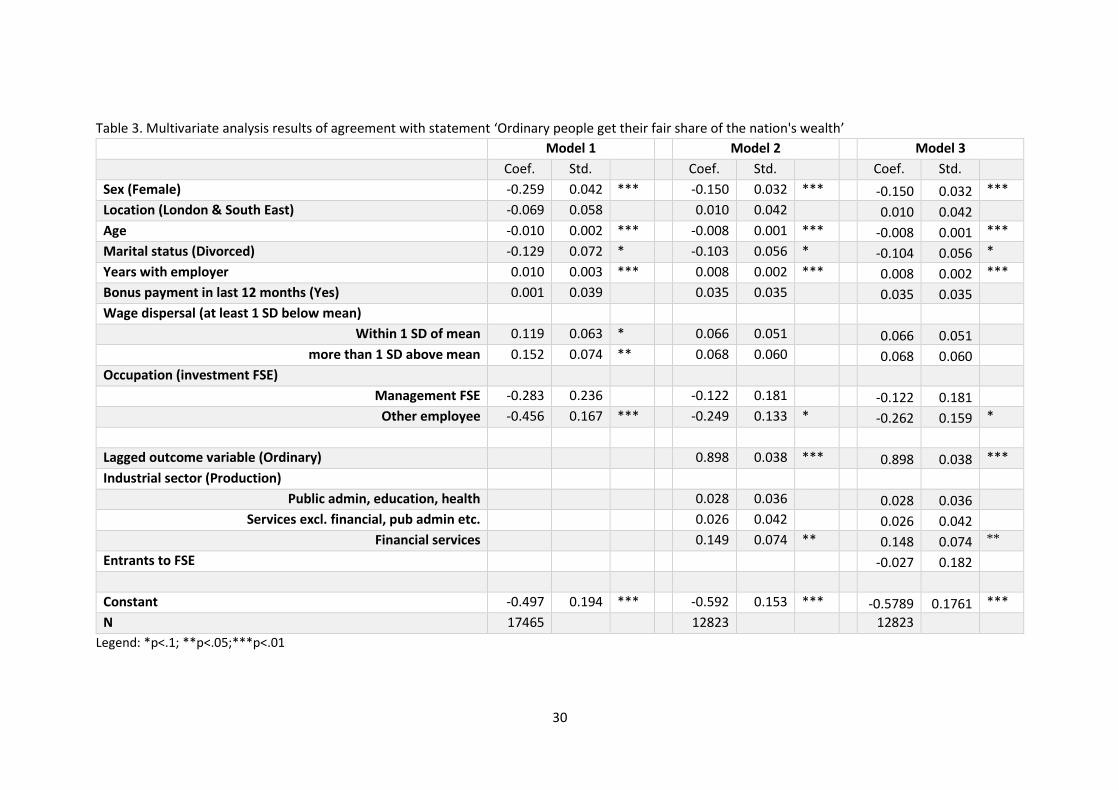
The analysis of the economic fairness statement that ‘ordinary people get their fair share of
the nation’s wealth’ confirmed a strong association with sex, age and years spent with current
employer (Table III, Model 1). All else equal, women were less likely than men to agree with
that statement. Agreement with the statement also decreased with age, but increased with
the time spent working with the same employer. In addition, variations in earnings dispersal
were associated with perceptions of economic fairness. In comparison to people in
occupations with below average wage dispersion, those in occupations with above average
wage dispersion were more likely to agree with the statement. After taken these factors into
18
account, employees not in financial services occupations were less likely than FSE to agree
that the current system of wealth sharing was fair. Put another way, people in financial
services occupations were more likely to believe that economic wealth was shared fairly in UK
society.
<Table 3 about here>
The introduction of the lagged outcome variable and the industrial sector rendered
the earnings dispersal indicator statistically non-significant, whilst reducing the level of
significance of the occupation variable (Model 2). As expected, the lagged outcome variable
was strongly positively associated with the current outcome variable, whilst the industrial
sector variables revealed a greater propensity of those working in the financial sector to share
a belief in the fairness of the UK socio-economic system.
As shown in Model 3 of Table 3, there was no difference with respect to perceptions
of fairness between recent entrants to financial services occupations and other employees.
Selection into financial services occupations therefore appeared not to be affected by a priori
beliefs in the fairness of the UK’s economic systems. Instead, socio-demographic
characteristics and years spent with the same employer predominantly shaped and
consolidated this fairness perception, although additional, if weaker, unexplained
independent occupational and sectoral effects remained.
Findings II – attitudes to private enterprise
Similar associations involving socio-demographic, occupational and sectoral indicators were
found for attitudes towards private enterprise. Model 1 again highlighted statistically
significant differences with respect to sex and age, but lesser associations with years spent
with employer (Table 4). Women and those with more years with the same employer were
less likely to identify with the statement, whereas identification increased, if slowly, with age.
19
<Table 4 about here>
The receipt of a bonus payment in the previous 12 months was also inversely
associated with agreement with the enterprise statement, as was wage dispersion although
the statistical significance of that association was just outside the 5 per cent level. After taking
these variables into account, management FSE were more and other employees less likely to
agree with the enterprise statement than investment FSE were.
The addition of the lagged outcome variable and the industry sector variable in Model
2 lessened the statistical strength of the observed difference between occupations, whilst
rendering bonus payment and wage dispersal non-significant. As before, the lagged outcomes
variable was strongly positively associated with the current outcome variable. Employees in
private and financial services were more likely than others to express confidence in private
enterprise’s capability to solve the UK’s economic problems.
Adding the new entrant indicator into Model 3 had few effects on already observed
statistical relationships, although it accentuated the prevalence of pro-enterprise attitudes
among FSE compared with employees in other occupations. The statistical coefficient
pertaining to the new entrant variable itself indicated a fairly strong, but inverse relationship
between pro-enterprise perceptions and the entry into a financial services occupation. In
other words, selection into financial services occupations was not driven by pro-enterprise
preferences; if anything, the reverse was true. Instead, the articulation of these preferences
was primarily a reflection of employment in the private sector and, in particular, as managerial
FSE. Pro-enterprise perceptions did not become more prevalent with time spent with the
same employer.

20
Discussion and conclusions
To summarise, the analyses confirmed that, in the run-up to the GFC, employees in financial
services occupations and those working in the financial services sector were more inclined to
express attitudes indicative of supporting current features of socio-economic justice and
dominant economic principles in the UK than employees in other occupations. This was
particularly apparent with respect to support for the economic fairness thesis. The association
between FSE status and social attitudes was weaker with respect to orientations towards
private enterprise, where the attitudinal divide cut across employment in production and
public administration, on the one hand, and employment in services, including financial
services, on the other hand.
Sharing these social attitudes was not necessarily associated with selection into
financial occupations or the finance sector. The most consistent evidence pointed at
employment duration or exposure to financial occupations and, more broadly, private
services affecting employees’ perceptions of economic fairness and the capacity of private
enterprise to redress economic problems. In other words, institutionally-induced
acculturation may be a more appropriate explanation for the prevalence among FSE of the
perceptions examined here than pre-existing social preferences, in particular with respect to
perceptions of economic fairness.
The evidence thus lends strongest support to the institutional-structural rather than
the individual-behaviourist model of analysis. This conclusion complements the findings of
Cohn, Fehr and Marechal’s (2014) laboratory experiment, which showed that only when
reminded of their professional status did bankers display dishonest behaviours in the game-
based experiment, whereas employees from other industries did not.
21
Social attitudes and the GFC: a case of tunnel vision?
When Toynbee and Walker (2008) spoke with London law partners and merchant bankers
about the economics of effort and reward in high paying professions, they encountered
blinkered perceptions of socio-economic privilege, a strong individualistic and conservative
attitudes, and strongly articulated status defence. Their findings were published soon after
Orton (2006) had reported on the reluctance of wealthy individuals interviewed in the English
Midlands to embrace active (local) citizenship as a practice fostering reciprocity and social
cohesion, and Cowling and Harding’s (2007) survey-based study that had found high income
earners most inclined to accept social inequality. More recently, studies in psychology have
found further evidence of a generic relationship between social class and (a lack of) generosity
(Piff et al. 2010) and (a propensity to display un-) ethical behaviour (Piff et al. 2012). This
evidence strongly points towards perceptual and behavioural class divides that, among those
most privileged, undermine access to critical reflexivity that would have been required for a
person to recognise their potential or actual role in the construction of the GFC.
In a similar vein, the present study has demonstrated that management FSE were
particularly likely to express pro-enterprise attitudes, especially if they worked in the financial
services sector. The importance of this finding is hard to underestimate given the role of
management FSE in the GFC as the key decision-takers in corporate leadership positions.
Investment FSE may have driven profit, in the process bypassing the business’s risk managers
(Godechot 2007, Ho 2009), but the buck of due diligence and corporate strategy typically stops
with those in managerial positions. The current analysis will not have picked up the views of
the very top-level managers, but its findings hint at an ‘organic’ presence of orientations
across FSE occupations, cultivated in and permeating the finance sector that would have
propelled managers towards seeking crisis solutions within – and not: challenging - the status
quo.
22
This permeation of pro-market orientations in finance has implications for UK public
policy because of the way in which politics has handled the financial sector and the crisis. The
point to stress is the politically significant role that the financial sector played in UK politics
and its elevated (some would say: inflated) status in the economy. Its status as the UK’s
principal global industry, promoted by the state, protected from the state’s intervention and
largely left to its own devices, meant it remained an autonomy unrivalled in the British
economy (see the chapter on the City of London Corporation in Shaxson 2011).
Tying public policy to vested interests and ideologies bears risks. The St Paul’s Institute
(2011) study cited earlier described how financial services professionals often lacked historical
memory: most were not aware of earlier recessions in the UK in the 1980s and early 1990s.
Some even lacked specialist knowledge: one in five finance professionals incorrectly believed
that the UK was in recession in 2007. A lack of historical memory leaves one prone to ignoring
or denying the need for reform, while a gap in basic professional expertise is hardly
encouraging.
What to do?
Financial systems allowed to roam free in capitalism distort realities to suit their own agendas
and prosperity. They “overvalue opportunities and underestimate risks in an effort to cope
with the need to fulfil the expectation upon them” (Tuckett 2009: 3). To do so, finance relies
on often inadequate mathematical (computer) models (Barnett-Hart 2009) and introvert
evaluation cultures (Mackenzie 2011), whilst banking institutions construct environments to
accelerate trading, grow profit, and make markets (MacKenzie, Muniesa & Siu 2008) on the
pretence of knowing what cannot be known (Power 2004; cited in Pryke 2010).
Financialisation and its tools, and the rewarding of high-leverage risk taking
(Lapavitsas 2011, Bebchuk & Sparmann 2009) have created dependencies, which make reform
built on a voluntary (moral) readjustment of the sector seem unlikely and insufficient
(Graafland & van de Ven 2011). The complexities of the foundations, causes and drivers of the
23
GFC have been perplexing, but they also offer anchors for inducing change. The argument
made here is that reform must start with the organisation; the evidence locates the ‘problem’
within the institutional structures embedded in mainstream financial and economic markets
(not discounting Kets de Vries’s [2012: 8] ‘SOB’).
Changing structures and the actions they promote or facilitate provides formidable
challenges. The data have shown that private enterprise creates its own allegiance: those
who work in the private sector support private sector solutions. Here, the banking sector
resembles any other private sector, although management FSE are additionally prone to
expressing pro-enterprise views. With respect to economic fairness, the financial sector
stands out on its own in supporting (its perception of) the status quo. Devising a strategy that
might help to change these attitudes and actions that may result from them is beyond the
scope of this paper. Some seemingly ‘obvious’ and frequently proposed solutions, such as
capping bonuses, may not work: the present analysis revealed little direct association
between being paid bonuses and socio-political attitudes, although indirect effects, for
instance via bonus-induced longer job tenure, cannot be ruled out.
While the scope for changing the social and political attitudes and corresponding
actions that corporate banking appears to inculcate requires further study, resources ought
also to be invested in containing the damaging influence of financial markets on society. This
means, implementing some of the long-debated structural reforms that address the markets’
exclusivist operational principles and corporate identities, working at various fronts.
In order to begin to dismantle the disproportionate influence of financial markets and
their failures, bank activities would need to be isolated and refocussed. Banking, as has
repeatedly been said, may again need to be ‘boring’, - or ‘narrow’ (Kay 2009). Splitting
investment from retail bank may be one first step. However, banks ought also to be reformed
internally, with backroom staff and human resource departments being given greater control
24
and supervisory responsibility to ensure accountability at all levels of the business. Reform
needs to redress the influence of both investment and management FSE.
The question of the political influence of finance also needs to be addressed.
Rebalancing economies from ‘socially useless’ (Turner 2009) to production that is socially
useful is one critical component of this process, which may need to be done with banks in the
role of supportive lenders, not speculating investors.
Notes
1 CRESC (2009) estimated that about 6.5 per cent of the UK workforce was employed in finance,
including jobs in consultancy, accounting and law associated with the financial sector. Two per cent
of investment FSE were self-employed. There were no self-employed management FSE in the sample.
2 Trust is typical for many investing in shares and can, for this reason, be expected to be a shared
characteristic of investment FSE (Guiso, Sapienza and Zingales 2007)
3 To do so, we regressed the log of respondents’ income on the square and the cube of their time
spent with their employers, their highest level of educational qualification, and a dummy for 2-digit
occupation.

25
Bibliography
Agarwal S, Wang FH (2009) Perverse Incentives at the Banks? Evidence from a Natural Experiment, Chicago: Federal Reserve Bank of Chicago. Working Paper 2009-08.
Alfon I, Argimon I, Bascuñana-Ambrós P (2004) What determines how much capital is held by UK banks and building societies? London: Financial Services Authority.
Armstrong S (2010) The Super-Rich shall inherit the earth. The new global oligarchs and how they’re taking over our world, London: Constable & Robinson.
Augar P (2009) Chasing Alpha. How reckless growth and unchecked ambition ruined the City’s golden decade. London: The Bodley Head.
Barnett-Hart AK (2009) The Story of the CDO Market Meltdown: An Empirical Analysis. Bachelor of Arts degree with Honors. Cambridge, Massachusetts: Department of Economics, Harvard College.
Bebchuk LA, Spamann H (2009) Regulating bankers’ pay. Discussion Paper No. 641. 6/2009, Revised 10/2009. Harvard Law School, Cambridge, MA 02138
Blyth M (2013) Austerity. The history of a dangerous idea, Oxford: Oxford University Press. Bonin H, Dohmen T, Falk A, Human D, Sunde U (2007) Cross-sectional earnings risk and
occupational sorting: The role of risk attitudes. Labour Economics, 14(6): 926-37. Buelens M, Van den Broeck H. (2007) An Analysis of Differences in Work Motivation
between Public and Private Sector Organizations. Public Administration Review, January/February: 65-74.
Cassidy J (2009) How markets fail. The logic of economic calamities, London: Penguin Books. Cohn A, Fehr E, Marechal MA (2014) Business culture and dishonesty in the banking
industry. Nature 516: 86–89. doi:10.1038/nature13977 Cooper G (2008) The Origin of Financial Crises. Central banks, credit bubbles and the
efficient market fallacy. Petersfield, Hampshire: Harriman House Ltd. Cowling M, Harding R (2007) The Desire for Income Equality Amongst the UK Adult
Population. London: The Work Foundation. CRESC (2009) An alternative report on UK banking reform. Manchester: Centre for Research
on Socio-Cultural Change. Guiso L, Sapienza P, Zingales L (2007) Trusting the Stock Market. CFS Working Paper
2005/27. Demyanyk Y, van Hemert O (2008) Understanding the Subprime Mortgage Crisis. St Louis:
Federal Reserve Bank of St. Louis. Freeman R (2010) It’s financialisation! International Labour Review, Vol. 149 (2): 163- 183. Froud J, Johal S, Leaver A, Moran M, Williams K (2011) Groundhog Day: Elite Power,
Democratic Disconnects and the Failure of Financial Reform in the UK, Manchester: Centre for Research on Socio-Cultural Change.
Georgiadis A, Manning A (2007) Spend It Like Beckham? Inequality and Redistribution in the UK, 1983-2004. CEP Discussion Paper No. 816, London: Centre for Economic Performance, London School of Economics.
Godechot O (2007) Working rich. Salaires, bonus et approriation du profit dans l’industrie financiere. Paris: Editions Le Decouverte.
Graafland JJ, van de Ven BW (2011) The credit crisis and the moral responsibility of professionals in finance. European Banking Center Discussion Paper No. 2011-012. Tilburg: Tilburg University.
Hacker J (2011) The institutional foundations of middle-class democracy. Policy Network 6.5.2011. http://www.policy-network.net/articles/3998/Theinstitutional-foundations-of-middle-class-democracy.
Hamnett C (2009) The Madness of Mortgage Lenders. Housing finance and the financial crisis, London: Institute for Public Policy Research.

26
H.M. Treasury (2012). The Wheatley Review of Libor: Final Report. London: H.M. Treasury. Ho K (2009) Liquidated. An ethnography of Wall Street. Durham and London: Duke University
Press. Hodgson P, Ruel G, Lamb M (2010) Wall Street Pay Size, Structure and Significance for
Shareowners. Washington: Council of Institutional Investors. Hou D, Skeie D (2014) LIBOR: Origins, Economics, Crisis, Scandal, and Reform. Staff Report
No. 667. New York: Federal Reserve Bank of New York. Kay J (2009) Narrow Banking: The reform of banking regulation. London: Centre for the
Study of Financial Innovation. Kets de Vries MFR (2012) The Psychopath in the C Suite: Redefining the SOB. INSEAD Faculty
& Research Working Paper. 2012/119/EFE. Fountainebleau: INSEAD. Khan SR (2012) The Sociology of Elites. Annual Review of Sociology, 38: 361–77. Krugman P (2012) End this depression now! New York: WW Norton & Company. Lapavitsas C (2011) Theoretizing financialisation. Work, employment and society, 25(4): 611
-626. Lee S (2007) Boom and Bust. The politics & legacy of Gordon Brown. Oxford: Oneworld
Publication. Lewis M (1989) Liar’s Poker. London: Hodder and Stoughton. Lewis M (2010) The Big Short. Inside the Doomsday Machine. New York: W.W. Norton & Co. Lewis M (2011) Boomerang. The biggest bust. London: Penguin Books. Lowenstein R. (2002) When genius failed. The rise and fall of Long-Term Capital
Management. London: Fourth Estate. Lowenstein R (2004) Origins of the Crash: The Great Bubble and Its Undoing. New York:
Penguin. MacKenzie D, Muniesa F, Siu L (eds.) (2008) Do Economists Make Markets? On the
Performativity of Economics. Princeton, New Jersey, USA: Princeton University Press. Martin I (2013) Making It Happen: Fred Goodwin, RBS and the Men who Blew Up the British
Economy. London: Simon & Schuster. McLean B., Elkind P (2004) The smartest guys in the room. The amazing rise and scandalous
fall of Enron. London: Penguin Books. Mincer J (1974) Schooling, Experience, and Earnings. New York: NBER Press. Munro M, Ford J, Leishman C, Karley NK (2005) Lending to higher risk borrowers. Sub-prime
credit and sustainable home ownership. York: Joseph Rowntree Foundation. Nesvetailova A (2008) The end of a great illusion: Credit crunch and liquidity meltdown. DIIS
Working Paper 2008/23. Copenhagen: Danish Institute for International Studies. ONS (2000) Standard Occupational Classification 2000 Volume 1. Structure and descriptions
of unit groups. London: The Stationery Office. ONS (2006) Labour Force Survey User Guide – Volume 5: LFS Classifications. LFS
CLASSIFICATIONS 2006. London: The Stationery Office. Orton M (2006) Wealth, Citizenship and Responsibility: The Views of “Better Off” Citizens in
the UK. Citizenship Studies, 10(2): 251-265, DOI: 10.1080/13621020600633218. Piff PK, Kraus MW, Côté S, Cheng BH, Keltner D (2010) Having less, giving more: The
influence of social class on prosocial behavior. Journal of Personality and Social Psychology 99:771–784.
Piff PK, Stancatoa DM, Côtéb S, Mendoza-Dentona R, Keltnera D (2012) Higher social class predicts increased unethical behavior. www.pnas.org/cgi/doi/10.1073/pnas.1118373109.
Pryke M (2010) Money's eyes: the visual preparation of financial markets. Economy and Society, 39(4): 427-459, DOI: 10.1080/03085147.2010.510679.
Power M (2004) The risk management of everything. London: Demos. Picketty T (2014) Capital in the twenty-first century, Cambridge, Mass/London, England: The

27
Belnap Press of Harvard University Press. Pollmann D (2011) Risk Preferences and Occupational Sorting, Combining Survey and Top-
Coded Administrative Wage Data. Netspear Thesis MSc Thesis 2011-036, Maastricht: School of Business and Economics, Maastricht University.
Rajan RG (2010) Fault Lines. How hidden fractures still threaten the world economy. Princeton: Princeton University Press.
Reinhart C, Rogoff K (2009) This time is different: Eight centuries of financial folly. Princeton, NJ: Princeton University Press.
Salz A (2013) Salz Review. An Independent Review of Barclays’ Business Practices. London: Barclays PLC.
Shaxson N (2011) Treasure Island. Tax havens and the men who stole the world. London: Random House.
Shiller RJ (2000) Irrational Exuberance. Princeton: Princeton University Press. Smith S, Cowley E (2011) Who works in the public sector? Evidence from the World Values
Survey. Working Paper No. 11/268, University of Bristol: Centre for Market and Public Organisation.
St Paul’s Institute (2011) Value and Values: Perceptions of Ethics in the City Today. London: St Paul’s Institute.
Taylor-Gooby PF (2008) Reframing Social Citizenship. Oxford: Oxford University Press. Tett G (2009) Fool’s Gold. How unrestrained greed corrupted a dream, shattered global
markets and unleashed a catastrophe. London: Little, Brown. Tuckett D (2009) Addressing the Psychology of Financial Markets. London: Institute for Public
Policy Research. Toynbee, P. and D. Walker (2008) Unjust Rewards. London: Granta Turner A (2009) Speech at The City Banquet, The Mansion House, London, 22 September.
http://www.fsa.gov.uk/pages/Library/Communication/Speeches/2009/0922_at.shtml.
UN (2009) Report of the Commission of Experts of the President of the United Nations General Assembly on Reforms of the International Monetary and Financial System. New York: United Nations.
Wilkinson R, Pickett K (2009) The spirit level. Why equality is better for everyone. London: Penguin Books.

28
Table 1. Socio-Demographic Characteristics of Financial Service Employees (FSE) and Other Workers (in %, unless otherwise indicated)
Investment FSE
Management FSE
Statistical difference
Any FSE other, no FSE
Statistical difference
A B A vs B C D C vs D
Location London & SE England 33.0 32.1 32.6 24.9 **
Age Mean age 37.6 42.7 40.1 41.5
under 26 11.6 15.2 5.9 14.6 ***
26-35 34.7 57.9 ** 25.1 18.7 ***
Marital status Married 49.7 76.5 *** 62.9 54.4 ***
Never married 38.9 22.2 ** 30.7 32.8
Years with employer Less than 5 69.3 65.9 67.6 62.0
Mean years 3.4 4.4 3.9 5.3
Highest qualification Postgraduate degree 6.2 13.9 10.1 3.7 ***
First degree 31.0 22.3 26.6 17.4 ***
Received bonus in last 12 months 46.0 71.1 ** 58.3 27.0 ***
Number of waves received bonus payment
Mean 5.5 9.0 7.2 3.4
Gross bonus before tax Mean £ 3831.4 8238.9 5998.3 847.9
Gross bonus as % of usual monthly gross pay
Mean % 12.3 14.1 13.4 9.5
Total gross bonus before tax 2003-2008 Mean £ 14240.4 47832.4 30754.9 3673.8
Gross bonus, net difference 2003 and 2008
Mean £ 12853.2 4330.5 6640.7 1483.0
N 85 70 155 7020
Legend: *p<.1; **p<.05;***p<.01

29
Table 2. Attitudes and Opinions of Financial Service Employees (FSE) and Other Workers
Investment FSE
Management FSE
Statistical difference
other, no FSE
Investment FSE
Statistical difference
2008 (wave R) A B A vs B C D C vs D
Importance of money (1-10) Mean 6.5 6.5 6.6 6.6
Important (8-10) 29.9 23.7 26.8 30.5
Generally takes risks (1-10) Mean 4.9 5.1 5.0 5.3
Risk taking (8-10) 23.0 17.2 20.2 18.4
Trust (1-3) Mean 1.9 1.6 1.8 2.2
Most people can be trusted
42.4 60.4 *** 51.5 33.2 ***
Depends 23.2 14.9 19.0 17.4
Can't be too careful
34.4 24.7 29.5 49.4 ***
N 49 45 94 3729
2007 (Wave Q)
Ordinary people share nations wealth (1-5) Agree (1-2) 24.7 28.9 26.7 13.7 ***
Mean 3.4 3.2 3.3 3.5
Private enterprise solves economic problems (1-5)
Agree (1-2) 27.8 53.2 ** 40.1 17.5 ***
Mean 3.0 2.5 2.8 3.1
One law for rich and one for poor Agree (1-2) 39.0 34.5 36.8 58.3 ***
Mean 2.9 3.1 3.0 2.5
Public services ought to be state owned Agree (1-2) 31.3 28.5 30.0 34.1
Mean 3.1 3.4 3.2 2.9
N 53 44 97 3838
Legend: *p<.1; **p<.05;***p<.01
30
Table 3. Multivariate analysis results of agreement with statement ‘Ordinary people get their fair share of the nation's wealth’
Model 1 Model 2 Model 3
Coef. Std. Coef. Std. Coef. Std.
Sex (Female) -0.259 0.042 *** -0.150 0.032 *** -0.150 0.032 ***
Location (London & South East) -0.069 0.058 0.010 0.042 0.010 0.042
Age -0.010 0.002 *** -0.008 0.001 *** -0.008 0.001 ***
Marital status (Divorced) -0.129 0.072 * -0.103 0.056 * -0.104 0.056 *
Years with employer 0.010 0.003 *** 0.008 0.002 *** 0.008 0.002 ***
Bonus payment in last 12 months (Yes) 0.001 0.039 0.035 0.035 0.035 0.035
Wage dispersal (at least 1 SD below mean)
Within 1 SD of mean 0.119 0.063 * 0.066 0.051 0.066 0.051
more than 1 SD above mean 0.152 0.074 ** 0.068 0.060 0.068 0.060
Occupation (investment FSE)
Management FSE -0.283 0.236 -0.122 0.181 -0.122 0.181
Other employee -0.456 0.167 *** -0.249 0.133 * -0.262 0.159 *
Lagged outcome variable (Ordinary) 0.898 0.038 *** 0.898 0.038 ***
Industrial sector (Production)
Public admin, education, health 0.028 0.036 0.028 0.036
Services excl. financial, pub admin etc. 0.026 0.042 0.026 0.042
Financial services 0.149 0.074 ** 0.148 0.074 **
Entrants to FSE -0.027 0.182
Constant -0.497 0.194 *** -0.592 0.153 *** -0.5789 0.1761 ***
N 17465 12823 12823
Legend: *p<.1; **p<.05;***p<.01

31
Table 4. Multivariate analysis results of agreement with statement ‘Private enterprise is the best way to solve the UK's economic problems’
Model 1 Model 2 Model 3
Coef. Std. Coef. Std. Coef. Std.
Sex (Female) -0.876 0.049 *** -0.437 0.032 *** -0.436 0.032 ***
Location (London & South East) 0.060 0.063 -0.022 0.042 -0.022 0.042
Age 0.031 0.002 *** 0.012 0.001 *** 0.012 0.001 ***
Marital status (Divorced) -0.117 0.074 -0.068 0.052 -0.068 0.052
Year with employer -0.006 0.003 * -0.002 0.002 -0.002 0.002
Bonus payment in last 12 months (Yes) -0.157 0.040 *** -0.097 0.033 *** -0.097 0.033 ***
Wage dispersal (at least 1 SD below mean)
Within 1 SD of mean 0.116 0.062 * 0.076 0.048 0.075 0.048
more than 1 SD above mean -0.144 0.077 * -0.088 0.059 -0.088 0.059
Occupation (investment FSE)
Management FSE 0.498 0.240 ** 0.305 0.175 * 0.310 0.177 *
Other employee -0.391 0.177 ** -0.220 0.133 * -0.401 0.156 ***
Lagged outcome variable (Ordinary) 1.168 0.034 *** 1.169 0.034 ***
Industrial sector (Production)
Public admin, education, health -0.004 0.036 -0.005 0.036
Services excl. financial, pub admin etc. 0.140 0.041 *** 0.139 0.041 ***
Financial services 0.152 0.074 ** 0.139 0.074 **
Entrants to FSE -0.386 0.178 **
Constant -1.056 0.207 *** -0.843 0.151 *** -0.662 0.172 ***
N 17465 12823 12823
Legend: *p<.1; **p<.05;***p<.01
Recommended