Measuring Student Engagement and Motivation
WERA December 2013 Conference
Pete Bylsma, Renton School District
Jessica Werner, Youth Development Executives of King County
Greg Lobdell, Center for Educational Effectiveness
YDEKC
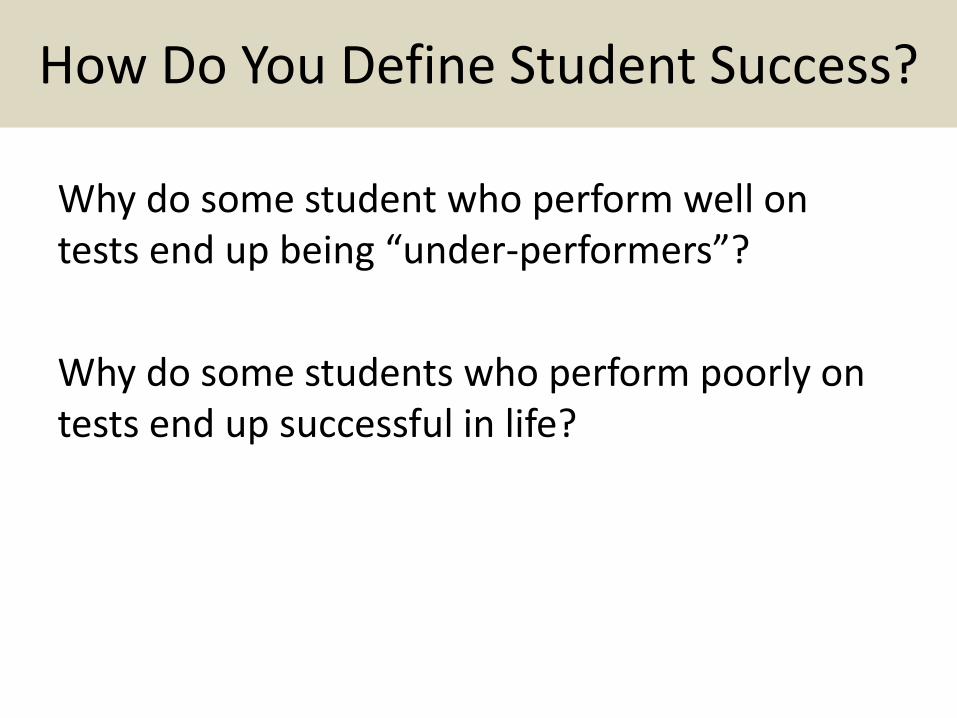
How Do You Define Student Success?
Why do some student who perform well on tests end up being “under-performers”?
Why do some students who perform poorly on tests end up successful in life?
Not everything that counts can be counted, and not everything that can be counted counts. Albert Einstein
To go fast, go alone. To go far, go together. African proverb
Notable Quotes
“Postsecondary admissions (now) depend not just on the rote-learning-centered entrance exams, but also consider factors such as individual students' talents, creativity, and growth potential.… Between the pain of memorizing and the pleasure of creative expression, there needs to be a balance, both to develop the full potential of our students and to meet the nation's need for a skilled workforce and a well-educated citizenry.” Byong-man Ahn, former Minister of Education, Republic of Korea
Education Week, “Education in the Republic of Korea: National Treasure or National Headache?,” January 12, 2012.
Goal of Basic Education “… to provide students with the opportunity to become responsible and respectful global citizens, to contribute to their economic well-being and that of their families and communities, to explore and understand different perspectives, and to enjoy productive and satisfying lives.” RCW 28A.150.210
Notable Quotes
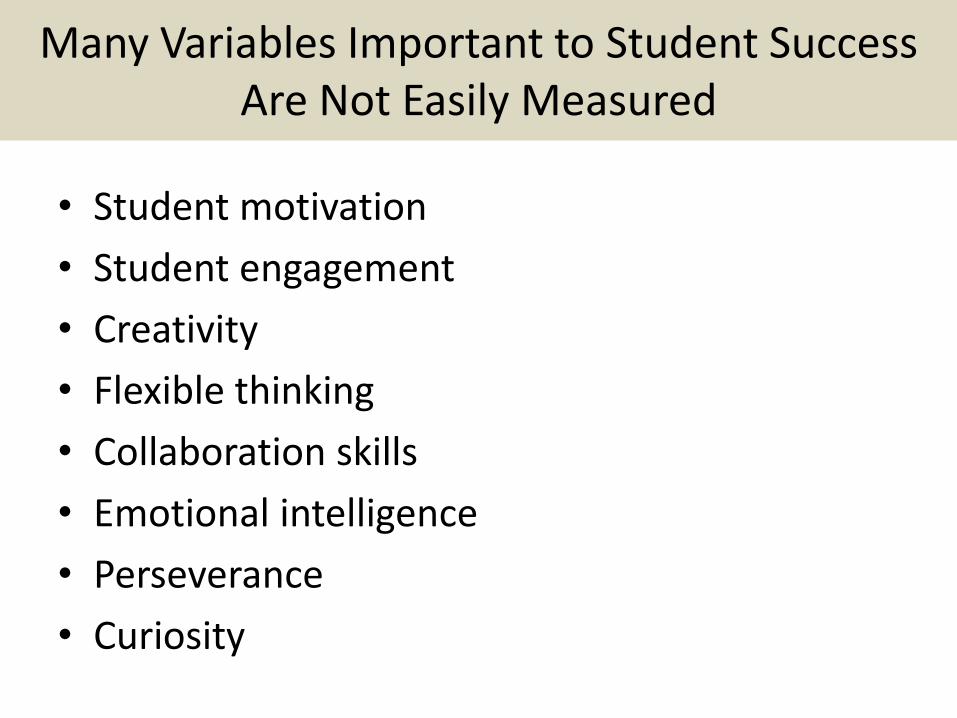
Many Variables Important to Student Success Are Not Easily Measured
• Student motivation
• Student engagement
• Creativity
• Flexible thinking
• Collaboration skills
• Emotional intelligence
• Perseverance
• Curiosity
YOUTH DEVELOPMENT FOR EDUCATION RESULTS WORKGROUP
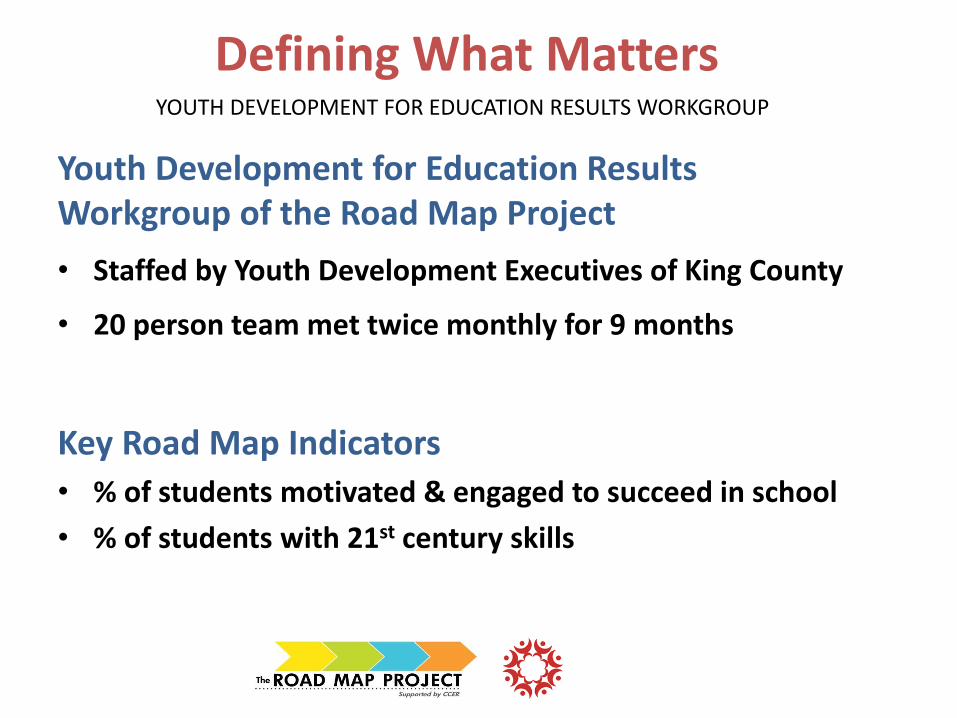
Youth Development for Education Results Workgroup of the Road Map Project
• Staffed by Youth Development Executives of King County
• 20 person team met twice monthly for 9 months
Key Road Map Indicators
• % of students motivated & engaged to succeed in school
• % of students with 21st century skills
Defining What Matters
YOUTH DEVELOPMENT FOR EDUCATION RESULTS WORKGROUP
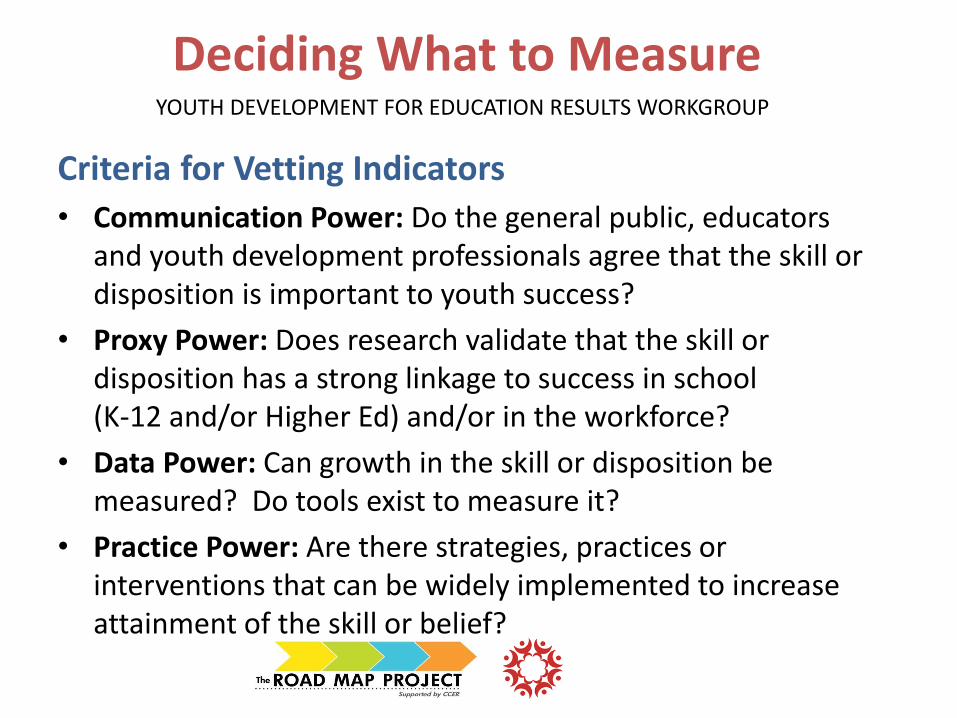
Criteria for Vetting Indicators
• Communication Power: Do the general public, educators and youth development professionals agree that the skill or disposition is important to youth success?
• Proxy Power: Does research validate that the skill or disposition has a strong linkage to success in school (K-12 and/or Higher Ed) and/or in the workforce?
• Data Power: Can growth in the skill or disposition be measured? Do tools exist to measure it?
• Practice Power: Are there strategies, practices or interventions that can be widely implemented to increase attainment of the skill or belief?
Deciding What to Measure
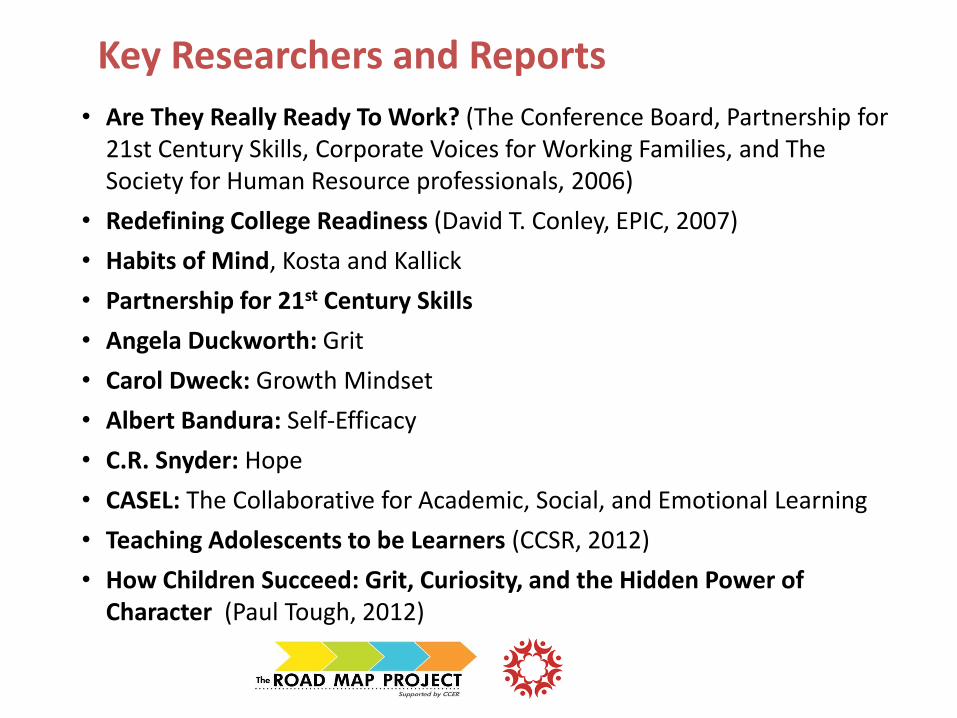
• Are They Really Ready To Work? (The Conference Board, Partnership for 21st Century Skills, Corporate Voices for Working Families, and The Society for Human Resource professionals, 2006)
• Redefining College Readiness (David T. Conley, EPIC, 2007)
• Habits of Mind, Kosta and Kallick
• Partnership for 21st Century Skills
• Angela Duckworth: Grit
• Carol Dweck: Growth Mindset
• Albert Bandura: Self-Efficacy
• C.R. Snyder: Hope
• CASEL: The Collaborative for Academic, Social, and Emotional Learning
• Teaching Adolescents to be Learners (CCSR, 2012)
• How Children Succeed: Grit, Curiosity, and the Hidden Power of Character (Paul Tough, 2012)
Key Researchers and Reports
“Educational interventions and initiatives that target these psychological factors can have transformative effects on students’ experience and achievement in school, improving core academic outcomes such as GPA and test scores months and even years later.”
Academic tenacity: Mindsets and skills that promote long-term learning (Dweck, Walton, & Cohen, 2011)
Teaching adolescents to become learners
The role of noncognitive factors in
shaping school performance
Camille A. Farrington, Melissa Roderick, Elaine Allensworth, Jenny Nagaoka,
Tasha Seneca Keyes, David W. Johnson, Nicole O. Williams
http://files.eric.ed.gov/fulltext/ED542543.pdf
One of the best student-level indicators of
readiness is students’ grades.
What factors
contribute to grades?
Grades matter – more than test scores
– for long-term educational outcomes:
high school graduation, college
enrollment, college completion.
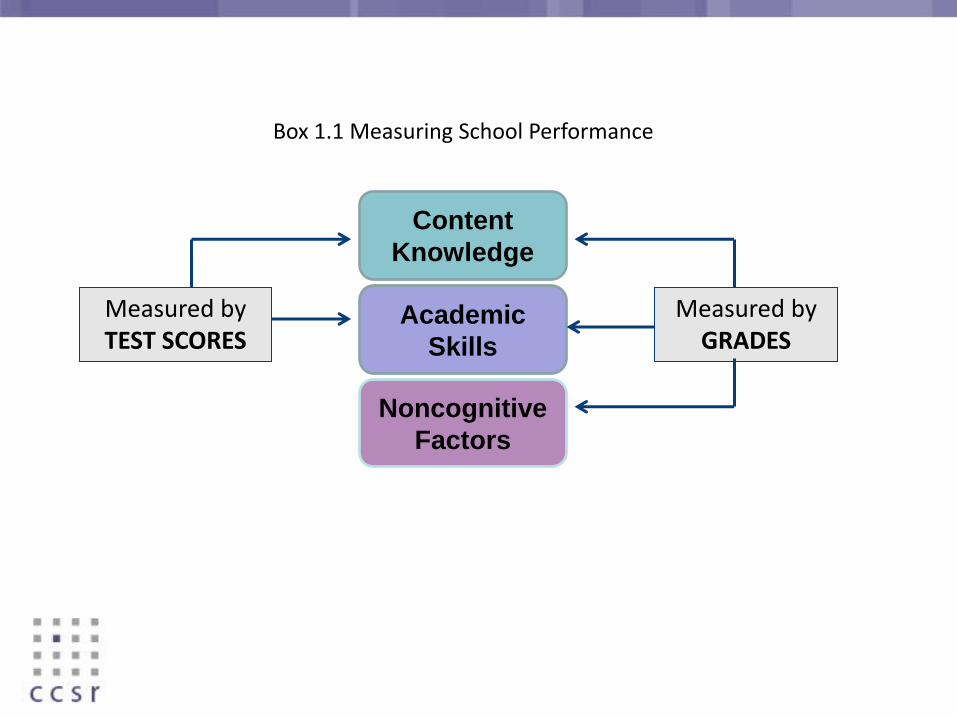
Content
Knowledge
Academic
Skills
Noncognitive
Factors
Measured by GRADES
Measured by TEST SCORES
Box 1.1 Measuring School Performance
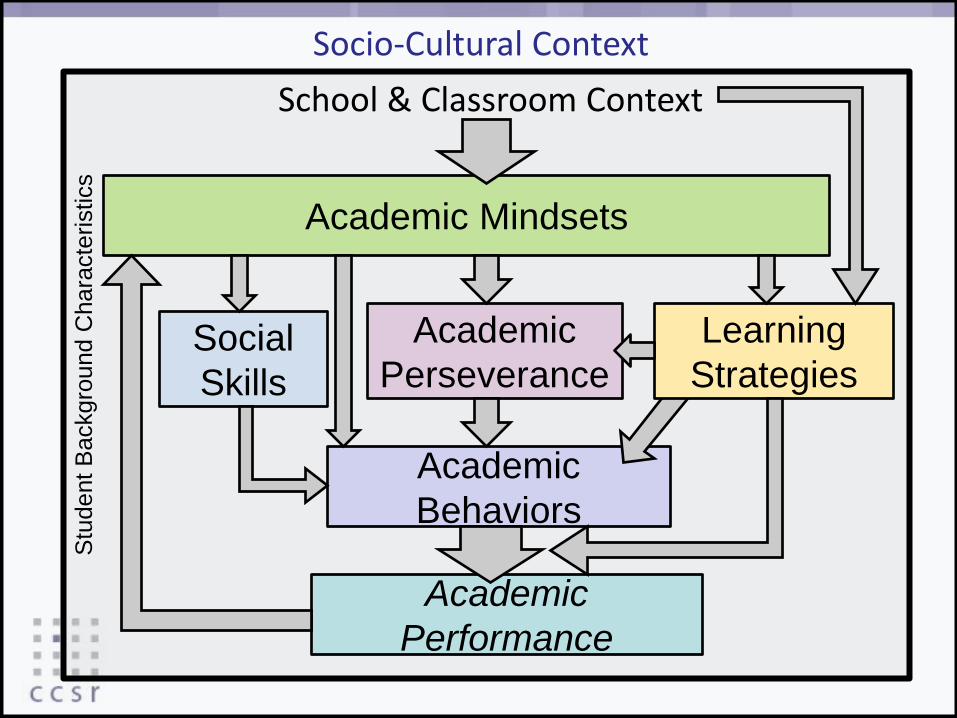
Socio-Cultural Context
School & Classroom Context
Academic Mindsets
Academic
Perseverance
Academic
Behaviors
Learning
Strategies
Academic
Performance
Social
Skills
Stu
dent
Backgro
und C
hara
cte
ristics
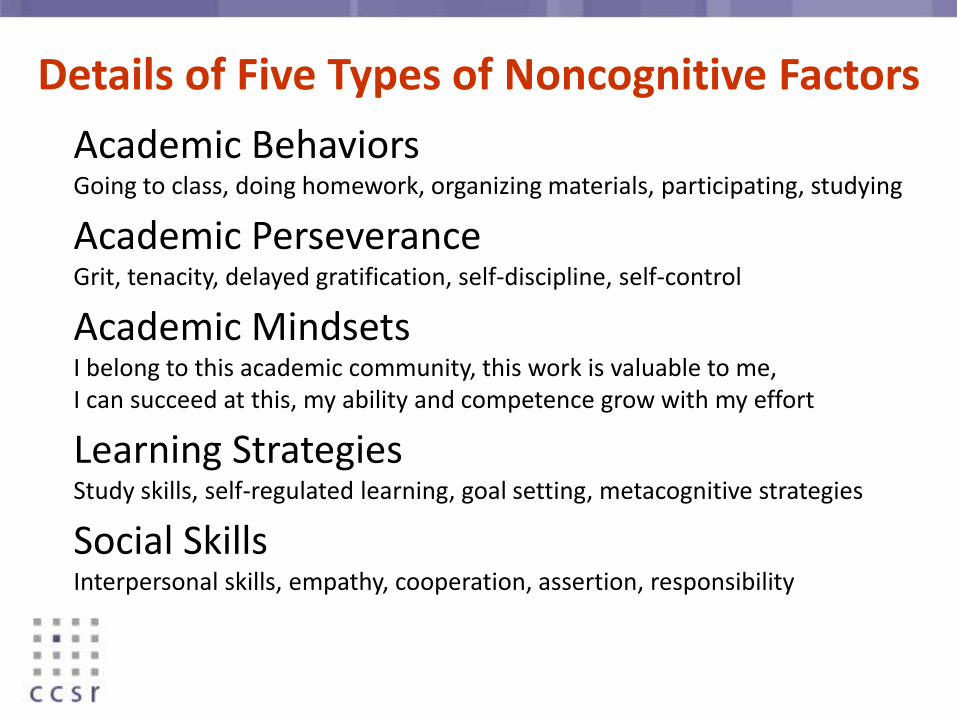
Academic Behaviors Going to class, doing homework, organizing materials, participating, studying
Academic Perseverance Grit, tenacity, delayed gratification, self-discipline, self-control
Academic Mindsets I belong to this academic community, this work is valuable to me, I can succeed at this, my ability and competence grow with my effort
Learning Strategies Study skills, self-regulated learning, goal setting, metacognitive strategies
Social Skills Interpersonal skills, empathy, cooperation, assertion, responsibility
Details of Five Types of Noncognitive Factors
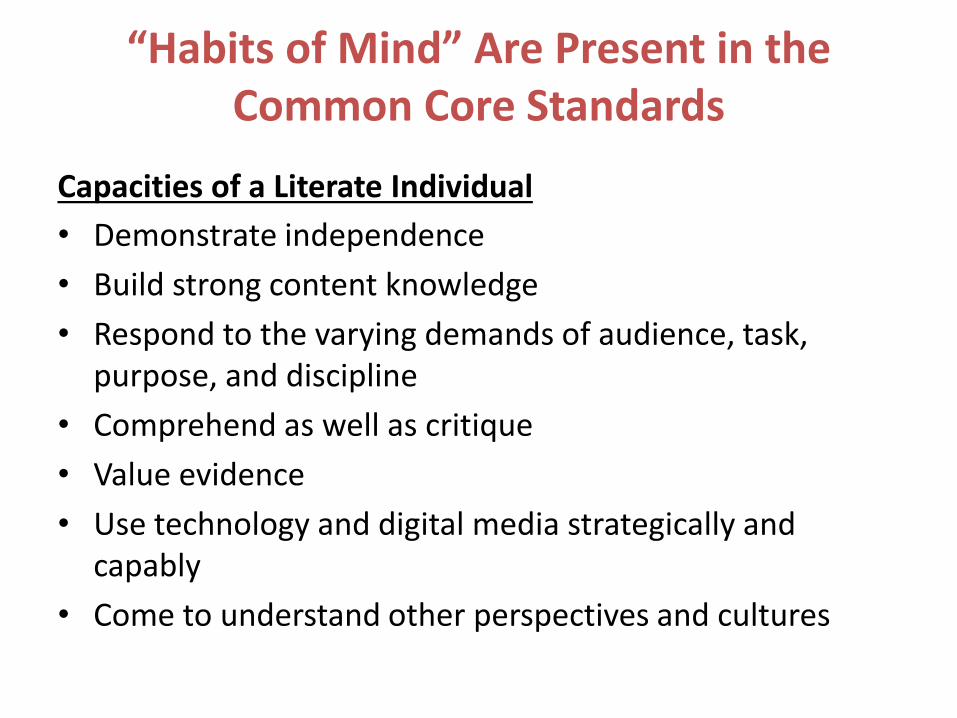
“Habits of Mind” Are Present in the Common Core Standards
Capacities of a Literate Individual
• Demonstrate independence
• Build strong content knowledge
• Respond to the varying demands of audience, task, purpose, and discipline
• Comprehend as well as critique
• Value evidence
• Use technology and digital media strategically and capably
• Come to understand other perspectives and cultures
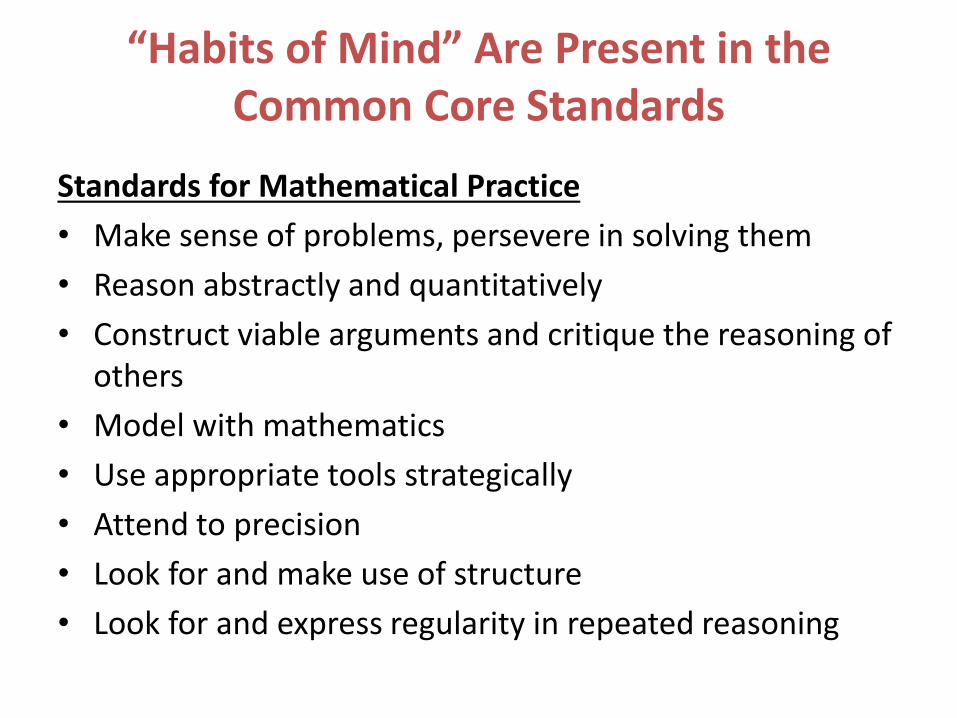
Standards for Mathematical Practice
• Make sense of problems, persevere in solving them
• Reason abstractly and quantitatively
• Construct viable arguments and critique the reasoning of others
• Model with mathematics
• Use appropriate tools strategically
• Attend to precision
• Look for and make use of structure
• Look for and express regularity in repeated reasoning
“Habits of Mind” Are Present in the Common Core Standards
Y
OU
TH D
EVEL
OP
MEN
T EX
ECU
TIV
ES
OF
KIN
G C
OU
NTY
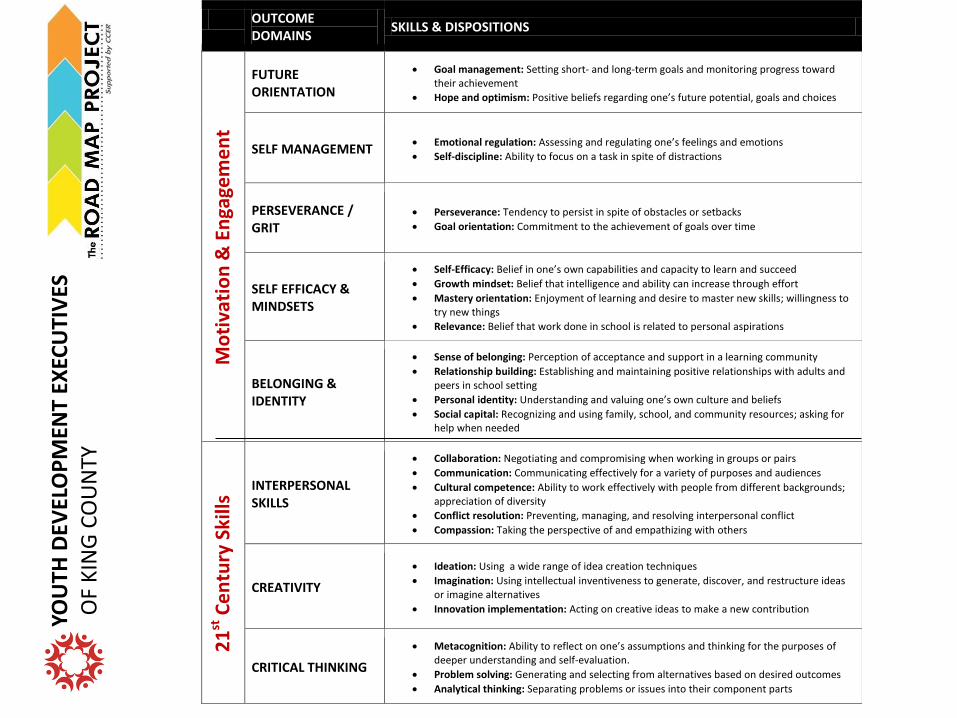
YOUTH DEVELOPMENT EXECUTIVES OF KING COUNTY
OUTCOME DOMAINS
SKILLS & DISPOSITIONS
Mo
tiva
tio
n &
En
gage
me
nt
FUTURE ORIENTATION
Goal management: Setting short- and long-term goals and monitoring progress toward their achievement
Hope and optimism: Positive beliefs regarding one’s future potential, goals and choices
SELF MANAGEMENT Emotional regulation: Assessing and regulating one’s feelings and emotions
Self-discipline: Ability to focus on a task in spite of distractions
PERSEVERANCE / GRIT
Perseverance: Tendency to persist in spite of obstacles or setbacks
Goal orientation: Commitment to the achievement of goals over time
SELF EFFICACY & MINDSETS
Self-Efficacy: Belief in one’s own capabilities and capacity to learn and succeed
Growth mindset: Belief that intelligence and ability can increase through effort
Mastery orientation: Enjoyment of learning and desire to master new skills; willingness to try new things
Relevance: Belief that work done in school is related to personal aspirations
BELONGING & IDENTITY
Sense of belonging: Perception of acceptance and support in a learning community
Relationship building: Establishing and maintaining positive relationships with adults and peers in school setting
Personal identity: Understanding and valuing one’s own culture and beliefs
Social capital: Recognizing and using family, school, and community resources; asking for help when needed
21
st C
en
tury
Ski
lls INTERPERSONAL
SKILLS
Collaboration: Negotiating and compromising when working in groups or pairs
Communication: Communicating effectively for a variety of purposes and audiences
Cultural competence: Ability to work effectively with people from different backgrounds; appreciation of diversity
Conflict resolution: Preventing, managing, and resolving interpersonal conflict
Compassion: Taking the perspective of and empathizing with others
CREATIVITY
Ideation: Using a wide range of idea creation techniques
Imagination: Using intellectual inventiveness to generate, discover, and restructure ideas or imagine alternatives
Innovation implementation: Acting on creative ideas to make a new contribution
CRITICAL THINKING
Metacognition: Ability to reflect on one’s assumptions and thinking for the purposes of deeper understanding and self-evaluation.
Problem solving: Generating and selecting from alternatives based on desired outcomes
Analytical thinking: Separating problems or issues into their component parts
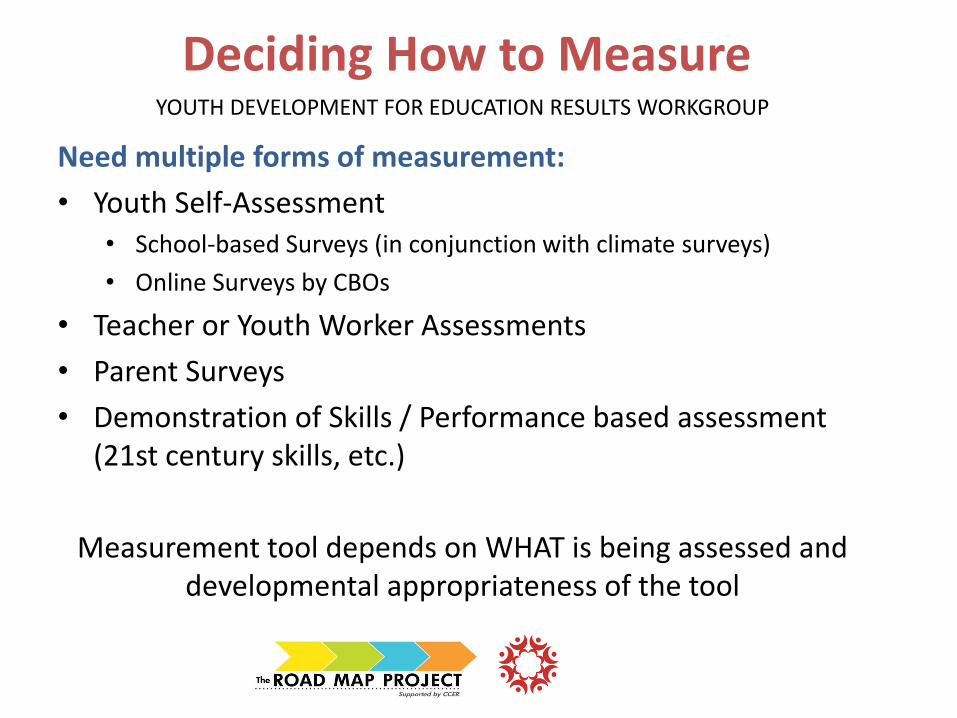
YOUTH DEVELOPMENT FOR EDUCATION RESULTS WORKGROUP
Need multiple forms of measurement:
• Youth Self-Assessment • School-based Surveys (in conjunction with climate surveys)
• Online Surveys by CBOs
• Teacher or Youth Worker Assessments
• Parent Surveys
• Demonstration of Skills / Performance based assessment (21st century skills, etc.)
Measurement tool depends on WHAT is being assessed and developmental appropriateness of the tool
Deciding How to Measure
YOUTH DEVELOPMENT FOR EDUCATION RESULTS WORKGROUP
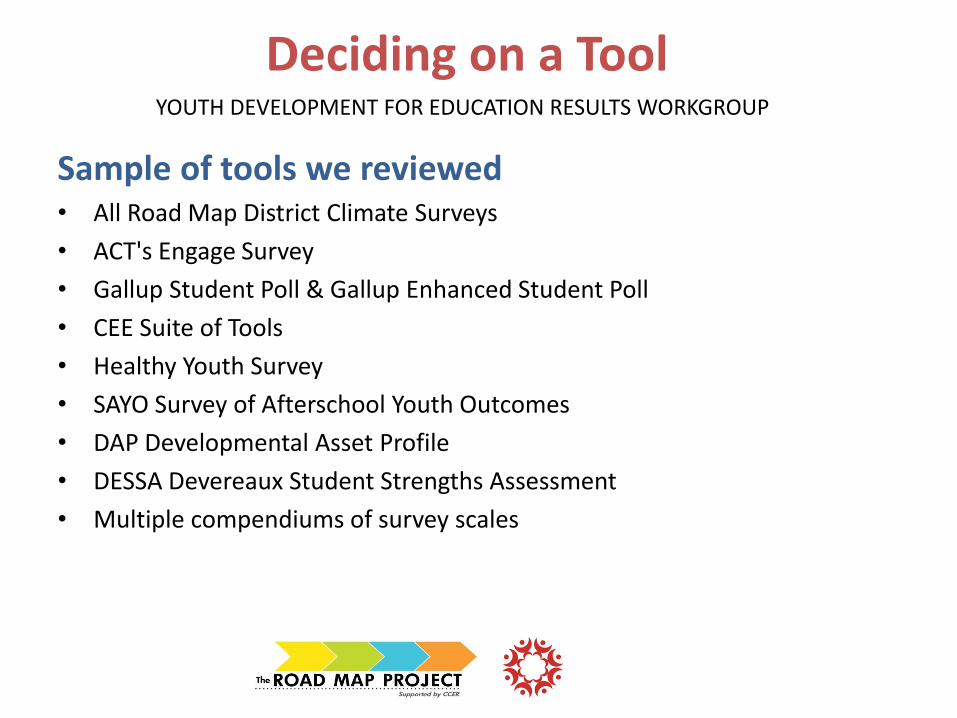
Sample of tools we reviewed • All Road Map District Climate Surveys
• ACT's Engage Survey
• Gallup Student Poll & Gallup Enhanced Student Poll
• CEE Suite of Tools
• Healthy Youth Survey
• SAYO Survey of Afterschool Youth Outcomes
• DAP Developmental Asset Profile
• DESSA Devereaux Student Strengths Assessment
• Multiple compendiums of survey scales
Deciding on a Tool
YOUTH DEVELOPMENT FOR EDUCATION RESULTS WORKGROUP
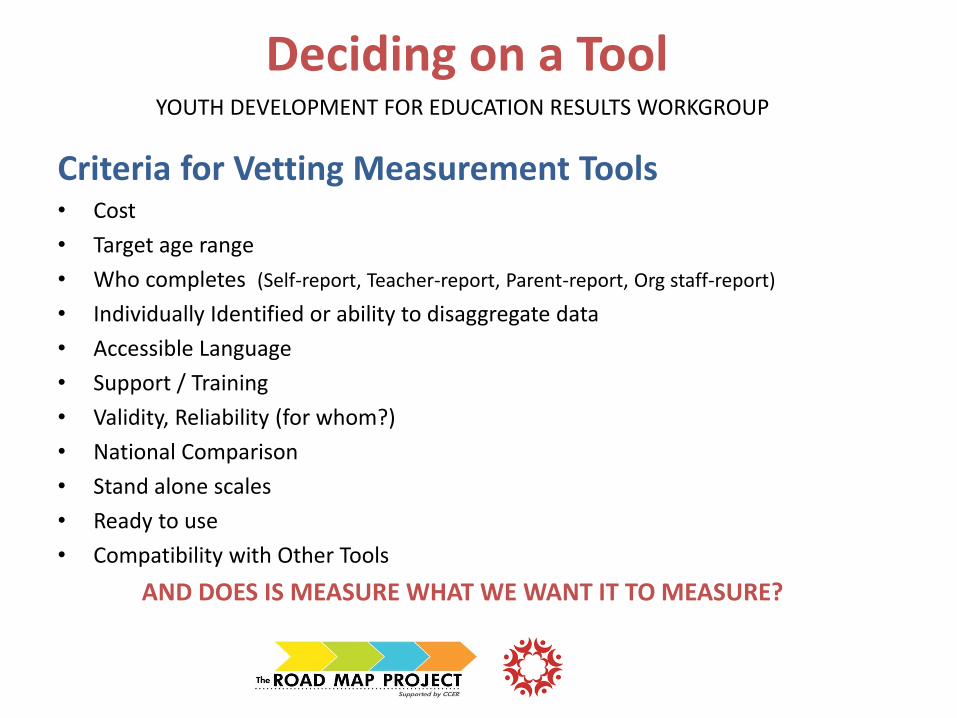
Criteria for Vetting Measurement Tools • Cost
• Target age range
• Who completes (Self-report, Teacher-report, Parent-report, Org staff-report)
• Individually Identified or ability to disaggregate data
• Accessible Language
• Support / Training
• Validity, Reliability (for whom?)
• National Comparison
• Stand alone scales
• Ready to use
• Compatibility with Other Tools
AND DOES IS MEASURE WHAT WE WANT IT TO MEASURE?
Deciding on a Tool
YOUTH DEVELOPMENT FOR EDUCATION RESULTS WORKGROUP
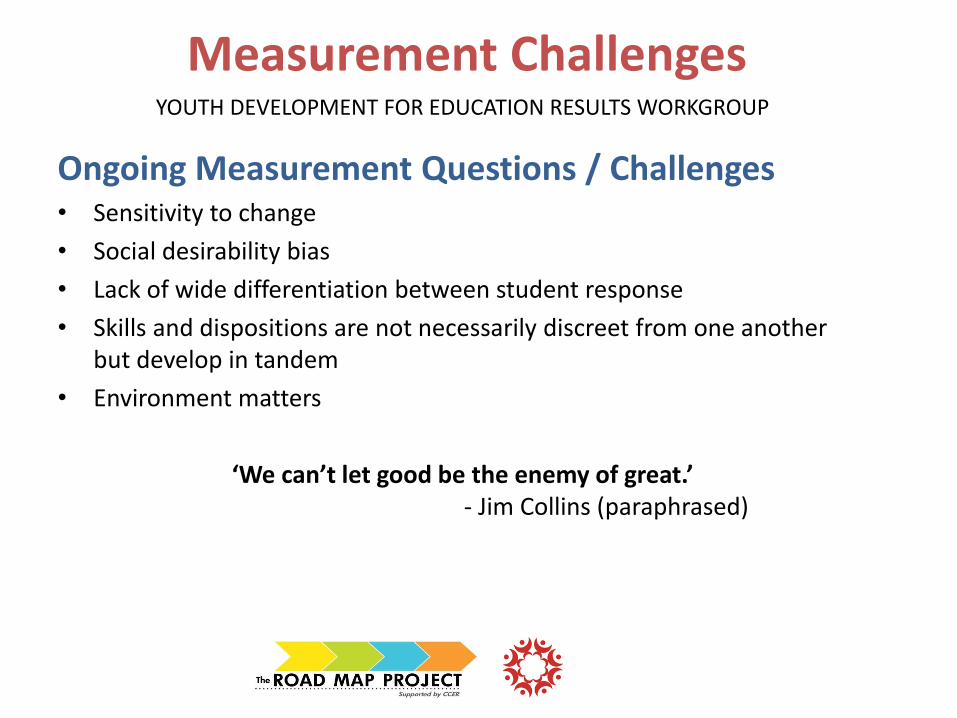
Ongoing Measurement Questions / Challenges • Sensitivity to change
• Social desirability bias
• Lack of wide differentiation between student response
• Skills and dispositions are not necessarily discreet from one another but develop in tandem
• Environment matters
‘We can’t let good be the enemy of great.’ - Jim Collins (paraphrased)
Measurement Challenges
YOUTH DEVELOPMENT EXECUTIVES OF KING COUNTY
School-Based Survey Tool Objectives
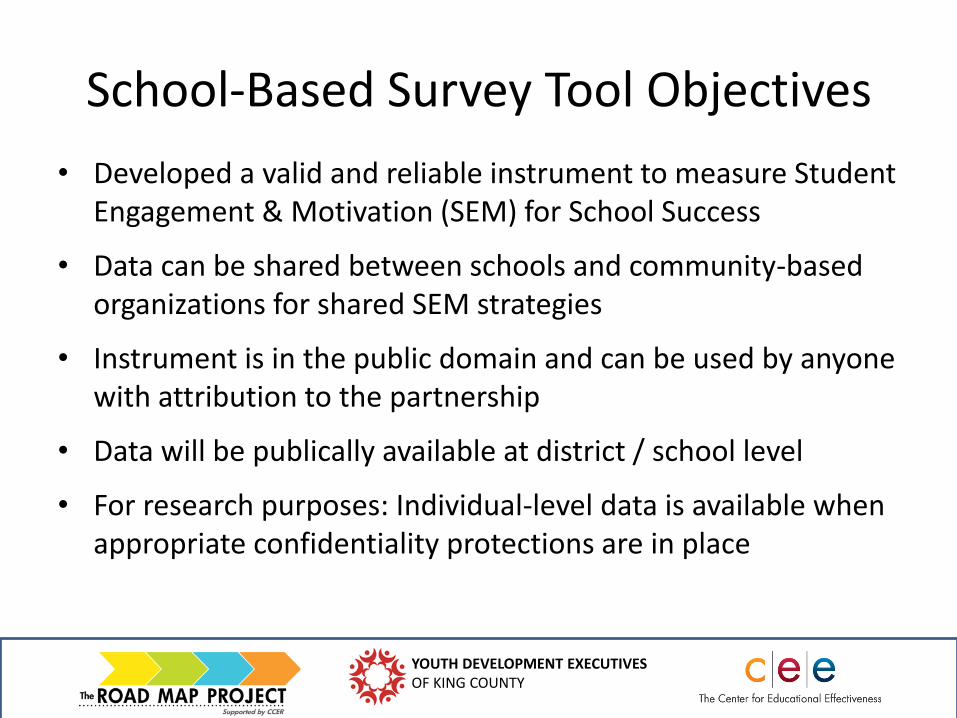
• Developed a valid and reliable instrument to measure Student Engagement & Motivation (SEM) for School Success
• Data can be shared between schools and community-based organizations for shared SEM strategies
• Instrument is in the public domain and can be used by anyone with attribution to the partnership
• Data will be publically available at district / school level
• For research purposes: Individual-level data is available when appropriate confidentiality protections are in place
YOUTH DEVELOPMENT EXECUTIVES OF KING COUNTY
Process / Timeline In 2012:
• Workgroup performed thorough research and instrument review
• Designed items and scales, expert review, refinement
• Pre-tested with middle-school students
• Refinement based on pre-tests, expert review led to pilot survey
• Translation (Spanish) and creation of pilot kits for Renton
In 2013:
• Analysis of pilot results (strong reliability and validity)
• Revised survey (learned from other research, removed/added items)
• Survey 2.0 version being given now
YOUTH DEVELOPMENT EXECUTIVES OF KING COUNTY
Renton Pilot • Renton Pilot sample: N=5,983 students
– Elementary students: N=701 (5th graders only)
– Middle School students: N=1,887
– High School students: N=3,090
• Response-rate: >90%
• CEE extended the pilot
– Outside of the Road Map, CEE piloted survey in 39 schools in 5 districts spanning entire spectrum of performance and challenges (final N exceeded 12,000 responses)
YOUTH DEVELOPMENT EXECUTIVES OF KING COUNTY
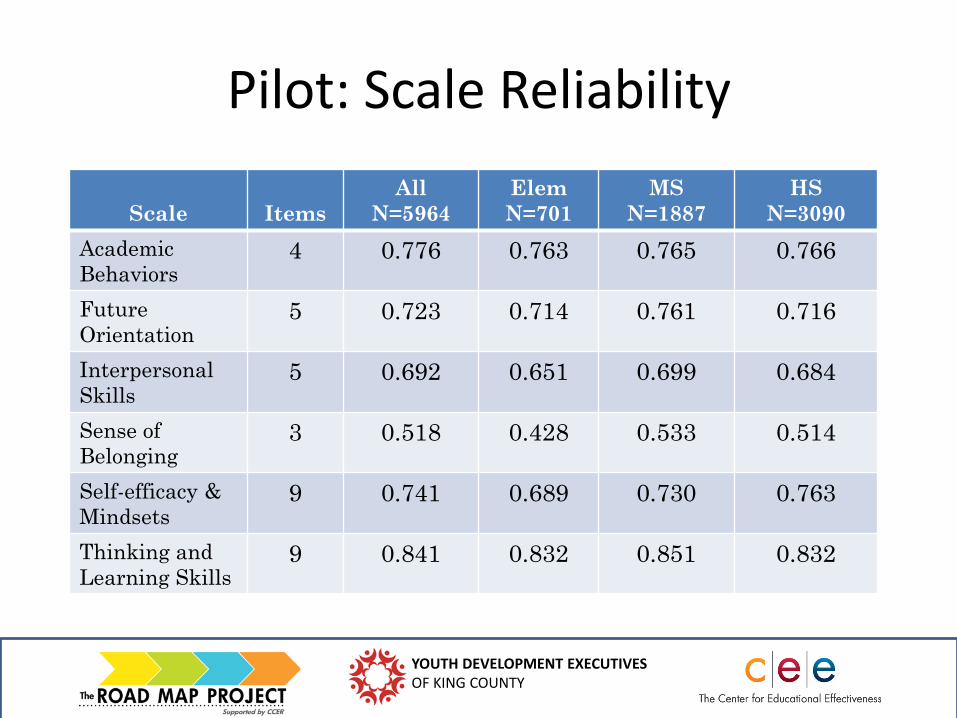
Pilot: Scale Reliability
Scale
Items
All
N=5964
Elem
N=701
MS
N=1887
HS
N=3090
Academic
Behaviors 4 0.776 0.763 0.765 0.766
Future
Orientation 5 0.723 0.714 0.761 0.716
Interpersonal
Skills 5 0.692 0.651 0.699 0.684
Sense of
Belonging 3 0.518 0.428 0.533 0.514
Self-efficacy &
Mindsets 9 0.741 0.689 0.730 0.763
Thinking and
Learning Skills 9 0.841 0.832 0.851 0.832
YOUTH DEVELOPMENT EXECUTIVES OF KING COUNTY
Learning from the Pilot
• Reliability- reasonably strong
• Positive relationship between Student Engagement , Motivation, and Thinking and Learning skills and academic achievement
– Relationships are both significant and reasonably strong.
• Refinement focus
– Fine tuning items and scales
– Reflect 2013 Chicago Consortium Pilot findings
District Perspective on Student Surveys
• Recognize importance of non-cognitive factors for being ready for college and the workplace
• Student views and engagement are part of the district’s new strategic plan
• Administered pilot survey in December 2012 (23 schools with nearly 6,000 students in grades 5-12)
• Takes 10 minutes to complete
• CEE provided detailed reports for each school and the entire district
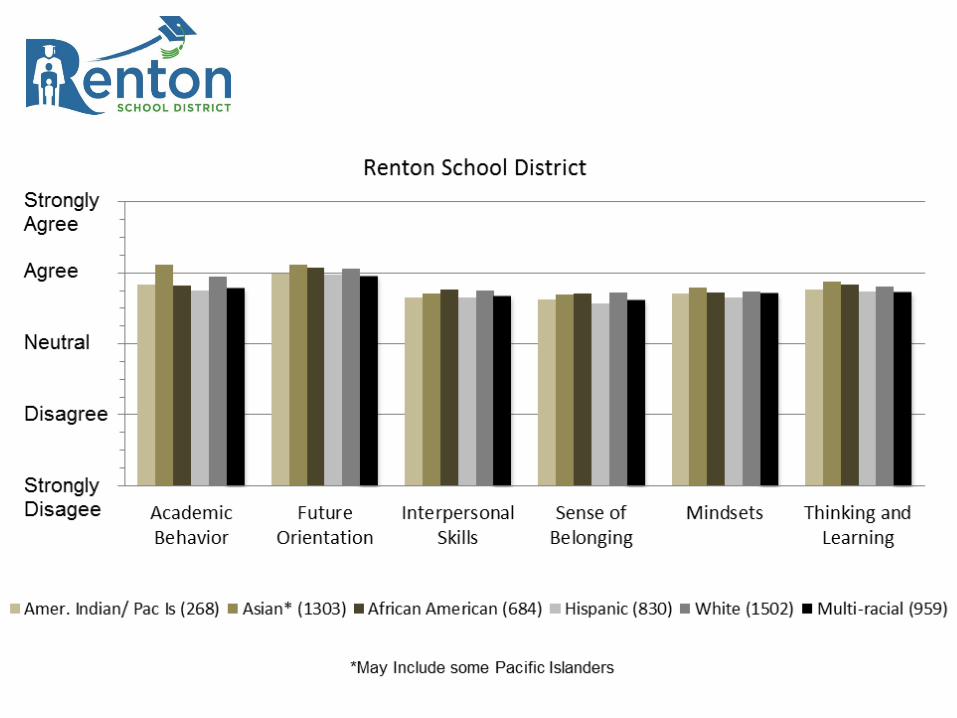
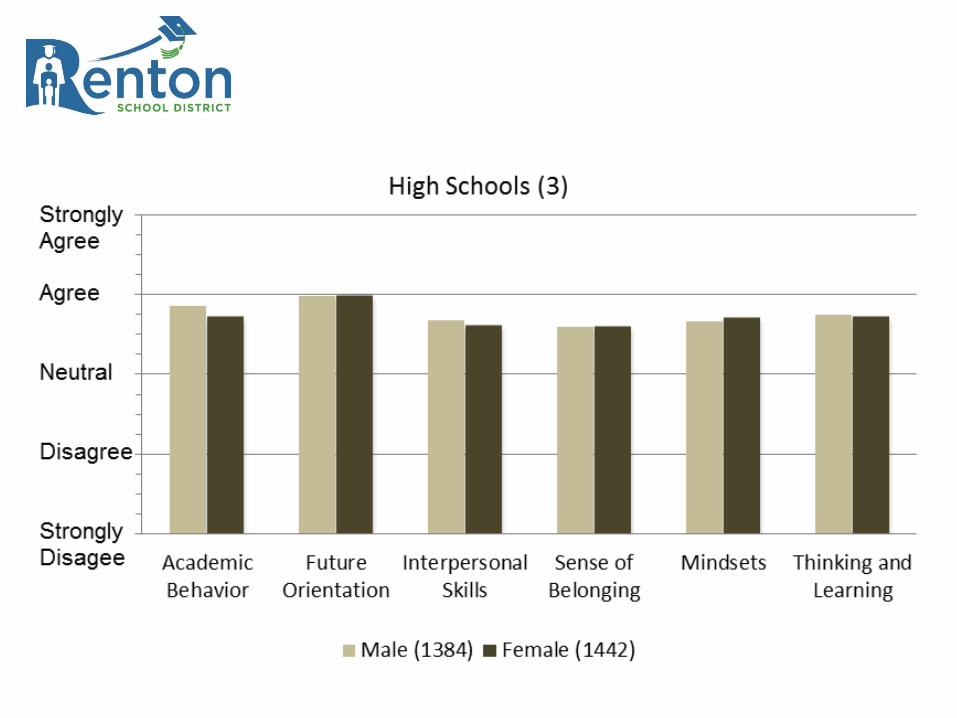
Overall Results from Pilot
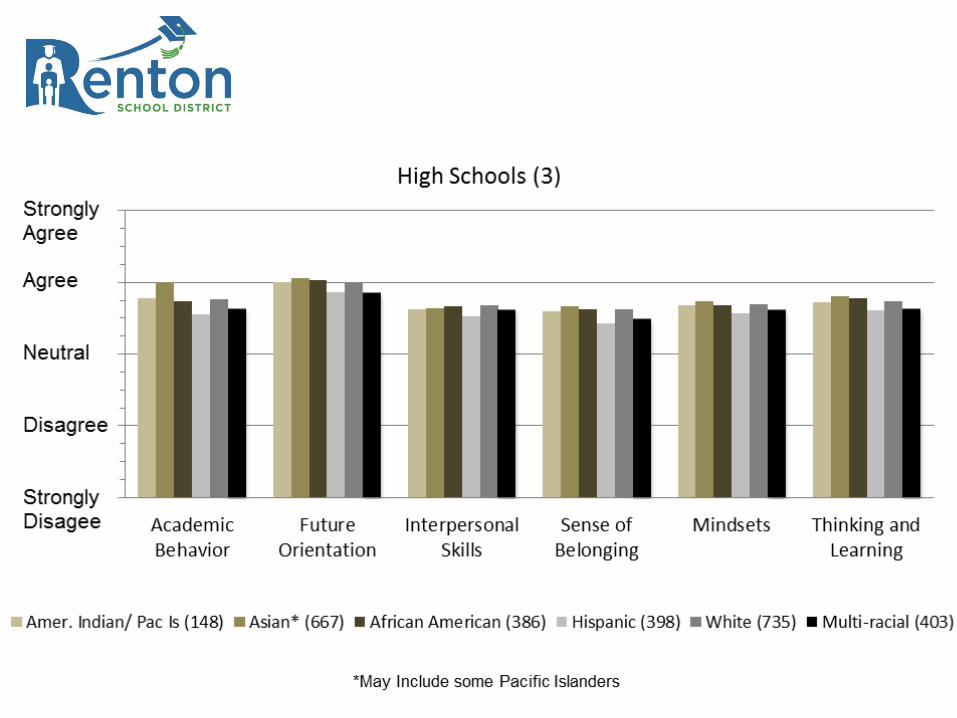
• In almost all categories, elementary schools had the highest scores, high schools and alternative schools had the lowest scores
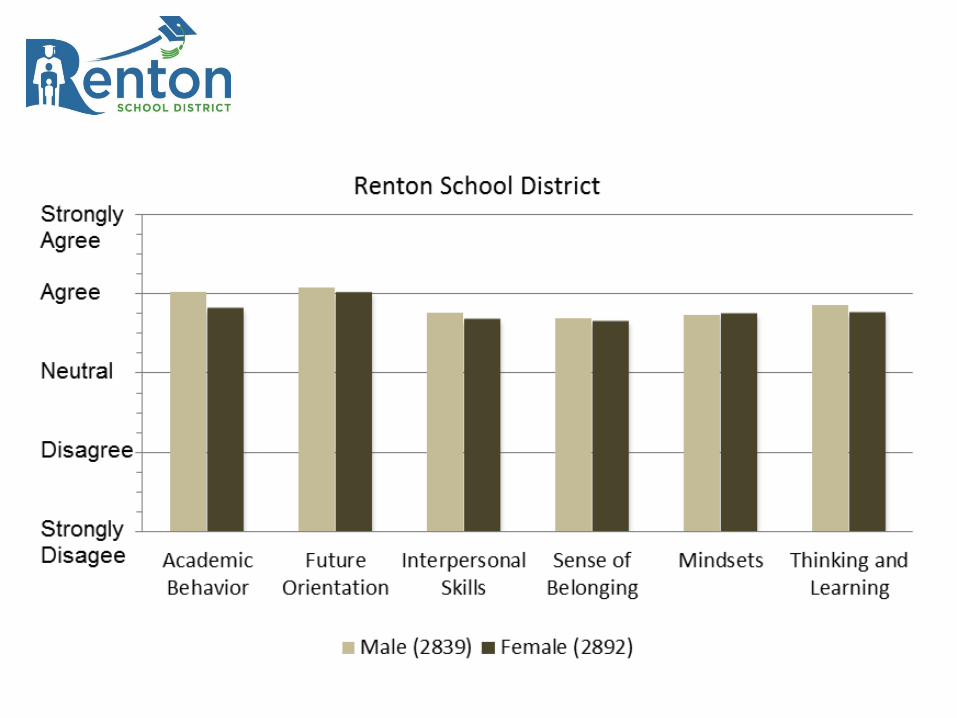
• Males scored higher than females in elementary but not in middle or high schools
• Asians scored higher than other students on Academic Behavior and Future Orientation
• Hispanics scored lower than others in all categories
• Higher scores for Academic Behavior and Future Orientation Lower scores on Interpersonal Skills, Sense of Belonging, Mindsets
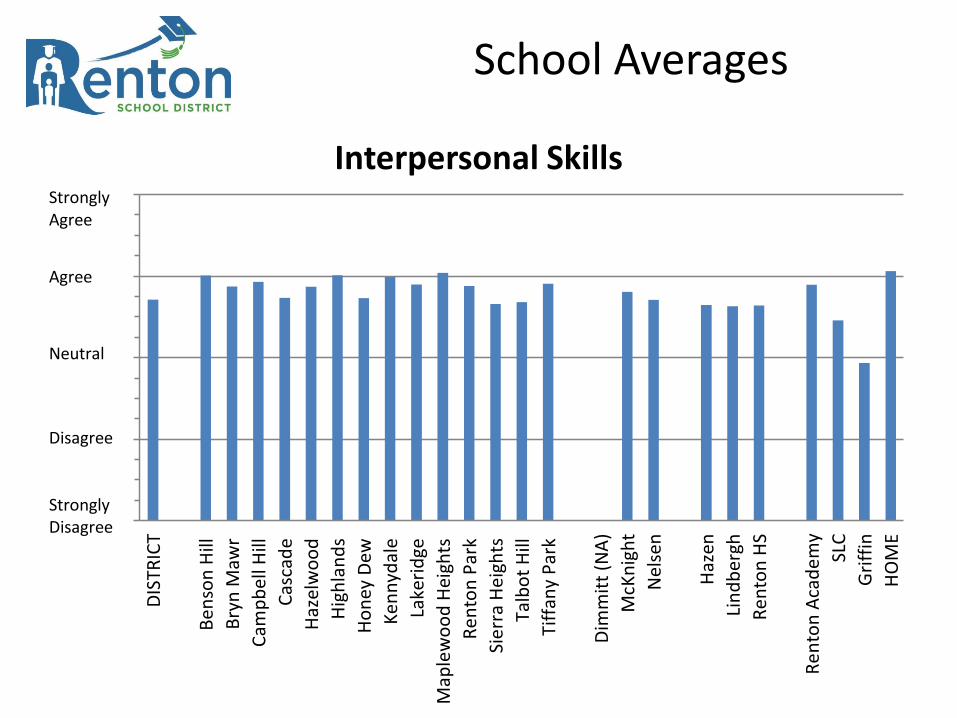
• Some schools had higher scores than others
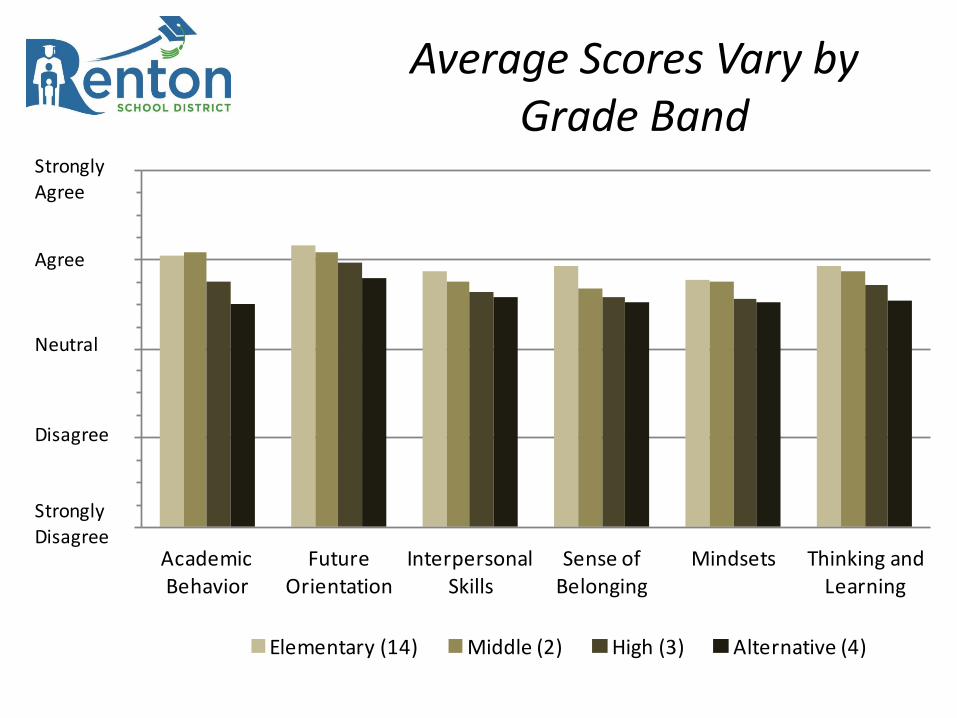
Average Scores Vary by Grade Band
1.00
2.00
3.00
4.00
5.00
Academic Behavior
Future Orientation
Interpersonal Skills
Sense of Belonging
Mindsets Thinking and Learning
Elementary (14) Middle (2) High (3) Alternative (4)
Strongly Agree
Agree
Neutral
Disagree
StronglyDisagree
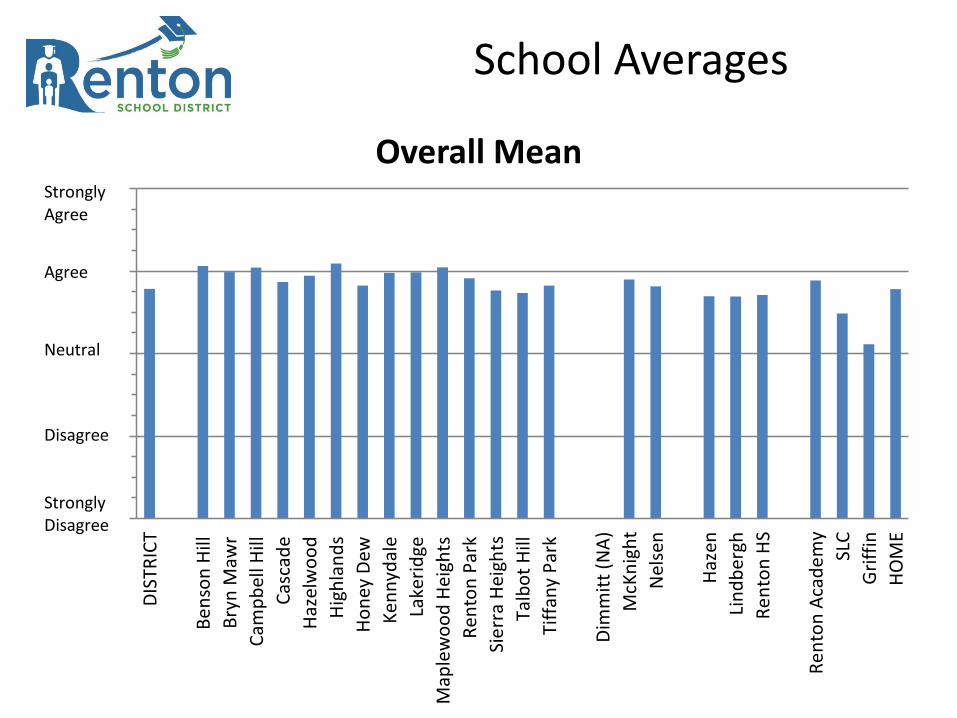
School Averages
1.00
2.00
3.00
4.00
5.00
DIS
TRIC
T
Be
nso
n H
ill
Bry
n M
awr
Cam
pb
ell H
ill
Cas
cad
e
Haz
elw
oo
d
Hig
hla
nd
s
Ho
ney
Dew
Ke
nn
ydal
e
Lake
rid
ge
Map
lew
oo
d H
eigh
ts
Re
nto
n P
ark
Sie
rra
Hei
ghts
Talb
ot
Hill
Tiff
any
Par
k
Dim
mit
t (N
A)
McK
nig
ht
Nel
sen
Haz
en
Lin
db
ergh
Re
nto
n H
S
Re
nto
n A
cad
em
y
SLC
Gri
ffin
HO
ME
Overall MeanStrongly Agree
Agree
Neutral
Disagree
StronglyDisagree
School Averages
1.00
2.00
3.00
4.00
5.00
DIS
TRIC
T
Be
nso
n H
ill
Bry
n M
awr
Cam
pb
ell H
ill
Cas
cad
e
Haz
elw
oo
d
Hig
hla
nd
s
Ho
ney
Dew
Ke
nn
ydal
e
Lake
rid
ge
Map
lew
oo
d H
eigh
ts
Re
nto
n P
ark
Sie
rra
Hei
ghts
Talb
ot
Hill
Tiff
any
Par
k
Dim
mit
t (N
A)
McK
nig
ht
Nel
sen
Haz
en
Lin
db
ergh
Re
nto
n H
S
Re
nto
n A
cad
em
y
SLC
Gri
ffin
HO
ME
Interpersonal SkillsStrongly Agree
Agree
Neutral
Disagree
StronglyDisagree
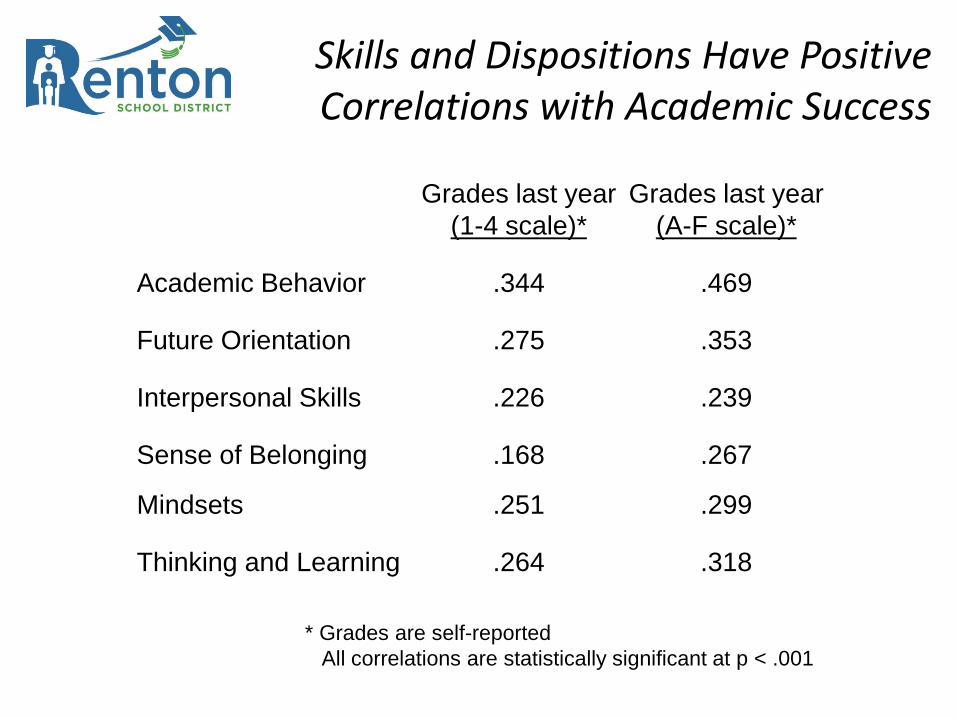
Skills and Dispositions Have Positive Correlations with Academic Success
Grades last year
(1-4 scale)*
Grades last year
(A-F scale)*
Academic Behavior .344 .469
Future Orientation .275 .353
Interpersonal Skills .226 .239
Sense of Belonging .168 .267
Mindsets .251 .299
Thinking and Learning .264 .318
* Grades are self-reported
All correlations are statistically significant at p < .001
• School and district staff reflect on results
• Set targets for improvement using baseline data
• Develop strategies to strengthen non-cognitive factors within and outside of school
• Find ways to involve community partners (CBOs and business)
• Plan for administration this year
What’s Next
Remaining Comments
and
Questions
Recommended