Independent Journal of Management &
Production
E-ISSN: 2236-269X
Instituto Federal de Educação, Ciência e
Tecnologia de São Paulo
Brasil
Stockler Ferreira, Caio; Gomes Salgado, Eduardo; Sanches Silva, Carlos Eduardo;
Pereira Mello, Carlos Henrique
REASONS AND BENEFITS ASSOCIATED WITH ISO 9001 CERTIFICATION FOR
SUGAR AND ETHANOL COMPANIES
Independent Journal of Management & Production, vol. 6, núm. 3, julio-septiembre, 2015,
pp. 623-642
Instituto Federal de Educação, Ciência e Tecnologia de São Paulo
Avaré, Brasil
Available in: http://www.redalyc.org/articulo.oa?id=449544331004
How to cite
Complete issue
More information about this article
Journal's homepage in redalyc.org
Scientific Information System
Network of Scientific Journals from Latin America, the Caribbean, Spain and Portugal
Non-profit academic project, developed under the open access initiative
INDEPENDENT JOURNAL OF MANAGEMENT & PRODUCTION (IJM&P)http://www.ijmp.jor.br v. 6, n. 3, July - September 2015 ISSN: 2236-269X DOI: 10.14807/ijmp.v6i3.301
[http://creativecommons.org/licenses/by/3.0/us/] Licensed under a Creative Commons Attribution 3.0 United States License
623
REASONS AND BENEFITS ASSOCIATED WITH ISO 9001 CERTIFICATION FOR SUGAR AND ETHANOL COMPANIES
Caio Stockler Ferreira
Federal University of Alfenas, Brazil E-mail: [email protected]
Eduardo Gomes Salgado
Federal University of Alfenas, Brazil E-mail: [email protected]
Carlos Eduardo Sanches Silva
Federal University of Itajubá, Brazil E-mail: [email protected]
Carlos Henrique Pereira Mello
Federal University of Itajubá, Brazil E-mail: [email protected]
Paulo Sampaio
University of Minho, Portugal E-mail: [email protected]
Submission: 17/02/2015
Revision: 02/03/2015 Accept: 13/03/2015
ABSTRACT
With increasing business competitiveness, companies have sought to
adapt their processes and / or products to worldwide established
quality standards in order to achieve a greater share of consumers
having as favorable aspect the quality assurance of the products
and/or services provided. It was observed that companies of different
sizes have different challenges regarding the certification, however
the degree of difficulty is the same for all of them. The objective of this
paper is to verify the reasons for the implementation of ISO 9001, the
obstacles encountered during the implementation, the benefits arising
from the use of the quality management system and the degree of
difficulty to implement this standard. This work was developed based
on a survey involving companies certified with ISO 9001:2008 from
the productive sector of sugar, ethanol and derivatives of sugarcane,
IJM&P
[http://creativecommons.org/licenses/by/3.0/us/] Licensed under a Creative Commons Attribution 3.0 United States License
624
INDEPENDENT JOURNAL OF MANAGEMENT & PRODUCTION (IJM&P) http://www.ijmp.jor.br v. 6, n. 3, July - September 2015 ISSN: 2236-269X DOI: 10.14807/ijmp.v6i3.301
located in all Brazilian states. It was observed that companies of different sizes have
different challenges regarding the certification however the degree of difficulty is the
same for all of them. Thus, we believe that expected results represent a very
important contribution to examining the reasons, benefits and difficulties of the ISO
9001 to both, the companies and certification bodies, and to researchers.
Keywords: NBR ISO 9001, sugar, ethanol.
1. INTRODUCTION
The national policy, described by the Brasil (2011), for the production of
sugarcane is oriented on the sustainable expansion of the culture, based on
economic, environmental and social criteria. The Agro-Ecological Zoning of
Sugarcane Program (ZAEcana) regulates the planting of sugarcane, taking into
consideration the environment and the region's economic aptitude. From a thorough
study, the best planting areas are stipulated based on the types of climate, soil,
biomass and irrigation requirements. A timetable is also planned, for gradual
reduction, by 2017, of the burning of sugarcane in areas where harvesting is
mechanized, prohibiting the planting in the Amazon, Pantanal, in the Upper
Paraguay River Basin (BAP) and in areas with native vegetation. The national sugar
and ethanol sector is a reference for other producing countries.
The sugarcane is produced in nearly the entire country, 60% in São Paulo.
The other producing areas are Paraná, Triângulo Mineiro and Zona da Mata
Nordestina. World leader in the production of sugarcane ethanol, Brazil has the
availability of arable land for sugarcane planting, without prejudice to other foods,
production technology and distribution structure. The country mastered the whole
cycle of ethanol production, from the high-productivity farming to the installation of
equipment for the distilleries that are producing this biofuel, from the fermentation of
the juice extracted from sugarcane.
Every organization would like to improve their operation, if that means a
steady increase in its market share, reducing costs, and managing risks more
effectively, improving customer satisfaction and corporate image. A quality
management system provides a structure to monitor and improve performance in
any area you choose.
[http://creativecommons.org/licenses/by/3.0/us/] Licensed under a Creative Commons Attribution 3.0 United States License
625
INDEPENDENT JOURNAL OF MANAGEMENT & PRODUCTION (IJM&P) http://www.ijmp.jor.br v. 6, n. 3, July - September 2015 ISSN: 2236-269X DOI: 10.14807/ijmp.v6i3.301
According to Debnath et al. (2010) and Kim (2009), the quality management
system ISO 9001, proposed by the International Organization for Standardization
(ISO) in 1987, represents the first international standard for the development of a
quality management system and it is used by nearly 1.1 million organizations in more
than 180 countries (ISO, 2013). This system helps all kinds of organizations wishing
to demonstrate the ability to consistently deliver a high quality product, greater
customer satisfaction, increased staff motivation and continual improvement.
According to Sampaio, Saraiva e Rodrigues (2011) the ISO 9001 certification
is considered one of the most effective tools used today for improving Quality
Management System (QMS). Given the strong growth of using these standards, a
great interest from companies regarding this practice has been observed (SAMPAIO;
SARAIVA; RODRIGUES, 2011). Since ISO 9001 gained popularity, many authors
attempted to understand its effects on businesses and in the world, such as:
Aggelogiannopoulos, Drosinos and Athanasopoulos (2007), Sampaio, Saraiva and
Rodrigues (2009); Saizarbitoria, Casadesús, Marimón (2011), Sampaio, Saraiva and
Rodrigues (2011), Alonso-Almeida, Marimon e Bernardo (2013) and Salgado et al.
(2014).
This paper aims to identify the benefits, reasons, obstacles and difficulty level
that companies of this sector had to implement and certify their Quality Management
System in accordance with ISO 9001:2008, correlated with the number of employees
and the time to get certified. The research is justified since the Brazilian agricultural
productive sector has developed increasingly; giving the country a major rise in
exports of their products and not being identified similar studies for this sector. The
cultivation of sugarcane is the third largest agricultural activity in terms of production
area and gross value produced, losing only to soybeans and corn that are the major
crops of the country, and in 2006 the crop had a gross value of about 19 billion reais,
according to the Brasil (2011). Since this sector is highly productive and profitable,
the search for new markets becomes a determining factor for further growth. Thus, it
is necessary to invest in quality management systems, because the market has
become more demanding and more critical of the quality of products.
Because of this necessity, the use of systems recognized worldwide has led
companies to implement ISO 9001 in their production process. Therefore, the
identification of obstacles encountered during implementation, the benefits
[http://creativecommons.org/licenses/by/3.0/us/] Licensed under a Creative Commons Attribution 3.0 United States License
626
INDEPENDENT JOURNAL OF MANAGEMENT & PRODUCTION (IJM&P) http://www.ijmp.jor.br v. 6, n. 3, July - September 2015 ISSN: 2236-269X DOI: 10.14807/ijmp.v6i3.301
generated by the use of the quality management system and the degree of difficulty
to implement this standard in companies of the sugar and ethanol sector are needed
by the importance of this sector to the country, and the fact that other sugar and
ethanol companies are still not certified.
The study was conducted in three stages. The first consisted of a literature
review on the sugar and ethanol industry and the quality management system ISO
9001. This stage has been proved as of great importance to the implementation of a
QMS, as well as the importance of the sugarcane culture in the national economy.
In the second stage, a survey was carried out on sugarcane companies that
have the QMS certified in ISO 9001:2008, which could participate in the field-
research. Besides that, the questionnaire of Bhuiyan and Alam (2004) was chosen to
perform the data collection. In the third stage, the compilation and analysis of data
was performed.
2. SUBMISSION INSTRUCTIONS
2.1. Sugar and ethanol sector
Introduced in the colonial period, the sugarcane became one of the main
cultures of the Brazilian economy. Brazil is not only the largest producer of
sugarcane. It is also the first in the world in the production of sugar and ethanol and
conquers, increasingly, the foreign market with the use of biofuel as an alternative
energy. Responsible for more than half of the sugar traded in the world, the country
should achieve an average rate of increase in production of 3.25% until 2018/19, and
harvest 47.34 million tons of the products, which correspond to an increase of 14.6
million tonnes compared to the period of 2007/2008. For exports, the expected
volume for 2019 is 32.6 million tons, according to the Brasil (2011).
To Scopinho (2000), in the mid-80s, a new phase of the productive
restructuring process began in the sugar and ethanol sector in Brazil. On one hand,
under the neoliberalism influence, the State failed to regulate more directly the sugar
and ethanol economy; the cut of subsidies and stimulus programs to encourage the
production and commercialization forced it to dispute spaces in domestic and foreign
markets, increasingly competitive in these times of economic globalization. On the
other hand, social movements reacted more strongly against the abuses that have
[http://creativecommons.org/licenses/by/3.0/us/] Licensed under a Creative Commons Attribution 3.0 United States License
627
INDEPENDENT JOURNAL OF MANAGEMENT & PRODUCTION (IJM&P) http://www.ijmp.jor.br v. 6, n. 3, July - September 2015 ISSN: 2236-269X DOI: 10.14807/ijmp.v6i3.301
been committed by the sugar and ethanol companies, especially with regard to the
exploitation of the environment and workers.
According to Paulillo and Soares (2008), governments, as funder and
promoter of development, acting more discreetly in providing supplies to the sector,
has forced companies to seek new investments. Given that the options of the
domestic credit market, with high interest rates and fees, have not favored the
development of the sector. The biofuel companies have sought alternatives; among
the most quoted is the capital market, since there is a great need for investment to
meet the growing demand for sugar, ethanol and biodiesel. However the sugarcane
and ethanol sector is traditionally dominated by family businesses which have
hampered the acceptance of the industry in the capital market, besides being a new
industry and full of uncertainties. However these companies have adopted a system
of corporate governance, which has given more credibility and confidence to the
sector, a fact that is being observed in the Sao Paulo Stock Exchange (BOVESPA).
2.2. ISO 9001 Standard
The ISO 9001 certification is considered one of the best and most effective
tools used for guidance of a Quality Management System (QMS). Given the strong
growth of these patterns, a great interest from enterprises as regards this practice
has been observed (RODRIGUES; SARAIVA; SAMPAIO, 2011). In addition, Levine
and Toffel (2010), implementing a QMS in accordance with ISO 9001 implies suiting
operational procedures documentation, training, internal audit and corrective action
procedures, in addition to requiring that the procedures to improve existing
processes, be also implemented.
The basis of the model proposed by ISO 9001 consists of three key aspects:
customer satisfaction, which says that a quality system is only effective if it ensures
full customer satisfaction; the continuous improvement, in which the organization
needs to demonstrate that it has processes for continual improvement of the
effectiveness of its quality management system; and finally the focus on processes,
which directs the company to a more systemic and correct view of their activities,
seeing the organization horizontally.
[http://creativecommons.org/licenses/by/3.0/us/] Licensed under a Creative Commons Attribution 3.0 United States License
628
INDEPENDENT JOURNAL OF MANAGEMENT & PRODUCTION (IJM&P) http://www.ijmp.jor.br v. 6, n. 3, July - September 2015 ISSN: 2236-269X DOI: 10.14807/ijmp.v6i3.301
2.2.1. Reasons e benefits
According to Heras et al. (2008), the conclusions regarding the effectiveness
of ISO 9001 in the industrial sector have been diverse, that's because some studies
claim that its implementation is something beneficial for organizations, while in other
studies, there are doubts about this conclusion. According to Rusjan and Alic (2010),
these internally motivated companies, strive to maintain an effective and efficient
QMS, and not just to get the certification. Such companies are not only interested in
the formal aspect of the standard and its requirements to be met in order to be
certified, but also the recommendations of satisfaction for continuous improvement
established by ISO. These recommendations become especially important for those
organizations that are involved in showing the basic principles of quality
management, which represent the proper and efficient basis of the implementation of
a QMS, showing that companies have understood the spirit behind the requirements
of the standard.
It should be emphasized that a quality management system can contribute to
the efficient performance of a company, whether it is presented effective and
connected to your business strategy, because can be used in a proactive way to
contend with market changes and adverse economic situations (LAM et al. 2011;
ANDRADA; ALMEIDA; ANTÓN 2011). As a result, we have a competent QMS,
enabling organizational improvements, rationalization and business improvement
(particularly with regard to reducing the cost of poor quality), and most importantly,
an increase in income of the company following the improvements in product quality.
This system contributes to achieving the goals of the business and an improvement
in the overall performance of the organization. According to Magd and Curry (2003),
where ISO 9001 is implemented properly, it contributes to the achievement of
different business goals.
Many researchers, for example, Leung, Chan and Lee (1999); Karapetrovic
and Willborn (2001); Magd and Curry (2003); Sampaio, Saraiva; Rodrigues (2010);
Alolayyan et al. (2011); Souza Junior et al. (2014); Rauber et al. (2014) and Salgado
et al. (2014) mention several types of benefits achieved by implementing the ISO or
TQM (Total Quality Management), which can be grouped into four groups such as:
benefits related by the customer perspective, benefits related to the internal process
[http://creativecommons.org/licenses/by/3.0/us/] Licensed under a Creative Commons Attribution 3.0 United States License
629
INDEPENDENT JOURNAL OF MANAGEMENT & PRODUCTION (IJM&P) http://www.ijmp.jor.br v. 6, n. 3, July - September 2015 ISSN: 2236-269X DOI: 10.14807/ijmp.v6i3.301
perspective, benefits related to learning and development perspective, and benefits
related to the achievement of economic goals and better financial performance.
2.2.2. Obstacles and difficulties
Despite the countless benefits a correct implementation of ISO 9001 can
bring, some negative aspects are encountered during the process of adapting the
company. In accord to Pinto, Carvalho and Ho (2006), the greatest difficulties in
implementation are: the complexity of the operations performed by the organization,
the unavailability of internal staff to conduct trainings and meetings, the preparation
of relevant documents for certification, the calculation of costs and gains with the
program, and the availability of leaders for the implementation.
Moreover, although many companies have a quality management system with
ISO 9001 and / or other certifications, many of them face in their day-to-day life
difficulty in ensuring that the system is “running” that is really in proper functioning so
that it can objectively bring the quality benefits expected for their products,
processes and in relation to their customers and suppliers.
3. RESEARCH METHOD
The survey research or survey is a method of collecting information directly
with people about their ideas, feelings, health, plans, beliefs and social, educational
and financial background or about the unit, company or organization they operate. A
survey can be performed by using a questionnaire where one completes the
information with or without assistance. This questionnaire can be sent by mail or
email. The survey can be further developed through personal interviews or
telephone, as Fink and Kosecoff (1998) and Forza (2002). The survey provides
information on large populations with a high level of accuracy, according to Forza
(2002).
The questionnaire was prepared in accordance with factors, processes,
variables and scales for the ratios, barriers, benefits and level of difficulty for the
implementation of ISO 9001. The survey of sugar and ethanol companies certified
with ISO 9001 was carried out through their registry on the INMETRO website,
consulted in August 2010, whose contact was established through electronic mail (e-
mail) and telephone from August to December 2010.
[http://creativecommons.org/licenses/by/3.0/us/] Licensed under a Creative Commons Attribution 3.0 United States License
630
INDEPENDENT JOURNAL OF MANAGEMENT & PRODUCTION (IJM&P) http://www.ijmp.jor.br v. 6, n. 3, July - September 2015 ISSN: 2236-269X DOI: 10.14807/ijmp.v6i3.301
The first step was to validate the questionnaire used, so that the information
obtained by respondents corresponded to reality, even being their personal opinion.
To evaluate if a questionnaire has reliable variables an internal validation can be
used, which refers to how well the instrument measures what it is proposed to
measure, and also using the external validation, which relates in order to infer a
possible situation in the population, and if the results are generalizable, according
Giuffre (1997a, 1997b).
To determine the reliability of the questionnaire, the degree of homogeneity of
the set of responses by Cronbach's alpha was calculated, since it provides internal
consistency values, enabling to evaluate the scale used, as Hair JR. et al. (2005).
The internal validity indicates the conditions of application of the instrument, in this
case the questionnaire. However there is no absolute standard of values for Nunnaly
and Bernstein (1994) and Hair Jr et al. (2005) the values of Cronbach's alpha equal
to or above 0.70 reflect an acceptable reliability. However, Malhotra (2006)
recommends as a decision criterion for "Cronbach's alpha to be considered
acceptable, indices above 0.6, and the closer to 1, the greater the reliability." In this
work we calculated Cronbach's alpha using the software Minitab 15 ® and the lowest
value found was 0.9498, which can be considered acceptable.
In this paper was used the method of regression "Partial Least Squares" or
PLS that applies when there are: multiple dependent variables, highly correlated
predictors, more predictors than observations, according to Yacoub and MacGregor
(2003), Helland (1988). The PLS method reduces the number of predictors to a set
of principal components. Therefore, PLS is a method which seeks to form
components that capture the maximum information of the variables X and that is
useful for predicting Yi, while reducing the dimensionality of the problem of
regression by using a smaller number of components than original variables.
The correlation analysis using the PLS, calculates through the software
Minitab 15 ®, uses the algorithm NIPALS (Nonlinear Iterative Partial Least Squares).
The NIPALS is an extension of the PLS used for multivariate data analysis. As in
PLS, the NIPALS is used in cases where all dependent variables are provided
simultaneously, according to Sena and Poppi (2004).
[http://creativecommons.org/licenses/by/3.0/us/] Licensed under a Creative Commons Attribution 3.0 United States License
631
INDEPENDENT JOURNAL OF MANAGEMENT & PRODUCTION (IJM&P) http://www.ijmp.jor.br v. 6, n. 3, July - September 2015 ISSN: 2236-269X DOI: 10.14807/ijmp.v6i3.301
The PLS model and a residual analysis to verify their normality were
performed. In case of abnormality of the waste, you eliminate its generating element
and recalculate the model. The process is repeated until normality of the residuals is
obtained and only then the analysis of the PLS results is performed. Data normality
was obtained in the analysis of residues.
One major issue that arises in the Principal Component Analysis is the
criterion for choosing the number of components to retain. Kim and Mueller (1978)
report that the most popular methods are: Kaiser, which proposes to consider only
the eigenvalues greater than one, demonstrating that these values would be the
statistically significant. But this condition is not sufficient. Not all eigenvalues greater
than one correspond to components with apparent significance, and the eigenvalues
Diagram : consists of observing the diagram of eigenvalues and conserving the ones
situated above the break point of the fall of the curve of the function that relates the
order and the eigenvalues. Thus, if two factors are associated with almost equal
eigenvalues, they represent the same proportion of variability and there is no reason,
a priori, to keep one and not the other. However, a strong decrease between two
successive eigenvalues follows in conserving the predecessor factors in the
interpretation.
After data collection, statistical analyzes were performed on the number of
employees and in relation to the time to get certified. For both data (time to obtain
and number of employees), it was performed residual analyzes, number of principal
components, variance analysis, determination of factors and alpha Cronbach.
4. DISCUSSION OF THE RESULTS
The authors identify 49 certified companies from the sugar and ethanol
industry in Brazil. For a confidence level of 95%, the total number of companies
required for consultation is 47. Thus, 47 companies were invited to participate in the
survey. However 20 contributed by answering the questionnaire. So the survey
counted with the participation of a sample of 40.8% relative to the total identified, as
shown in Table 1.
Table 1: Sampling of the survey Total of certified
companies Companies surveyed
Level of confidence
Respondent companies
Participation rate
49 47 95% 20 40,8%
[http://creativecommons.org/licenses/by/3.0/us/] Licensed under a Creative Commons Attribution 3.0 United States License
632
INDEPENDENT JOURNAL OF MANAGEMENT & PRODUCTION (IJM&P) http://www.ijmp.jor.br v. 6, n. 3, July - September 2015 ISSN: 2236-269X DOI: 10.14807/ijmp.v6i3.301
The distribution of the participating companies by size is presented in Table 2.
There is a predominance of companies with over 1,000 employees, followed by
companies with 201-500 employees.
Table 3 shows the distribution by how long the companies have been certified
for. There is a predominance of companies certified for more than 5 years,
representing 80% of the companies surveyed.
Table 2: Distribution of companies by size
Companies Size Total % up to 20 employees 2 10 21-50 employees 1 5 51-100 employees 2 10
100-200 employees 0 0 200-500 employees 5 25 501-1000 employees 3 15 Over 1000 employees 7 35
Total 20 100
Table 3: Distribution of companies by time of certification
Time of ISO 9001 certification Total % certified under 1 year 0 0 1 to 2 years certified 0 0 2 to 3 years certified 3 15 3 to 5 years certified 1 5 over 5 years certified 16 80
Total 20 100
The external validation of the questionnaire is ensured by the respondents’
reliability. It is known that the respondents of the questionnaire are all supervisors or
employees in the area of quality management in their companies.
According to the questionnaire data, 71.42% of the respondents are
supervisors, while 21.58% are employees of Quality Management (Table 4).
Table: 4 Respondents Profile Position %
Supervisor 71,42 Employees of Quality Management 21,58
Total 100
Therefore, it can be seen that despite the survey responses be based on the
opinion of the respondents, they are reliable, since the respondents had always been
involved with the Quality Management System.
In this work, there are 55 questions (X), identified as correlated, besides the
existence of more predictors than observations (55 variables issues X against 4 Yi:
[http://creativecommons.org/licenses/by/3.0/us/] Licensed under a Creative Commons Attribution 3.0 United States License
633
INDEPENDENT JOURNAL OF MANAGEMENT & PRODUCTION (IJM&P) http://www.ijmp.jor.br v. 6, n. 3, July - September 2015 ISSN: 2236-269X DOI: 10.14807/ijmp.v6i3.301
reasons, benefits, obstacles and difficulty level). It was performed a correlation
analysis between the number of employees and the time to get certified,
transforming the discrete data into continuous, finding a P-value 0.226, and to accept
this correlation it is statistically required a P-value lower than or equal to 0.05, so
there is no correlation.
4.1. Analysis of correlation between number of employees and certification
time for certification reasons.
Analysis of variance was performed for the correlation between company size
in terms of number of employees and the time of certification having as variable the
reasons that led the companies to search certification. By the P-Value found (0.069 -
number of employees, and 0.239 - time to get certified) and both being greater than
0.05 there is no statistical significance for the correlation number of employees and
time to get certified with the reasons for certification. Thus, a number of key
components that would be required to obtain a representative sample were selected.
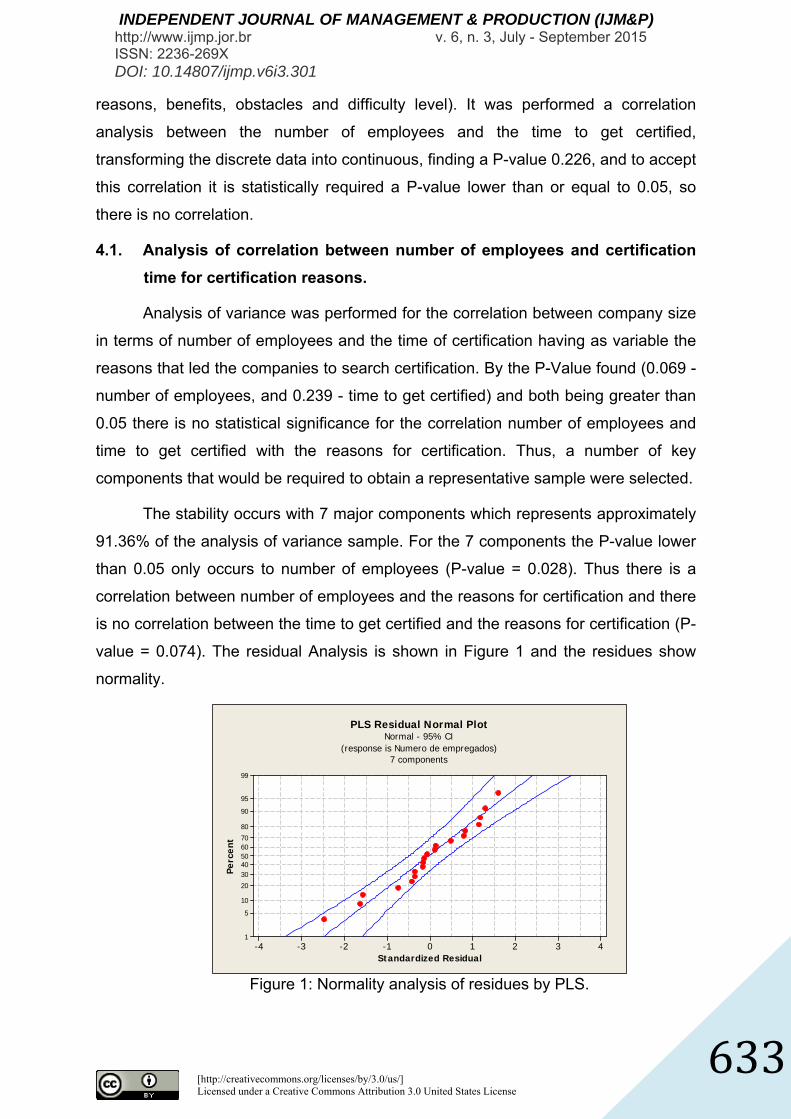
The stability occurs with 7 major components which represents approximately
91.36% of the analysis of variance sample. For the 7 components the P-value lower
than 0.05 only occurs to number of employees (P-value = 0.028). Thus there is a
correlation between number of employees and the reasons for certification and there
is no correlation between the time to get certified and the reasons for certification (P-
value = 0.074). The residual Analysis is shown in Figure 1 and the residues show
normality.
43210-1-2-3-4
99
9590
80706050403020
105
1
Standardized Residual
Perc
ent
PLS Residual Normal Plot
(response is Numero de empregados)7 components
Normal - 95% CI
Figure 1: Normality analysis of residues by PLS.
[http://creativecommons.org/licenses/by/3.0/us/] Licensed under a Creative Commons Attribution 3.0 United States License
634
INDEPENDENT JOURNAL OF MANAGEMENT & PRODUCTION (IJM&P) http://www.ijmp.jor.br v. 6, n. 3, July - September 2015 ISSN: 2236-269X DOI: 10.14807/ijmp.v6i3.301
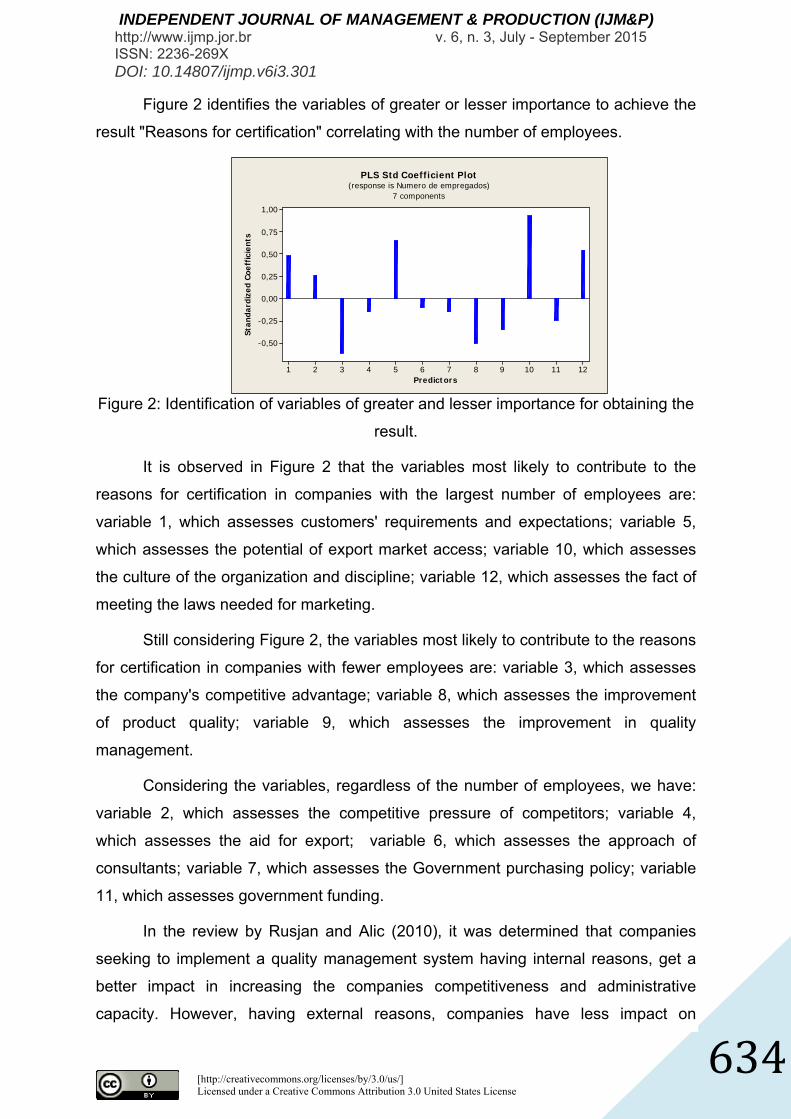
Figure 2 identifies the variables of greater or lesser importance to achieve the
result "Reasons for certification" correlating with the number of employees.
121110987654321
1,00
0,75
0,50
0,25
0,00
-0,25
-0,50
Predictors
Stan
dard
ized
Coe
ffic
ient
s
PLS Std Coefficient Plot(response is Numero de empregados)
7 components
Figure 2: Identification of variables of greater and lesser importance for obtaining the
result.
It is observed in Figure 2 that the variables most likely to contribute to the
reasons for certification in companies with the largest number of employees are:
variable 1, which assesses customers' requirements and expectations; variable 5,
which assesses the potential of export market access; variable 10, which assesses
the culture of the organization and discipline; variable 12, which assesses the fact of
meeting the laws needed for marketing.
Still considering Figure 2, the variables most likely to contribute to the reasons
for certification in companies with fewer employees are: variable 3, which assesses
the company's competitive advantage; variable 8, which assesses the improvement
of product quality; variable 9, which assesses the improvement in quality
management.
Considering the variables, regardless of the number of employees, we have:
variable 2, which assesses the competitive pressure of competitors; variable 4,
which assesses the aid for export; variable 6, which assesses the approach of
consultants; variable 7, which assesses the Government purchasing policy; variable
11, which assesses government funding.
In the review by Rusjan and Alic (2010), it was determined that companies
seeking to implement a quality management system having internal reasons, get a
better impact in increasing the companies competitiveness and administrative
capacity. However, having external reasons, companies have less impact on
[http://creativecommons.org/licenses/by/3.0/us/] Licensed under a Creative Commons Attribution 3.0 United States License
635
INDEPENDENT JOURNAL OF MANAGEMENT & PRODUCTION (IJM&P) http://www.ijmp.jor.br v. 6, n. 3, July - September 2015 ISSN: 2236-269X DOI: 10.14807/ijmp.v6i3.301
business performance. However, it is possible to observe that for sugar and ethanol
companies, both external and internal pressures are variables that contribute as
reasons for certification.
4.2. Analysis of correlation between number of employees and certification
time with obstacles
Analysis of variance was performed for the correlation between company size
in terms of number of employees and certification time having as variable the
obstacles that led the companies to search certification. By the P-Value found (0.074
- number of employees, and 0.384 - time to get certified) and both being greater than
0.05 there is no statistical significance for the correlation number of employees and
time to get certified with the obstacles for certification. Thus, a number of key
components that would be required to obtain a representative sample were selected.
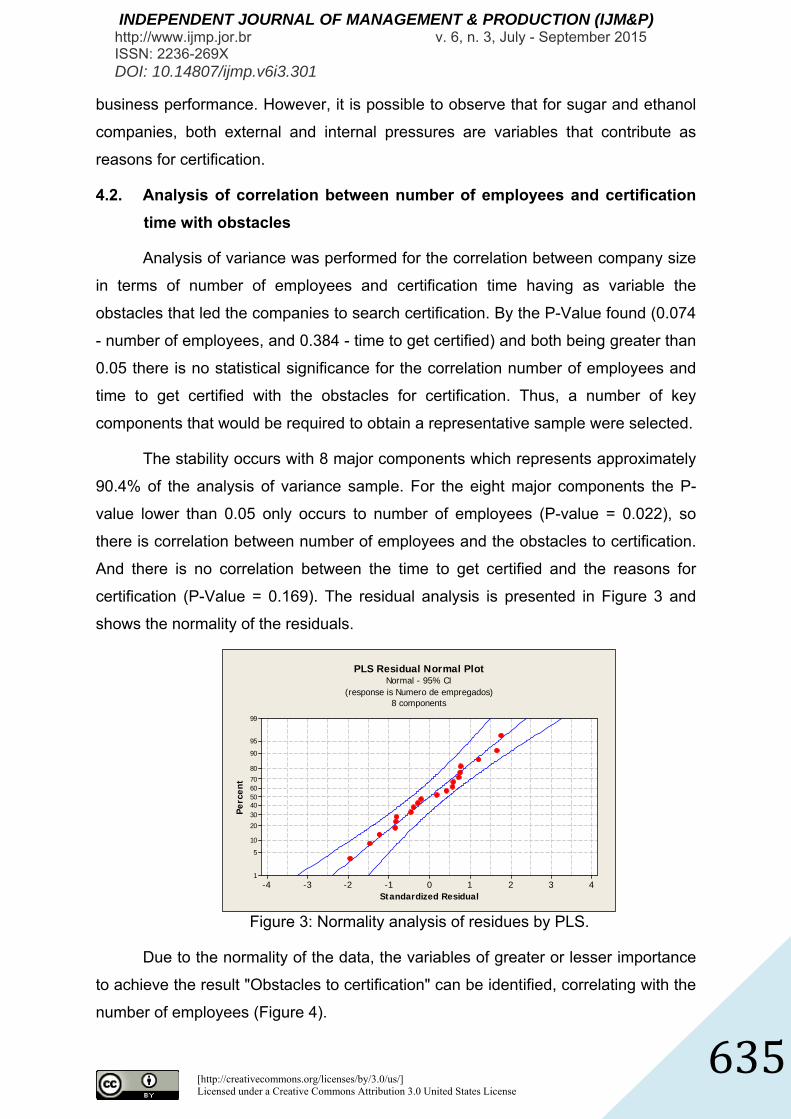
The stability occurs with 8 major components which represents approximately
90.4% of the analysis of variance sample. For the eight major components the P-
value lower than 0.05 only occurs to number of employees (P-value = 0.022), so
there is correlation between number of employees and the obstacles to certification.
And there is no correlation between the time to get certified and the reasons for
certification (P-Value = 0.169). The residual analysis is presented in Figure 3 and
shows the normality of the residuals.
43210-1-2-3-4
99
9590
80706050403020
105
1
Standardized Residual
Perc
ent
PLS Residual Normal Plot
(response is Numero de empregados)8 components
Normal - 95% CI
Figure 3: Normality analysis of residues by PLS.
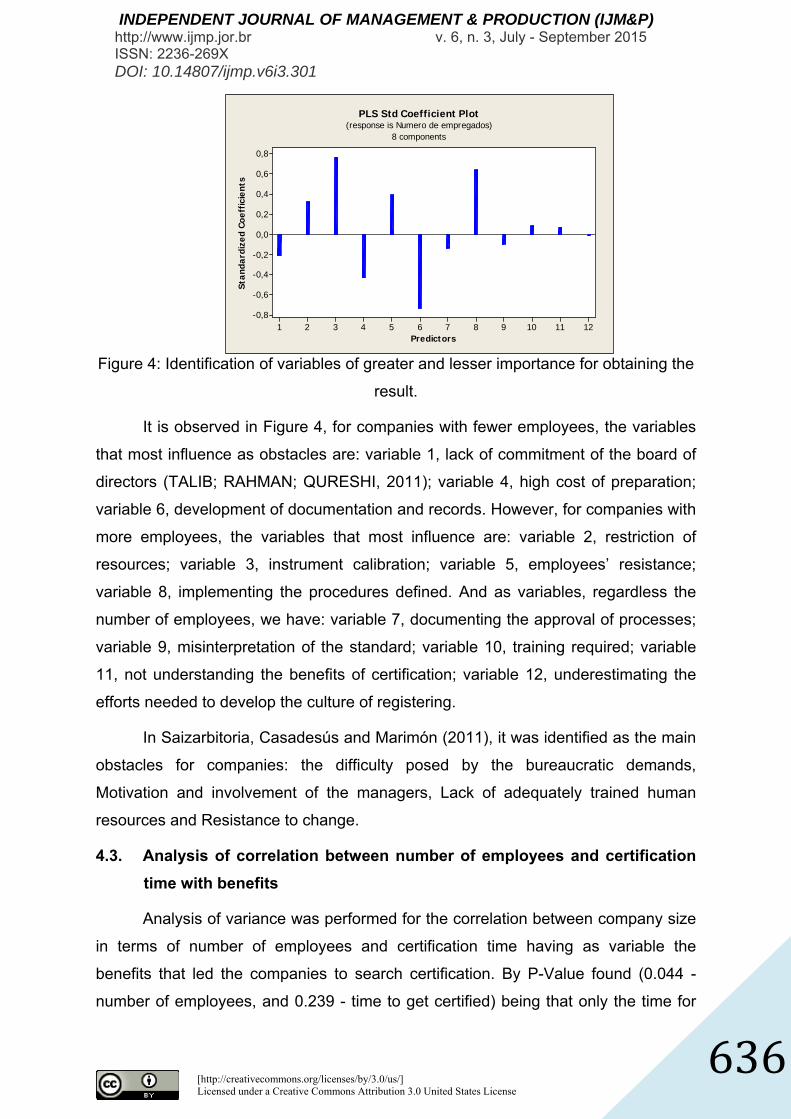
Due to the normality of the data, the variables of greater or lesser importance
to achieve the result "Obstacles to certification" can be identified, correlating with the
number of employees (Figure 4).
[http://creativecommons.org/licenses/by/3.0/us/] Licensed under a Creative Commons Attribution 3.0 United States License
636
INDEPENDENT JOURNAL OF MANAGEMENT & PRODUCTION (IJM&P) http://www.ijmp.jor.br v. 6, n. 3, July - September 2015 ISSN: 2236-269X DOI: 10.14807/ijmp.v6i3.301
121110987654321
0,8
0,6
0,4
0,2
0,0
-0,2
-0,4
-0,6
-0,8
Predictors
Stan
dard
ized
Coe
ffic
ient
s
PLS Std Coefficient Plot(response is Numero de empregados)
8 components
Figure 4: Identification of variables of greater and lesser importance for obtaining the
result.
It is observed in Figure 4, for companies with fewer employees, the variables
that most influence as obstacles are: variable 1, lack of commitment of the board of
directors (TALIB; RAHMAN; QURESHI, 2011); variable 4, high cost of preparation;
variable 6, development of documentation and records. However, for companies with
more employees, the variables that most influence are: variable 2, restriction of
resources; variable 3, instrument calibration; variable 5, employees’ resistance;
variable 8, implementing the procedures defined. And as variables, regardless the
number of employees, we have: variable 7, documenting the approval of processes;
variable 9, misinterpretation of the standard; variable 10, training required; variable
11, not understanding the benefits of certification; variable 12, underestimating the
efforts needed to develop the culture of registering.
In Saizarbitoria, Casadesús and Marimón (2011), it was identified as the main
obstacles for companies: the difficulty posed by the bureaucratic demands,
Motivation and involvement of the managers, Lack of adequately trained human
resources and Resistance to change.
4.3. Analysis of correlation between number of employees and certification
time with benefits
Analysis of variance was performed for the correlation between company size
in terms of number of employees and certification time having as variable the
benefits that led the companies to search certification. By P-Value found (0.044 -
number of employees, and 0.239 - time to get certified) being that only the time for
[http://creativecommons.org/licenses/by/3.0/us/] Licensed under a Creative Commons Attribution 3.0 United States License
637
INDEPENDENT JOURNAL OF MANAGEMENT & PRODUCTION (IJM&P) http://www.ijmp.jor.br v. 6, n. 3, July - September 2015 ISSN: 2236-269X DOI: 10.14807/ijmp.v6i3.301
certification is greater than 0.05, indicating that there is no statistical significance for
the correlation between time to achieve certification with obstacles to certification.
Thus, a number of key components that would be required to obtain a representative
sample were selected.
The stability occurs with 8 major components which represents approximately
97.48% of the analysis of variance sample.
For the eight major components the P-value lower than 0.05 only occurs to
number of employees (P-value = 0.041), so there is correlation between number of
employees and the benefits for certification. And there is no correlation between the
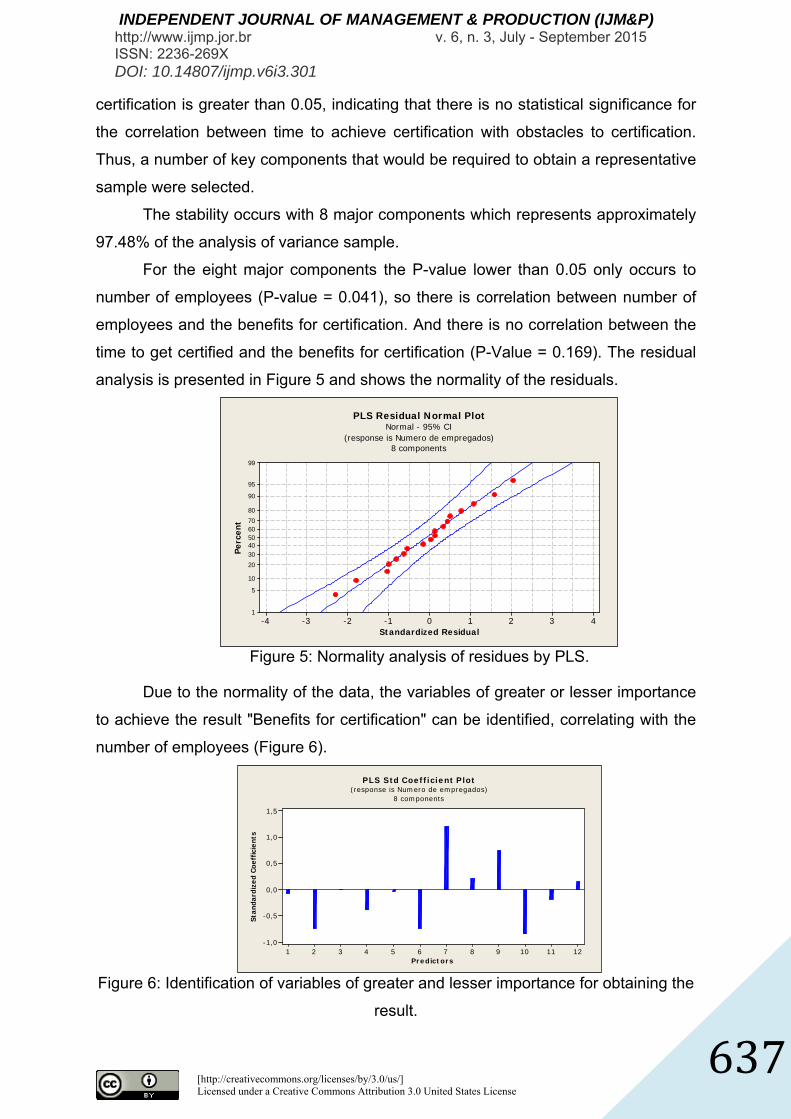
time to get certified and the benefits for certification (P-Value = 0.169). The residual
analysis is presented in Figure 5 and shows the normality of the residuals.
43210-1-2-3-4
99
9590
80706050403020
105
1
Standardized Residual
Perc
ent
PLS Residual Normal Plot
(response is Numero de empregados)8 components
Normal - 95% CI
Figure 5: Normality analysis of residues by PLS.
Due to the normality of the data, the variables of greater or lesser importance
to achieve the result "Benefits for certification" can be identified, correlating with the
number of employees (Figure 6).
121110987654321
1,5
1,0
0,5
0,0
-0,5
-1,0
Predictors
Stan
dard
ized
Coe
ffic
ient
s
PLS S td Coefficient P lot(response is Numero de empregados)
8 components
Figure 6: Identification of variables of greater and lesser importance for obtaining the
result.
[http://creativecommons.org/licenses/by/3.0/us/] Licensed under a Creative Commons Attribution 3.0 United States License
638
INDEPENDENT JOURNAL OF MANAGEMENT & PRODUCTION (IJM&P) http://www.ijmp.jor.br v. 6, n. 3, July - September 2015 ISSN: 2236-269X DOI: 10.14807/ijmp.v6i3.301
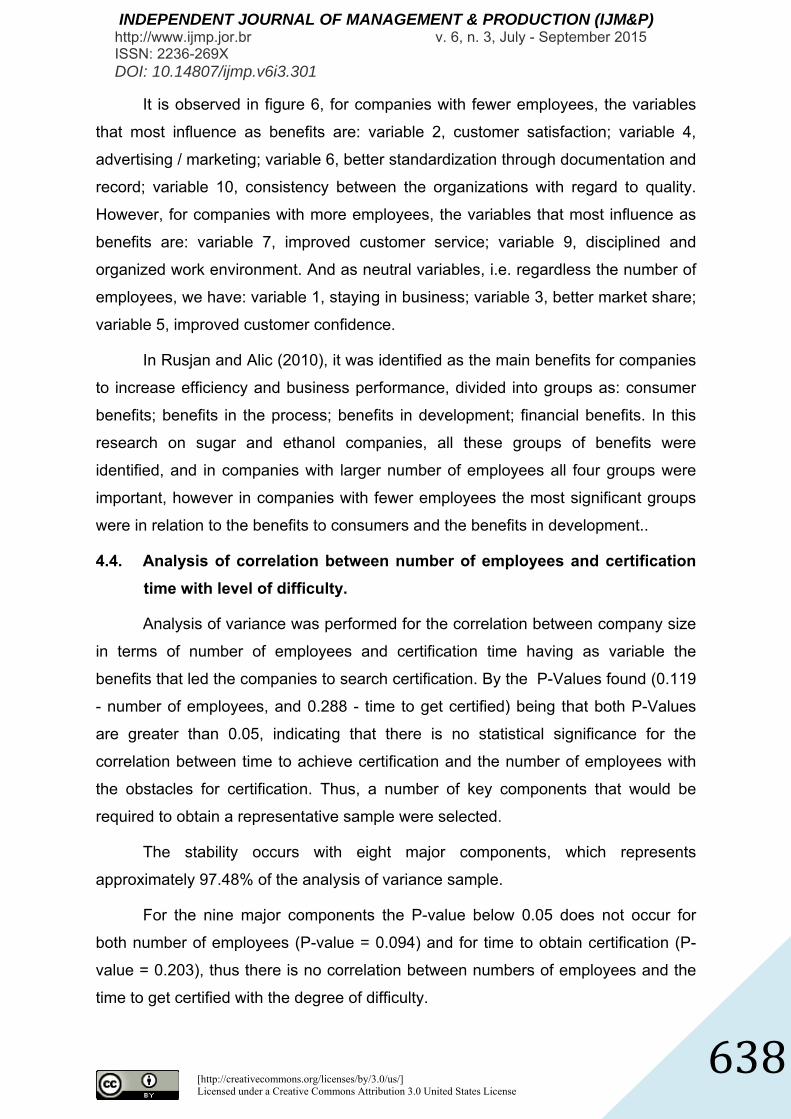
It is observed in figure 6, for companies with fewer employees, the variables
that most influence as benefits are: variable 2, customer satisfaction; variable 4,
advertising / marketing; variable 6, better standardization through documentation and
record; variable 10, consistency between the organizations with regard to quality.
However, for companies with more employees, the variables that most influence as
benefits are: variable 7, improved customer service; variable 9, disciplined and
organized work environment. And as neutral variables, i.e. regardless the number of
employees, we have: variable 1, staying in business; variable 3, better market share;
variable 5, improved customer confidence.
In Rusjan and Alic (2010), it was identified as the main benefits for companies
to increase efficiency and business performance, divided into groups as: consumer
benefits; benefits in the process; benefits in development; financial benefits. In this
research on sugar and ethanol companies, all these groups of benefits were
identified, and in companies with larger number of employees all four groups were
important, however in companies with fewer employees the most significant groups
were in relation to the benefits to consumers and the benefits in development..
4.4. Analysis of correlation between number of employees and certification
time with level of difficulty.
Analysis of variance was performed for the correlation between company size
in terms of number of employees and certification time having as variable the
benefits that led the companies to search certification. By the P-Values found (0.119
- number of employees, and 0.288 - time to get certified) being that both P-Values
are greater than 0.05, indicating that there is no statistical significance for the
correlation between time to achieve certification and the number of employees with
the obstacles for certification. Thus, a number of key components that would be
required to obtain a representative sample were selected.
The stability occurs with eight major components, which represents
approximately 97.48% of the analysis of variance sample.
For the nine major components the P-value below 0.05 does not occur for
both number of employees (P-value = 0.094) and for time to obtain certification (P-
value = 0.203), thus there is no correlation between numbers of employees and the
time to get certified with the degree of difficulty.
[http://creativecommons.org/licenses/by/3.0/us/] Licensed under a Creative Commons Attribution 3.0 United States License
639
INDEPENDENT JOURNAL OF MANAGEMENT & PRODUCTION (IJM&P) http://www.ijmp.jor.br v. 6, n. 3, July - September 2015 ISSN: 2236-269X DOI: 10.14807/ijmp.v6i3.301
5. CONCLUSION
Returning to the starting point of this paper, the objectives have been only
partially resolved based on the survey. One can infer from the data that sugar and
ethanol companies certified by ISO 9001 tend to have as more significant variables,
related to the number of employees of the company, the reasons adopted for
certification, the benefits of certification and the difficulties encountered. However,
when considering the time to obtain certification, there was no correlation with the
variables. This demonstrates that the challenges faced by companies is the same
regardless of size and purpose, however it reveals that the certification promotes a
great evolution in the company, making it more organized and prepared to meet the
expectations of its customers.
The increased need to seek better quality in their products, the intensification
of customers’ demands, the organizational improvement and the increasingly
frequent unification of global markets has led many companies from different sectors
to seek a quality management system (QMS), in order to equate to its competitors in
the market, thus gaining more space and competitiveness. However, in the sugar
and ethanol companies surveyed, the factors of greater motivation to seek ISO 9001
certification are related to better interaction with the customers having in mind their
expectations, the search for larger markets mainly of export, legal requirements,
demonstrating that companies are interested in a constant evolution.
The release of the first review of ISO 9001 in 1987, about twenty-four years
ago, demonstrates that this globally accepted system is relatively new and is
constantly reviewed and improved, yet its implementation is relatively expensive and
requires a great effort of companies which has become a major obstacle for them,
event observed in this study.
With the constant evolution of the ISO 9001 system and the greater
intensification in the search for quality management systems by companies, along
with the increase of professionals involved in the area, the emergence of new
variables either for reasons, obstacles or benefits becomes a possible reality. This
possible reality can require a new understanding of ISO 9001 and its
implementation, fact that would be interesting to be investigated in future studies.
[http://creativecommons.org/licenses/by/3.0/us/] Licensed under a Creative Commons Attribution 3.0 United States License
640
INDEPENDENT JOURNAL OF MANAGEMENT & PRODUCTION (IJM&P) http://www.ijmp.jor.br v. 6, n. 3, July - September 2015 ISSN: 2236-269X DOI: 10.14807/ijmp.v6i3.301
ACKNOWLEDGMENTS
The authors would like to thank the CAPES Foundation, (Process PE024/2008), the
FAPEMIG Foundation (Processes: TEC-PPM-00520/13 and TEC-PPM-00058-13)
and the CNPq (Processes: 249160/2013-7, 310660/2012-2, 401082/2014-8 and
478509/2012-0), that without their support, this work would be impossible. In
addition, the authors thank the interviewees, by their information, patience and
devoted time for this work.
REFERENCES
ALONSO-ALMEIDA, M. M.; MARIMON, F.; BERNARDO, M. (2013). Diffusion of quality standards in the hospitality sector. International Journal of Operations & Production Management, v. 33, n. 5, p. 504-527
AGGELOGIANNOPOULOS, D.; DROSINOS, E. H.; ATHANASOPOULOS, P. (2007). “Implementation of a quality management system (QMS) according to the ISO 9000 family in a Greek small-sized winery: A case study.” Food Control v. 18, n.9, p.1077–1085.
ALOLAYYAN, M. N. F.; ALI, K. A. M.; IDRIS, F.; IBREHEM, A. S. (2011). “Advance mathematical model to study and analyse the effects of total quality management (TQM) and operational flexibility on hospital performance.” Total Quality Management & Business Excellence, v. 22, n. 12, p.1371-1393.
ANDRADA, L. R.; ALMEIDA, M. D. M. A.; ANTÓN, J. M. R. (2011). “Motivations and impacts in the firm and stakeholders of quality certification: Evidence from small- and medium-sized service enterprises.” Total Quality Management & Business Excellence, Vol. 22, No. 8, pp. 833-852.
BHUIYAN, N.; ALAM, N. (2004) ISO 9001:2000 Implementation – The North American Experience. Intenational Journal of Productivity and Performance Management, v. 53, p. 10-17.
BRASIL. Ministério da Agricultura: Cana-de-açúcar. Disponível em: <www.agricultura.gov.br> Acesso em 18 de janeiro de 2011.
DEBNATH, N.; UZAL, R.; MONTEJANO, G; RIESCO, D. (2010) Web application to improve police management performance. Seventh International Conference on Information Technology.
FINK, A.; KOSECOFF, J. (1998) How to conduct surveys – a step-by-step guide. 2ª. ed. Thousand Oaks, California, Sage Publications.
FORZA, C. (2002) Survey research in operations management: a process-based perspective. International Journal of Operations & Production Management, v. 22, n. 2, p.152-194.
GIUFFRE, M. Designing research survey design part one. (1997a) Journal of PeriAnesthesia Nursing, v. 12, n. 4, p. 275-280.
GIUFFRE, M. Designing research survey design part two. (1997b.) Journal of PeriAnesthesia Nursing, v. 12, n. 5, p. 358-362.
[http://creativecommons.org/licenses/by/3.0/us/] Licensed under a Creative Commons Attribution 3.0 United States License
641
INDEPENDENT JOURNAL OF MANAGEMENT & PRODUCTION (IJM&P) http://www.ijmp.jor.br v. 6, n. 3, July - September 2015 ISSN: 2236-269X DOI: 10.14807/ijmp.v6i3.301
HAIR Jr, J. F.; ANDERSON, R. E.; TATHAM, R. L.; BLACK, W. C. (2005.) Análise Multivariada de Dados. 5ª ed. Porto Alegre. Bookman.
HELLAND, I.S. (1988) On the Structure of Partial Least Squares Regression. Commun. Statist – Simula, v. 17, n. 2, p. 581.
HERAS, I.; IRADI, J.; CILLERUELO, E. (2008) ISO 9001 and residential homes for the elderly: a Delphi study. Managing Service Quality, v. 18, n. 3, p. 272-288.
ISO GENEVA, 2000(b). International standard ISO 9001:2000 quality management systems—fundamentals and vocabulary in KIM, D. A Framework of Intellectual Capital Management Based on ISO 9001 Quality Management System: The Case Study of ISO 9001 Certified Public R&D Institute. Knowledge and Process Management. v.16, n. 4, p. 162-173, 2009.
KARAPETROVIC, S.; WILLBORN, W. (2001) ISO 9000 quality management standards and financial investment services. The Service Industries Journal, v. 21, n. 2, p. 117-136.
KIM, J.; MUELLER, C.W. (1978) Introduction to Factor Analysis: What It is and How to Do It. Sage Publications, London.
LEVINE, D. I.; TOFFEL, M. W. (2010) Quality Management and Job Quality: How the ISO 9001 Standard for Quality Management Systems Affects Employees and Employers. Management Science, v. 56, n. 6, p. 978-996.
LEUNG, H.K.N.; CHAN, K.C.C.; LEE, T.Y. (1999) Costs and benefits of ISO 9000 series: a practical study. Internacional Journal of Quality & Reliability Management, v. 16, n. 7, p. 675-690.
MAGD, H.; CURRY, A. (2003) An empirical analysis of management attitudes towards ISO 9001:2000 in Egypt. The TQM Magazine, v. 15, n. 6, p. 381-390.
MALHOTRA, N. K. (2006) Pesquisa de Marketing: uma orientação aplicada. 4ª ed. Porto Alegre. Bookman. p. 720.
MELHADO, S. B.; OHASHI, E. A. M. (2004) A importância dos indicadores de desempenho nas empresas construtoras e incorporadoras com certificação ISO 9001:2000. Encontro Nacional de Tecnologia do Ambiente Construído. Anais. São Paulo.
NUNNALY, J. C.; BERNSTEIN, I. H. Psychometric theory. 3ª ed. New York. McGraw-Hill. 1994.
PINTO, S. H. B.; CARVALHO, M. M.; HO, L. L. (2006) Implementação de Programas de Qualidade: Um Survey em Empresas de Grande Porte no Brasil. Gestão e Produção, v. 13, n. 2, p. 191-203, mai-ago.
RAUBER, J. S.; BORGES, M. A. V.; MANUEL JR., M. L.; PACHECO, D. A. J. (2014) A critical analysis of quality management Implementation in a small brazilian company. Independent Journal of Management & Production, v. 5, n. 2, p. 398 – 416.
RODRIGUES, A. G.; SARAIVA, P.; SAMPAIO, P. (2011) ISO 9001 certification forecasting models, International Journal of Quality & Reliability Management, v. 28, n. 1, p. 5-26.
RUSJAN, B.; ALIC, M. (2010) Capitalising on ISO 9001 benefits for strategic results. International Jounal of Quality & Reliability Management, v. 27, n. 7, p. 756-778.
[http://creativecommons.org/licenses/by/3.0/us/] Licensed under a Creative Commons Attribution 3.0 United States License
642
INDEPENDENT JOURNAL OF MANAGEMENT & PRODUCTION (IJM&P) http://www.ijmp.jor.br v. 6, n. 3, July - September 2015 ISSN: 2236-269X DOI: 10.14807/ijmp.v6i3.301
SAIZARBITORIA, I. H.; CASADESÚS, M.; MARIMÓN, F. (2011) “The impact of ISO 9001 standard and the EFQM model: The view of the assessors.” Total Quality Management & Business Excellence, v. 22, n. 2, p. 197-218
SALGADO, E. G.; SILVA, C. E. S.; MELLO, C. H. P.; SILVA, E. R. S. (2014). Difficulties encountered in ISO 9001:2008 implementation projects in incubated technology-based companies. International Journal for Quality Research, v. 8, n. 3, p. 357-369.
SAMPAIO, P.; SARAIVA, P.; RODRIGUES, A. G. (2009). ISO 9001 certification research: questions, answers and approaches. International Journal of Quality & Reliability Management. v. 26, n.1, p. 38-58.
SAMPAIO, P.; SARAIVA, P.; RODRIGUES, A. G. (2011). ISO 9001 certification forecasting models, International Journal of Quality & Reliability Management, v. 28, n.1, p. 5-26.
SCOPINHO, R. A. (2000) Qualidade Total, Saúde e Trabalho: Uma Análise em Empresas Sucroalcooleiras Paulistas. RAC, v. 4, n. 1, p. 93-112.
SENA, M. M.; POPPI, R.J. (2004) N-way PLS applied to simultaneous spectrophotometric determination of acetylsalicylic acid, paracetamol and caffeine. Journal of Pharmaceutical and Biomedical Analysis, v. 34, n. 27, p. 27-34.
SILVA, A. N. (2009) Modelagem do Planejamento Agregado da Produção de uma Usina Sucroalcooleira. Dissertação de Mestrado. Universidade Federal de Itajubá (UNIFEI). Itajubá-MG.
SOARES, S. S. S.; PAULILLO, L. F. O. (2008). Governança Corporativa em empresas sucroalcooleira e de biodiesel: o novo mercado enquanto estratégia de capitalização. Informações Econômicas. São Paulo. v. 38, n. 3, p. 37-46.
SOUZA JUNIOR, C. A. ; SALGADO, E. G.; NEVES, F. O.; ALVARENGA, A. D. (2014). Priorização de práticas de TQM na indústria farmacêutica. Espacios, v. 35, p. 7.
TALIB, F.; RAHMAN, Z.; QURESHI, M.N. (2011). Prioritising the practices of total quality management: An analytic hierarchy process analysis for the service industries. Total Quality Management & Business Excellence, v. 22, n. 12, p. 1331–1351
YACOUB, F.; MACGREGOR, J. F. (2003) Analysis and optimization of a polyurethane reaction injection molding (RIM) process using multivariate projection methods. Chemometrics and Intelligent Laboratory Systems. v. 65, n. 1, p. 17-33.
Recommended