ANALYZING THE US RETAIL WINE MARKET
USING PRICE AND CONSUMER SEGMENTATION MODELS (REFEREED)
Susan Cholette, San Francisco State University, USA
Richard M. Castaldi, San Francisco State University, USA [email protected]
Abstract
Globalization and other driving forces have dramatically altered the competitive
landscape of the wine industry. Winery managers must understand how these changes
can affect pricing and product strategies at the retail level. The objectives of this
research effort are threefold. First, the traditional industry price segmentation model will
be revised in order to incorporate current industry developments arising from these
driving forces. Second, the revised price segmentation model will be used in conjunction
with a consumer behavior segmentation model to analyze the US retail wine market.
These two segmentation models are analytical frameworks that winery managers can
use to identify market opportunities and to assist them in the formulation of their product
and pricing strategies in the highly competitive US marketplace. Third, these two
segmentation models will be also used to explore the industry ramifications from a
hypothetical market scenario for 2008.
Introduction
The US wine industry is large, expanding, complex and highly fragmented in regard
to competition and consumers alike. Tens of thousands of different brands from wine
producing regions around the world compete at retail prices ranging from under $2 to
over a thousand dollars. Moreover, US consumers run the gamut from tentative
neophytes and occasional purchasers to devoted wine connoisseurs. To understand the
strategic and competitive dynamics of the marketplace both product price points and
buyer behavior patterns need to be studied. Two segmentation models that incorporate
conceptual frameworks representing pricing and consumer behavior patterns will be
used to analyze the current US retail wine marketplace. Moreover, a future scenario of
the market will also be proffered.
1
A nine-point price segmentation model is presented that improves upon the traditional
four or five-point models commonly used in trade and academic publications. This
revised model includes three broad product “super” segments, each including three sub-
categories with corresponding price points. Interviews with industry experts and
executives suggest that these nine product price points and segment classifications
more accurately reflect the retail US wine marketplace in 2005. In regard to
segmentation and analysis of the US market by consumer behavior patterns, a model
created by Moulton et al in 2001 will be applied and extended. While this research draws
upon data and findings from over 25 different sources, the data predominately comes
from four well-established contributors: Adams Beverage Group (2004), Gomberg-
Fredrikson & Associates (2003), MKF Research (2004), and the Wine Institute (2004).
The US market is the focus of this paper because 1) it is one of the largest global
wine markets, 2) it has experienced significant growth in recent years, 3) it has great
potential for continued growth and 4) the US is both a major wine producer, as well as a
key target market for importers from the Old and New World alike. Extensions of these
segmentation models to retail wine markets in other countries is feasible, but beyond the
scope of this research effort.
The objectives of this research effort are threefold. First, the traditional industry
price segmentation model will be revised in order to incorporate current industry
developments arising from globalization and other driving forces. This revised nine-point
price segmentation model is better suited for firms, trade associations and industry
experts in their efforts to collect and analyze retail wine data. Second, the revised price
segmentation model will be used in conjunction with a consumer behavior segmentation
model to analyze the US retail wine market with the most recent data available. These
two segmentation models are analytical frameworks that winery managers can use to
identify market opportunities and to assist them in the formulation of their product and
pricing strategies in the highly competitive US marketplace. Third, the combination of
these two segmentation models will be also used to construct a hypothetical market
scenario for the US wine industry in 2008 based on projected consumer trends.

2
AVERAGE US CONSUMPTION AND PRICE TRENDS
The US market was third among all countries in total overall wine consumption,
at 2.4 billion liters in 2001. As shown in Table 1, wine consumption has been increasing
in recent years. However, the US per capita consumption was only 8.77 liters in 2001,
ranking the US 34th in the world (Wine Institute, 2004). Table 1 shows that per capita
consumption is on the rise, but at these rates, the US has decades before reaching the
current per capita levels of countries with wine-focused cultures like France (60
liters/year) or Italy (52 liters/year). While several categories of wine exist such as table,
coolers, sparkling, dessert and fortified, table wine accounts for about 80% of all wine
products sold nationally (Adams Beverage Group, 2004). Other industry research shows
table wine purchases totaled 2.1 billion liters, or a 89% share of all wine products sold in
2003 (Wine Institute, 2004). Although not in complete agreement, both sources show
that table wines dominate wine sales, and this research will focus on this category.
Table 1: US Wine Consumption, All Categories
Year Total
Consumption Per Capita
Consumption
1997 2.02 billion liters 7.33 liters/yr
1998 2.08 7.54
1999 2.36 8.58
2000 2.36 8.55
2001 2.42 8.77
Source: Wine Institute, 2004
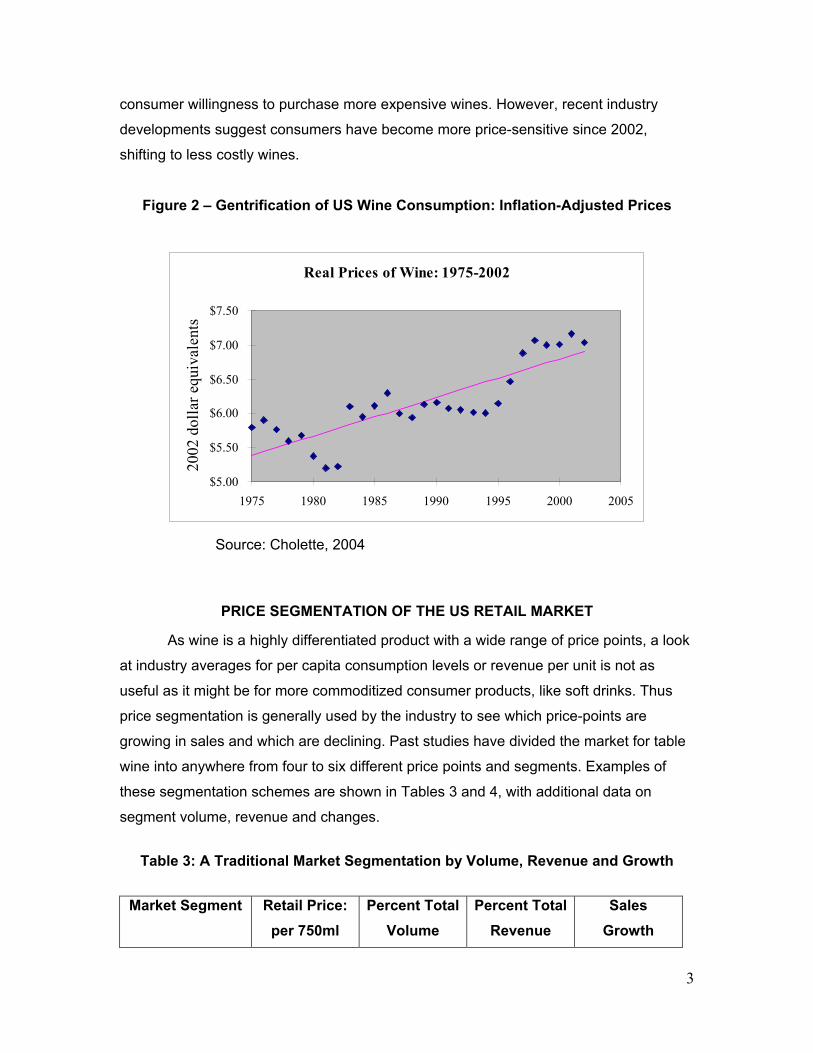
Wine consumption can also be measured by revenue as well as volume. Figure 2
shows that, after adjusting nominal prices to account for inflation, real wine prices have
slowly been rising over the past few decades. While wine prices in recent years have
been relatively stable, averaging just over $7 per 750ml bottle equivalent, they are
higher than the $6/bottle average experienced 15-20 years ago. This upward trend over
time is strong, with a correlation of .83. While rising prices for some products might be
attributed to scarcity, either natural or monopoly-induced, such is not the case with wine,
which has thousands of producers and has been in oversupply for much of recent history
(Cholette, Castaldi and Fredrick, 2005). Thus, price increases may be attributed to
3
consumer willingness to purchase more expensive wines. However, recent industry
developments suggest consumers have become more price-sensitive since 2002,
shifting to less costly wines.
Figure 2 – Gentrification of US Wine Consumption: Inflation-Adjusted Prices
Real Prices of Wine: 1975-2002
$5.00
$5.50
$6.00
$6.50
$7.00
$7.50
1975 1980 1985 1990 1995 2000 2005
2002
dol
lar e
quiv
alen
ts
Source: Cholette, 2004
PRICE SEGMENTATION OF THE US RETAIL MARKET
As wine is a highly differentiated product with a wide range of price points, a look
at industry averages for per capita consumption levels or revenue per unit is not as
useful as it might be for more commoditized consumer products, like soft drinks. Thus
price segmentation is generally used by the industry to see which price-points are
growing in sales and which are declining. Past studies have divided the market for table
wine into anywhere from four to six different price points and segments. Examples of
these segmentation schemes are shown in Tables 3 and 4, with additional data on
segment volume, revenue and changes.
Table 3: A Traditional Market Segmentation by Volume, Revenue and Growth
Market Segment Retail Price: per 750ml
Percent Total Volume
Percent Total Revenue
Sales Growth
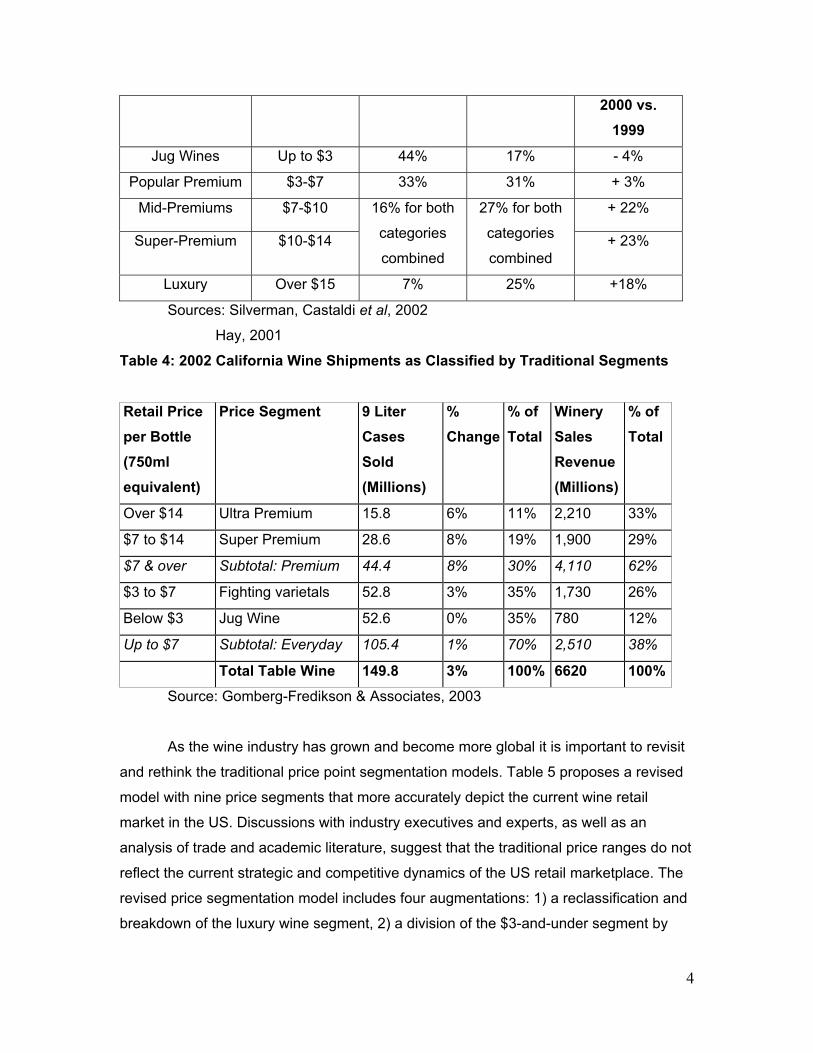
4
2000 vs. 1999
Jug Wines Up to $3 44% 17% - 4%
Popular Premium $3-$7 33% 31% + 3%
Mid-Premiums $7-$10 + 22%
Super-Premium $10-$14
16% for both
categories
combined
27% for both
categories
combined + 23%
Luxury Over $15 7% 25% +18%
Sources: Silverman, Castaldi et al, 2002
Hay, 2001
Table 4: 2002 California Wine Shipments as Classified by Traditional Segments
Retail Price per Bottle (750ml equivalent)
Price Segment 9 Liter Cases Sold (Millions)
% Change
% of Total
Winery Sales Revenue (Millions)
% of Total
Over $14 Ultra Premium 15.8 6% 11% 2,210 33%
$7 to $14 Super Premium 28.6 8% 19% 1,900 29%
$7 & over Subtotal: Premium 44.4 8% 30% 4,110 62%
$3 to $7 Fighting varietals 52.8 3% 35% 1,730 26%
Below $3 Jug Wine 52.6 0% 35% 780 12%
Up to $7 Subtotal: Everyday 105.4 1% 70% 2,510 38%
Total Table Wine 149.8 3% 100% 6620 100%
Source: Gomberg-Fredikson & Associates, 2003
As the wine industry has grown and become more global it is important to revisit
and rethink the traditional price point segmentation models. Table 5 proposes a revised
model with nine price segments that more accurately depict the current wine retail
market in the US. Discussions with industry executives and experts, as well as an
analysis of trade and academic literature, suggest that the traditional price ranges do not
reflect the current strategic and competitive dynamics of the US retail marketplace. The
revised price segmentation model includes four augmentations: 1) a reclassification and
breakdown of the luxury wine segment, 2) a division of the $3-and-under segment by

5
factors other than price, 3) subdividing the popular $7 to $14 price range, and 4)
grouping the nine category price points into three “super” segments.
Table 5: Revised Price Segmentation Model
Segment Price Range (per 750ml) Luxury Super Segment
Icon over $100
Super Luxury $50 to $100
Luxury $25 to $50
Premium Super Segment
Ultra Premium $14 to $25
Mid-Premium $10 to $14
Popular Premium $7 to $10
Everyday Super Segment
Fighting Varietals $3 up to $7
Extreme Value Below $3
Jug Wine* Below $3
Source: Fredricks, 2004
* Jug Wine refers to wines packaged in 3L jugs or 5L boxes
Augmentation 1: Redefining Luxury within the Gentrifying Wine Market
Even casual observers of the wine market will notice prices on many existing
brands, especially from Californian wineries, have migrated upwards in recent years. A
$15 wine is no longer perceived as a luxury, or at least is not a comparable splurge to a
$75 bottle. Supporting evidence can be found in Table 6, which tallies all Cabernet
Sauvignon offerings from the online retail site of Beverages and More ™ (Bevmo).
Bevmo is not positioned to the consumer as a luxury wine shop, yet over half of their
products for this varietal retail for more than $14. Thus, one suggested revision of the
traditional segmentation classification would be to remove the $14 to $25 wines from the
luxury segment and further divide wines over $25 into three price segments: Luxury $25
to $50, Super Luxury, $50 to $100, and Icon, at over $100.
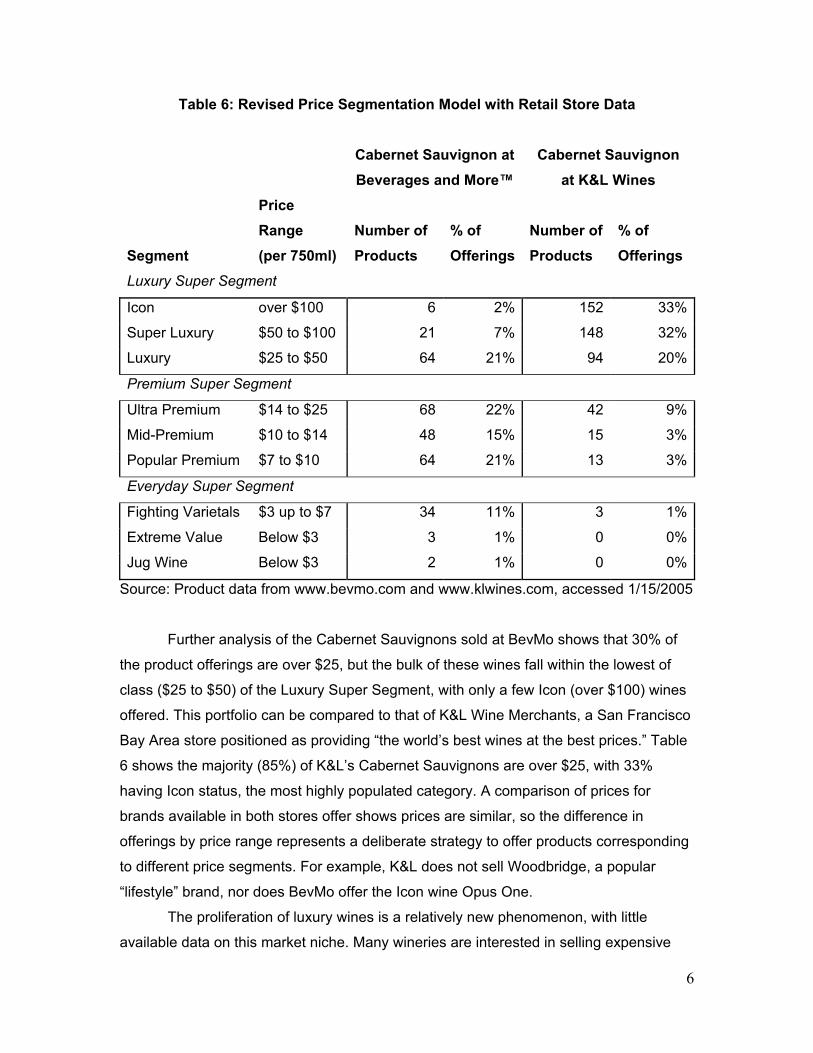
6
Table 6: Revised Price Segmentation Model with Retail Store Data
Cabernet Sauvignon at Beverages and More™
Cabernet Sauvignon at K&L Wines
Segment
Price Range (per 750ml)
Number of Products
% of Offerings
Number of Products
% of Offerings
Luxury Super Segment
Icon over $100 6 2% 152 33%
Super Luxury $50 to $100 21 7% 148 32%
Luxury $25 to $50 64 21% 94 20%
Premium Super Segment
Ultra Premium $14 to $25 68 22% 42 9%
Mid-Premium $10 to $14 48 15% 15 3%
Popular Premium $7 to $10 64 21% 13 3%
Everyday Super Segment
Fighting Varietals $3 up to $7 34 11% 3 1%
Extreme Value Below $3 3 1% 0 0%
Jug Wine Below $3 2 1% 0 0%
Source: Product data from www.bevmo.com and www.klwines.com, accessed 1/15/2005
Further analysis of the Cabernet Sauvignons sold at BevMo shows that 30% of
the product offerings are over $25, but the bulk of these wines fall within the lowest of
class ($25 to $50) of the Luxury Super Segment, with only a few Icon (over $100) wines
offered. This portfolio can be compared to that of K&L Wine Merchants, a San Francisco
Bay Area store positioned as providing “the world’s best wines at the best prices.” Table
6 shows the majority (85%) of K&L’s Cabernet Sauvignons are over $25, with 33%
having Icon status, the most highly populated category. A comparison of prices for
brands available in both stores offer shows prices are similar, so the difference in
offerings by price range represents a deliberate strategy to offer products corresponding
to different price segments. For example, K&L does not sell Woodbridge, a popular
“lifestyle” brand, nor does BevMo offer the Icon wine Opus One.
The proliferation of luxury wines is a relatively new phenomenon, with little
available data on this market niche. Many wineries are interested in selling expensive

7
wines as it allows for greater profitability and more freedom in creating high quality
wines, as well as providing prestige that may even carry over to the winery’s less
expensive offerings. As shown in Table 3, wines priced over $14 represents a small
volume (7%) of the total wine market, yet provide for high revenue (25% of total),
because of the price commanded. California producers have delved further into higher
priced wines; Table 4 shows Californian wine priced over $14 accounted for 11% of total
sales by volume, but 33% by revenue. The downside of offering high priced wines is that
distribution channels are limited and consumption may drop in economic downturns,
such as occurred in 2002. According to the 2004 Luxury Wine conference, sales in 2003
have partially recovered (Heeger, 2004). But this research will suggest that
concentrating solely on wines priced over $14 may not be a good long term strategy for
winemakers attempting to increase revenue.
Augmentation 2: The Emergence of Extreme Value Wines
The Jug Wine segment includes wines that retail at price points under $3 per
bottle per 750ml equivalent. Traditionally, this price-point has been dominated by
products in large packages, such as 3 liter jugs and 5 liter boxes, with the many of the
wines blended to be smooth and inoffensive, such as Peter Vella Burgundy and
Almaden Blush Chablis, both owned by Gallo. While these wines were popular a few
decades ago, this segment appears to have matured. According to Table 4, it
experienced the least growth in the 2000-2002 timeframe. In fact, Table 3 shows that
this was the only category that declined in growth in 2000. This desertion from what was
once a popular segment has likely contributed to the rising real price of wine shown in
Figure 2.
However, the grape glut of recent years has made possible the introduction of
Extreme Value wines: varietal wines that retailed for $3 a bottle or less. The most
famous of these is Charles Shaw, better known as “Two-Buck Chuck.” Bronco, the
producer, sells five varietals through Trader Joe’s at $1.99 per 750ml bottle in California.
Nonexistent before 2002, this brand was responsible for 15% of California’s retail wine
sales by volume in 2003 (Economist, 2003). US Consumers purchased 6.8 million cases
of Extreme Value wines that year (Wine Institute, 2004). The 2004 UC Davis survey of
producers and experts predicts that this segment will wane in importance in the future,
serving only as an outlet for local overproduction of bulk wine (Smiley, 2004). Yet other

8
experts are equally convinced these wines will remain a permanent fixture. In either
case, this segment merits its own niche, separate from the mature Jug Wine category.
Table 6 shows that K&L offers no Cabernet Sauvignons at this price point while
Bevmo has a few products under $3. Three of these are the traditional jug offerings, but
one is Pacific Peak, their private label equivalent to Charles Shaw, sourced through
Golden State Vintners (Wine Business Online, 2003). Other retailers have similar private
label Extreme Value wines, such as Safeway’s Sea Ridge, also sourced from Bronco.
No changes to the $3 to $7 category, known either as “Popular Premium” wine or
“Fighting Varietals,” is needed as it still reflects a distinct market segment. Table 6
shows that Bevmo lists 35 different Cabernet Sauvignons in this range, while K&L
provides a mere 3 offerings. Although Bevmo’s selection is small compared with other
categories, accounting for only 11% of the offerings, many of these are high-volume
brands, such as Woodbridge, and likely account for a greater percentage of the store’s
sales than the product variety would suggest. According to Table 3, the $3 to $7 wines
accounted for the most revenue in 2000, although little (3%) sales growth occurred.
Table 4 shows the $3 to $7 wines accounted for 35% of all Californian wine sold in 2002,
generating 26% of the total sales revenue. Expert opinion is that the recent popularity of
Extreme Value (under $3) wines has cannibalized sales in this price range. However,
others (Fuller, 2004) predict that wines price around $5 will experience the most growth
in the future, accounting for up to half of all wines sold in 2007. The $3 to $7 price range
is also the one that has the most appeal for younger consumers (Edwards, 2005).
Clearly, “Fighting Varietals” is an important category to monitor.
Augmentation 3: The Subdivision of Premium Wines
The breakdown of the $7 to $14 price range into two categories, as suggested by
Hay (2001), should be continued. Though spanning a mere $7 range, Table 6 shows this
price point supports over a third of BevMo’s Cabernet Sauvignons. Subdividing this price
point and tracking consumer behavior and segment growth would help wineries
determine if it is better to price above or below the $10 price point.
In recent years the $7 to $10 and $10 to $14 price categories achieved the
highest growth in volume compared with all others. Growth was especially high in 2000

9
at 22% and 23% respectively (Table 3), corresponding to a surge in demand for more
expensive wines in the late nineties (Carlton, 2000). Yet even in 2002, a time of less
economic prosperity, wines in the $7 to $14 range experienced strong (8%) growth and
accounted for 29% of California winery sales in 2002 (Table 4).
By breaking the category into Mid-Premium ($10 to $14) and Popular Premium
($7 to $10), Table 6 shows BevMo offers slightly more (64) of the latter than the former
(48), but these categories have a strong presence in both retail outlets. Even a high-end
purveyor like K&L Wine Merchants offers a few Cabernet Sauvignons in both these tiers,
suggesting these are two price categories that few retail establishments are willing to
concede.
Augmentation 4: Grouping by Three Super Categories
It may also be useful to look at the two broader groups in which the original four
segments are divided in Table 4. The first group, Premium wines, includes all wines
priced above $7, as opposed to the Everyday wines of the second group. This two-group
division pre-dates the Fall 2004 proposed restructuring of Mondavi into “Lifestyle” and
“Luxury” brands, leading to the attempted sale of the latter, forestalled only by
Constellation’s buyout. Lifestyle brands, those retailing for under $15 per bottle,
represented 86% of case sales and 77% of revenue for Mondavi (Franson, 2004). Table
4 shows that the premium wine category accounted for 30% of the case volume sold in
2002 yet made up 62% of the total sales revenue.
Table 5 suggests a different arrangement, with three super groups in place of
two. Luxury wines include the three categories of all wines priced above $25. Premium
Super Segment wines include all wines priced from $7 to $25. Everyday Super Segment
wines would continue to include wines priced below $7. A brief look at two wine retailers
supports this super grouping. Table 6 shows that BevMo, a mid-tier retailer, provides
wines in all these categories, but the majority (58%) falls within the Premium Super
Segment. K&L clearly has a different product offering strategy; 85% of their wines cost
more than $25, and only 1% would fall into Everyday Super Segment wines. The super
category where both merchants effectively compete is the Premium Super Segment.

10
SEGMENTING THE MARKET BY CONSUMER TYPE
While price point segmentation offers a basic way of understanding the wine
market, it simply segments the product market, not the consumer market. Thus it does
not constitute pure market segmentation. That is, use of price points does not satisfy the
basic purpose of segmentation because understanding consumer needs and motivation
is the first step in effective market segmentation. According to Kotler (2003), "a market
segment consists of a group of customers who share a similar set of wants."
As seen in Table 1, American wine consumption per capita has been steadily
rising in recent years and was 8.8 liters/year in 2001. However, the distribution of this
consumption is very uneven, with about 10% of adults making almost 90% of wine
purchases (Himelstein, 2002). Therefore the need for understanding the difference in
consumers’ purchasing behavior is crucial for vintners. Thus, it is appropriate and
important to segment the market by consumer type, as well as by price.
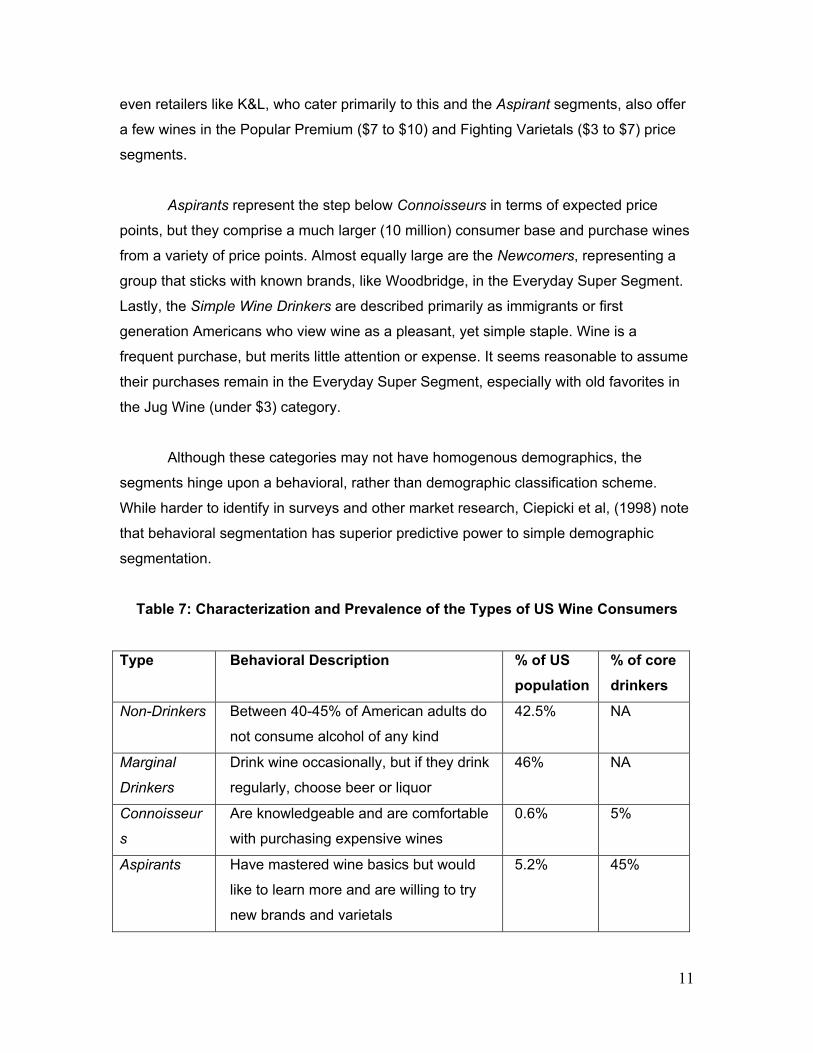
Table 7 presents prior market research on such a behavioral segmentation
model. The most obvious fact is that many Americans (42.5%) are non-drinkers, and the
dominant segment (46%) is that of Marginal Drinkers, those who consume wine only on
special occasions. The remaining 11.5% are core wine drinkers, classified as
Connoisseurs, Aspirants, Newcomers and Simple Wine Drinkers who consume almost
90% of all wine.
Using US census data to estimate the number of Americans of drinking age in
2003 at 203.5 million, then applying the percentages given in Table 7, yields a
population of 23.4 million core drinkers. Although the number of core drinkers has been
increasing, this estimate differs some from another survey, which estimated there were
19.2 million core drinkers in 2000 (Anthony, 2001). Given the three year difference in the
data, these figures are within tolerance for building a basic model, and both pale in
comparison to the magnitude of the nearly 94 million Marginal Drinkers.
Not unexpectedly, the number of consumers in the highest-end bracket,
Connoisseurs, is the smallest by population. However, this is a lucrative clientele with
expensive and frequent purchases, and this class is intensively courted by purveyors of
luxury wines as well as other vendors, such as providers of wine storage cabinets. But
11
even retailers like K&L, who cater primarily to this and the Aspirant segments, also offer
a few wines in the Popular Premium ($7 to $10) and Fighting Varietals ($3 to $7) price
segments.
Aspirants represent the step below Connoisseurs in terms of expected price
points, but they comprise a much larger (10 million) consumer base and purchase wines
from a variety of price points. Almost equally large are the Newcomers, representing a
group that sticks with known brands, like Woodbridge, in the Everyday Super Segment.
Lastly, the Simple Wine Drinkers are described primarily as immigrants or first
generation Americans who view wine as a pleasant, yet simple staple. Wine is a
frequent purchase, but merits little attention or expense. It seems reasonable to assume
their purchases remain in the Everyday Super Segment, especially with old favorites in
the Jug Wine (under $3) category.
Although these categories may not have homogenous demographics, the
segments hinge upon a behavioral, rather than demographic classification scheme.
While harder to identify in surveys and other market research, Ciepicki et al, (1998) note
that behavioral segmentation has superior predictive power to simple demographic
segmentation.
Table 7: Characterization and Prevalence of the Types of US Wine Consumers
Type Behavioral Description % of US population
% of core drinkers
Non-Drinkers Between 40-45% of American adults do
not consume alcohol of any kind
42.5% NA
Marginal
Drinkers
Drink wine occasionally, but if they drink
regularly, choose beer or liquor
46% NA
Connoisseur
s
Are knowledgeable and are comfortable
with purchasing expensive wines
0.6% 5%
Aspirants Have mastered wine basics but would
like to learn more and are willing to try
new brands and varietals
5.2% 45%

12
Newcomers Enjoy wine, but are not yet comfortable
with experimenting. Tend to stick with
known brands at lower price points
4.0% 35%
Simple Wine
Drinkers
Take little interest in learning more about
wine. Are predominantly elders from
traditional wine-drinking countries
1.7% 15%
Source: Moulton et al, 2001
It would be unrealistic to assume that all Newcomers become Aspirants, or
Aspirants become Connoisseurs. Marketing experts (Miller, 2001) have shown that it is
not inevitable that consumers will progress through all price points. Yet it seems likely
some generalizations can be made. For instance, most wine drinkers, especially those
lacking a family tradition of wine consumption, would start as Newcomers. It would also
seem likely that few Connoisseurs or Aspirants morph into the Newcomers.
Assigning a single price point to each consumer segment, such as stating that
Newcomers consume only Fighting Varietals ($3 to $7) and Connoisseurs deign to
purchase only luxury wines would be tempting. However, this simplification is likely to be
highly misleading. A 2003 survey conducted by UC Davis showed that 78% of wine
consumers stated that they are consuming lower priced wines compared to 13% in
2001, a trend that likely cuts across all consumer segments. As consumers gain more
experience, they may not necessarily purchase more expensive wine. Indeed, one of the
advantages of knowledge is the ability to spot a bargain and the confidence to
experiment – or at least resist the pitch that a wine must be good because it is costly.
Experts agree that all US wine drinkers are becoming more adventurous in trying new
wines, especially lower-priced imports.
An Australian marketing survey that computed average price points for different
consumer classes shows surprisingly little differentiation between diverse segments
(Johnson, 2003), at most a 23% decrease from the highest average purchase price.
Finally, each consumer purchases wine for a variety of occasions, and it should not be
expected that every purchase will at the same price point. Wines intended as gifts, to be
served for company or for special occasions are likely to be more expensive than bottles
bought for everyday consumption. Thus assigning a consumer class to a single price

13
niche would be unrealistic, and it would be better to assume a ratio of price points per
consumer segment.
Additionally, assuming that once identified, the percentages of consumers in
each niche will remain constant, or even that these numbers are still valid for the 2004-
2005 time frame given recent market developments may be naïve. For example, the age
cohort with the highest rate of wine consumption is that of people aged 39 to 55 (Smiley,
2004). That age group will continue to expand nationally both in relative percentage and
absolute numbers for the next decade. However, it should not be assumed that wine’s
appeal remains static in time across all age groups. While experts attributed much of the
growth in US consumption in the late nineties and early 2000’s to core consumers
imbibing more (Himelstein, 2002), recent developments such as 1) the appearance of
Extreme Value (under $3) wines, 2) the increased evidence of the health benefits from
moderate wine consumption and associated removal of wine’s aura of vice, and 3) the
publicity wine has recently received in the media suggest that wine is gaining new
converts, and not just from within traditional demographic profiles. Recent surveys show
the youngest possible consumer cohort (aged 21-27) has dramatically increased and
may be responsible for up to 40% of recent growth in per capita consumption (MFK,
2004).
One such source of growth is from a substitution effect. Since the late 1990’s
Americans have been switching away from beer (Edwards, 2005) to other alcoholic
drinks. As beer is the predominant alcoholic beverage of choice for Americans, with per-
capita consumption at 85 liters/year (Beer Institute, 2004), one way to expand the wine
market is to convince Marginal Drinkers to make wine part of their daily lives. For
example, if 20% of national beer consumption was replaced by wine with 5 ounces of
wine consumed for every 12 ounces of beer forgone, the US wine market would grow by
2 billion liters, nearly doubling in size.
A MODEL FOR MARKET SEGMENTATION AND GROWTH
This section presents a spreadsheet model of the US wine market that breaks
down sales volume by price point. The model also includes consumer type segments
and interactions with price points. By projecting growth and migration between consumer
segments, the model can predict changes in consumer demographics and, by extension,
14
sales volume and revenue across all price points. The model is first presented and
benchmarked against 2003 data. A hypothetical growth scenario for 2008 is then
proffered.
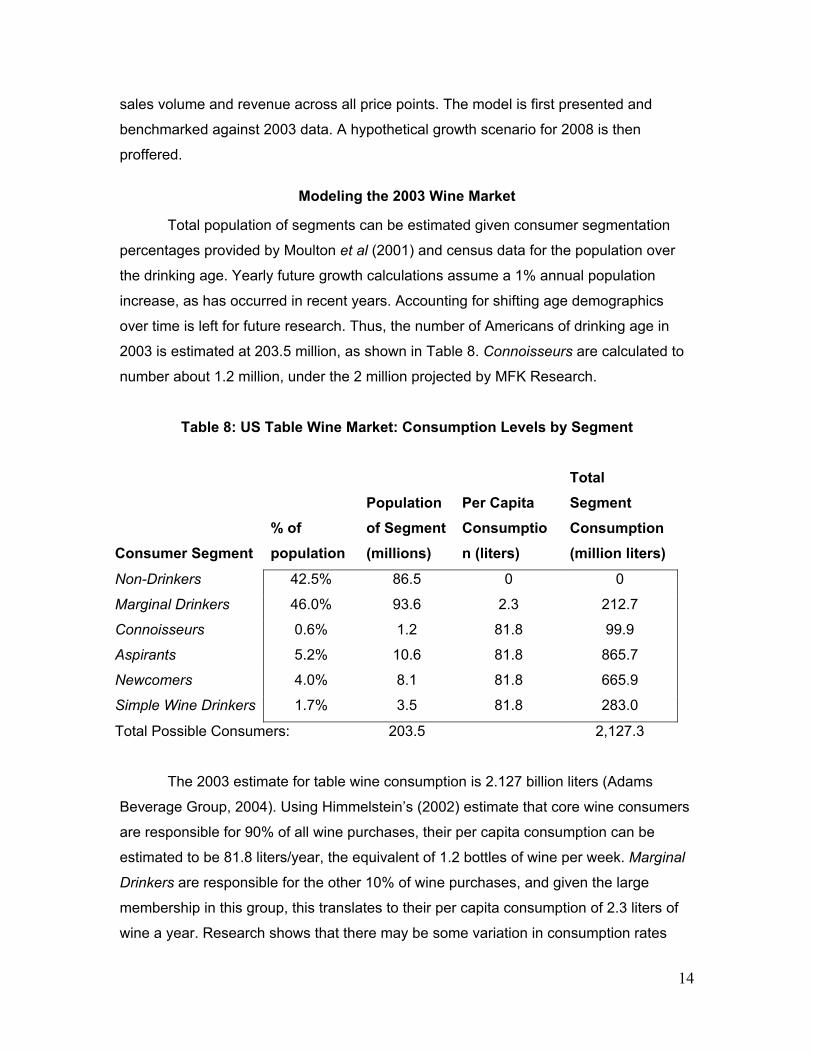
Modeling the 2003 Wine Market
Total population of segments can be estimated given consumer segmentation
percentages provided by Moulton et al (2001) and census data for the population over
the drinking age. Yearly future growth calculations assume a 1% annual population
increase, as has occurred in recent years. Accounting for shifting age demographics
over time is left for future research. Thus, the number of Americans of drinking age in
2003 is estimated at 203.5 million, as shown in Table 8. Connoisseurs are calculated to
number about 1.2 million, under the 2 million projected by MFK Research.
Table 8: US Table Wine Market: Consumption Levels by Segment
Consumer Segment % of population
Population of Segment (millions)
Per Capita Consumption (liters)
Total Segment Consumption (million liters)
Non-Drinkers 42.5% 86.5 0 0
Marginal Drinkers 46.0% 93.6 2.3 212.7
Connoisseurs 0.6% 1.2 81.8 99.9
Aspirants 5.2% 10.6 81.8 865.7
Newcomers 4.0% 8.1 81.8 665.9
Simple Wine Drinkers 1.7% 3.5 81.8 283.0
Total Possible Consumers: 203.5 2,127.3
The 2003 estimate for table wine consumption is 2.127 billion liters (Adams
Beverage Group, 2004). Using Himmelstein’s (2002) estimate that core wine consumers
are responsible for 90% of all wine purchases, their per capita consumption can be
estimated to be 81.8 liters/year, the equivalent of 1.2 bottles of wine per week. Marginal
Drinkers are responsible for the other 10% of wine purchases, and given the large
membership in this group, this translates to their per capita consumption of 2.3 liters of
wine a year. Research shows that there may be some variation in consumption rates

15
between segments of core Australian consumers, with some connoisseurs consuming
40% more than basic or social drinkers (Johnson 2003). As such data is not currently
available for the US market, a uniform consumption rate across all core drinkers has
been assumed. Table 8 shows the breakdown of total consumption by each consumer
segment.
As previously discussed, it does not seem appropriate to assume that all
consumer types stick within a single price point for all wine purchases. While it may be
logical to suppose that Simple Wine Drinkers purchase from the Jug Wine (under $3)
category, all other consumer segments are assumed to purchase across multiple price
points. Connoisseurs and Aspirants are particularly likely to buy wines over a wide range
of price points. Figure 9 presents an initial matching of a ratio of price points to each
consumer segment. These ratios are not based on consumer surveys or other empirical
evidence, but represent a conceptual attempt to incorporate the behavior patterns
reported by Fuller (2005) and Smiley (2004), as well as explain the diversity of product
prices in such niche retailers at K&L Wines. For example, Connoisseurs are assumed to
purchase across all price points, save for the (under $3) Jug Wines, and they are the
only class to purchase Icon (over $100) wines. But it is assumed that even Connoisseurs
cannot afford to drink wines from the Luxury Super Segment everyday, resulting in the
highest concentration of purchases in the Popular Premium ($7 to $10) and Mid-
Premium($10 to $14) price points. In a similar vein, Aspirants are assumed to make
purchases over a wide variety of segments as do Connoisseurs, though shifted
downwards in price. Newcomers’ purchases are concentrated in Fighting Varietals ($3 to
$7), but they are assumed make some purchases of both higher and lower priced wines.
Figure 9: A Comparison of Consumer Profiles, Estimated Percentage of Wine Purchased at Different Price Points

16
0%
20%
40%
60%
80%
100%
Jug Wine
Extreme Value
Fighting Varietals
Popular Premium
Mid-Premium
Ultra PremiumLuxurySuper LuxuryIcon
% P
urch
ases
in P
rice
Cat
egor
yMarginal Drinkers ConnoisseursAspirantsNewcomersSimple Wine Drinkers
Given this projected breakdown of buying behavior by price point, the number of
consumers in each segment and per capita consumption rates, the 2003 volume of wine
sold in each price segment can be estimated. While these estimates are based on
assumptions that have yet to be proven with market surveys or other methods, they are
not out of line with prior data on per-category sales. Comparing results in Figure 10 with
data from 2000 in Table 3 shows similar results: high end wines account for 7 to 8% of
all sales by volume, and the lower priced wines gain progressively more share of the
market. Also, this analysis shows 14% of the market by volume falls in the Extreme
Value (under $3) category, consistent with what has been reported in the popular press.
Figure 10: Sales Volume by Price Segment, Subdivided by Consumer Type

17
0100200300400500600700
Jug Wine
Extreme ValueFighting Varietals
Popular Premium
Mid-Premium
Ultra PremiumLuxurySuper LuxuryIcon
Vol
ume(
mill
ion
liter
s) .
Simple Wine DrinkersNewcomersAspirantsConnoisseursMarginal Drinkers
Figure 11: Revenue by Price Segment, Subdivided by Consumer Type
$0$500
$1,000$1,500$2,000$2,500$3,000$3,500$4,000
Jug Wine $2.5
Extreme Value $2.5
Fighting Varietals $6
Popular Premium $9
Mid-Premium $13
Ultra Premium $20
Luxury $40Super Luxury $75
Icon $120
Rev
enue
s (m
illio
n $ Simple Wine Drinkers
NewcomersAspirantsConnoisseursMarginal Drinkers
By assuming an average price point for each category of wine it is then possible
to estimate revenue by price segment. Figures 10 and 11 show that Aspirants account
for the most purchases in all price categories save for three: 1) the under $3 Jug Wines,
the domain of the Simple Wine Drinkers, 2) Icon (over $100) wines, and 3) Fighting
Varietals ($3 to $7), where Newcomers have a greater share. Assigning Aspirants to a
single niche or using only the $10.74/bottle average price fails to capture this large
consumer group’s purchasing habits. Connoisseurs, although estimated to have large

18
per-capita and per-bottle expenditures, as shown in Table 12, are too few in number to
drive any price category, save for the upper end of the Luxury Super Segment.
Table 12 also presents the 2003 estimate for total table wine expenditures. This
tally of $17 billion can be compared to existing data. For instance, given the Wine
Institute’s estimate of the size of the 2003 US market for all wine products at $21.6
billion, as well as the assumption that table wine’s revenue share of the total wine
market is the same its share by volume, 89% (Wine Institute, 2004), total 2003 revenue
from table wines should be closer to $19.2 billion. Thus, the model seems to under
predict the size of the market by a discrepancy of 12%. As this model is intended for
conceptual purposes until more accurate data is available, the authors feel this
difference is acceptable.
Table 12: Expenditure per Customer Segment
Customer Segment Expenditures (millions)
Per Capita Expenditure
Average Price/ Bottle
Marginal Drinkers $1,691 $18 $ 7.95
Connoisseurs $1,792 $1,468 $ 17.94
Aspirants $9,298 $879 $ 10.74
Newcomers $3,496 $430 $ 5.25
Simple Wine Drinkers $708 $205 $ 2.50
Total $16,985
Table 13: Comparing Volume and Revenue Market Shares from Prior Research
Model Estimates for 2003 Sales
2000 US Sales, from Table 3
2002 Sales of Californian Wine,
from Table 4 Retail Price per
750ml % total volume
% total revenue
% total volume
% total revenue
% total volume
% total revenue
Up to $3 36% 11% 44% 17% 35% 12%
$3-$7 30% 22% 33% 31% 35% 26%

19
$7-$14 26% 34% 16% 27% 19% 29%
Over $15 8% 32% 7% 25% 11% 33%
When categories are aggregated to match previous price points, as per Table 13,
the model’s estimates also show similar patterns to prior results, if not absolute numeric
agreement. Namely, cheaper price segments account for greater sales volume, but the
percent of total revenue increases with each price point, as per-unit price dominates
sales volume. Although from different years and data sources, it is interesting to
juxtapose percentages from Tables 3 and 4, as the latter measures sales of California
wine. From this comparison it can be seen that Californian wines command a greater
share of the Premium market, and the average revenue per bottle are greater.
The Future of the US Wine Market: A High Growth Scenario
The model could then be used to show how the US wine market might appear in
2008. The wine market will be larger as overall population is assumed to grow at a 1%
annual rate, but this scenario’s key premise is that some Non-Drinkers and Marginal
Drinkers will be converted into core consumers. No other migration between consumer
segments is assumed, although all segments except Marginal Drinkers gain additional
members, as seen in Table 14. All other parameters, such as per capita consumption by
segment and buying behavior by price are unchanged from 2003 values. Monetary
values are left in 2003 dollar equivalents, ignoring inflationary effects.
Table 14: Future Scenario: Growth and Migration Between Consumer Segments
Consumer Segment % of
population
Change from 2003
2008 Segment Population (millions)
Change from 2003 (millions)
Non-Drinkers 41.0% -1.5% 87.7 1.2
Marginal Drinkers 37.0% -9.0% 79.1 -14.5
Connoisseurs 0.6% 0.0% 1.3 0.1
Aspirants 5.2% 0.0% 11.1 0.5
Newcomers 14.5% 10.5% 31.0 22.9
Simple Wine Drinkers 1.7% 0.0% 3.6 0.2
Total Possible Consumers: 213.9
20
By shifting 10.5% of the population from two non-core drinking segments to
Newcomers, the overall wine market would grow in volume by 89% to over 4 billion
liters, an extreme but interesting scenario to explore. Wines at all price points experience
demand increases, but given the change in the composition of the consumer segments,
not all price points experience the same growth. Figure 15 shows that the model projects
that Fighting Varietals ($3 to $7) would experience the most growth, increasing by 138%
in volume from 2003 levels. Assuming producers can still profitably produce the Extreme
Value (under $3) wines, consumer behavior suggests that this segment will also
continue to grow, mostly driven by Newcomer purchases. High-priced wines in the Ultra-
Premium ($50 to $75) to Icon (over $100) segments grow by a mere 3% to 5% in
volume.

21
Figure 15: Predicted Volume by Price Segment, 2003 verses 2008
0200400600800
1000120014001600
Jug Wine
Extreme ValueFighting Varietals
Popular PremiumM
id-PremiumUltra PremiumLuxurySuper LuxuryIcon
Vol
ume
(mill
ion
liter
s).
20032008
Figure 16: Predicted Revenue by Price Segment, 2003 verses 2008
$-$1,000$2,000$3,000$4,000$5,000$6,000$7,000$8,000$9,000
$10,000
Jug Wine
Extreme ValueFighting Varietals
Popular Premium
Mid-Premium
Ultra PremiumLuxurySuper LuxuryIcon
Rev
enue
s (m
illio
ns $
)
20032008
Table 16 shows that revenue increases over the five years for all price points.
Because of the greater growth of lower priced wines, overall revenue is projected to
22
grow only by 57%. Thus, the average price of wine would effectively drop 17% from
$7.98 to $6.60 per bottle. This result runs counter to the long term price increases shown
in Figure 2, but may accurately reflect changing demographics and market realities.
While the Fighting Varietals ($3 to $7) gain $5 billion in revenue, Popular and Mid-
Premium ($10 to $14) wines each gain over $1 billion. Thus, wineries looking to expand
their market presence should consider actively targeting these price points. Given model
assumptions, high priced segments will produce minimal additional revenue, less than a
$238 million increase for all segments above $14 combined. These results run counter
to the growth of luxury wines in the late 1990’s. It would appear that the time is past for
attempting to establish a luxury wine brand, other than for flagship purposes.
CONCLUSION: DISCUSSION AND FUTURE RESEARCH
The US wine market has undergone dramatic changes in the past few years and
is far from achieving stasis. While future growth is inevitable, it will not be uniform across
the wide range of price points and consumer types. Thus it is imperative that wine
producers gain a better understanding of the evolving market dynamics and formulate
their product offerings and pricing strategies to successfully grow their market shares
and revenue.
Based on model results and expert opinions, the strongest changes are likely to
result from the conversion of Marginal Drinkers to core wine consumers. It is likely these
drinkers will enter as Newcomers, driving up the sales of wines in the Fighting Varietals
($3 to $7) and Popular Premium ($7 to $10) segments. In addition to providing more
offerings at lower price points, savvy producers will attempt to entice more Marginal
Drinkers by making wine more approachable with clear and catchy labels, use of screw
caps and other alternate packaging. The recent purchase of Barefoot Cellars, a strong
brand primarily priced within the Fighting Varietals ($3 to $7), shows that Gallo has
anticipated this market need. Industry experts note that Gallo was looking for a youth-
oriented brand (Norberg, 2005).
Many sources agree that consumers will continue to exhibit price sensitivity and
engage in product experimentation. In particular, Connoisseurs and Aspirants are
expected to continue trying new wines from a variety of price points and regions. Thus,
the use of a single price point to represent the purchasing behavior of a consumer
23
segment is overly simplistic. The model introduces the concept of consumer profiles,
which can then be used to show how the growth in a consumer segment may translate
to changing demands for wines in each of the nine different price segments.
Model projections show that the Fighting Varietals ($3 to $7), Popular Premium
($7 to $10) and Mid-Premium ($10 to $14) niches experience the greatest increase in
revenue, over $1 billion within each niche. These results for this group of $3 to $10
wines have been corroborated by opinions of experts (Fuller, 2004). While many
Californian producers feel they have ceded this price range to other New World
exporters (Smiley, 2004), those that wish to grow their revenue should consider
maintaining strategic presence here. Competition will be fierce, as New World imports,
primarily from Australia, currently claim a 51% share of all wines sold through US
supermarkets at $6 to $9 per bottle (Fujii, 2005). Difficult as this battle will be, it makes
marketing sense to fight it now as there would seem to be little business opportunity in
investing in the higher price segments solely for increasing revenue.
The major contributions of this research effort are the revision and improvement
of the existing price segment model and an introduction of a conceptual model that maps
purchasing behavior across consumer segments to these revised price points. Although
data from many sources was utilized to benchmark the model for 2003 results, the very
newness of these contributions means it was difficult to obtain data to validate some of
the model concepts. This lack of data will be addressed in future research efforts
An appropriate next step is to validate the nine segment price model. This effort
could likely be managed through a partnership with analysts from firms like Gomberg-
Fredikson & Associates to gain access to the existing Point of Sales (POS) sales, re-
aggregate the date to correspond to the proposed segmentation scheme, and measure
recent years’ sales volume and growth each segment.
A challenging but important area of future research would be to validate the
model’s assumptions concerning consumer segments. It is important to determine
whether this classification scheme is accurate and to better understand the behaviors of
each segment. Questions include, but are not limited to, determining the population of
each segment, the migration rates between each segment, and the per capita

24
consumption by segment by both volume and price-segment. Research tools to assist
with these investigations could include surveys to determine personal spending from
self-reported behavior and as well as data-mining POS data from wine retailers. For
instance, it could be informative to collect and then analyze several days worth of
market-basket information from a retailer like K&L Wines, which would show a range of
individual consumers’ purchases over price points. The ideal study would tie self-
reported consumer behavior with their purchases, so demographic information and
additional purchase behavior history could be collected.
Many other avenues of exploration are possible. As previously mentioned, these
consumer segments are inherently behavioral rather than demographic in classification.
However, it may be worthwhile to investigate if these categories can be tied more closely
to demographic information, as demographic information is much easier to collect, with
less reliance on surveys. Additionally, as the existing market segmentation literature was
reviewed, the question the use of user-based segmentation over occasion-based
segmentation was raised. Although Dubow (1992) shows that the latter yields more
useful information, it is also suggested that surveys can be designed to accommodate
both these approaches and derive a map that translates user-based segmentation to
occasion-based. Results from all these further investigations would help to clarifying
market dynamics and improve the accuracy and believability of the model predictions.
In summary, price and consumer segmentation models are essential tools for
winery managers to best plan product offerings and brand strategies. The revising of the
traditional industry price segmentation model to include three “super” segments and nine
price points provides winery strategy-makers and industry experts with a contemporary
framework that incorporates the recent developments brought on by globalization and
other industry driving forces. World wine markets are constantly evolving and producers
positioned to develop brands in high growth segments will prosper at the expense of
wineries that rely on outdated demographic information or expect to sell to a static
marketplace. Developing, validating and then applying price and consumer
segmentation models to understand these changes and formulate strategic decisions will
be critical for succeeding in this changing and challenging marketplace.

25
REFERENCES
Adams Beverage Group (2004). Adams wine handbook. Connecticut: Bev-Al
Communications Inc.
Anthony, L. (2001, December 5). New MKF report shows competition is strong.
Retrieved April 1, 2004 from http://www.mkf.com.
Beer Institute (2004). State of the industry. Retrieved December 29, 2004, from
http://www.beerinstitute.org/stateindreport.htm.
California drinking, (2003, June 7). The Economist.
Carlton, J. (2000, September 12). Surge in premium wine sales sparks consolidation:
California vintners embark on acquisition spree to meet growing demand. Wall Street
Journal.
Cierpicki, S, C M Rungie and M Faulkner (1998). Segmentation: Linking Management
Practice to Marketing Theory. ANZMAC, Dunedin, New Zealand, University of Otago.
Cholette, S. (2004). A tale of two wine regions: similarities, differences and trends in the
French and Californian wine industries. International Journal of Wine Marketing, 14 (2).
Cholette, S., Castaldi, R., & Frederick, A. (2005). The globalization of the wine industry:
Implications for old and new world producers, 4th Annual International Business and
Economics Conference, Honolulu, HI. Conference proceedings, available from
http://userwww.sfsu.edu/~ibec/
Dubow, J. (1992). Occasion-based vs. user-based benefit segmentation: A case study.
Journal of Advertising Research 32(2).
Edwards, G. (2005, January 10). Beer is still king, but wine and spirits are close behind.
Sfgate.com. Retrieved January 10, 2005 from http://www.sfgate.com.
26
Franson, P. (2004, September 17). Mondavi chairman says media got story wrong. Wine
Business Online. Retrieved September 17, 2004 from http://winebusiness.com.
Frederick, A. (2004). A global perspective on the US wine industry- Master’s thesis,
California: San Francisco State University.
Fujii, R. (2005, January 27th). Wine grape balance seen: Supply has been outstripping
demand lately. RecordNet. Retrieved January 27, 2005 from http://www.recordnet.com/
Fuller, J. (2004, June 20). Americans snap up affordable wine imports. Chicago Sun.
Gomberg-Fredrikson & Associates, (2003). 2002: Annual review of the California wine
industry. California: Gomberg-Fredrikson & Associates.
Hay, J. (2001). The U.S. wine industry- 2000 and beyond. Beverage Industry; 92 (2),16.
Heeger, J. (2004). Conference highlights luxury wine revival.Napanews.com, February
27th, 2004, Retrieved December 29th, 2004 from http://www.napanews.com.
Himelstein, L. (2002, September 30). This merlot’s for you: As sales languish, U.S.
winemakers go mass market, like beer, Business Week, 3801.
Johnson, T. (2003). An empirical confirmation of wine-related lifestyle segments in the
Australian wine market. International Journal of Wine Marketing. 15(1), 5-34.
Kotler, P. (2003). Marketing Management. New Jersey: Prentice Hall.
Miller, C. (2001). Reaching the wine consumer, In K. Moulton & J. Lapsley (Eds.),
Successful wine marketing. Gaithersburg, Maryland: Aspen Publication, Inc.
MKF (2004). Economic impact of California wine 2004. St. Helena, California: MKF.
Moulton, K., Spawton, A., & Bourqui, M. (2001). Introduction: Consumer behavior and
marketing strategies. In K. Moulton & J. Lapsley (Eds.), Successful wine marketing.

27
Gaithersburg, Maryland: Aspen Publication, Inc.
Norburg, B. (2005, January 5). Gallo buys Barefoot Cellars. The Press Democrat.
Retrieved January 5, 2005 from http:/www.pressdemocrat.com.
Silverman, M., Castaldi, R., Baack, S. & Sorlien, G. (2002). Competition in the global
wine industry: A U.S. perspective. In A.Thompson & A.J. Strickland (Eds.), Strategic
management: Concepts and cases, New York: McGraw-Hill Irwin.
Smiley, R. (2004). A resurgence from the trenches: Emerging from a tough market with
new expectations. 2004 Wine Industry Symposium. California: UC Davis Graduate
School of Management.
Wine Business Online (2003, February 28) Bottom lines: ‘Two Buck Chuck’ category
expands as GSV introduces ‘Pacific Peak.’ Wine Business Online. Retrieved May 10,
2004 from http://winebusiness.com.
Wine Institute (2004). Industry background and statistics. Retrieved January 5, 2005,
from http://www.wineinstitute.org.
Recommended