Analyzing Research Data Using Excel
© Fraser Health Authority, 2012
The Fraser Health Authority (“FH”) authorizes the use, reproduction and/or modification of this publication for purposes other than commercial redistribution. In consideration for this authorization, the user agrees that any unmodified reproduction of this publication shall retain all copyright and proprietary notices. If the user modifies the content of this publication, all FH copyright notices shall be removed, however FH shall be acknowledged as the author of the source publication.
Reproduction or storage of this publication in any form by any means for the purpose of commercial redistribution is strictly prohibited.
This publication is intended to provide general information only, and should not be relied on as providing specific healthcare, legal or other professional advice. The Fraser Health Authority, and every person involved in the creation of this publication, disclaims any warranty, express or implied, as to its accuracy, completeness or currency, and disclaims all liability in respect of any actions, including the results of any actions, taken or not taken in reliance on the information contained herein.

22
http://research.fraserhealth.ca/
33
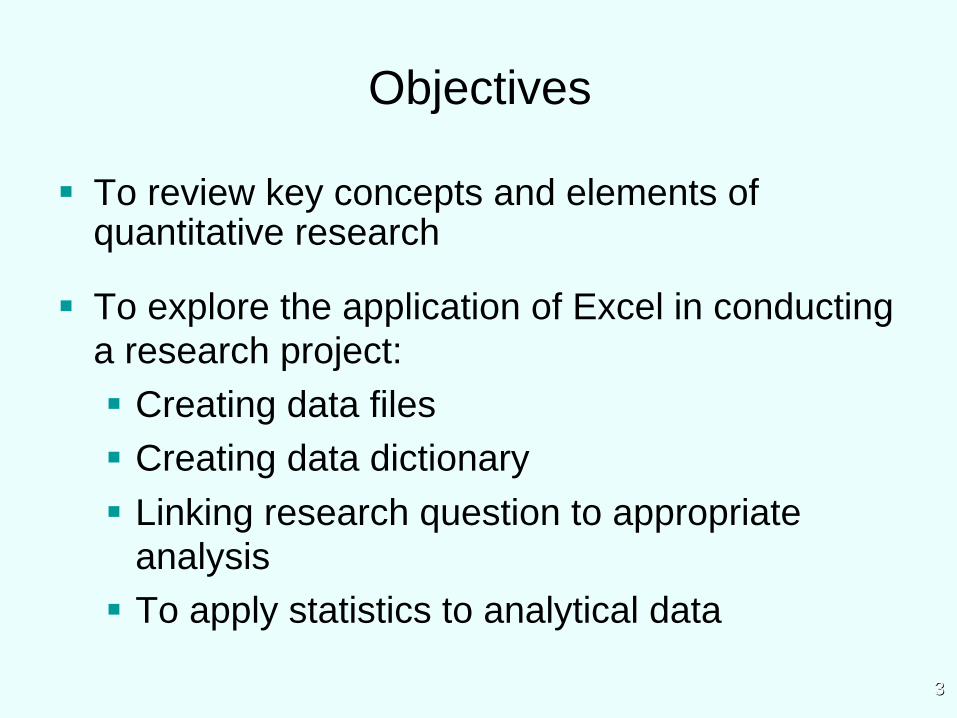
Objectives
To review key concepts and elements of quantitative research
To explore the application of Excel in conducting a research project:
Creating data files
Creating data dictionary
Linking research question to appropriate analysis
To apply statistics to analytical data

44
Workshop Outline
09:00 - 09:15 Review of Quantitative Research09:15 - 09:30 Measurement09:30 - 10:30 Excel 101
Excel as database10:30 - 10:45 Break10:45 - 11:15 Using Excel to Clean/Explore Data 11:15 - 12:00 Using Excel to Analyze Data

55
Excel Pop Quiz
How many columns?
2003: 256
2007 & 2010: 16,384
How many rows?
2003: 65,546
2007 & 2010: 1,048,576 1,048,576
True or False
You can conduct statistical analyses in Excel?

66
Quick Review of Quantitative Research

77
Framework for Quantitative Research
Conduct literature reviewDevelop rationale
Formulate research question
Generate objective(s) and/or hypothesis
Apply methods and conductthe study
Why do want to do this research?What do others say?What are knowledge gaps?
PICO MethodP = population / patientI = interventionC = comparisonO = outcome
Hypothesis(Usually) statement of anticipated
results
Objective“Action” statement
MeasurementStudy DesignAnalysis
88
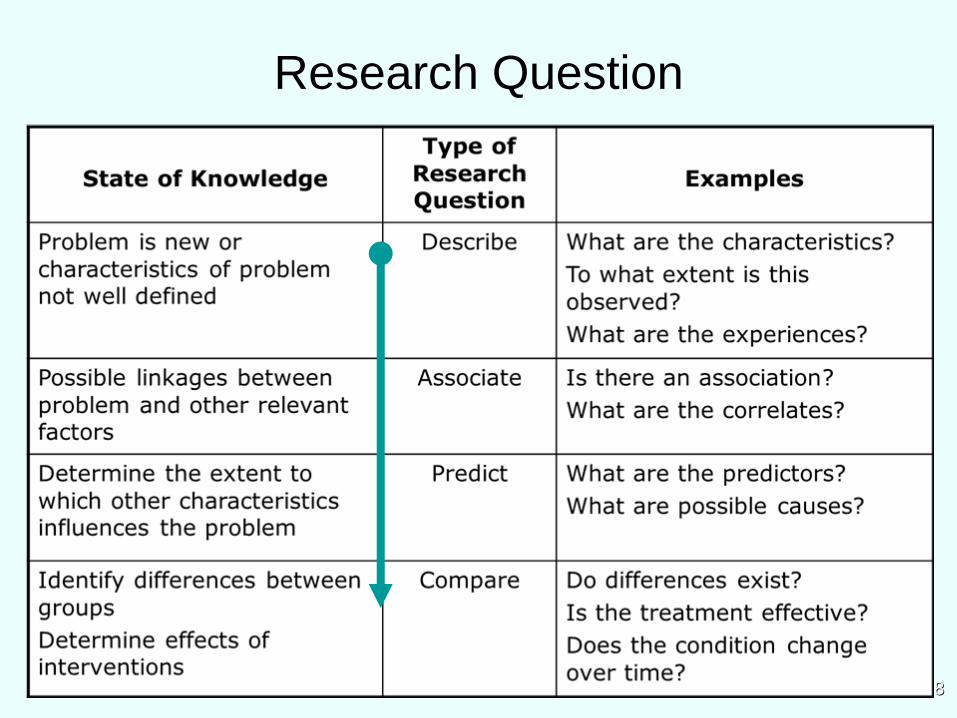
Research Question
99
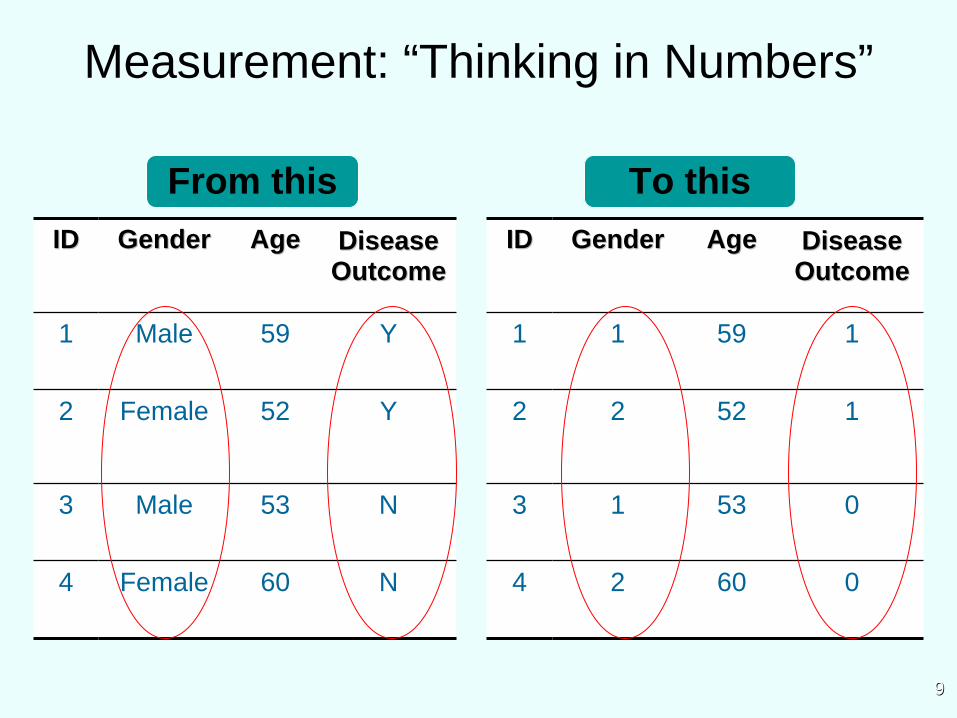
Measurement: “Thinking in Numbers”
IDID GenderGender AgeAge Disease Disease OutcomeOutcome
1 Male 59 Y
2 Female 52 Y
3 Male 53 N
4 Female 60 N
IDID GenderGender AgeAge Disease Disease OutcomeOutcome
1 1 59 1
2 2 52 1
3 1 53 0
4 2 60 0
From this To this
1010
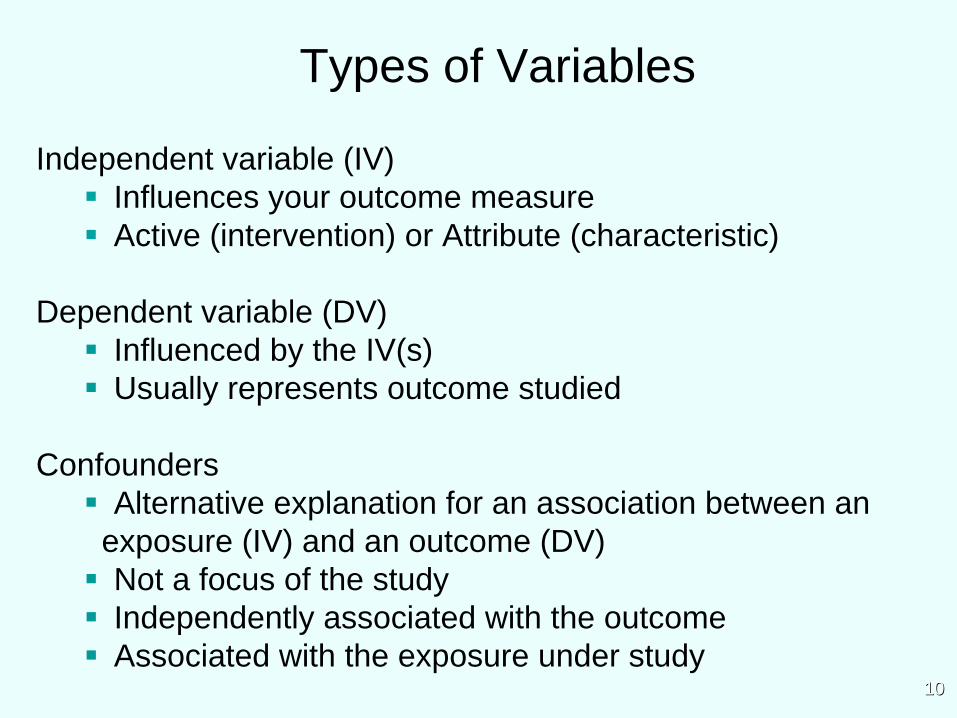
Types of Variables
Independent variable (IV)
Influences your outcome measure
Active (intervention) or Attribute (characteristic)
Dependent variable (DV)
Influenced by the IV(s)
Usually represents outcome studied
Confounders
Alternative explanation for an association between an
exposure (IV) and an outcome (DV)
Not a focus of the study
Independently associated with the outcome
Associated with the exposure under study
1111
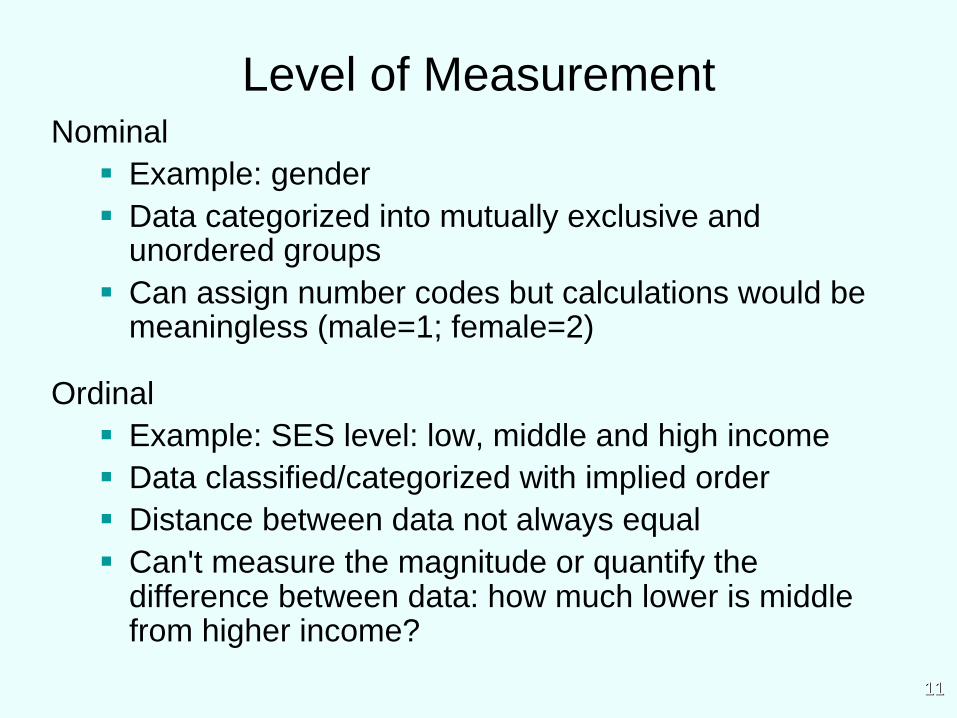
Level of MeasurementNominal
Example: gender
Data categorized into mutually exclusive and unordered groups
Can assign number codes but calculations would be meaningless (male=1; female=2)
Ordinal
Example: SES level: low, middle and high income
Data classified/categorized with implied order
Distance between data not always equal
Can't measure the magnitude or quantify the difference between data: how much lower is middle from higher income?

1212
Interval: attributes measured on interval scales
Equal distance between each interval
Distance between scale numbers has meaning
Arbitrary zero point (e.g., temperature)
Ratio: similar to interval scale
Has true zero point
Clear definition of 0: There is none of the variable
Example: weight, salary ($0=$0).
Can make assumptions about the ratio of two measurements – 6 grams is twice as much as 3 grams
Level of Measurement

Level of Measurement & Acceptable Statistical Operations
Nominal Ordinal Interval Ratio
Frequency distribution Yes Yes Yes Yes
Mode Yes Yes Yes Yes
Median & percentile No Yes Yes Yes
Mean & standard deviation No No Yes Yes
1313

1414
Excel 101

Objectives
How to organize data in an MS Excel spreadsheet
How to define variables
How to code in preparation for analysis
1515

1616
Terminologies
Data: Information that you collect
Dataset
Collection of data usually presented in tabular form
Columns represents variables
Rows represent members of the dataset
Spreadsheet
Computer application that facilitates use of datasets (enter data, analyses, sharing)
MS Excel is a spreadsheet program

1717
Using Excel for a Research Study
To capture data
Facilitate data collection, minimize entry errors
To clean/explore/describe data
Starting point for analyses is “cleaning” raw data
Preliminary descriptive statistics
To analyze data
Using program “add-ins”
1818
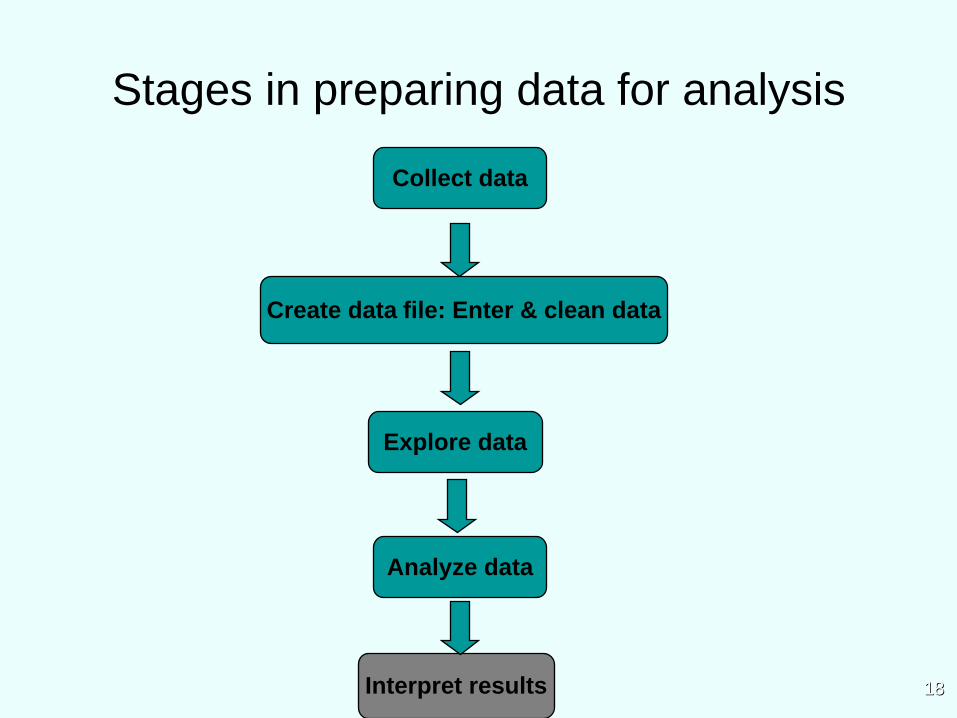
Stages in preparing data for analysis
Interpret results
Explore data
Create data file: Enter & clean data
Collect data
Analyze data

1919
Stages in preparing data for analysis
Good practice
Design your spreadsheet keeping your statistical analyses in mind Use logic check to clean data Create data dictionary Consult with analyst

2020
Creating data file using spreadsheet
Each variable (e.g., ID #) represented by a column
Each participant is represented by a row
All the information for a single case is entered across one row only
the data in each column summarizes information on a particular variable

2121
Creating Your SpreadsheetDefining variables
Use descriptive, unique, names for variables
Use underscore (_) instead of space
Be consistent in naming especially with array variables
Variables that capture a pattern
Example: measuring blood pressure at regular intervals (e.g., Q30 min for 12 hours)
BP_time1 BP_time2 BP_time3
BP_30min BP_1hr BP_final
2222
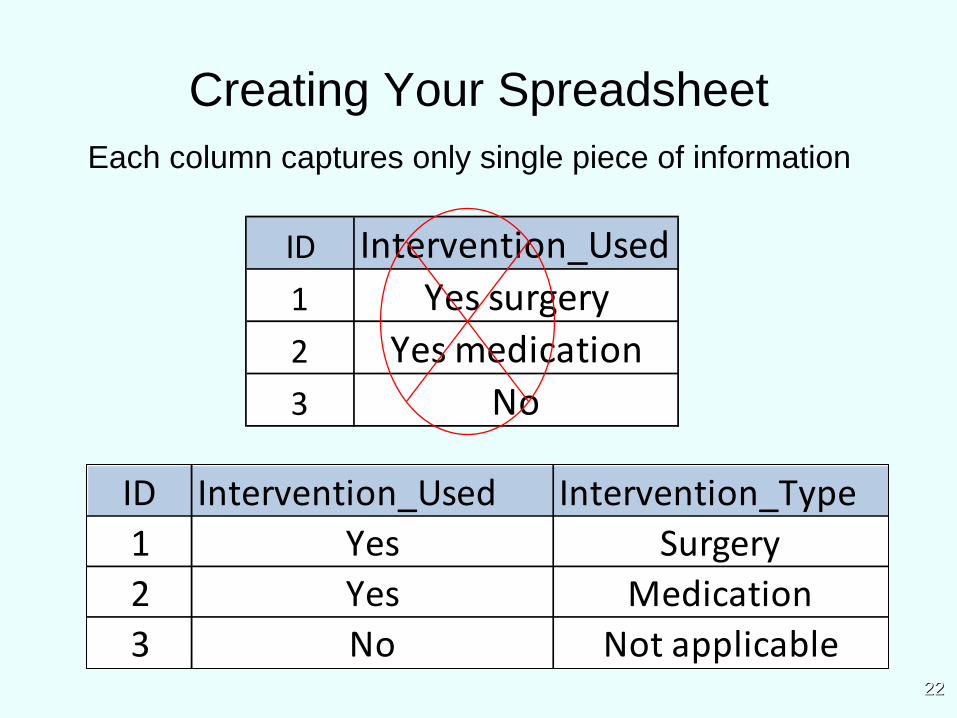
Creating Your SpreadsheetEach column captures only single piece of information
ID Intervention_Used1
2
3
Yes surgeryYes medication
No
ID Intervention_Used Intervention_Type123
SurgeryMedication
Not applicable
YesYesNo

2323
Creating Your SpreadsheetUse tools to facilitate entry: Add notes for data entry Insert Comments

2424
Creating Your SpreadsheetUse tools to facilitate entry: Colour-code columns Fill color icon
2525
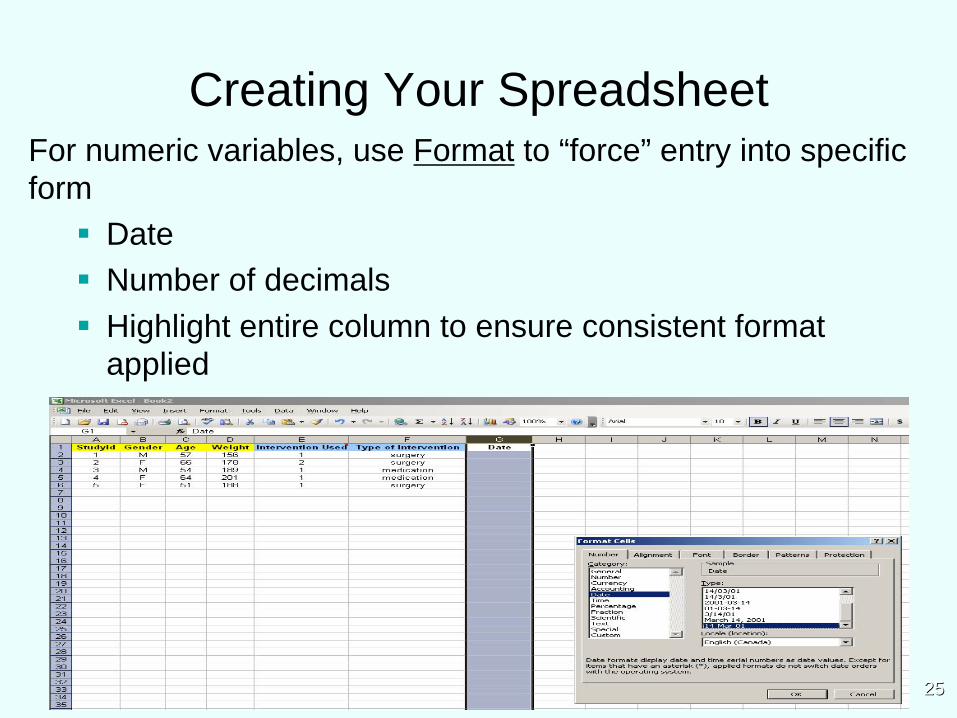
Creating Your SpreadsheetFor numeric variables, use Format to “force” entry into specific form
Date
Number of decimals
Highlight entire column to ensure consistent format applied

2626
Data Dictionaries
AKA code books
A “centralized repository of information about data such as meaning, relationships to other data, origin, usage, and format”
Develop data dictionary: Before collecting data
Components:
Variable name
Variable label
Type: nominal or interval
Values/coding for each variable
Always assign values for missing or non applicable cases

2727
Sample Data DictionaryData Dictionary for Research Consults Database
Item Variable Label Type Coding/ entry instruction
1 ID_no ID number Numeric Enter unique number for each
record/patient (1….100)
2 Gender Gender of participant String Enter corresponding number:0= Female1= Male999= missing
3 Date_T1 Date at baseline Date Specify format: mm/dd/yy
4 Education Highest level of
educationNumeric Enter corresponding number:
1= Grade 102= Grade 123= College Diploma4= University
Data Structures
Re-emphasize importance of keeping analyses in mind when designing dataset
Statistical packages require that data are entered in specific way in order to run analytical steps
2828

2929
Using Excel to Clean / Explore Data

3030
Data Cleaning & Data Exploration
Data at this stage is raw dataset
Need to
Clean: any entry errors, duplicate entries
convert text variables into numeric variables
Explore: any outliers
Excel tools to facilitate cleaning and exploring
Filter
Sort
3131
Data Cleaning & Data Exploration
Sources of data errors: Missing: never leave blank
Assign a meaningful number for missing values
Consider coding for cases with non-applicable responses
Typing errors on data entry (e.g., age= 121) Measurement errors (e.g., height)
Identify errors: Descriptive statistics for each variable Minimum and maximum values Means, medians and SD

3232
Our “Dataset” for the Remainder of the Workshop

3333
Gout and AMI Study
3434
Gout and AMI 2 Study
Research Question
What clinical factors are associated with the development of AMI among elderly women with gout?
Objectives
To compare women with gout and no gout on clinical factors including age, BMI, uric acid level
To evaluate the correlation between clinical factors among elderly women with gout and without gout

3535
Gout and AMI 2 Dataset

3636
Gout and AMI 2 Study
Data dictionary (handout)
13 Variables
What are the continuous variables?
What are the categorical variables?
N = 200 subjects
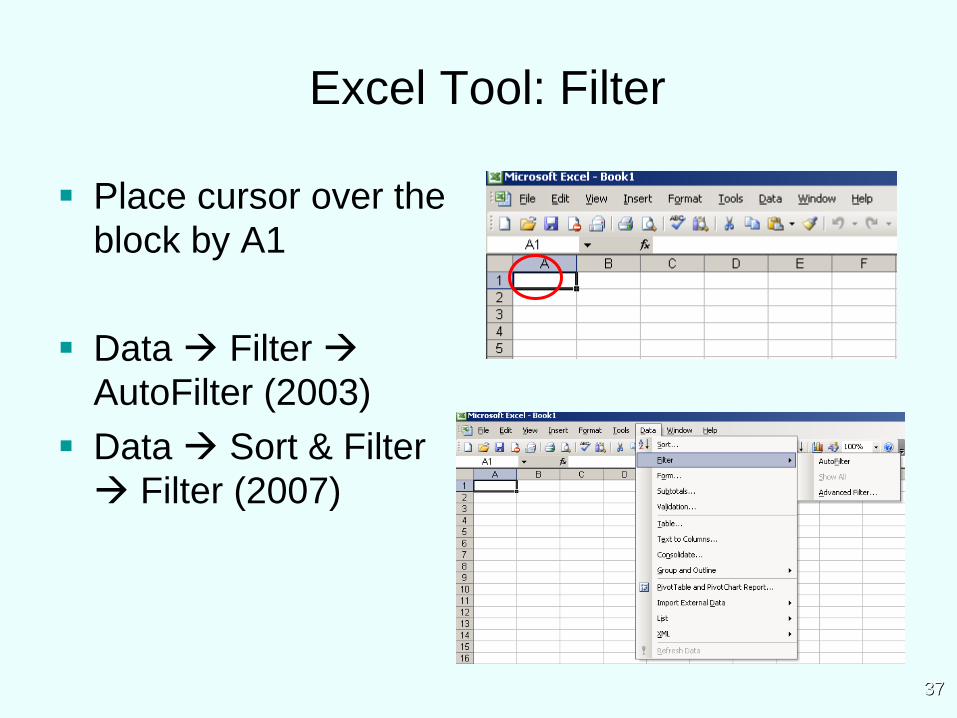
Excel Tool: Filter
Place cursor over the block by A1
Data Filter AutoFilter (2003)
Data Sort & Filter Filter (2007)
3737

Exercise 1
You are the analyst for the Gout and AMI 2 study. A data dictionary was not implemented (GASP!) and there are entry errors.
Clean the dataset by locating and finding entry errors using tools in Excel.
Sample_worksheet_Exercise1.xls
3838

SummaryImportant data considerations while conducting the study
Designing the dataset
Collecting the data
Entering the data
Cleaning/exploring raw data
Applying statistics to analytical data
3939

4040
Using Excel to Analyze Data

4141
Using Excel to Analyze Data
Analysis ToolPak: add-in to be installed in Excel
Supplemental program that adds custom commands
Descriptive statistics
Analytical statistics
T-tests
Correlation

4242
Getting Started
1. Click Tools Add-Ins
2. Select Analysis Tool Pack
4343
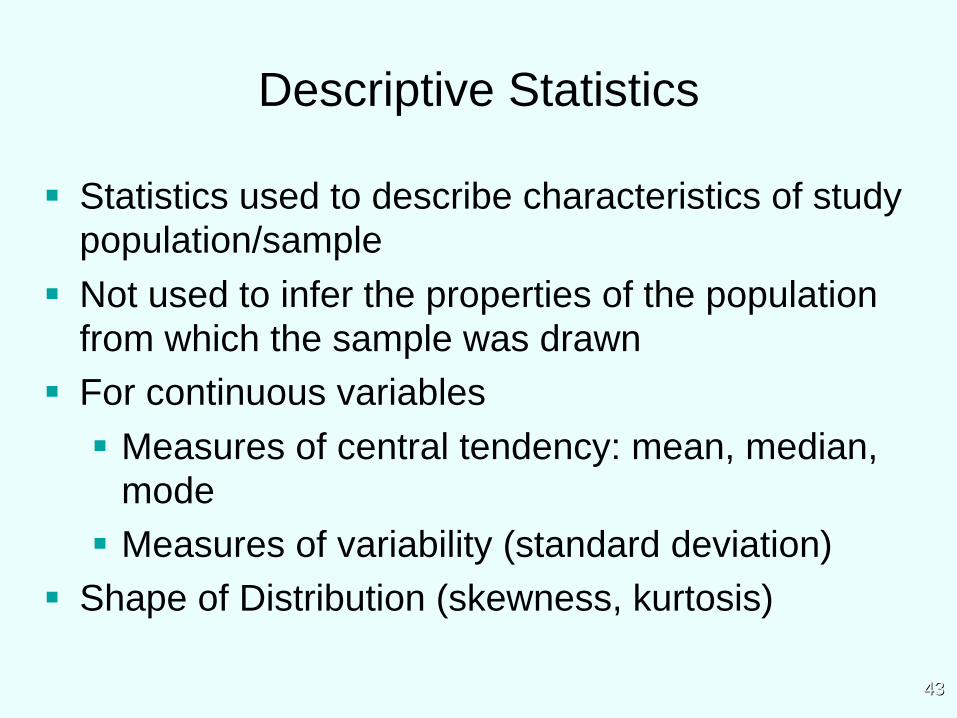
Statistics used to describe characteristics of study population/sample
Not used to infer the properties of the population from which the sample was drawn
For continuous variables
Measures of central tendency: mean, median, mode
Measures of variability (standard deviation)
Shape of Distribution (skewness, kurtosis)
Descriptive Statistics

Level of Measurement & Acceptable Statistical Operations
Nominal Ordinal Interval Ratio
Frequency distribution Yes Yes Yes Yes
Mode Yes Yes Yes Yes
Median & percentile No Yes Yes Yes
Mean & standard deviation No No Yes Yes
4444
4545
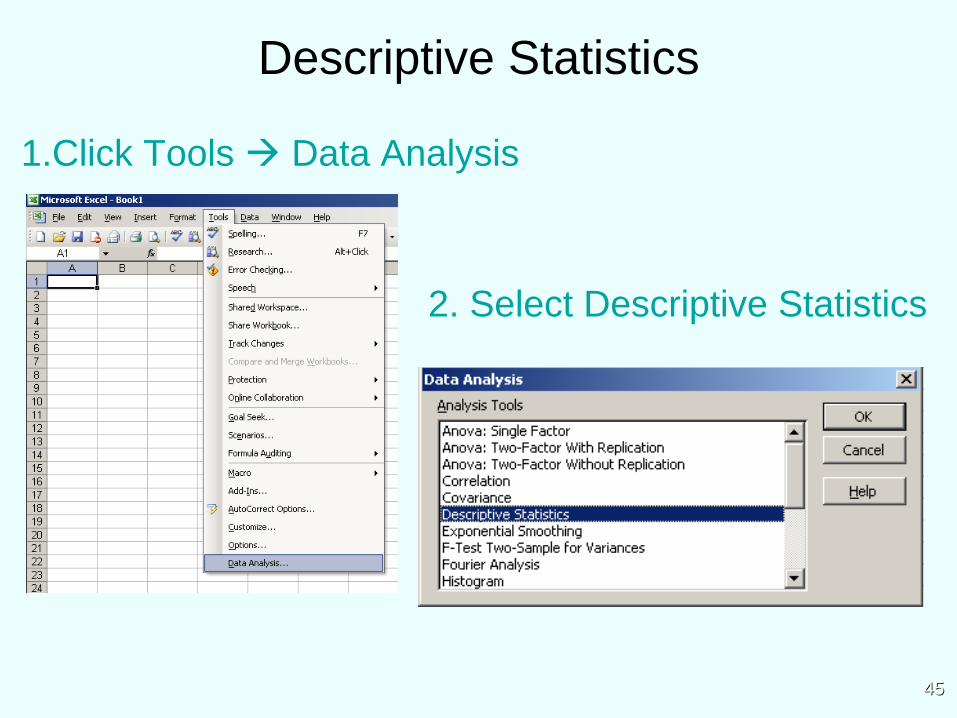
Descriptive Statistics
1.Click Tools Data Analysis
2. Select Descriptive Statistics

4646
Example: Age
Input range
Select columns “$A:$E”
Group by columns
Click on Labels in 1st row
Output options
New worksheet
Summary statistics

4747
Output for Descriptive Statistics: Age
4848
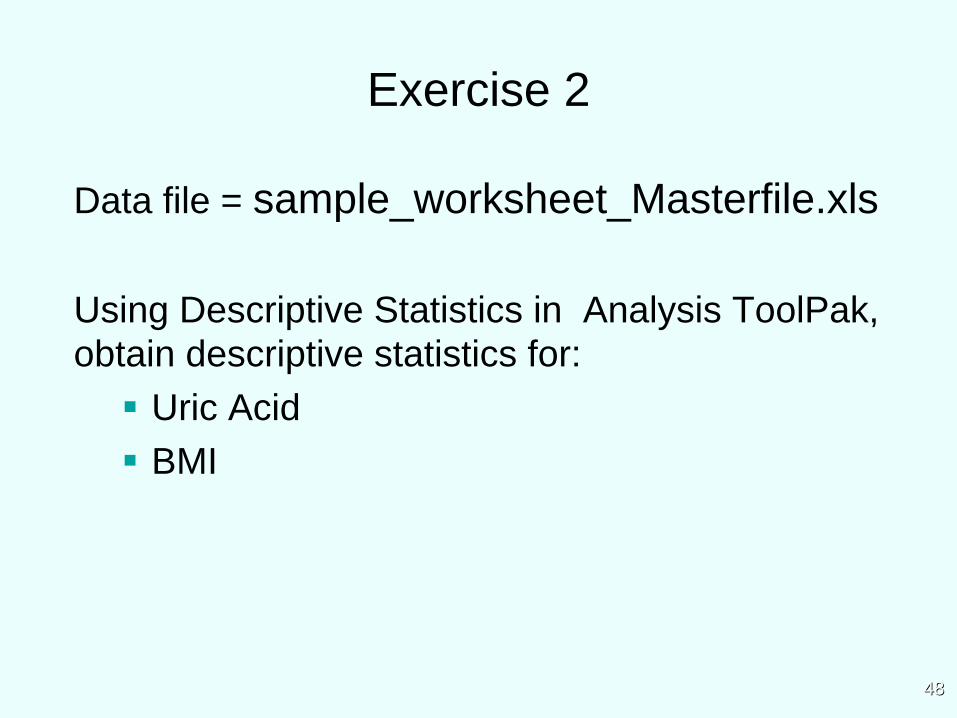
Exercise 2
Data file = sample_worksheet_Masterfile.xls
Using Descriptive Statistics in Analysis ToolPak, obtain descriptive statistics for:
Uric Acid
BMI

4949
Descriptive Statistics by Group
Use Pivot Tables Useful to obtain descriptive statistics by group For example, if you wanted to know the average and standard deviation of BMI for men and women

5050
Pivot Tables
Click Data Pivot Table and Pivot Chart

5151
Example Age by Gout Diagnosis
Step 1
Where is data?
What kind of report?

5252
Step 2
Where is data you want to use? Drag pointer over entire dataset
Example Age by Gout Diagnosis

5353
Step 3
Where do you want to put the Pivot Table?
Layout
This is where you tell Excel which groups you want to output your results by and for what variables
Example Age by Gout Diagnosis

5454
Step 3 Layout
Row represents your grouping variable (Gout_Dx)
Column variable you want to
output according to groups
May need to drag several times for parameters needed
Example Age by Gout Diagnosis

5555
Example Age by Gout Diagnosis
No gout
Gout

5656
Exercise 3
Using Pivot Tables and Charts, obtain the mean and standard deviation for uric acid according to gout diagnosis
5757
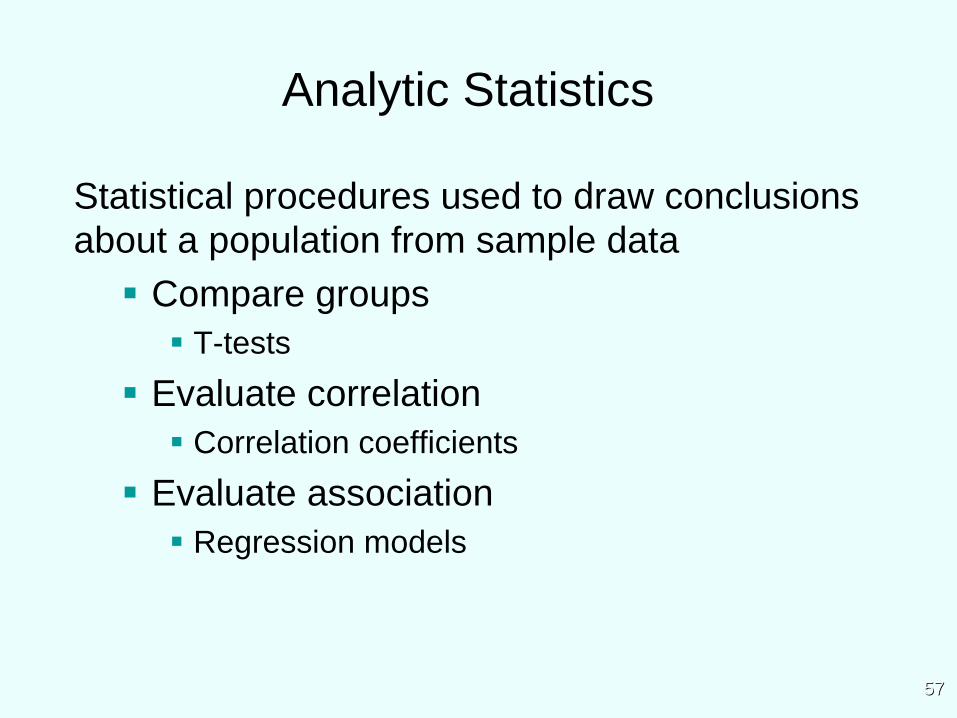
Analytic Statistics
Statistical procedures used to draw conclusions about a population from sample data
Compare groups
T-tests
Evaluate correlation
Correlation coefficients
Evaluate association
Regression models
5858
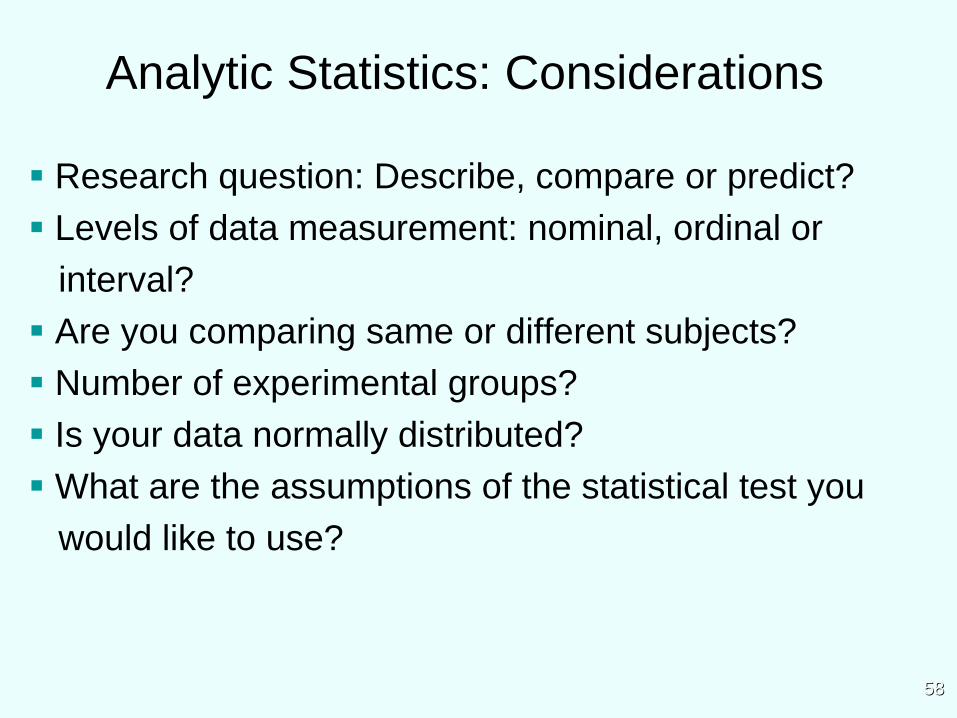
Analytic Statistics: Considerations
Research question: Describe, compare or predict? Levels of data measurement: nominal, ordinal or
interval? Are you comparing same or different subjects? Number of experimental groups? Is your data normally distributed?What are the assumptions of the statistical test you
would like to use?

5959
Check Data Assumptions
What are the assumptions of the statistical test you would like to use?
Some common assumptions are:
The DV and IV will need to be measured on a certain level (e.g. continuous)
The population is normally distributed (not skewed)

6060
1. Research goal2. Identify ID and DV3. Describe level of the data4. Identify the # & group
pairing groups5. Check data assumptions
Type of Dependent Variable Data
Goal Continuous Normal
Ordinal Non-normal
Categorical
Describe one group
Mean, SD Median, interquartile range
Proportion
Compare one group to a hypothetical value
One-sample t test Wilcoxon test Chi-square
Compare two unpaired groups
Unpaired t test Mann-Whitney test Fisher's test (chi-square for large samples)
Compare two paired groups
Paired t test Wilcoxon test McNemar's test
Compare three or more unmatched groups
One-way ANOVA Kruskal-Wallis test Chi-square test
Compare three or more matched groups
Repeated-measures ANOVA
Friedman test Cochrane Q
Quantify association between two variables
Pearson correlation Spearman correlation Contingency coefficients
Predict value from another measured variable
Simple linear regression or Nonlinear regression
Nonparametric regression
Simple logistic regression
Predict value from several measured or binomial variables
Multiple linear regressionor Multiple nonlinear regression
Multiple logistic regression
Selecting Appropriate Statistical Test
Statistical decision tree (handout)
6161
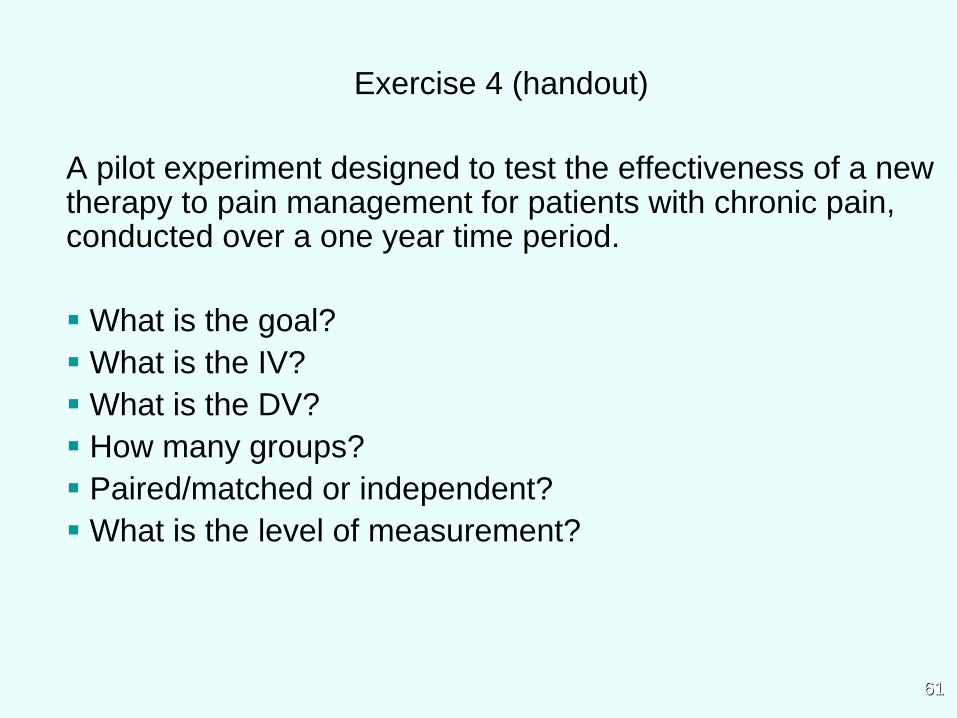
Exercise 4 (handout)
A pilot experiment designed to test the effectiveness of a new therapy to pain management for patients with chronic pain, conducted over a one year time period.
What is the goal? What is the IV?What is the DV? How many groups? Paired/matched or independent?What is the level of measurement?
6262
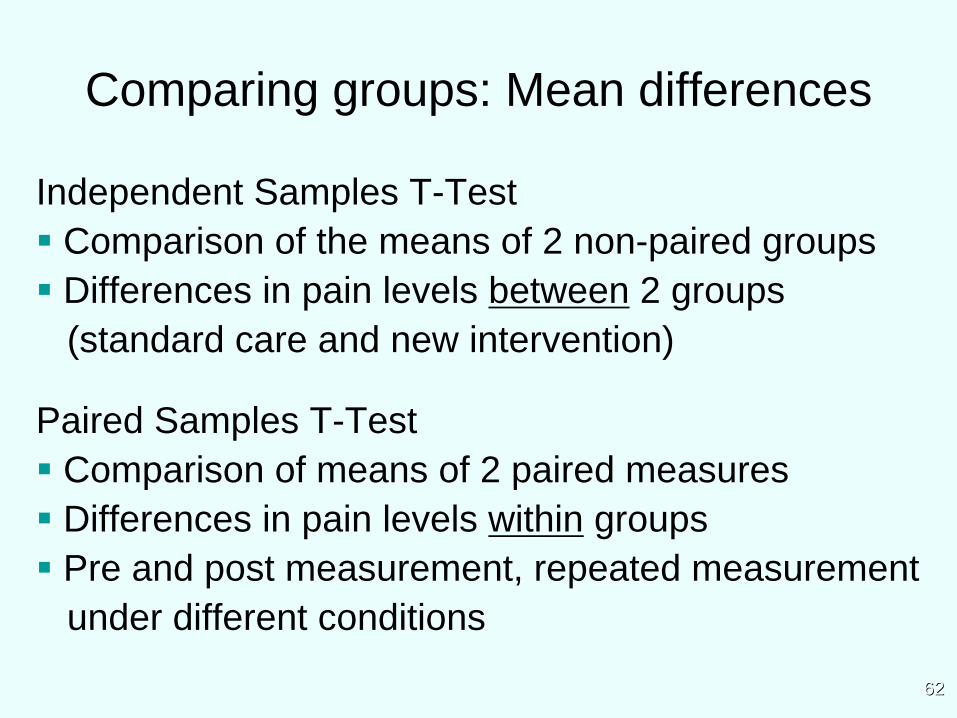
Comparing groups: Mean differences
Independent Samples T-Test Comparison of the means of 2 non-paired groups Differences in pain levels between 2 groups
(standard care and new intervention)
Paired Samples T-Test Comparison of means of 2 paired measures Differences in pain levels within groups Pre and post measurement, repeated measurement
under different conditions

6363
Comparing Groups
Sort dataset by variable you are comparing
Click Tools Data analysis
Three options for t-tests
6464
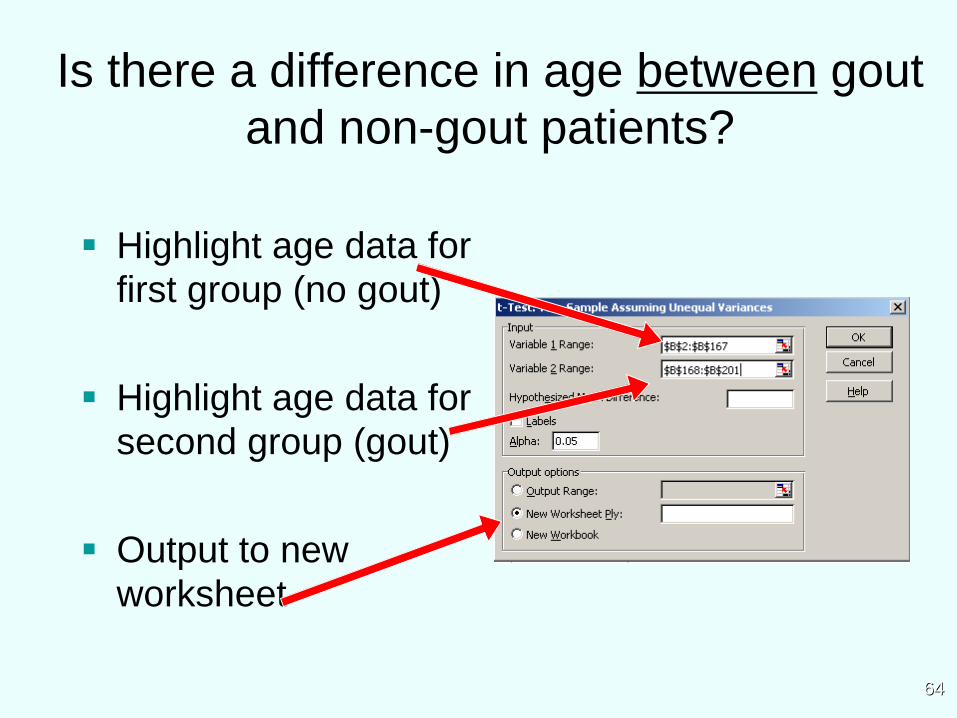
Is there a difference in age between gout and non-gout patients?
Highlight age data for first group (no gout)
Highlight age data for second group (gout)
Output to new worksheet

6565
Output
No gout Gout

6666
Paired Samples T-Test Procedure
Tools Data Analysis T-test: Paired Two Sample for Means Input 1 Range: DV at time 1 Input 2 Range: DV at time 2 Output Options

6767
Exercise 5
Using Descriptive Statistics in Analysis ToolPak, compare patients with no gout versus gout according to:
Uric Acid levels
BMI
6868
Exercise 6
Using Descriptive Statistics in Analysis ToolPak to answer the following question:Is there a difference in mean pain before and after surgery?

6969
Associate - Correlation
Allows an examination of the association between variables
Range: 0 to +1
Information about the strength of association
Information about the direction of the association (positive or negative)
A correlation coefficient of 0 =no relationship
A correlation coefficient of +1= positive relationship
A correlation coefficient of -1= negative relationship

7070
Evaluating Correlation
Continuous variables
Columns:side-by-side
Click Tools Data Analysis
Click Correlation

7171
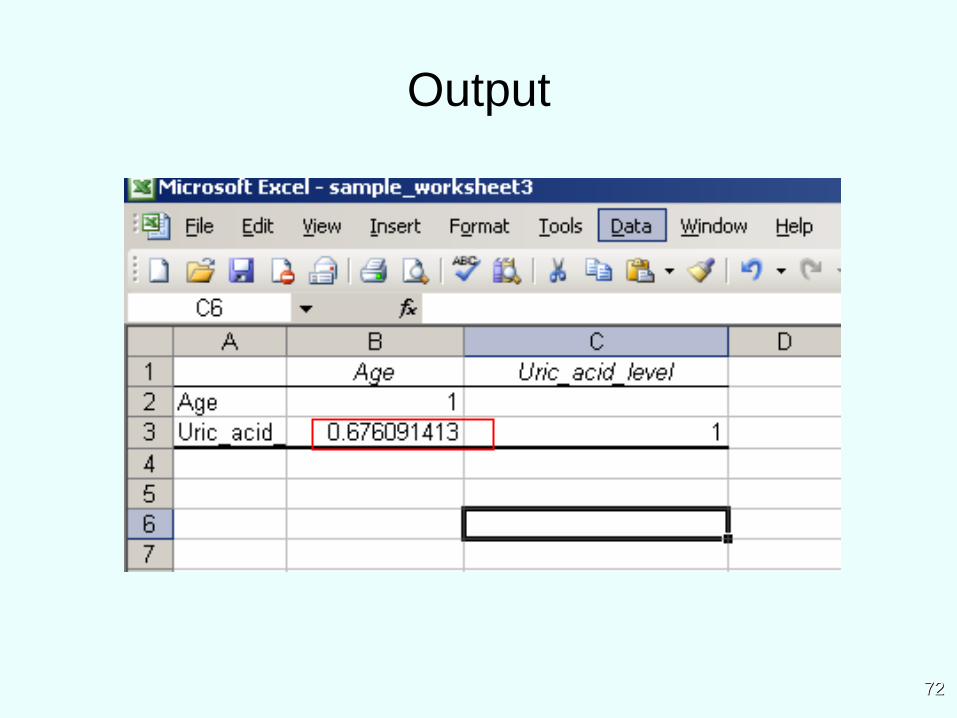
What is Correlation Between Age and Uric Acid Level?
Highlight 2 columns
Group by columns
Labels in first row
Output to new worksheet
7272
Output

7373
Exercise 6
Using Descriptive Statistics in Analysis ToolPak, evaluate the correlation between:
Uric Acid and BMI

7474
Thank You!
Recommended