Paper: ASAT-16-168-PP
16th
International Conference on
AEROSPACE SCIENCES & AVIATION TECHNOLOGY,
ASAT - 16 – May 26 - 28, 2015, E-Mail: [email protected]
Military Technical College, Kobry Elkobbah, Cairo, Egypt
Tel : +(202) 24025292 – 24036138, Fax: +(202) 22621908
Analytical Prediction of Dual-Thrust Rocket motors under
Uncertainties Alaa R. Abdel Gawad, Mahmoud Y. Mohamed, Hamid M. Abdalla,
and Mohamed A. Elsenbawi
Egyptian Armed Forces
Abstract: Despite that many sophisticated prediction tools are made to explicate the
phenomena of internal ballistic for dual thrust rocket motor due to geometry change, none
of them discussed uncertainties due to geometric, ballistic and regression simultaneously.
Mathematical models are developed on the basic governing theories to estimate the
pressure time history for two tubular grains with two different diameters along the grain. A
Computer module was made to facilitate this study with consideration to uncertainties as
they have a noticed effect on the results. The need for an optimization tool was necessary
to reduce the error between theoretical and experimental results, genetic algorithm
(MATLAB tool-box) was used as optimization tool. A set of static firing test are made for
validation and to determine the operating characteristics of the motors experimentally. It
was apparent in this study that some of these uncertainties are applicable in large scale
motors only and the others are applicable for both small, and large scale motors.
1. Introduction: Solid propellant rocket motors are the most widely used propulsion systems for
applications that requires high thrust to weight ratio for relatively short intervals of time.
Despite the simple design and operation of solid propellant rocket motors, the associated
phenomena taking place inside these motors are far from simple. This is owed to the
nature of solid propellant combustion involving grain regression, erosion, and its
interference on the flow gases all taking place with extremely high rates. In addition,
regularity of grain regression is largely sensitive to the kinematics of gas flow and the
proximity of heated metallic motor casing.
Understanding the physics of combustion, widely referred as the internal ballistic, has drawn
the efforts of researchers for decades. These efforts has reached a level high enough that
exists numerous reliable commercial and industrial computer codes. These codes are utilized
instead of the expensive, hazardous, and time-consuming experiments[1]. Codes such as [1, 2]
are able to predict the internal ballistics of solid propellant motor of various grain designs.
However, such analytical tools are not able to predict the details of flow field inside the
combustion chamber. These details can be exclusively be explored using computational flow
dynamics (CFD) approach which is indeed more sophisticated compared with analytical
prediction tools.
Paper: ASAT-16-168-PP
Analytical prediction of internal ballistics of solid propellant motors is also vulnerable to
numerous uncertainties since they rely (to some extent) on experimentally measured
values. These uncertainties can be categorized into three groups depending on their nature
namely geometric, ballistic, and regression uncertainties. Geometric uncertainties refer to
uncertain definition of grain shape and dimensions. Ballistic uncertainties refer to the
level of accuracy in defining the ballistic properties of the propellant that are originally
measured through experiments. In addition, ballistic uncertainties include underlying
assumptions in the mathematical model on which the analytical prediction is based. The
accuracy of analytical prediction is inversely proportional to the level of assumptions
adopted in the mathematical model. Uncertainties in regression behavior reflect the fact
that the rate of grain regression (burning) does not have the same value over the entire
grain surface. Dual thrust in solid propellant rocket motors is used to divide the thrust
time profile into two phases; a boost phase and a sustain phase. Figure 1 contrasts single
thrust and dual thrust time profiles. In the boost phase, the combustion chamber pressure
should be high to yield high thrust whereas in the sustain phase, a low thrust is needed to
compensate gravity and drag losses yielding a cruise flight.
Fig. 1. Pressure time profiles [3].
To obtain two levels of thrust, two separate motors can be used. Alternatively, one motor
producing different thrust levels can be used. This motor can have a single propellant
grain with variable nozzle critical area or an additional intermediate nozzle separating
two propellant grains. However, the simplest way to achieve dual thrust is to use a nozzle
of constant critical area section with variable chamber pressures. This can be achieved by
changing burning area (geometry) of the grain or changing burning rate (composition) of
the grain[3]. Figure 2 illustrates these two approaches.
a) Changing burning area.
P
t
Dual Thrust
Single Thrust
Boost Phase Sustain Phase
Single grain,
Boost with radial
burning, sustain
with end burning.
Paper: ASAT-16-168-PP
b) Changing burning rate.
Fig. 2. Dual thrust can be achieved either by changing the geometry or
composition of the grain [3].
Clearly, the goal of dual thrust designs is to increase the boost to sustain thrust ratio. In motor
designs with single nozzle of a constant critical area, the thrust is roughly proportional to the
chamber pressure. Thus a high thrust ratio would imply a high pressure ratio in the
chamber[4].
It can be argued that uncertainties in solid propellant motor operation are more pronounced in
dual thrust rocket motors. This is owed to the increased geometric details of the grain, the
changing port area and/or burning rate along the grain, and the sudden change in combustion
pressure. Since these uncertainties, by nature, obey no physical principles, incorporating them
within analytical prediction codes based on theoretical mathematical models does not seem to
be an easy task. The simplest approach may be “optimizing” the accuracy of prediction tools
to minimize the error between predicted and real (measured) motor performance. Upon
optimization, the uncertain factors are “tuned” to their most appropriate values as far as
maximizing the prediction accuracy is concerned. Moreover, the optimized prediction tools
can be more robust to changes in the factors controlling the motor performance.
To the authors’ knowledge of the open literature, handling the aspects of uncertainties has not
drawn much attention from the researchers. Recently, Raza and Liang investigated this issue
in dual thrust rocket motors in a number of studies [5-7]. In these studies, genetic algorithm
was used to optimize the accuracy and robustness of a theoretical prediction tool. In [5], they
optimized their prediction of dual thrust with consideration to uncertainties in the burning
rate. Focus was made on the pressure exponent; a single governing factor of the propellant
rate of burning. In [6, 7], Raza and Liang focused on the geometric uncertainties of the dual
thrust grain.
Motivated by the clear shortage of knowledge, the present study is intended to shed more light
on this topic. A dual thrust rocket motor using a grain of variable geometry is examined
experimentally. An analytical prediction model is developed based on governing equations of
internal ballistics. The uncertainties considered in the present study include geometric,
ballistic, and regression uncertainties. Genetic algorithm is utilized to optimize these uncertain
factors. The objective is to minimize the error between the experimentally-measured and
analytically-predicted chamber pressures over the entire motor operation time.
The paper is organized as follows. Details of the experiment, analytical model, and
optimization are presented in the following section. Next, the results are illustrated and
discussed. The paper ends with the main conclusions and recommendations.
2. Methodology:
2.1. Set up of experimental work: A dual thrust is achieved using a grain with a uniform composition and variable
configuration. a tubular grain of two different inner diameters along the axis is designed and
manufactured to be used in the experiment. The grain is inhibited from the outer surface
only and is allowed to burn from all other surfaces. Grain configuration and dimensions are
shown in figure 3; dimensions are in [mm]. The test motor used in the experiment is the
Dual end burning
grains with two
propellant of two
different burning rates
Paper: ASAT-16-168-PP
standard two-inch motor with critical section diameter of 8 mm. The grain is fitted in the
motor with the large port diameter (Ø50) at the head end of the motor.
Figure. 3. Grain configuration.
The ballistic properties of the used propellant were obtained experimentally by a set of
static firing tests in the standard two-inch motor at the normal temperature (21˚c). Six
firing tests were conducted using three different nozzle throat diameters yielding
combustion pressure ranging from 65 to 85 bar. From experimental results, the burning law
of the propellant was found to have the form
r=aPn = 0.000268P
0.2101. (1)
where r is burning rate of the propellant, n is the pressure exponent, and a is the burning
rate temperature coefficient. The characteristic velocity C* based on the test results was
found to have the value of 1557 m/s.
2.2. Theoretical model:
i) Surface regression model: Accurately defining the surface area of burning of the grain and its regression with time is one important step in predicting the associated ballistics. Two models with different levels of fidelity namely; a simple model and an advanced model, are developed.
Simple Model: In this model grain regression is divided into two stages as shown in figure (2),
where stage 1 endures until the boost phase ends (i.e.,w1=0) whereas stage 2 lasts
till the burn out (i.e.,w2=0 ). The line numbers 1 and 2 refer to the location of grain
surface at the start of stage 1 and 2, respectively.
Figure. 4. Regression pattern of the grain in the simple model.
2
1
Paper: ASAT-16-168-PP
According to this model, the burning area is calculated as follows:
Zone1:Ab(y)=( /4)(D2-(d1+2y)
2)+ (d1+2y)L1+ (d2+2y)(L2-2y)+( /4)(D
2-
(d2+2y)2)+( /4)((d1+2y)
2-(d2+2y)
2). (2)
Zone2: Ab(y) = *(L2-2y)*(d2+2y) + ( /2) (D2- (d2+2y)
2). (3)
where y is the distance traveled by the burning surface at a given time instant.
Other symbols are illustrated in figure 4.
Advanced Model: In the simple model, the corner at the inner step of the grain (marked by a circle in
figure 4) is assumed sharp. Practically, this cannot be guaranteed. This geometric
uncertainty, which is generated due to grain production technique, is accounted
for in the advanced regression model.
In this model, grain regression is divided into three stages as shown in figure (5).
Stage 1 endures until the web of the boost phase burn out (w1=0). Stage 2 lasts
until the flat part of the inner step (marked by circle in figure 5) vanishes. The last
stage, stage 3, continues till the burn out of the sustain phase (w2=0).
The line numbers 1, 2, and 3 refer to the grain surface at the start of stages 1, 2,
and 3, respectively.
Figure. 5. Regression pattern of the grain in advanced model. The addition of the fillet to the regression has a significant impact on calculating the
surface area. This area is calculated as follows:
Zone1: Ab(y)=( /4)(D2-(d1+2y)
2) + (d1+2y)(L1-y-f) + (y+f)(2(y+f)+ (R-f))
+( /4)((d1-2f)2- (d2+2y)
2)+ (d2+2y)(L2-2y)+ ( /4)(D
2-(d2+2y)
2). (4)
Zone2:Ab(y)=2 (y+f)((R-f)(( /2)- 1)-(y+f)(sin 1-1)+( /4)((d1-2f)2-
(d2+2*y)2)+ (d2+2y)(L2-2y)+( /4)(D
2-(d2+2y)
2). (5)
Zone3:Ab(y)=2 (y+f)((R-f)(( /2- 1- 2)-(y+f)*sin 1-(y+f)*cos 2)+ (d2+2y)(L2-y-
(y+f)cos 2-f)+ ( /4)*(D2-(d2+2y)
2). (6)
where d1 and R are internal grain diameter and radius upstream of fillet and radius
respectively, f is the fillet radius, d2 is the internal grain diameter downstream of the
fillet, 1 and 2 are, respectively, the left and right side angles of the fillet corner,
They vary from one stage to another. They are equal to 0 at first stage, 1 has a non-
zero value at the second stage while 2 equals 0 and at the third stage 1 and 2 both
have non-zero values as shown in figure (6).
2
3
1
Paper: ASAT-16-168-PP
Figure. 6. Fillet arc geometry.
Normally, as the grain burns, its surface moves towards the chamber walls parallel to
itself. However, this parallelism is uncertain over the entire grain surface. Concern
here is made at two specific locations namely, at the internal step corner (marked by
the circle in figure 7a) and the head-end grain face (marked by the dashed circle in
figure 7a).
a)
b)
Figure. 7. Uncertain regression patterns at the some surfaces
(corners and near the walls).
At the corner, it’s expected that a vortex flow is created. Such flow pattern would have
an adverse impact on the local gas pressure causing the regression rate to decrease
locally. Since no specific formula was proposed to estimate this aspect, the authors
propose that the local regression rate at the corner is a fraction of the nominal
regression rate of the grain. As illustrated in Figure 7.b., the regression at the step is
expressed as α (∆y) where α <1 and ∆y is the nominal regression.
Similarly, at the head end face of the grain, the regression rate is likely to increase
locally due to the vicinity of the heated metallic motor casing[3] page.469. Here, the
Paper: ASAT-16-168-PP
authors propose that the local regression is expressed as β (∆y) where β>1 and ∆y is
the nominal regression of the grain, figure 7.b.
The solid and dashed lines in figure 7.b. indicate, respectively the grain surface at the
start and the expected surface after a time interval within stage 1 of regression.
ii) Combustion model: The developed combustion model is based on fundamental gas dynamics and
thermodynamics relationship with proper consideration for conservation of mass,
energy and momentum. Pressure time history is for steady state phase.
The internal ballistic analysis follows one-dimensional compressible flow theory with
the flow taken as isentropic in the nozzle. Equilibrium pressures are established by
iteration to find the correct chamber pressure which balances the continuity equation,
so balance between mass generated and mass discharged is established[3, 8]. The
pressure time history is obtained by time marching i.e., a fixed time step of 0.002 sec.
is specified. The corresponding instantaneous combustion pressure is then calculated.
Ballistic parameters that are derived from the experimental results are key inputs to the
developed combustion model. These parameters include the burning rate temperature
coefficient, a, the pressure exponent, n, and the characteristic velocity, C*. The value
of these parameters convey a degree of uncertainty; a ballistic uncertainty. As shown
in section 2.1, the range of pressure, p, in those standard firing tests is narrow
compared to the expected range of pressure variation in the dual thrust rocket motor.
Hence, the value of both a and n derived from these tests are uncertain. To simplify
the analysis, and since a and n are inter-related through eqn. (1), the value of n
(0.2101) is adopted and the value of a is assumed to be pressure dependent. Also C*
is
found to be pressure-dependent. This is illustrated in figure 8 where the
experimentally derived C*
values is plotted versus the corresponding measured
chamber pressures.
Figure. 8. Dependence of C* on combustion pressure.
In the literature, no formula were presented to describe these dependencies. So, the
authors propose following linear dependencies (for C* equation it was inferred by the
trend line in figure 8) such that:
C* = g +v Pc = 1353.1 + 2.4151 Pc. (7)
a=k + 0.00002(
). (8)
y = 2.4151x + 1353.1
1400
1450
1500
1550
1600
50 55 60 65 70 75 80 85 90
C*
[m/s
]
P[bar]
Experimental Data
Linear (Experimental Data)
Paper: ASAT-16-168-PP
It can argued that incorporating the a-Pc and Pc - C*
dependence within the combustion
model should have a more significant impact in dual thrust applications. This can be
justified by the sudden and relatively large variation in combustion pressure values
which are less likely to take place in single thrust applications.
2.3. Optimization technique: The theoretical prediction of the pressure time profile is optimized. The objective of
optimization is to minimize the discrepancy between the theoretically-predicted and
experimentally-measured pressure values over the entire motor operation. The root
mean square error, RMSE, of all pressure values is taken as the criteria of measuring
this discrepancy. The strategy of optimization is to “tune” the uncertain geometric,
ballistic, and regression parameters discussed above. Genetic algorithm (GA) is used
as the optimization technique and the GA tool-box in MATLAB [9] is implemented.
Setup of the GA is shown in table 1 whereas table 2 lists the lower and upper bounds
for the seven uncertain parameters in concern. These bounds are arbitrary set based on
the authors experience and trials.
Table 1. Genetic algorithm setting.
Population Size 150
Maximum Generations 150
Crossover , ratio cross-over 2-points , 0.2
Mutation function Constraint dependent
Elite count 2
Table 2. Upper bound and lower bounds of the tuned parameters.
Parameters Lower bound Upper bound
K (eqn. 8) 0.00024 0.0003
M(eqn. 8) 30*105
40*105
C* intercept, g, eqn (7) 1300 1400
C* first order term, v, eqn (7) 2 3
Fillet radius, f, eqn (4) 0.2 0.8
Step regression factor, α 0.6 1
Head end regression factor, β 1 1.5
3. Results and discussion:
3.1. Impact of fidelity of regression model: Figure (9) illustrates the pressure-time history for the grain experimentally and
analytically. Here, the basic (un-optimized) model is used i.e., all uncertainties are
overlooked. The theoretical prediction based on both simple and advanced regression
models, which are compared. In the advanced model, a fillet radius of 0.6 is assumed
based on data from production technicians. In Numbers, the prediction model used in
developing the pressure time profile in figure 9 adopts the following values of the
uncertain parameters.
Paper: ASAT-16-168-PP
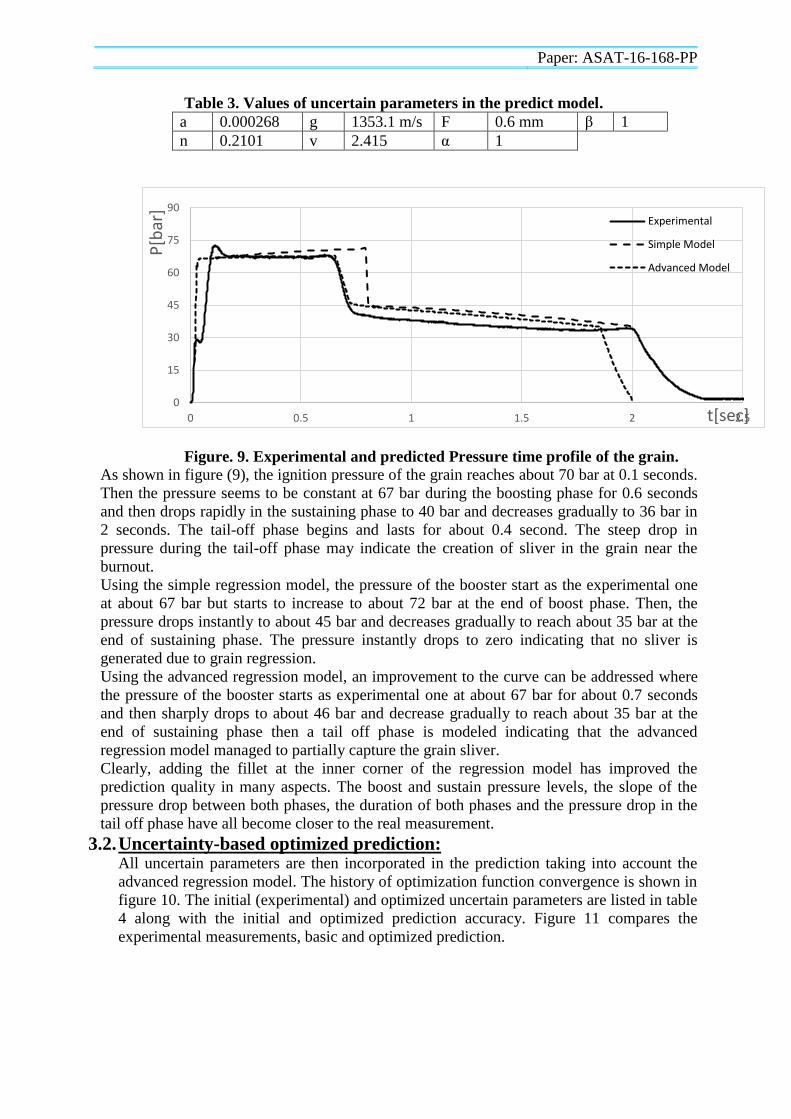
Table 3. Values of uncertain parameters in the predict model.
a 0.000268 g 1353.1 m/s F 0.6 mm β 1
n 0.2101 v 2.415 α 1
Figure. 9. Experimental and predicted Pressure time profile of the grain.
As shown in figure (9), the ignition pressure of the grain reaches about 70 bar at 0.1 seconds.
Then the pressure seems to be constant at 67 bar during the boosting phase for 0.6 seconds
and then drops rapidly in the sustaining phase to 40 bar and decreases gradually to 36 bar in
2 seconds. The tail-off phase begins and lasts for about 0.4 second. The steep drop in
pressure during the tail-off phase may indicate the creation of sliver in the grain near the
burnout.
Using the simple regression model, the pressure of the booster start as the experimental one
at about 67 bar but starts to increase to about 72 bar at the end of boost phase. Then, the
pressure drops instantly to about 45 bar and decreases gradually to reach about 35 bar at the
end of sustaining phase. The pressure instantly drops to zero indicating that no sliver is
generated due to grain regression.
Using the advanced regression model, an improvement to the curve can be addressed where
the pressure of the booster starts as experimental one at about 67 bar for about 0.7 seconds
and then sharply drops to about 46 bar and decrease gradually to reach about 35 bar at the
end of sustaining phase then a tail off phase is modeled indicating that the advanced
regression model managed to partially capture the grain sliver.
Clearly, adding the fillet at the inner corner of the regression model has improved the
prediction quality in many aspects. The boost and sustain pressure levels, the slope of the
pressure drop between both phases, the duration of both phases and the pressure drop in the
tail off phase have all become closer to the real measurement.
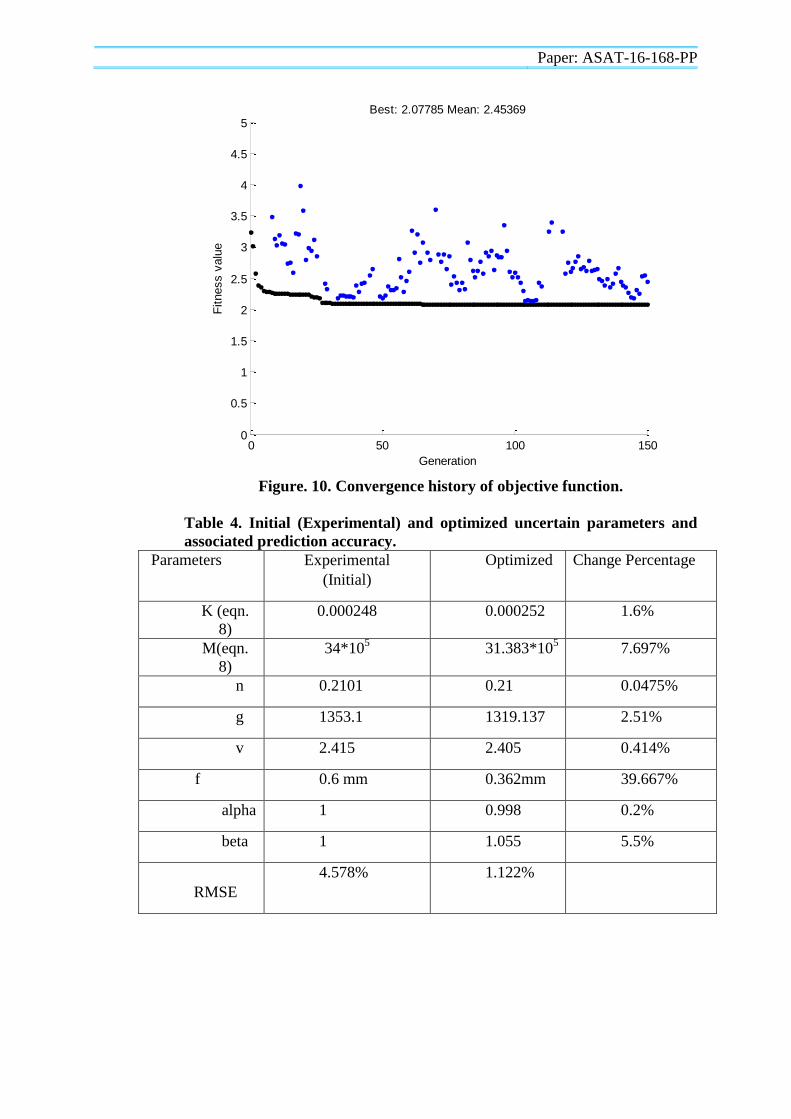
3.2. Uncertainty-based optimized prediction: All uncertain parameters are then incorporated in the prediction taking into account the
advanced regression model. The history of optimization function convergence is shown in
figure 10. The initial (experimental) and optimized uncertain parameters are listed in table
4 along with the initial and optimized prediction accuracy. Figure 11 compares the
experimental measurements, basic and optimized prediction.
0
15
30
45
60
75
90
0 0.5 1 1.5 2 2.5
P[b
ar]
t[sec]
Experimental
Simple Model
Advanced Model
Paper: ASAT-16-168-PP
Figure. 10. Convergence history of objective function.
Table 4. Initial (Experimental) and optimized uncertain parameters and
associated prediction accuracy.
Parameters Experimental
(Initial)
Optimized Change Percentage
K (eqn.
8)
0.000248 0.000252 1.6%
M(eqn.
8)
34*105
31.383*105
7.697%
n 0.2101 0.21 0.0475%
g 1353.1 1319.137 2.51%
v 2.415 2.405 0.414%
f 0.6 mm 0.362mm 39.667%
alpha 1 0.998 0.2%
beta 1 1.055 5.5%
RMSE
4.578% 1.122%
0 50 100 1500
0.5
1
1.5
2
2.5
3
3.5
4
4.5
5
Generation
Fitness v
alu
e
Best: 2.07785 Mean: 2.45369
Paper: ASAT-16-168-PP
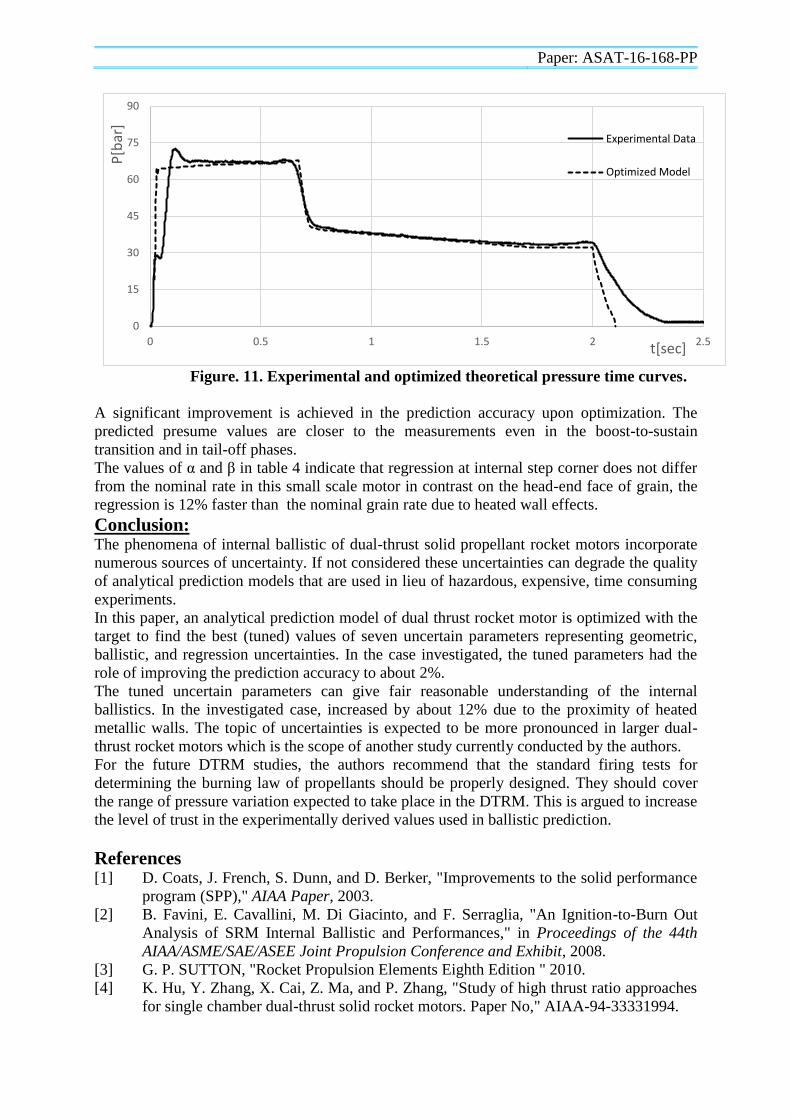
Figure. 11. Experimental and optimized theoretical pressure time curves.
A significant improvement is achieved in the prediction accuracy upon optimization. The
predicted presume values are closer to the measurements even in the boost-to-sustain
transition and in tail-off phases.
The values of α and β in table 4 indicate that regression at internal step corner does not differ
from the nominal rate in this small scale motor in contrast on the head-end face of grain, the
regression is 12% faster than the nominal grain rate due to heated wall effects.
Conclusion: The phenomena of internal ballistic of dual-thrust solid propellant rocket motors incorporate
numerous sources of uncertainty. If not considered these uncertainties can degrade the quality
of analytical prediction models that are used in lieu of hazardous, expensive, time consuming
experiments.
In this paper, an analytical prediction model of dual thrust rocket motor is optimized with the
target to find the best (tuned) values of seven uncertain parameters representing geometric,
ballistic, and regression uncertainties. In the case investigated, the tuned parameters had the
role of improving the prediction accuracy to about 2%.
The tuned uncertain parameters can give fair reasonable understanding of the internal
ballistics. In the investigated case, increased by about 12% due to the proximity of heated
metallic walls. The topic of uncertainties is expected to be more pronounced in larger dual-
thrust rocket motors which is the scope of another study currently conducted by the authors.
For the future DTRM studies, the authors recommend that the standard firing tests for
determining the burning law of propellants should be properly designed. They should cover
the range of pressure variation expected to take place in the DTRM. This is argued to increase
the level of trust in the experimentally derived values used in ballistic prediction.
References
[1] D. Coats, J. French, S. Dunn, and D. Berker, "Improvements to the solid performance
program (SPP)," AIAA Paper, 2003.
[2] B. Favini, E. Cavallini, M. Di Giacinto, and F. Serraglia, "An Ignition-to-Burn Out
Analysis of SRM Internal Ballistic and Performances," in Proceedings of the 44th
AIAA/ASME/SAE/ASEE Joint Propulsion Conference and Exhibit, 2008.
[3] G. P. SUTTON, "Rocket Propulsion Elements Eighth Edition " 2010.
[4] K. Hu, Y. Zhang, X. Cai, Z. Ma, and P. Zhang, "Study of high thrust ratio approaches
for single chamber dual-thrust solid rocket motors. Paper No," AIAA-94-33331994.
0
15
30
45
60
75
90
0 0.5 1 1.5 2 2.5
P[b
ar]
t[sec]
Experimental Data
Optimized Model

Paper: ASAT-16-168-PP
[5] M. Aamir Raza and W. Liang, "Robust Design Optimization of Dual Thrust Solid
Propellant Motors due to Burning Rate Uncertainties," Propellants, Explosives,
Pyrotechnics, vol. 37, pp. 476-488, 2012.
[6] M. A. Raza and W. Liang, "Uncertainty-based computational robust design
optimisation of dual-thrust propulsion system," Journal of Engineering Design, vol.
23, pp. 618-634, 2012.
[7] M. A. Raza and W. Liang, "Robust performance optimization of dual thrust rocket
motor," Aircraft Engineering and Aerospace Technology, vol. 84, pp. 244-251, 2012.
[8] M. Barrere, "Rocket Propulsion," 1960.
[9] Matlab User guide.
Recommended