U.S. Department of Justice
National Institute of Corrections
Analysis of the Use of the Structured Decisionmaking Framework in Three States
Authors: Ralph Serin and Renee Gobeil
September 2014
Robert Brown
Acting Director
Harry Fenstermaker
Acting Deputy Director
Jim Cosby
Chief, Community Services
Division
Robbye Braxton
Project Manager
DISCLAIMER
This document was funded by cooperative agreement number 10C82GKD0 from the
National Institute of Corrections, U.S. Department of Justice. Points of view or opinions
stated in this document are those of the authors and do not necessarily represent the
official position or policies of the U.S. Department of Justice. The National Institute of
Corrections reserves the right to reproduce, publish, translate, or otherwise use and to
authorize others to publish and use all or any part of the copyrighted materia l
contained in this publication.
ACCESSION NUMBER
NIC Accession Number: 028408
NIC’s mission is to provide training, information and technical assistance to the nation’s
jails, prisons, and community corrections facilities. More information can be found at
www.nicic.gov.
Analysis of the Use of the Structured Decisionmaking Framework in Three States
Completed in the context of NIC Technical Assistance Grant # 10C82GKD0
January 2014
Ralph Serin
&
Renée Gobeil
Carleton University Criminal Justice Decision-Making Laboratory
Page 2
Executive Summary In recent years, interest in high-quality parole decisionmaking has grown significantly.
Paroling authorities are under considerable pressure and subject to substantial public scrutiny as
they strive to reach high-quality parole decisions that ensure public safety. In this context, the
Legal Decision-Making Lab at Carleton University has been working for nearly a decade to
develop and improve a decisionmaking tool for parole practitioners. This tool, the Structured
Decisionmaking Framework, acts as a road map or guideline for professional decisionmakers to
help them reach consistent, transparent, and defensible high-quality conditional release
decisions. It acknowledges the professional expertise and extensive experience of parole
decisionmakers by using a structured approach that guides paroling authorities through the
process of making parole decisions by considering offender information demonstrated to be
closely linked to post-release performance. Given this grounding, the Framework can help
paroling authorities incorporate or enhance the use of evidence-based practice in their
decisionmaking.
Through its technical assistance program, the National Institute of Corrections facilitated
opportunities for three states—Ohio, Connecticut, and Kansas—to examine the use of the
Structured Decisionmaking Framework in their jurisdictions. The paroling authorities in these
states all received training in the use of the Framework. Though the Framework has been
extensively validated and its use supported via research in Canada, each state also participated in
a small-scale exercise aiming to provide preliminary validation results specific to their
jurisdiction. This document summarizes the results of these validation exercises.
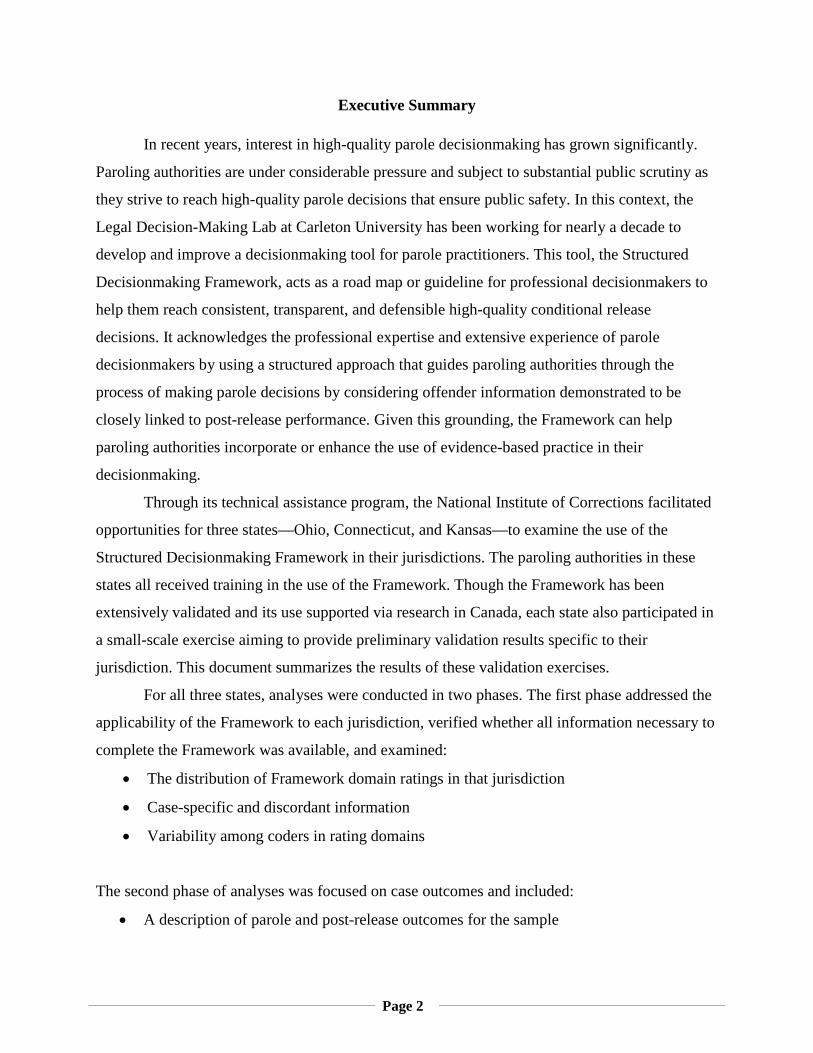
For all three states, analyses were conducted in two phases. The first phase addressed the
applicability of the Framework to each jurisdiction, verified whether all information necessary to
complete the Framework was available, and examined:
• The distribution of Framework domain ratings in that jurisdiction
• Case-specific and discordant information
• Variability among coders in rating domains
The second phase of analyses was focused on case outcomes and included:
• A description of parole and post-release outcomes for the sample
Page 3
• An examination of overall Framework ratings and release recommendations for each case
• A comparison of Framework results to actual parole outcomes (where possible)
• A comparison of Framework results to parole decisions (where the previous analyses
were not possible)
Overall, applying the Structured Decisionmaking Framework to a sample of approximately 100
offender cases in each of three states (Ohio, Connecticut, and Kansas) revealed interesting
patterns both with respect to the completion of the Framework itself and to its overall results as
compared to actual post-release outcomes. With respect to the Framework, a number of findings
are noted:
1. Sufficient information was generally available to complete the Framework. However, in
one state, this was not the case at the time of data collection; the state has since changed
its parole preparation approach to broaden the information available and address this
concern.
2. Second, though the authors intend that the Framework be completed according to each
board member’s expertise, personal experience, and knowledge, there were some items
noted under the case-specific factors domain that we believe should not have been
included, or that should have been included in a different manner. For example, several
items (e.g., behavior on this or a previous sentence) could and should more appropriately
have been captured in other Framework domains.
3. Inter-coder variability was also noted. When the Framework is applied in practice, board
members are expected to vary as a result of their backgrounds, experience, knowledge,
and beliefs. However, an effort was made to obtain consistency among coders for the
purposes of this validation exercise, but this did not appear to be wholly successful. If
such variability is also noted in board members’ completion of the Framework, there may
be benefit in periodic ongoing training in the use of the Framework to ensure an accurate
understanding of its intended use. This may be profitably achieved using a train-the-
trainers approach.
Turning to an examination of the how the Framework’s overall results compare to actual
post-release outcomes, it appears, promisingly, that in the state of Connecticut, the Framework
Page 4
appears to distinguish between offenders who reoffend after release and those who do not.
Indeed, these findings suggest that the Framework is more able to do so than is the State’s
accepted risk instrument, though results in this area are preliminary. For Ohio and Kansas,
unfortunately, the virtually non-existent variability in post-decision outcomes among coded cases
prevented an examination of how the Framework’s overall results compared to actual post-
release outcomes. Instead, the association of the Framework with the parole decision was
investigated. The identification of greater numbers of aggravating domains within the
Framework tended to be associated with decisions to deny, and consideration of Framework
ratings (either on their own or together with an actuarial risk estimate) led to (non-significantly)
better prediction of parole decisions.
Based on the results of these preliminary validation exercises, it appears that the
Structured Decisionmaking Framework can contribute to high-quality, transparent, and
consistent parole decisionmaking by the Ohio Parole Board, Connecticut Board of Pardons and
Parole, and Kansas Prisoner Review Board. Though it must still be confirmed in Ohio and
Kansas, the Framework does not appear to influence decisions negatively. Findings in
Connecticut and Canada demonstrate that the Framework can increase the quality of parole
decisionmaking.
Given the high stakes involved in parole decisionmaking, even minimal improvements in
predictive accuracy can result in fewer victims, better management of strained prison capacity,
and cost savings. As such, continued investigation of the use of the Structured Decisionmaking
Framework is warranted and is supported by preliminary promising results.
Page 5
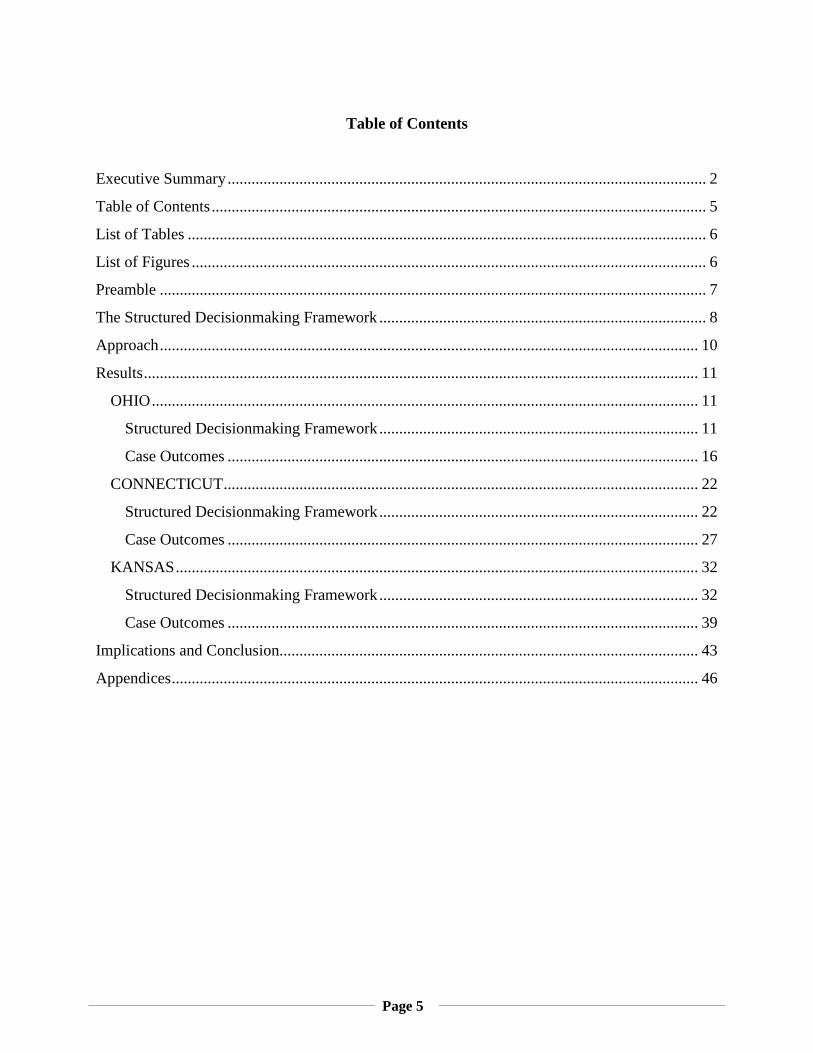
Table of Contents
Executive Summary ........................................................................................................................ 2
Table of Contents ............................................................................................................................ 5
List of Tables .................................................................................................................................. 6
List of Figures ................................................................................................................................. 6
Preamble ......................................................................................................................................... 7
The Structured Decisionmaking Framework .................................................................................. 8
Approach ....................................................................................................................................... 10
Results ........................................................................................................................................... 11
OHIO ......................................................................................................................................... 11
Structured Decisionmaking Framework ................................................................................ 11
Case Outcomes ...................................................................................................................... 16
CONNECTICUT ....................................................................................................................... 22
Structured Decisionmaking Framework ................................................................................ 22
Case Outcomes ...................................................................................................................... 27
KANSAS ................................................................................................................................... 32
Structured Decisionmaking Framework ................................................................................ 32
Case Outcomes ...................................................................................................................... 39
Implications and Conclusion......................................................................................................... 43
Appendices .................................................................................................................................... 46
Page 6
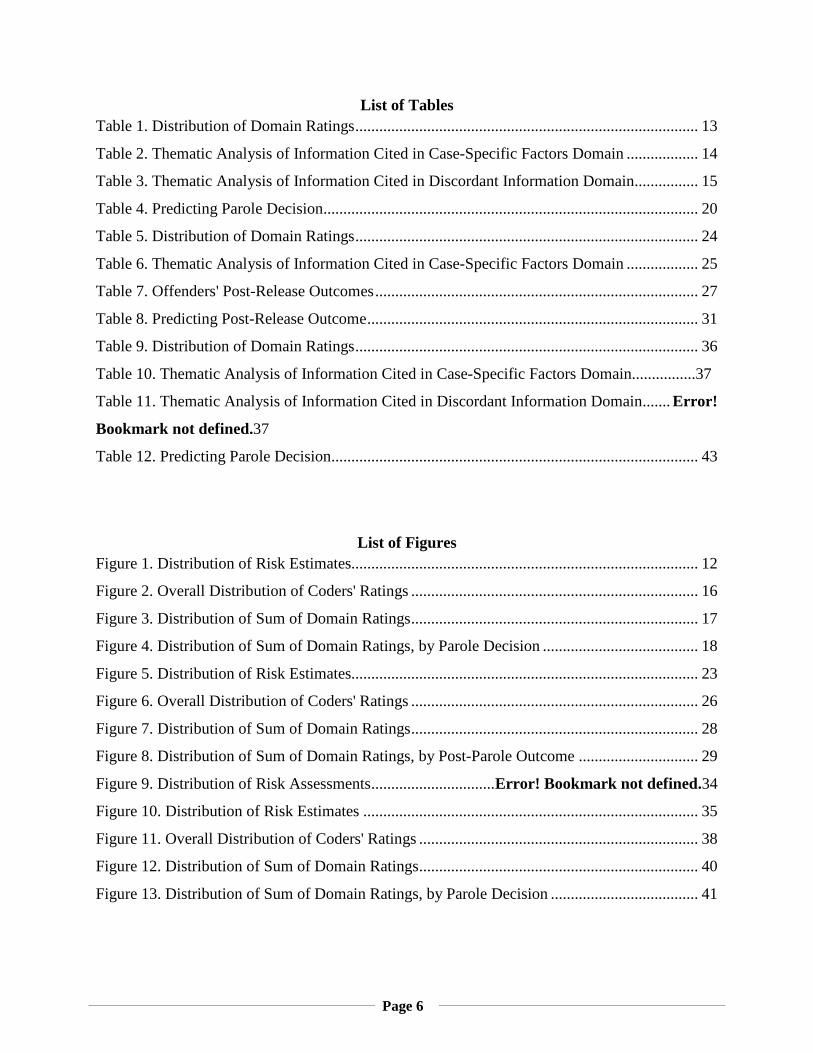
List of Tables Table 1. Distribution of Domain Ratings ...................................................................................... 13
Table 2. Thematic Analysis of Information Cited in Case-Specific Factors Domain .................. 14
Table 3. Thematic Analysis of Information Cited in Discordant Information Domain ................ 15
Table 4. Predicting Parole Decision.............................................................................................. 20
Table 5. Distribution of Domain Ratings ...................................................................................... 24
Table 6. Thematic Analysis of Information Cited in Case-Specific Factors Domain .................. 25
Table 7. Offenders' Post-Release Outcomes ................................................................................. 27
Table 8. Predicting Post-Release Outcome ................................................................................... 31
Table 9. Distribution of Domain Ratings ...................................................................................... 36
Table 10. Thematic Analysis of Information Cited in Case-Specific Factors Domain................37
Table 11. Thematic Analysis of Information Cited in Discordant Information Domain ....... Error!
Bookmark not defined.37
Table 12. Predicting Parole Decision............................................................................................ 43
List of Figures
Figure 1. Distribution of Risk Estimates....................................................................................... 12
Figure 2. Overall Distribution of Coders' Ratings ........................................................................ 16
Figure 3. Distribution of Sum of Domain Ratings ........................................................................ 17
Figure 4. Distribution of Sum of Domain Ratings, by Parole Decision ....................................... 18
Figure 5. Distribution of Risk Estimates....................................................................................... 23
Figure 6. Overall Distribution of Coders' Ratings ........................................................................ 26
Figure 7. Distribution of Sum of Domain Ratings ........................................................................ 28
Figure 8. Distribution of Sum of Domain Ratings, by Post-Parole Outcome .............................. 29
Figure 9. Distribution of Risk Assessments ............................... Error! Bookmark not defined.34
Figure 10. Distribution of Risk Estimates .................................................................................... 35
Figure 11. Overall Distribution of Coders' Ratings ...................................................................... 38
Figure 12. Distribution of Sum of Domain Ratings ...................................................................... 40
Figure 13. Distribution of Sum of Domain Ratings, by Parole Decision ..................................... 41

Page 7
Page 8
Preamble It would not be an overstatement to say that parole decisionmaking is one of the most
important tasks of criminal justice systems given its effects on public safety, reduced
victimization, and the allocation of correctional funds. However, its importance has been rarely
reflected in the attention and research focused on corrections, though this is beginning to change.
Indeed, in the last decade, attention to both pre- and post-release parole decisionmaking has
begun to increase.
It is in this context that, beginning in 2004, the Legal Decision-Making Lab at Carleton
University (Ottawa, Canada) began to develop a tool for parole decisionmakers. This tool, the
Structured Decision-Making Framework, was developed and refined over a period of several
years to act as a road map or guideline for professional decisionmakersto help them reach
consistent, transparent, and defensible high-quality conditional release decisions. It
acknowledges the professional expertise and extensive experience of parole decisionmakers by
using a structured approach that guides members of paroling authorities through the process of
making parole decisions by considering offender information demonstrated to be closely linked
to post-release performance. Given this grounding, the Framework can help paroling authorities
incorporate or enhance evidence-based practice in their decisionmaking.
Through its technical assistance program, the National Institute of Corrections facilitated
three states’ opportunities to examine the use of the Structured Decisionmaking Framework in
their jurisdictions. The paroling authorities in Ohio, Connecticut, and Kansas all received
training in the use of the framework. Though the Framework has been extensively validated and
its use supported via research in Canada, each state also participated in an exercise aiming to
provide preliminary validation results specific to their jurisdiction. This brief document
summarizes the results of these validation exercises.
Page 9
The Structured Decisionmaking Framework
The Structured Decisionmaking Framework (Serin, 2004)1 was created to help parole
board members minimize the effect of peripheral factors and reach more evidence-based parole
decisions, before and after release, with the parameters of parole legislation and policy in mind.
The framework was intended to meet three primary goals:
1. Address criticisms regarding inconsistency and seemingly arbitrary decisionmaking in
parole outcomes.
2. Apply the substantial body of research on recidivism and parole outcomes to parole
decisionmaking by ensuring that only relevant factors are considered in reaching parole
decisions.
3. Increase in the transparency and defensibility of individual decisions, both for the benefit
of offenders and for the sake of appeals or investigations.
Further, the framework, as part of an evidence-based, policy-driven, decisionmaking approach,
can enhance public safety, contribute to the appropriate management of limited public resources,
and insulate decisionmakers in situations where paroled offenders re-offend.
The component domains of the Framework were identified after an extensive review of
research on parole, parole policy, and recidivism. Anchored by risk, the seven domains
highlighted in the Framework are:
1. Criminal/parole history: The offender’s history of interaction with the criminal
justice system prior to the current sentence.
2. Institutional/community behavior: The offender’s behavior during the current
sentence, both while incarcerated and during previous periods of community
supervision on this sentence.
3. Disinhibitors: Factors that may influence an offender’s ability to regulate his or her
behavior, such as the presence of anti-social peers, substance use, impulsivity, and
affective states such as jealousy and rejection.
4. Responsivity: The extent to which specific offender characteristics (e.g., gender,
culture, language, age, program dosage, and targets) have been incorporated and
considered in the delivery of correctional programs and other interventions.
1 Available by contacting Dr. Ralph Serin at [email protected].
Page 10
5. Offender change: Any evidence that an offender has benefited from his or her
participation in correctional programming or otherwise changed during his or her
sentence.
6. Release plan: Plans for post-release, including housing, employment, community-
based programs or interventions, and available support from family, partners, and
peers.
7. Case-specific factors: Unique case factors relevant to an offender’s release outcome
or to a parole decision. For example, this could include a medical condition or
disability resulting in mobility issues. Factors that are irrelevant to risk or to the
decision are to be omitted.
Though it is not a domain per se, consideration of discordant information is also required
by the Framework. That is, when sources of information are inconsistent (e.g., separate
psychological assessments result in different estimates of risk), the Framework asks
decisionmakers to note this difference and to identify which source of information is prioritized
and why.
Each domain is rated as mitigating, no impact, or aggravating. These ratings represent the
extent to which the information specific to that domain may influence the manageability of the
risk represented by the actuarial risk estimate for that offender.
Page 11
Approach To validate the use of the Structured Decisionmaking Framework preliminarily, 100
cases previously considered by the Kansas Prisoner Review Board were re-assessed using the
Framework. Over two days, non-board member employees of the board who were familiar with
paroling issues were trained in the use of the Structured Decisionmaking Framework. They then
coded a sample of over 100 offender cases, and post-hearing followup information was obtained.
Though 100 cases represent a small percentage of the cases considered by the board, they
represent a sufficient sample to identify any immediate problems or areas where adaptations are
needed, and they are also enough to contribute preliminary findings towards a Connecticut-
specific validation of the Framework.
This brief report outlines the results of analyses of these data. It focuses on the following:
Specific to the Framework:
1. The extent to which information necessary to complete the Framework is available
2. The distribution of ratings within each of the Framework’s domains
3. Analyses of case-specific and discordant information
4. Variability among coders
Specific to case outcomes:
1. A description of the parole and post-parole outcomes of the sample
2. An identification of the overall case assessments resulting from application of the
Framework
3. Where possible, for paroled cases, a comparison of the Framework results to actual
parole outcomes
4. Where such comparisons are not possible, a comparison of the Framework results to
actual parole decisions.
Page 12
Results
OHIO
Structured Decisionmaking Framework Availability of information. For the Framework to be used effectively, it must be
possible for parole decisonmakers to apply it. As such, we examined the frequency with which
coders indicated that there was insufficient information available to rate the Framework domains.
Fortunately, the frequency was very low, with a lack of information arising for three domains as
well as for the risk assessment anchor. Specifically, in 6% of cases, no risk assessment result was
available to act as an anchor for further consideration. In addition, there was insufficient
information available to code the offender change and release plan domains in 3% of cases each,
and the disinhibitors domain in 2% of cases. Overall, these findings suggest the need for
preparing high-quality case reports for facilitating board decisions.
Risk estimates. For those cases where sufficient information was available to allow for
coding, the distribution of ratings was examined. First, risk assessment ratings were examined.
Most cases (66%) had one risk assessment recorded, though, as mentioned, 7% of cases had
none. Almost a quarter (23%) had two, and 3% had three. The most-commonly reported risk
assessment measures were the RAP (available for 59% of cases), the Static-99 (in 32% of cases),
the CRA (in 16% of cases), and the ORAS (in 7% of cases). Various other assessment instrument
results were available for 7% of cases.
Coders were asked to identify which risk assessment estimate should be considered
highest priority for the given offender; this is the estimate that was to act as the anchor in
considering that offender. Given that the estimates were derived from different instruments,
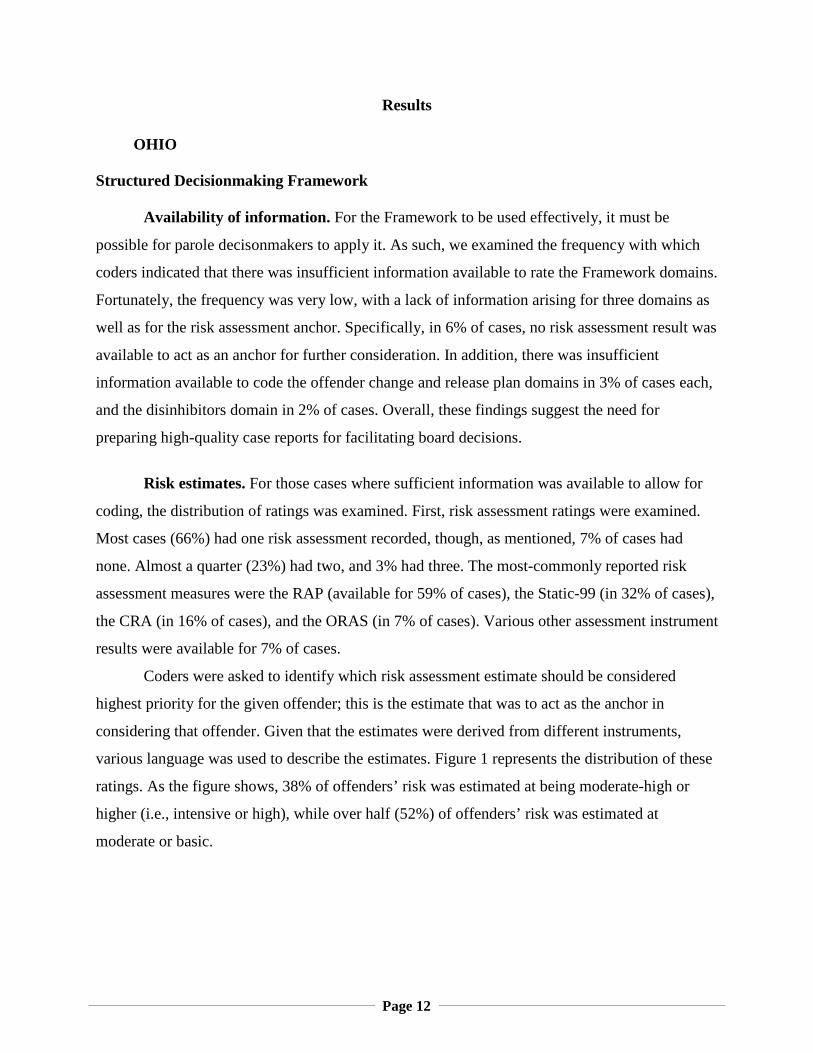
various language was used to describe the estimates. Figure 1 represents the distribution of these
ratings. As the figure shows, 38% of offenders’ risk was estimated at being moderate-high or
higher (i.e., intensive or high), while over half (52%) of offenders’ risk was estimated at
moderate or basic.
Page 13
Figure 1. Distribution of Risk Estimates
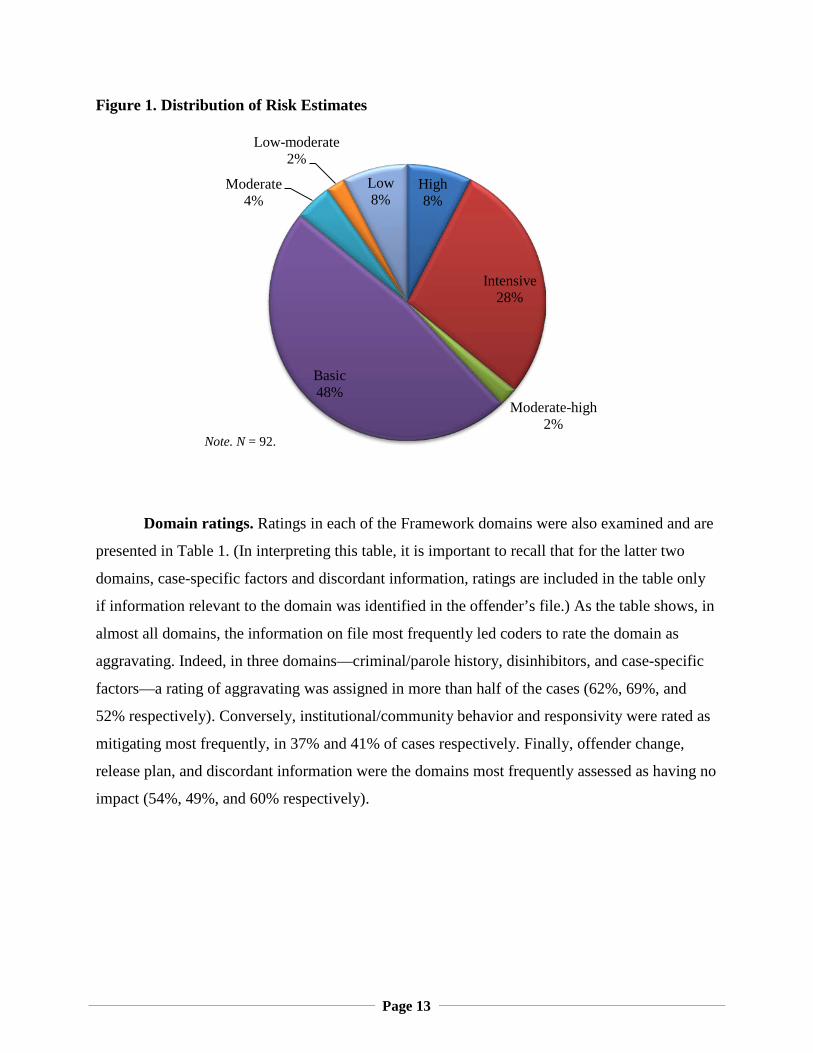
Domain ratings. Ratings in each of the Framework domains were also examined and are
presented in Table 1. (In interpreting this table, it is important to recall that for the latter two
domains, case-specific factors and discordant information, ratings are included in the table only
if information relevant to the domain was identified in the offender’s file.) As the table shows, in
almost all domains, the information on file most frequently led coders to rate the domain as
aggravating. Indeed, in three domains—criminal/parole history, disinhibitors, and case-specific
factors—a rating of aggravating was assigned in more than half of the cases (62%, 69%, and
52% respectively). Conversely, institutional/community behavior and responsivity were rated as
mitigating most frequently, in 37% and 41% of cases respectively. Finally, offender change,
release plan, and discordant information were the domains most frequently assessed as having no
impact (54%, 49%, and 60% respectively).
High 8%
Intensive 28%
Moderate-high 2%
Basic 48%
Moderate 4%
Low-moderate 2%
Low 8%
Note. N = 92.
Page 14
Table 1. Distribution of Domain Ratings
Domain n Percent of Cases Assigned Rating
Mitigating No Impact Aggravating
Criminal/Parole History 98 30% 8% 62%
Institutional/Community Behavior 98 37% 32% 32%
Disinhibitors 96 7% 24% 69%
Responsivity 98 41% 32% 28%
Offender Change 95 26% 54% 20%
Release Plan 95 22% 49% 28%
Case-Specific Factors 48 23% 25% 52%
Discordant Information 10 10% 60% 30% Note. Reported n values represent cases for which the domain could be scored, or, in the cases of case-specific factors or discordant information, where relevant information was identified. Percentages may not sum to 100 due to rounding.
Case-specific and discordant information. Where case-specific factors or discordant
information was noted, in addition to assessing whether that information would mitigate,
aggravate, or not impact risk, coders were asked to note the nature of the information. This
information was qualitatively examined using thematic analysis to discern patterns. (Comment
on the appropriateness of the inclusion and the ratings of the information described will be
offered in the concluding section of this report.)
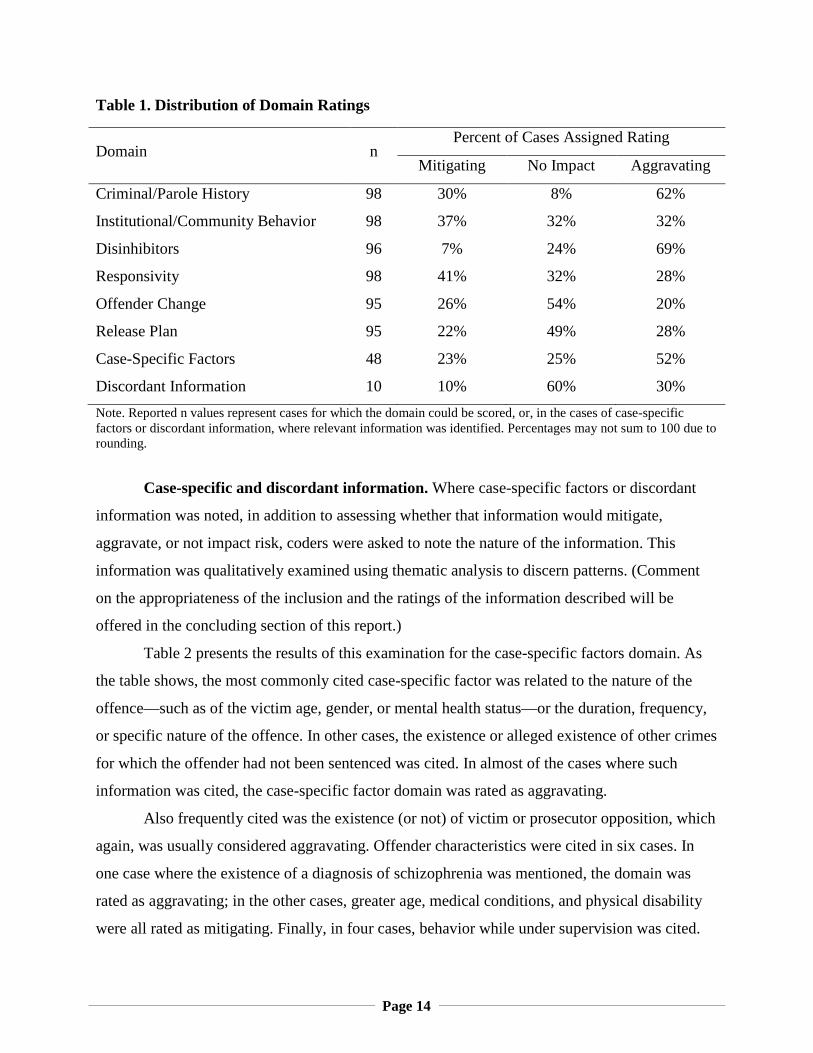
Table 2 presents the results of this examination for the case-specific factors domain. As
the table shows, the most commonly cited case-specific factor was related to the nature of the
offence—such as of the victim age, gender, or mental health status—or the duration, frequency,
or specific nature of the offence. In other cases, the existence or alleged existence of other crimes
for which the offender had not been sentenced was cited. In almost of the cases where such
information was cited, the case-specific factor domain was rated as aggravating.
Also frequently cited was the existence (or not) of victim or prosecutor opposition, which
again, was usually considered aggravating. Offender characteristics were cited in six cases. In
one case where the existence of a diagnosis of schizophrenia was mentioned, the domain was
rated as aggravating; in the other cases, greater age, medical conditions, and physical disability
were all rated as mitigating. Finally, in four cases, behavior while under supervision was cited.
Page 15
Offence-paralleling behavior, denial of the offence, and previous escapes were considered
aggravating, while supporting an investigation while in custody was considered mitigating.
Table 2. Thematic Analysis of Information Cited in Case-Specific Factors Domain
Theme n Number Assigned Rating
Mitigating No Impact Aggravating
Nature of offence (e.g., duration or victim characteristics) 13 - 2 11
Additional crimes exist (e.g., self-reported or that cannot be tried) 7 - - 7
Victim opposition 8 1 3 4
No recorded victim opposition 3 - 3 -
Prosecutor opposition 4 - 2 2
Behavior on previous or current sentence 4 1 - 3
Offender characteristics 6 5 - 1 Note. N = 45 (3 cases where information was noted but was illegible were omitted). Reported n values represent cases for which the theme was mentioned. Given multiple themes could be raised for the same offender, values of n sum to more than 45. In some cases, the existence of multiple themes for the same offender may have influenced the rating the coder assigned.
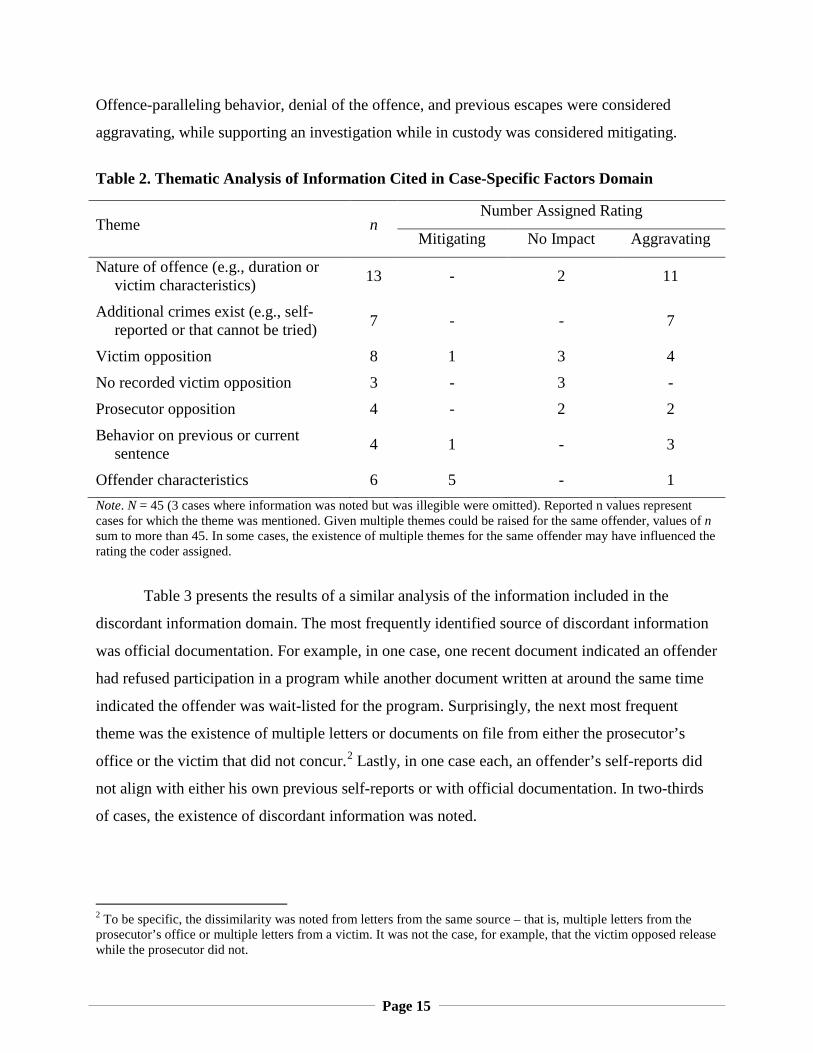
Table 3 presents the results of a similar analysis of the information included in the
discordant information domain. The most frequently identified source of discordant information
was official documentation. For example, in one case, one recent document indicated an offender
had refused participation in a program while another document written at around the same time
indicated the offender was wait-listed for the program. Surprisingly, the next most frequent
theme was the existence of multiple letters or documents on file from either the prosecutor’s
office or the victim that did not concur.2 Lastly, in one case each, an offender’s self-reports did
not align with either his own previous self-reports or with official documentation. In two-thirds
of cases, the existence of discordant information was noted.
2 To be specific, the dissimilarity was noted from letters from the same source – that is, multiple letters from the prosecutor’s office or multiple letters from a victim. It was not the case, for example, that the victim opposed release while the prosecutor did not.

Page 16
Table 3. Thematic Analysis of Information Cited in Discordant Information Domain
Theme n Number Assigned Rating
Mitigating No Impact Aggravating
Differences among official reports 4 - 3 1
Existence of different opposition positions from prosecutor or victim 3 1 2 -
Differences between offender self-report and official report 1 - 1 -
Differences between offender self-reports 1 - - 1
Note. N = 9 (1 case where information was noted but was illegible was omitted). Reported n values represent cases for which the theme was mentioned.
Intercoder variability. One of the goals of the Framework is to increase consistency
across parole board members. Because each of the cases coded in this exercise was coded by
only a single individual, consistency across coders (i.e., inter-rater reliability) could not be
examined directly. However, what could be examined were patterns of ratings across coders.
Despite individual differences in offender files, when considering those cases in the aggregate, it
seems likely that each coder would examine a similar cross-section of cases, in terms of risk,
type of offense, etc.
Given this rationale, the rating patterns of individual coders within each domain were
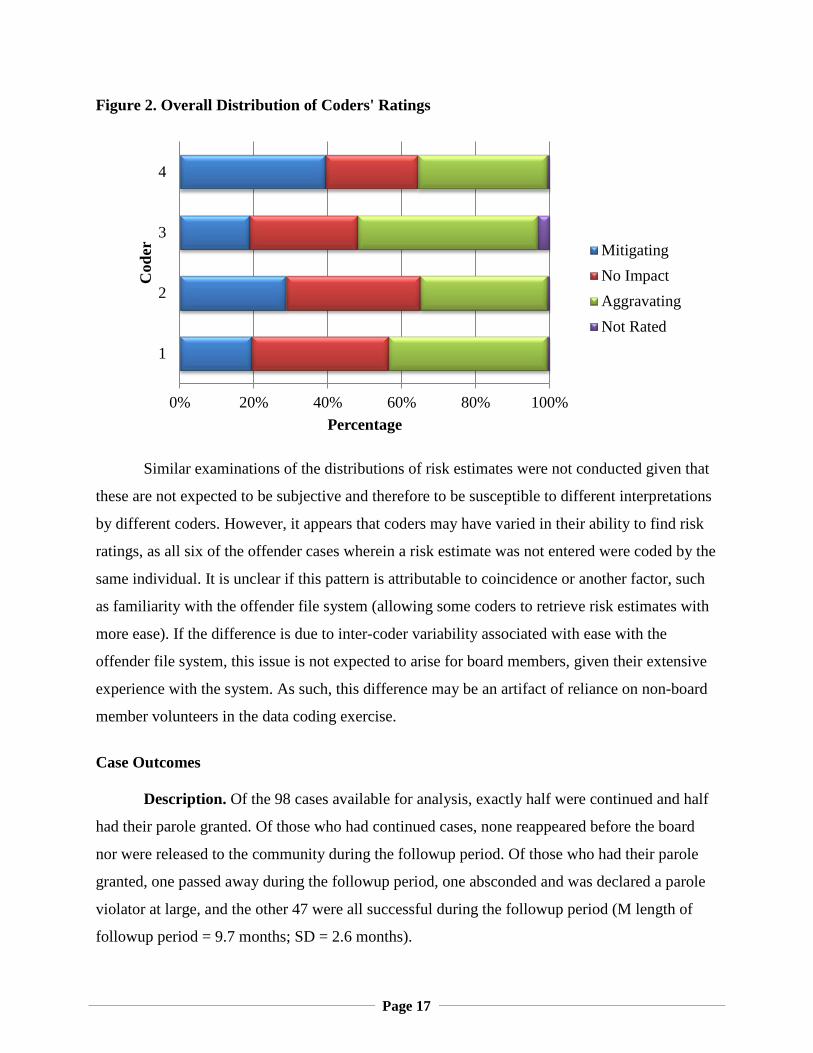
examined and contrasted. Figure 2 presents the overall (i.e., across all domains)3 distribution of
coders’ ratings; the same figure is presented separately for each domain in Appendix A. While
sample sizes are too small within each domain to examine whether differences are statistically
reliable, it appears that both overall and across most domains, coder 4 was more likely than his
or her counterparts to code information as mitigating. Again, it is unknown whether this is a
result of differences in the cases considered by the different coders or differences across coders,
but a possible interpretation is that despite the comprehensive training received by coders, there
were systematic differences in the manner in which they tended to view and code offender file
information. This suggests training boosters could be required for board members if the
Framework is implemented into practice.
3 The discordant information domain was omitted given how infrequently it was rated.
Page 17
Figure 2. Overall Distribution of Coders' Ratings
Similar examinations of the distributions of risk estimates were not conducted given that
these are not expected to be subjective and therefore to be susceptible to different interpretations
by different coders. However, it appears that coders may have varied in their ability to find risk
ratings, as all six of the offender cases wherein a risk estimate was not entered were coded by the
same individual. It is unclear if this pattern is attributable to coincidence or another factor, such
as familiarity with the offender file system (allowing some coders to retrieve risk estimates with
more ease). If the difference is due to inter-coder variability associated with ease with the
offender file system, this issue is not expected to arise for board members, given their extensive
experience with the system. As such, this difference may be an artifact of reliance on non-board
member volunteers in the data coding exercise.
Case Outcomes Description. Of the 98 cases available for analysis, exactly half were continued and half
had their parole granted. Of those who had continued cases, none reappeared before the board
nor were released to the community during the followup period. Of those who had their parole
granted, one passed away during the followup period, one absconded and was declared a parole
violator at large, and the other 47 were all successful during the followup period (M length of
followup period = 9.7 months; SD = 2.6 months).
0% 20% 40% 60% 80% 100%
1
2
3
4
Percentage
Cod
er
MitigatingNo ImpactAggravatingNot Rated
Page 18
Framework assessment. Overall assessments of each case applied to the Framework
were then examined. As would be expected based on earlier analyses, for most cases (93%), all
domains were rated. In 6% of cases, one could not be rated, and in 1% of cases, two could not be
rated.4
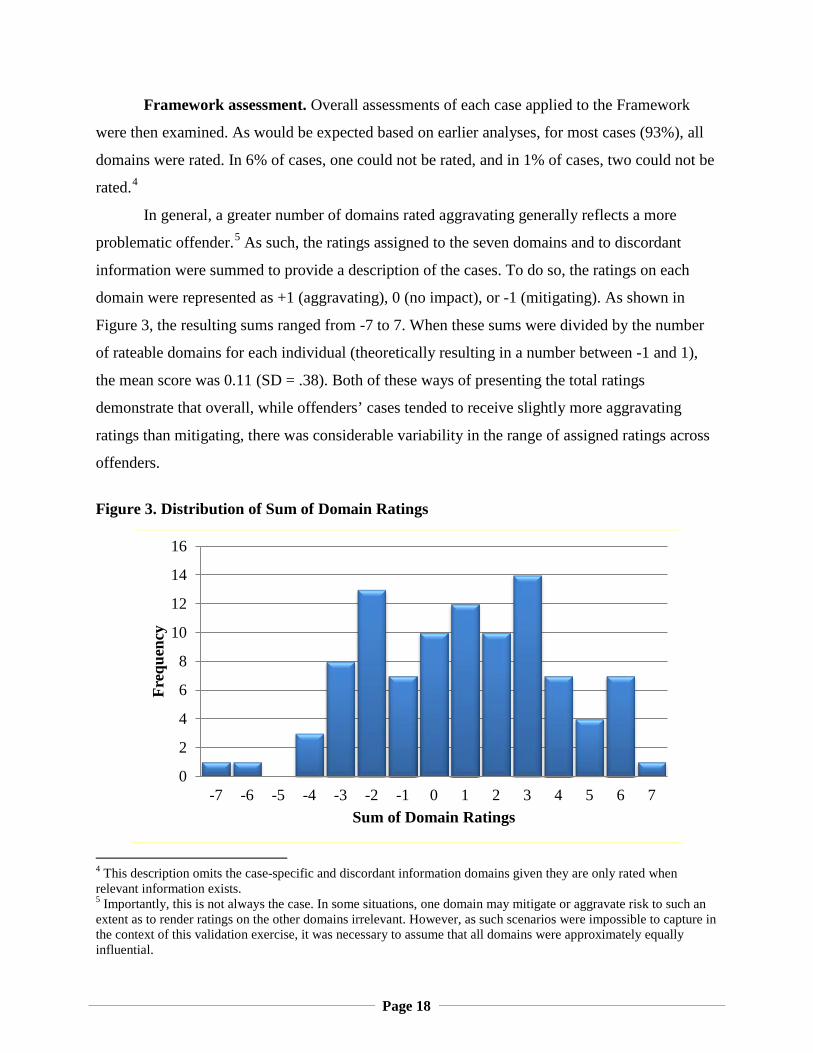
In general, a greater number of domains rated aggravating generally reflects a more
problematic offender.5 As such, the ratings assigned to the seven domains and to discordant
information were summed to provide a description of the cases. To do so, the ratings on each
domain were represented as +1 (aggravating), 0 (no impact), or -1 (mitigating). As shown in
Figure 3, the resulting sums ranged from -7 to 7. When these sums were divided by the number
of rateable domains for each individual (theoretically resulting in a number between -1 and 1),
the mean score was 0.11 (SD = .38). Both of these ways of presenting the total ratings
demonstrate that overall, while offenders’ cases tended to receive slightly more aggravating
ratings than mitigating, there was considerable variability in the range of assigned ratings across
offenders.
Figure 3. Distribution of Sum of Domain Ratings
4 This description omits the case-specific and discordant information domains given they are only rated when relevant information exists. 5 Importantly, this is not always the case. In some situations, one domain may mitigate or aggravate risk to such an extent as to render ratings on the other domains irrelevant. However, as such scenarios were impossible to capture in the context of this validation exercise, it was necessary to assume that all domains were approximately equally influential.
0
2
4
6
8
10
12
14
16
-7 -6 -5 -4 -3 -2 -1 0 1 2 3 4 5 6 7
Freq
uenc
y
Sum of Domain Ratings
Page 19
Parole decisions (in lieu of post-decision outcome). Of course, the most important
factor with respect to the Framework is its performance in terms of predicting post-decision
outcomes. However, it was impossible to analyze outcomes given the lack of variability among
cases in this sample. None of the offenders with continued cases were released during the
followup period (which would have allowed examination of their performance in the
community), and of those who were released, virtually all were successful. As such, analyses
focused on parole decisions instead. Of interest was whether the Framework would have
identified the same individuals for a parole decision as the board members did.
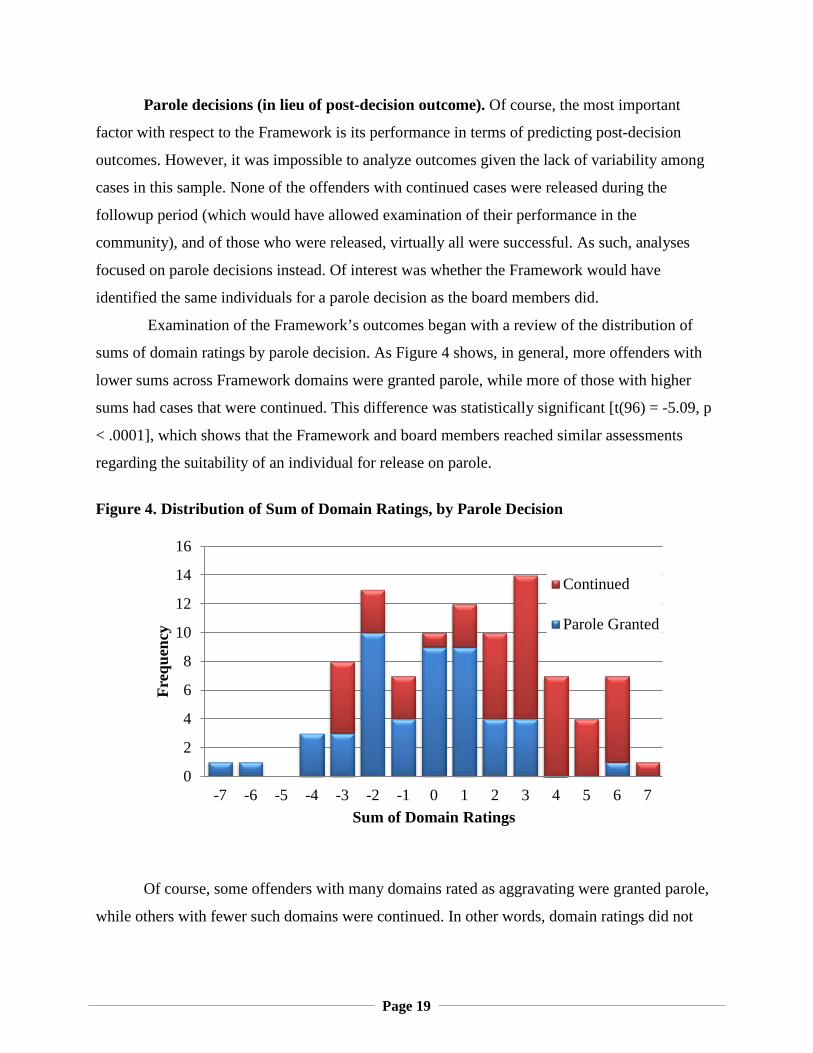
Examination of the Framework’s outcomes began with a review of the distribution of
sums of domain ratings by parole decision. As Figure 4 shows, in general, more offenders with
lower sums across Framework domains were granted parole, while more of those with higher
sums had cases that were continued. This difference was statistically significant [t(96) = -5.09, p
< .0001], which shows that the Framework and board members reached similar assessments
regarding the suitability of an individual for release on parole.
Figure 4. Distribution of Sum of Domain Ratings, by Parole Decision
Of course, some offenders with many domains rated as aggravating were granted parole,
while others with fewer such domains were continued. In other words, domain ratings did not
0
2
4
6
8
10
12
14
16
-7 -6 -5 -4 -3 -2 -1 0 1 2 3 4 5 6 7
Freq
uenc
y
Sum of Domain Ratings
Continued
Parole Granted
Page 20
perfectly predict a parole decision. Of interest, then, was how its predictive capacity compared to
that of other instruments at the board’s disposal.
To examine this issue, the risk ratings derived from the various risk instruments available
to board members when reaching decisions was used. As previously mentioned, when more than
one risk assessment instrument was available, coders were asked to indicate which would be
prioritized for that case, given case characteristics (e.g., typically, a sex-offender-specific
instrument would be prioritized for a sex offender). The seven cases with no identified risk
estimate were eliminated from these analyses, leaving 91 cases.
To conduct these analyses, a number of compromises were necessary. First, it was
necessary to divide the estimates from all of the prioritized risk instruments into two categories:
low and high risk (see Appendix B). Using this categorization, 62% of coded cases were found to
be low risk, while the remaining 38% were found to be high risk. However, this approach was
necessarily inexact because each original risk instrument aims to measure different outcomes,
uses different followup periods, and uses different language. This was further complicated by the
fact that limitations of the data (i.e., lack of post-decision outcome variability) meant that
analyses had to be focused on the parole decision, which is not what the instruments were
developed to measure.
Second, the Framework is not intended to be used rigidly—that is, it is intended to be
used as an aide rather than as a tool to produce a specific score, with a specific cut-point assigned
to a decision to grant or deny parole. However, for the purposes of a validation exercise, it was
necessary to treat it as such. In other words, it was necessary to create a Framework-informed
“risk rating” and compare it to the previously calculated risk category, which was based on
results that informed actual parole decisions. A very simplistic approach was used to do so. The
simplicity of this approach, together with the compromises outlined above, are acknowledged as
limitations to any conclusions drawn from this report, but given that the purpose of this exercise
was only a very preliminary validation, they were considered, at the least, illustrative.
Specifically, a summation approach was used. Specifically, scores on the Framework
domains and the new overall risk categorization were both considered. The domain sums
calculated previously were added to the risk category (represented as 1 for low and 2 for high),
Page 21
but to represent the primacy of the actuarial estimate of risk, this score was first multiplied by 5,6
yielding possibilities of 5 or 10. This approach resulted in total scores ranging from -2 to 17.
Overall, these computations resulted in three possible predictors of decision:
1. The new risk category
2. The sum of the domains only
3. The summed risk category and domains rating
The possible predictors were compared in terms of their ability to predict the decisional
outcome of the parole hearing. Comparisons were conducted using the Receiver Operating
Characteristic (ROC) Area Under the Curve (AUC). An AUC is essentially an estimate of the
likelihood that a random case with the outcome of interest (granted parole) will have a higher
score than another case without that outcome. AUCs range from 0 to 1, with .50 reflecting
chance, .60 representing a minimum acceptable level of predictive accuracy, and values
exceeding .70 preferred.7
Before discussing the results, it bears repeating that many compromises were made to
prepare data for these analyses, and results should therefore be considered only preliminary.
Moreover, the outcome used in these analyses—parole decision—is acting as a proxy for the
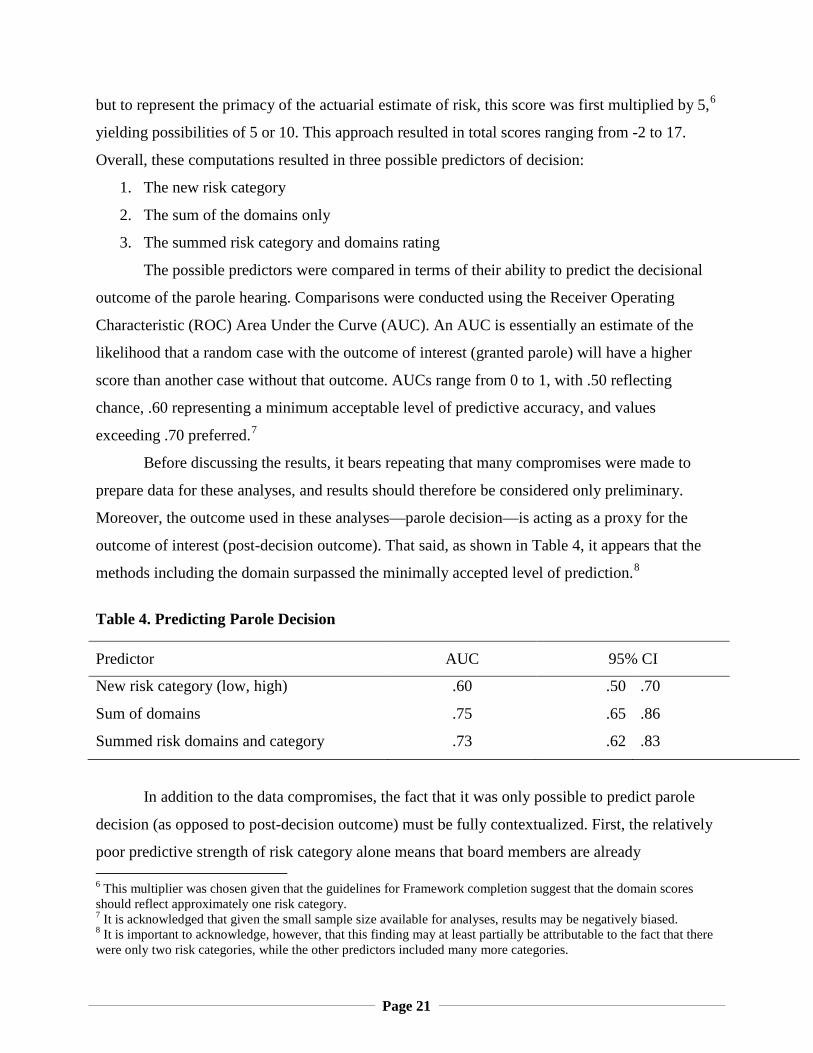
outcome of interest (post-decision outcome). That said, as shown in Table 4, it appears that the
methods including the domain surpassed the minimally accepted level of prediction.8
Table 4. Predicting Parole Decision
Predictor AUC 95% CI
New risk category (low, high) .60 .50 .70
Sum of domains .75 .65 .86
Summed risk domains and category .73 .62 .83
In addition to the data compromises, the fact that it was only possible to predict parole
decision (as opposed to post-decision outcome) must be fully contextualized. First, the relatively
poor predictive strength of risk category alone means that board members are already 6 This multiplier was chosen given that the guidelines for Framework completion suggest that the domain scores should reflect approximately one risk category. 7 It is acknowledged that given the small sample size available for analyses, results may be negatively biased. 8 It is important to acknowledge, however, that this finding may at least partially be attributable to the fact that there were only two risk categories, while the other predictors included many more categories.
Page 22
considering something other than the actuarial risk estimate in reaching their parole decisions.
These analyses do not demonstrate that the information highlighted for review within the
Framework is more important in parole decisionmaking than is the information already
considered by board members. Nonetheless, given that the Framework reflects a validated best
practice model and since it better accounts for the decision than the risk measure in this small
validation study, this lends support for the quality of Ohio parole decisions. The high success
rate also supports this contention. Nonetheless, the analyses cannot offer any information
regarding the relative predictive strength of either the parole decision or the risk estimate with
respect to post-decision outcome.
Page 23
CONNECTICUT
Structured Decisionmaking Framework Availability of information. For the Framework to be used effectively, it must be
possible for parole decisionmakers to apply it. As such, we examined the frequency with which
coders indicated that there was insufficient information available to rate the Framework domains.
Information non-availability arose relatively frequently for among four domains. Specifically,
insufficient information was available to code the offender change domain in 88% of cases, the
ability to control behavior domain in 25% of cases, and the institutional/community behavior and
responsivity domains in 2% and 1% of cases respectively. The issue of lack of information to
code the former two domains was raised during training and was therefore expected; at that time,
staff informed us that the information would routinely be missing from files, but could possibly
be obtained during hearings. Since this time, the Connecticut Board of Pardons and Parole has
modified its decision preparation process to ensure that all required information is available.
Regardless, given the retrospective nature of this coding exercise (which, by necessity, did not
include hearings), the rates of information non-availability were not unexpected and are not
representative of the extent to which the domains can actually be scored by board members
considering cases with both offender files and hearings at their disposal.
Risk estimates. For those cases where sufficient information was available to allow for
coding, the distribution of ratings was examined. First, risk assessment ratings were examined.
All cases had a recorded Treatment and Programs Assessment Instrument (TPAI) score, and a
small proportion (4%) also had a Static-99 score on file. Coders were asked to identify which
risk assessment estimate should be considered highest priority for the given offender; this is the
estimate that was to act as anchor in considering that offender. In all but one case, the TPAI was
selected; in those three cases where a Static-99 score existed but was not selected, the TPAI
score was always higher, reflecting higher risk. Figure 5 represents the distribution of TPAI
ratings in the sample. As shown, 13% of offenders’ risk was estimated to be in the lowest TPAI
group (scores 0–3; 18.7% convicted with a new sentence within 3 years of release), 43% in the
moderate group (scores 4 and 5; 37.4% convicted with a new sentence within 3 years of release),
and 44% in the highest group (scores 6–8; 49.3% convicted with a new sentence within 3 years
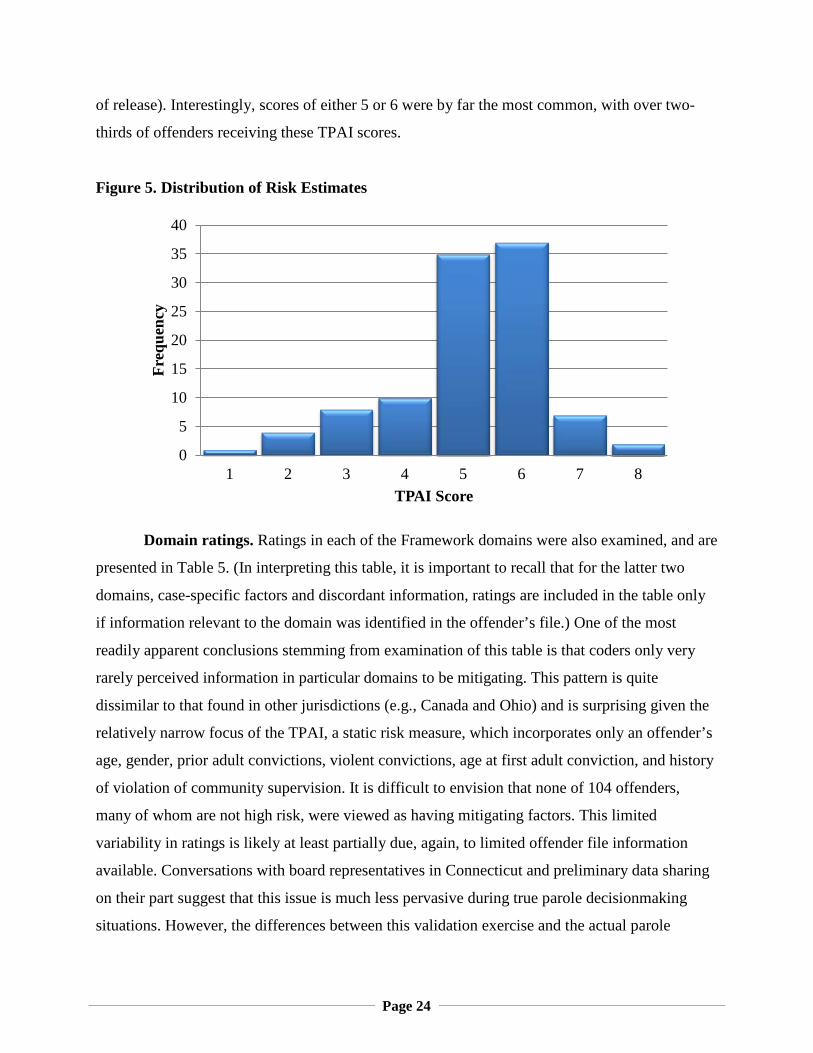
Page 24
of release). Interestingly, scores of either 5 or 6 were by far the most common, with over two-
thirds of offenders receiving these TPAI scores.
Figure 5. Distribution of Risk Estimates
Domain ratings. Ratings in each of the Framework domains were also examined, and are
presented in Table 5. (In interpreting this table, it is important to recall that for the latter two
domains, case-specific factors and discordant information, ratings are included in the table only
if information relevant to the domain was identified in the offender’s file.) One of the most
readily apparent conclusions stemming from examination of this table is that coders only very
rarely perceived information in particular domains to be mitigating. This pattern is quite
dissimilar to that found in other jurisdictions (e.g., Canada and Ohio) and is surprising given the
relatively narrow focus of the TPAI, a static risk measure, which incorporates only an offender’s
age, gender, prior adult convictions, violent convictions, age at first adult conviction, and history
of violation of community supervision. It is difficult to envision that none of 104 offenders,
many of whom are not high risk, were viewed as having mitigating factors. This limited
variability in ratings is likely at least partially due, again, to limited offender file information
available. Conversations with board representatives in Connecticut and preliminary data sharing
on their part suggest that this issue is much less pervasive during true parole decisionmaking
situations. However, the differences between this validation exercise and the actual parole
0
5
10
15
20
25
30
35
40
1 2 3 4 5 6 7 8
Freq
uenc
y
TPAI Score
Page 25
decisionmaking circumstances in which board members function must be recalled when these
findings are interpreted.
Table 5. Distribution of Domain Ratings
Domain n Percent of Cases Assigned Rating
Mitigating No Impact Aggravating
Criminal/Parole History 104 9% 19% 72%
Institutional/Community Behavior 103 - 51% 49%
Ability to Control Behavior 78 - 22% 78%
Responsivity Issues 102 14% 52% 35%
Offender Change 13 - 38% 62%
Release Plan 104 - 99% 1%
Case-Specific Factors 24 - 38% 63%
Conflicting Information 4 - 50% 50% Note. Reported n values represent cases for which the domain could be scored, or, in the cases of case-specific factors or conflicting information, where relevant information was identified. Percentages may not sum to 100 due to rounding.
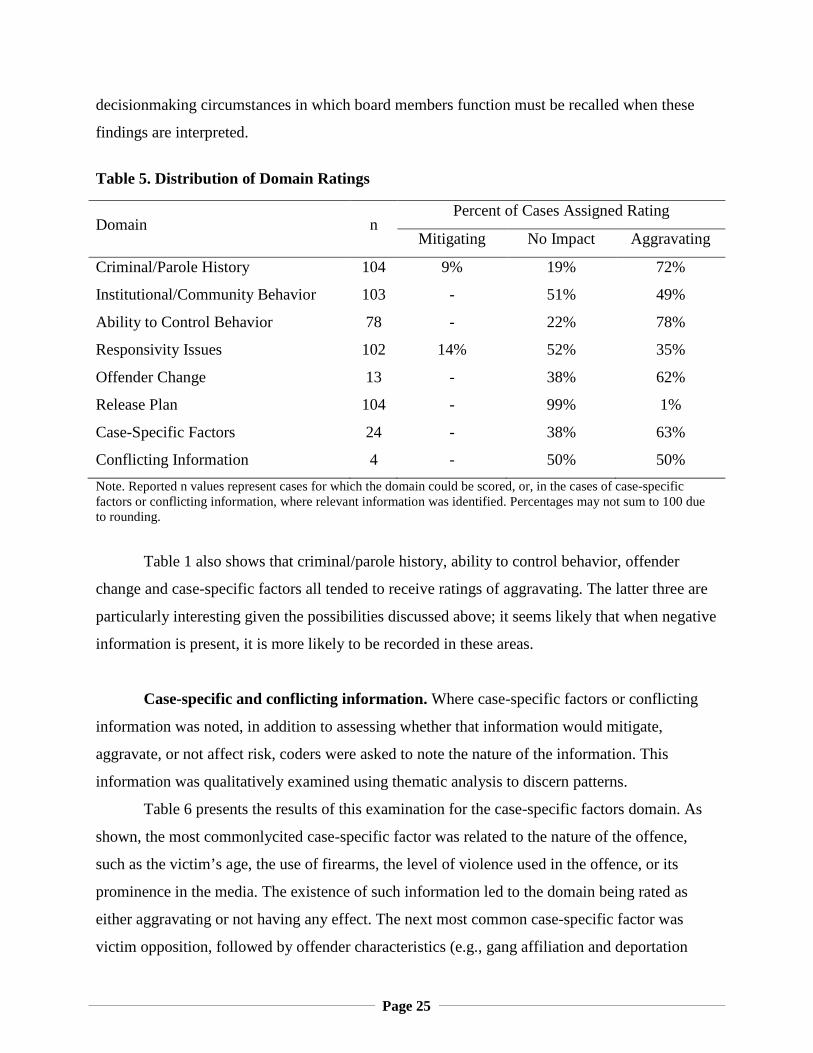
Table 1 also shows that criminal/parole history, ability to control behavior, offender
change and case-specific factors all tended to receive ratings of aggravating. The latter three are
particularly interesting given the possibilities discussed above; it seems likely that when negative
information is present, it is more likely to be recorded in these areas.
Case-specific and conflicting information. Where case-specific factors or conflicting
information was noted, in addition to assessing whether that information would mitigate,
aggravate, or not affect risk, coders were asked to note the nature of the information. This
information was qualitatively examined using thematic analysis to discern patterns.
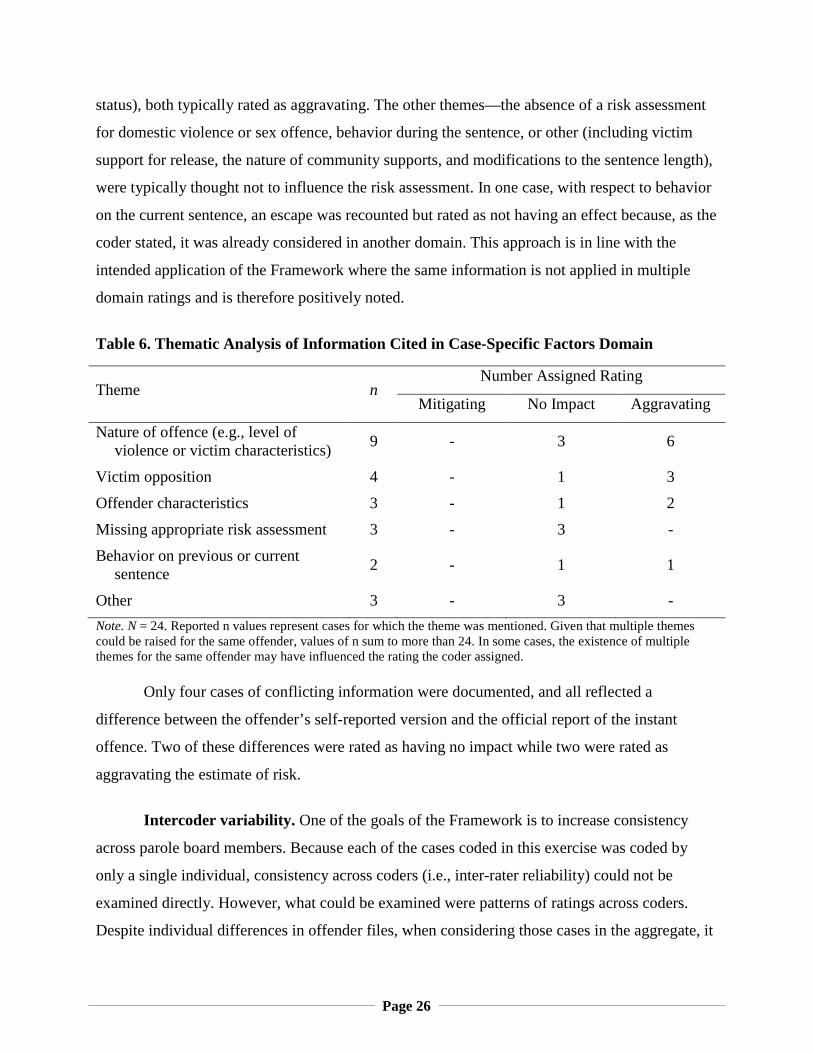
Table 6 presents the results of this examination for the case-specific factors domain. As
shown, the most commonlycited case-specific factor was related to the nature of the offence,
such as the victim’s age, the use of firearms, the level of violence used in the offence, or its
prominence in the media. The existence of such information led to the domain being rated as
either aggravating or not having any effect. The next most common case-specific factor was
victim opposition, followed by offender characteristics (e.g., gang affiliation and deportation
Page 26
status), both typically rated as aggravating. The other themes—the absence of a risk assessment
for domestic violence or sex offence, behavior during the sentence, or other (including victim
support for release, the nature of community supports, and modifications to the sentence length),
were typically thought not to influence the risk assessment. In one case, with respect to behavior
on the current sentence, an escape was recounted but rated as not having an effect because, as the
coder stated, it was already considered in another domain. This approach is in line with the
intended application of the Framework where the same information is not applied in multiple
domain ratings and is therefore positively noted.
Table 6. Thematic Analysis of Information Cited in Case-Specific Factors Domain
Theme n Number Assigned Rating
Mitigating No Impact Aggravating
Nature of offence (e.g., level of violence or victim characteristics) 9 - 3 6
Victim opposition 4 - 1 3
Offender characteristics 3 - 1 2
Missing appropriate risk assessment 3 - 3 -
Behavior on previous or current sentence 2 - 1 1
Other 3 - 3 - Note. N = 24. Reported n values represent cases for which the theme was mentioned. Given that multiple themes could be raised for the same offender, values of n sum to more than 24. In some cases, the existence of multiple themes for the same offender may have influenced the rating the coder assigned. Only four cases of conflicting information were documented, and all reflected a
difference between the offender’s self-reported version and the official report of the instant
offence. Two of these differences were rated as having no impact while two were rated as
aggravating the estimate of risk.
Intercoder variability. One of the goals of the Framework is to increase consistency
across parole board members. Because each of the cases coded in this exercise was coded by
only a single individual, consistency across coders (i.e., inter-rater reliability) could not be
examined directly. However, what could be examined were patterns of ratings across coders.
Despite individual differences in offender files, when considering those cases in the aggregate, it
Page 27
seems likely that each coder would examine a similar cross-section of cases in terms of risk, type
of offense, etc.
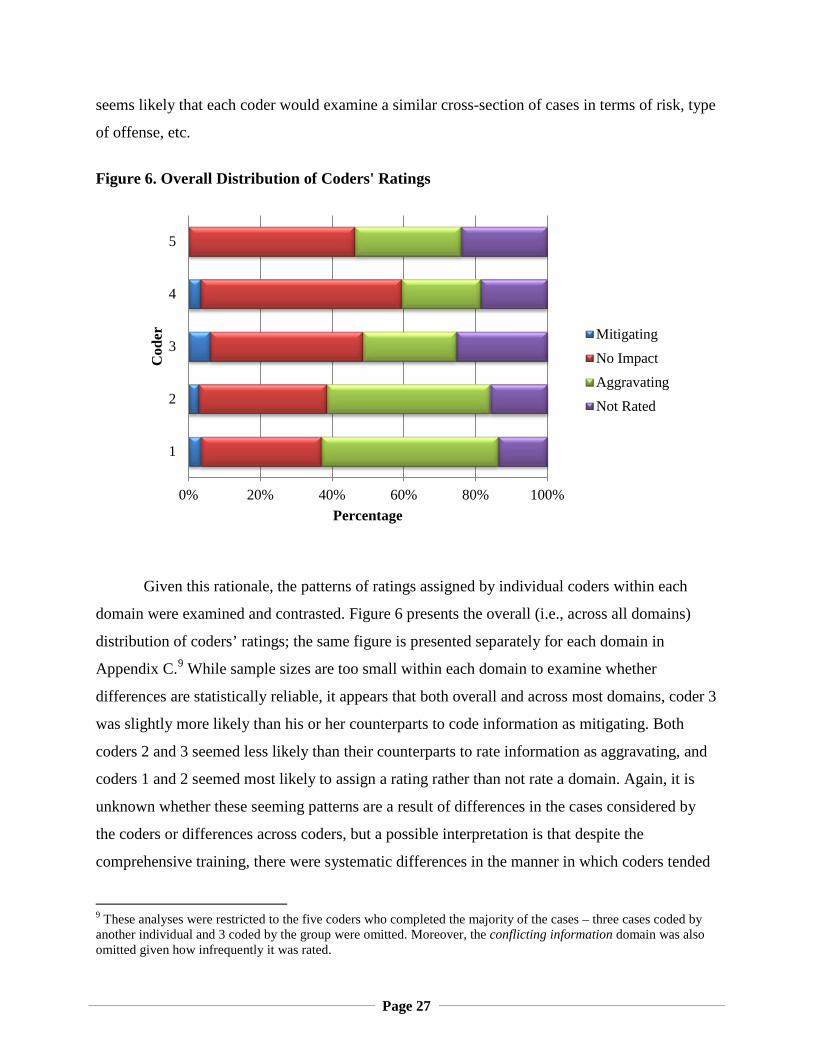
Figure 6. Overall Distribution of Coders' Ratings
Given this rationale, the patterns of ratings assigned by individual coders within each
domain were examined and contrasted. Figure 6 presents the overall (i.e., across all domains)
distribution of coders’ ratings; the same figure is presented separately for each domain in
Appendix C.9 While sample sizes are too small within each domain to examine whether
differences are statistically reliable, it appears that both overall and across most domains, coder 3
was slightly more likely than his or her counterparts to code information as mitigating. Both
coders 2 and 3 seemed less likely than their counterparts to rate information as aggravating, and
coders 1 and 2 seemed most likely to assign a rating rather than not rate a domain. Again, it is
unknown whether these seeming patterns are a result of differences in the cases considered by
the coders or differences across coders, but a possible interpretation is that despite the
comprehensive training, there were systematic differences in the manner in which coders tended
9 These analyses were restricted to the five coders who completed the majority of the cases – three cases coded by another individual and 3 coded by the group were omitted. Moreover, the conflicting information domain was also omitted given how infrequently it was rated.
0% 20% 40% 60% 80% 100%
1
2
3
4
5
Percentage
Cod
er
MitigatingNo ImpactAggravatingNot Rated
Page 28
to view and code offender file information. This suggests training boosters could be required for
board members if the Framework is implemented into practice.
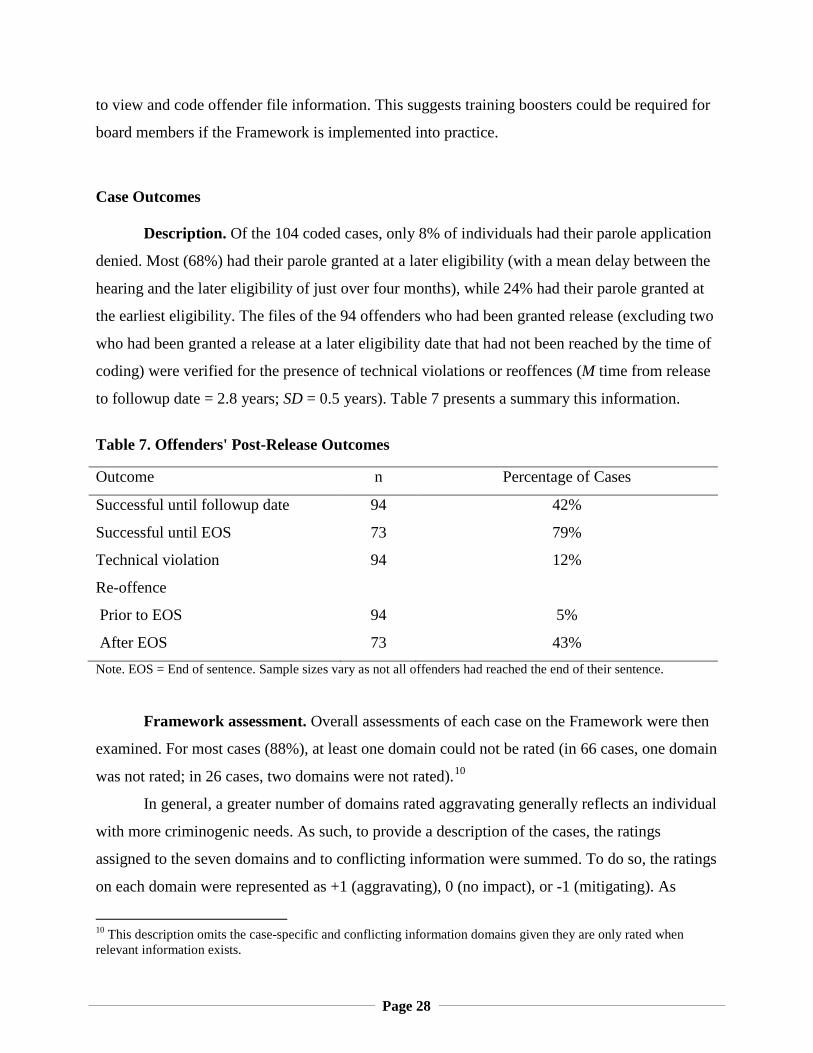
Case Outcomes Description. Of the 104 coded cases, only 8% of individuals had their parole application
denied. Most (68%) had their parole granted at a later eligibility (with a mean delay between the
hearing and the later eligibility of just over four months), while 24% had their parole granted at
the earliest eligibility. The files of the 94 offenders who had been granted release (excluding two
who had been granted a release at a later eligibility date that had not been reached by the time of
coding) were verified for the presence of technical violations or reoffences (M time from release
to followup date = 2.8 years; SD = 0.5 years). Table 7 presents a summary this information.
Table 7. Offenders' Post-Release Outcomes
Outcome n Percentage of Cases
Successful until followup date 94 42%
Successful until EOS 73 79%
Technical violation 94 12%
Re-offence
Prior to EOS 94 5%
After EOS 73 43% Note. EOS = End of sentence. Sample sizes vary as not all offenders had reached the end of their sentence.
Framework assessment. Overall assessments of each case on the Framework were then
examined. For most cases (88%), at least one domain could not be rated (in 66 cases, one domain
was not rated; in 26 cases, two domains were not rated).10
In general, a greater number of domains rated aggravating generally reflects an individual
with more criminogenic needs. As such, to provide a description of the cases, the ratings
assigned to the seven domains and to conflicting information were summed. To do so, the ratings
on each domain were represented as +1 (aggravating), 0 (no impact), or -1 (mitigating). As
10 This description omits the case-specific and conflicting information domains given they are only rated when relevant information exists.
Page 29
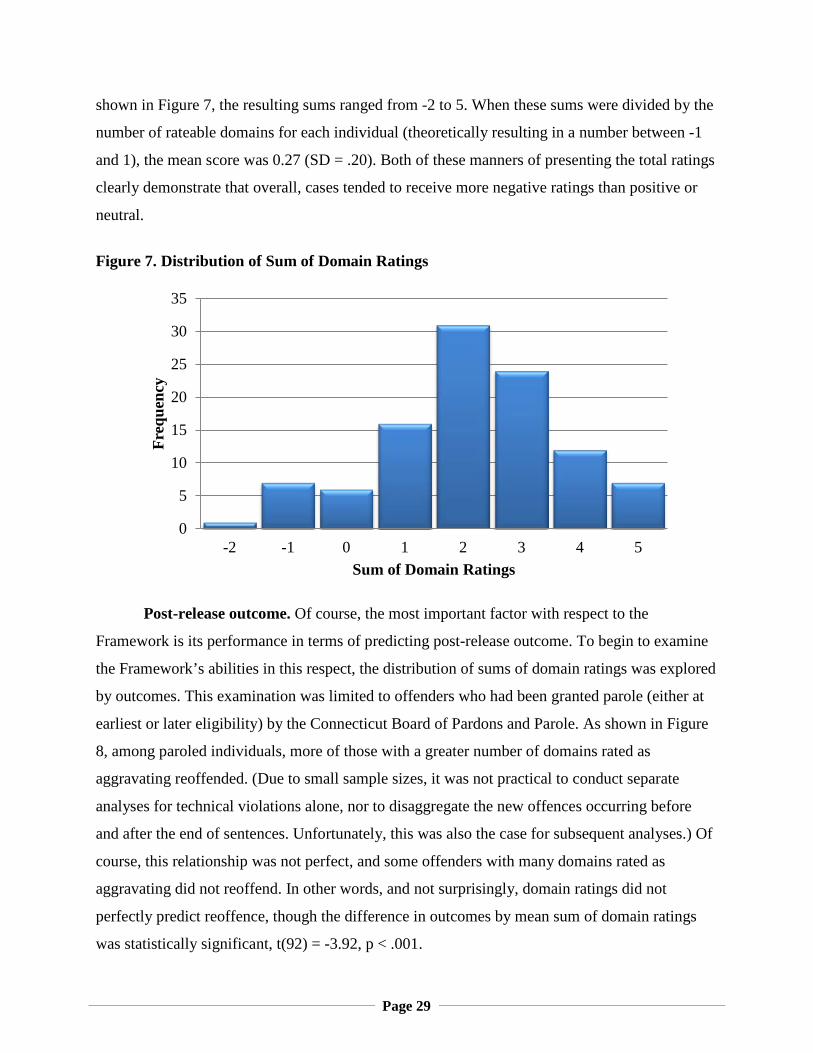
shown in Figure 7, the resulting sums ranged from -2 to 5. When these sums were divided by the
number of rateable domains for each individual (theoretically resulting in a number between -1
and 1), the mean score was 0.27 (SD = .20). Both of these manners of presenting the total ratings
clearly demonstrate that overall, cases tended to receive more negative ratings than positive or
neutral.
Figure 7. Distribution of Sum of Domain Ratings
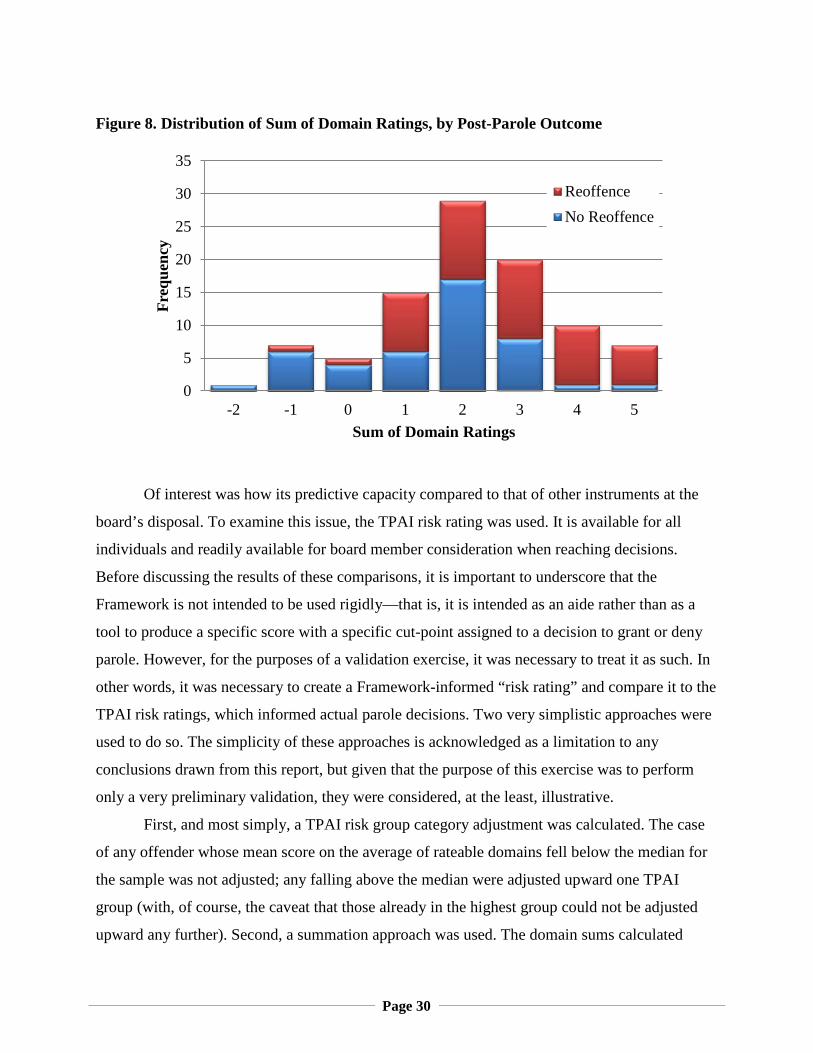
Post-release outcome. Of course, the most important factor with respect to the
Framework is its performance in terms of predicting post-release outcome. To begin to examine
the Framework’s abilities in this respect, the distribution of sums of domain ratings was explored
by outcomes. This examination was limited to offenders who had been granted parole (either at
earliest or later eligibility) by the Connecticut Board of Pardons and Parole. As shown in Figure
8, among paroled individuals, more of those with a greater number of domains rated as
aggravating reoffended. (Due to small sample sizes, it was not practical to conduct separate
analyses for technical violations alone, nor to disaggregate the new offences occurring before
and after the end of sentences. Unfortunately, this was also the case for subsequent analyses.) Of
course, this relationship was not perfect, and some offenders with many domains rated as
aggravating did not reoffend. In other words, and not surprisingly, domain ratings did not
perfectly predict reoffence, though the difference in outcomes by mean sum of domain ratings
was statistically significant, t(92) = -3.92, p < .001.
0
5
10
15
20
25
30
35
-2 -1 0 1 2 3 4 5
Freq
uenc
y
Sum of Domain Ratings
Page 30
Figure 8. Distribution of Sum of Domain Ratings, by Post-Parole Outcome
Of interest was how its predictive capacity compared to that of other instruments at the
board’s disposal. To examine this issue, the TPAI risk rating was used. It is available for all
individuals and readily available for board member consideration when reaching decisions.
Before discussing the results of these comparisons, it is important to underscore that the
Framework is not intended to be used rigidly—that is, it is intended as an aide rather than as a
tool to produce a specific score with a specific cut-point assigned to a decision to grant or deny
parole. However, for the purposes of a validation exercise, it was necessary to treat it as such. In
other words, it was necessary to create a Framework-informed “risk rating” and compare it to the
TPAI risk ratings, which informed actual parole decisions. Two very simplistic approaches were
used to do so. The simplicity of these approaches is acknowledged as a limitation to any
conclusions drawn from this report, but given that the purpose of this exercise was to perform
only a very preliminary validation, they were considered, at the least, illustrative.
First, and most simply, a TPAI risk group category adjustment was calculated. The case
of any offender whose mean score on the average of rateable domains fell below the median for
the sample was not adjusted; any falling above the median were adjusted upward one TPAI
group (with, of course, the caveat that those already in the highest group could not be adjusted
upward any further). Second, a summation approach was used. The domain sums calculated
0
5
10
15
20
25
30
35
-2 -1 0 1 2 3 4 5
Freq
uenc
y
Sum of Domain Ratings
ReoffenceNo Reoffence
Page 31
previously were added to the TPAI group11 score (ranging from 1 to 3), but to represent the
importance of the actuarial estimate of risk, this score was first multiplied by 4,12 yielding a
range of 4 to 12. This approach resulted in total scores ranging from 2 to 17.
These computations resulted in four possible predictors of post-release outcome:
1. The original, unmodified TPAI risk group
2. The adjusted TPAI risk group
3. The sum of the domains only
4. The summed TPAI risk group and domains rating
The possible predictors were compared in terms of their predictive accuracy.
Comparisons were conducted using the Receiver Operating Characteristic (ROC) Area Under the
Curve (AUC). An AUC is essentially an estimate of the likelihood that a random case with the
outcome of interest (negative post-release outcome) will have a higher score than another case
without the outcome of interest. AUCs range from 0 to 1, with .50 reflecting chance, .60
representing a minimum acceptable level of predictive accuracy, and values exceeding .70
preferred.13
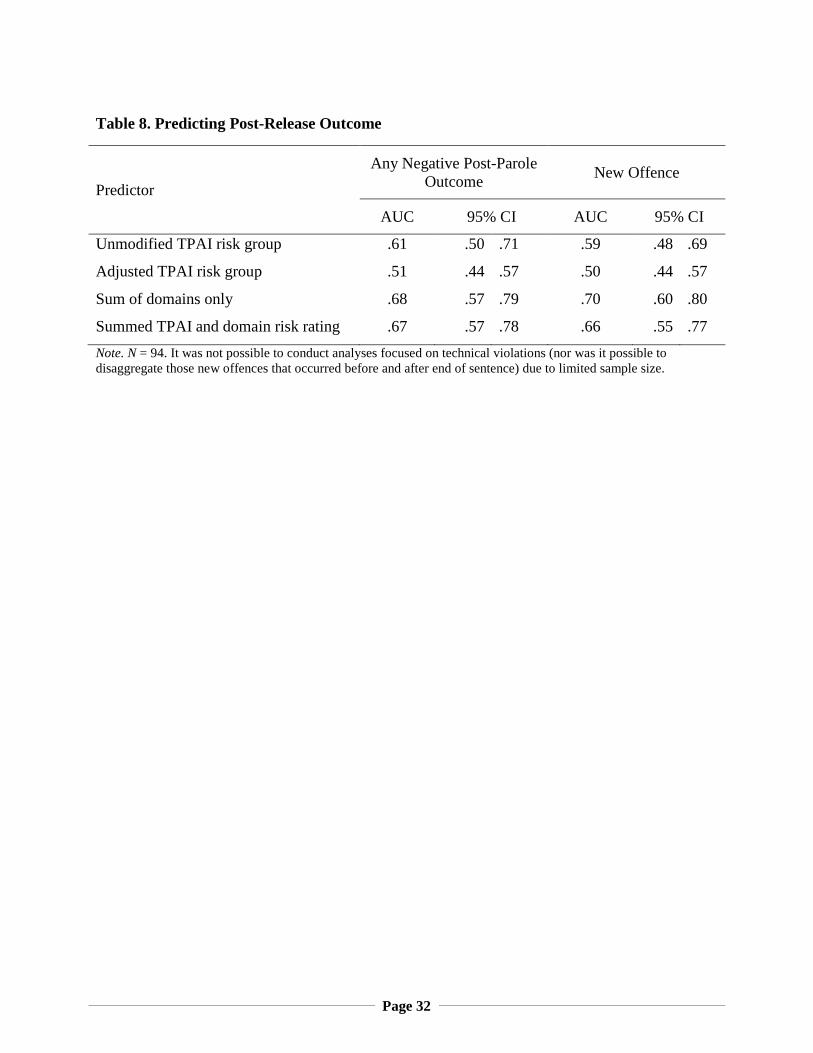
Table 8 summarizes the results of these analyses for both any negative post-parole
outcome (meaning a technical violation and/or a new offence) as well as for new offences only.
Though the confidence intervals around calculated values are quite large (as a result of small
sample sizes) and definitive interpretations are therefore impossible, a trend presents itself in
these analyses. It seems clear that the adjusted TPAI risk group rating—that is, the increasing of
the TPAI risk rating by one category if supported by a having more aggravating domains in the
Framework than at least half of offenders—was consistently not an effective predictor. The other
three approaches did seem to attain at least the minimal level of accepted predictive strength,
with the options including domains (either alone or in addition to the TPAI risk rating)
outperforming14 the TPAI risk group alone.
11 The group was used rather than the raw score because normative recidivism data were available at the group but not the score level. Moreover, for consistency, the TPAI group score was used even for the one case where the coder indicated that the Static-99 should be prioritized. 12 This multiplier was chosen given that the guidelines for Framework completion suggest that the domain scores should reflect approximately one risk category. 13 It is acknowledged that given the small sample size available for analyses, results may be negatively biased. 14 It is important to reiterate that the sample size – and resulting wide confidence intervals – means that this assertion cannot be supported statistically. Though it appears that this pattern is present, further analyses with larger sample sizes will be necessary to allow such statements to be made with certainty.
Page 32
Table 8. Predicting Post-Release Outcome
Predictor
Any Negative Post-Parole Outcome New Offence
AUC 95% CI AUC 95% CI
Unmodified TPAI risk group .61 .50 .71 .59 .48 .69
Adjusted TPAI risk group .51 .44 .57 .50 .44 .57
Sum of domains only .68 .57 .79 .70 .60 .80
Summed TPAI and domain risk rating .67 .57 .78 .66 .55 .77 Note. N = 94. It was not possible to conduct analyses focused on technical violations (nor was it possible to disaggregate those new offences that occurred before and after end of sentence) due to limited sample size.
Page 33
KANSAS
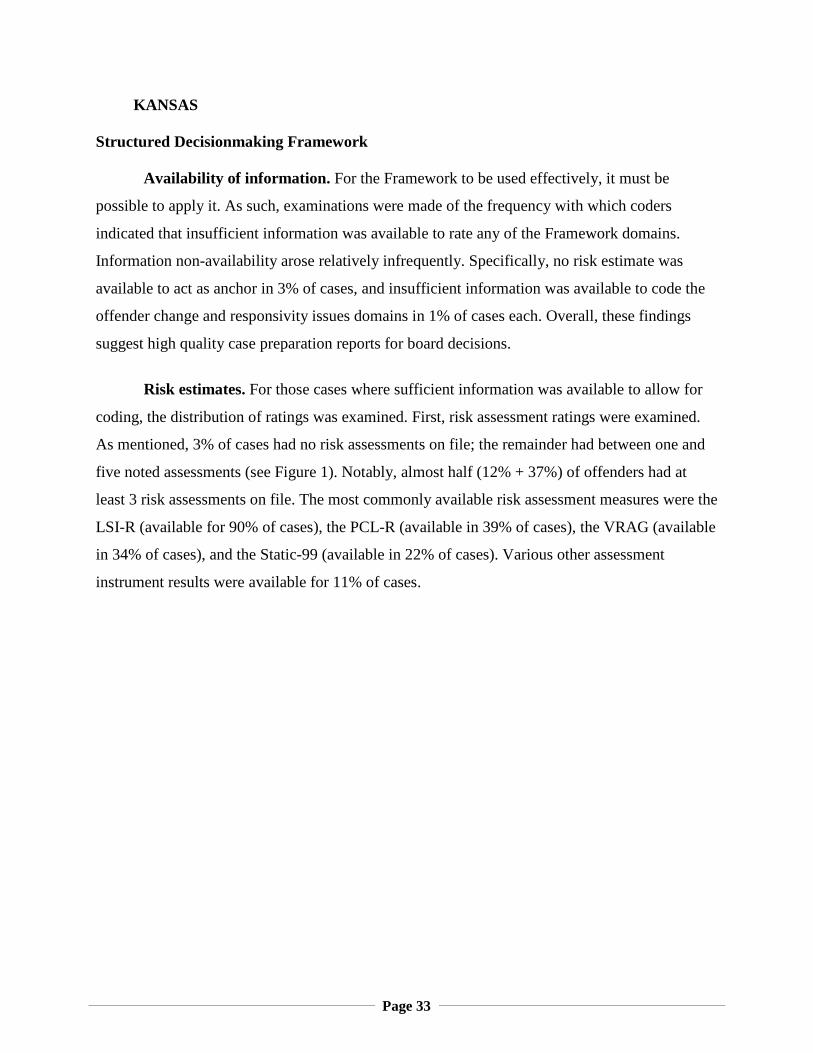
Structured Decisionmaking Framework Availability of information. For the Framework to be used effectively, it must be
possible to apply it. As such, examinations were made of the frequency with which coders
indicated that insufficient information was available to rate any of the Framework domains.
Information non-availability arose relatively infrequently. Specifically, no risk estimate was
available to act as anchor in 3% of cases, and insufficient information was available to code the
offender change and responsivity issues domains in 1% of cases each. Overall, these findings
suggest high quality case preparation reports for board decisions.
Risk estimates. For those cases where sufficient information was available to allow for
coding, the distribution of ratings was examined. First, risk assessment ratings were examined.
As mentioned, 3% of cases had no risk assessments on file; the remainder had between one and
five noted assessments (see Figure 1). Notably, almost half (12% + 37%) of offenders had at
least 3 risk assessments on file. The most commonly available risk assessment measures were the
LSI-R (available for 90% of cases), the PCL-R (available in 39% of cases), the VRAG (available
in 34% of cases), and the Static-99 (available in 22% of cases). Various other assessment
instrument results were available for 11% of cases.
Page 34
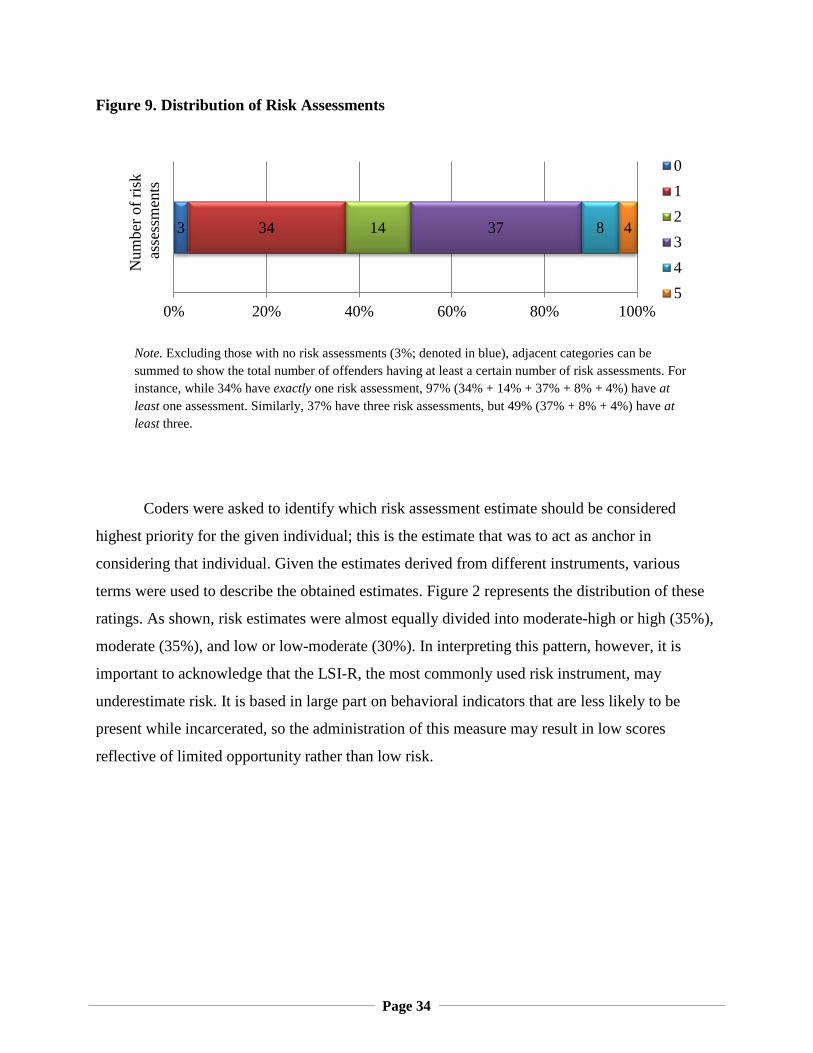
Figure 9. Distribution of Risk Assessments
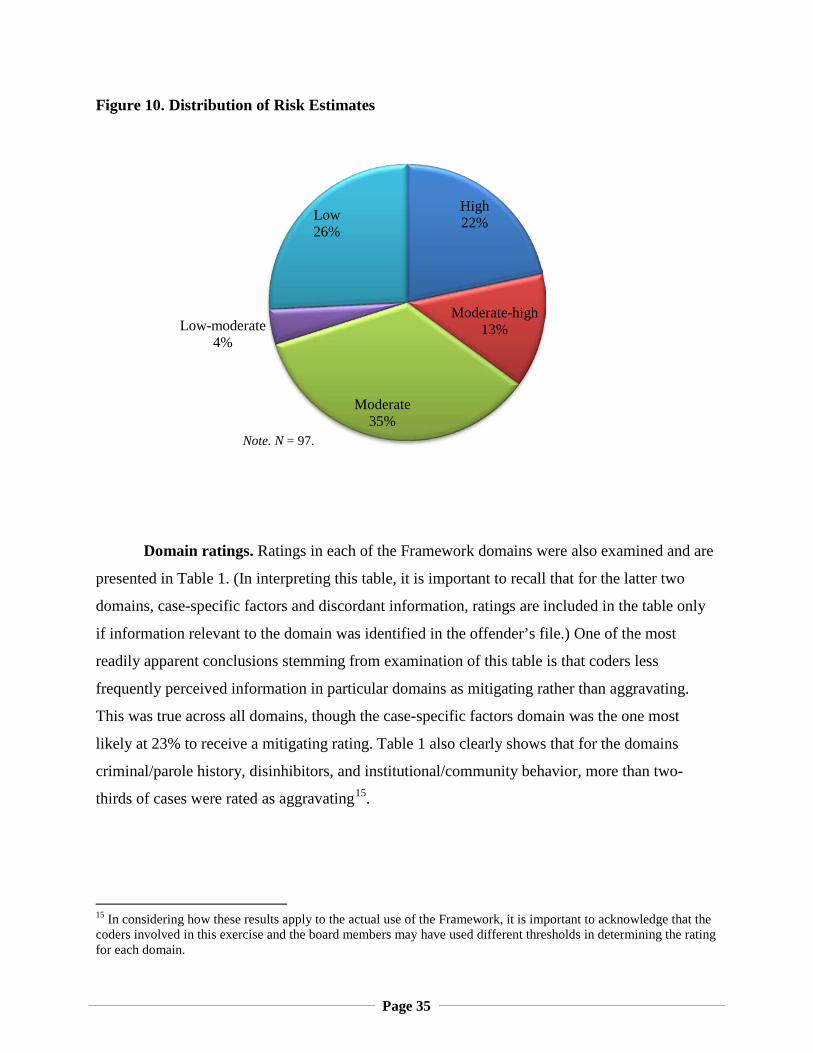
Coders were asked to identify which risk assessment estimate should be considered
highest priority for the given individual; this is the estimate that was to act as anchor in
considering that individual. Given the estimates derived from different instruments, various
terms were used to describe the obtained estimates. Figure 2 represents the distribution of these
ratings. As shown, risk estimates were almost equally divided into moderate-high or high (35%),
moderate (35%), and low or low-moderate (30%). In interpreting this pattern, however, it is
important to acknowledge that the LSI-R, the most commonly used risk instrument, may
underestimate risk. It is based in large part on behavioral indicators that are less likely to be
present while incarcerated, so the administration of this measure may result in low scores
reflective of limited opportunity rather than low risk.
3 34 14 37 8 4
0% 20% 40% 60% 80% 100%
Num
ber o
f ris
k a
sses
smen
ts
012345
Note. Excluding those with no risk assessments (3%; denoted in blue), adjacent categories can be summed to show the total number of offenders having at least a certain number of risk assessments. For instance, while 34% have exactly one risk assessment, 97% (34% + 14% + 37% + 8% + 4%) have at least one assessment. Similarly, 37% have three risk assessments, but 49% (37% + 8% + 4%) have at least three.
Page 35
Figure 10. Distribution of Risk Estimates
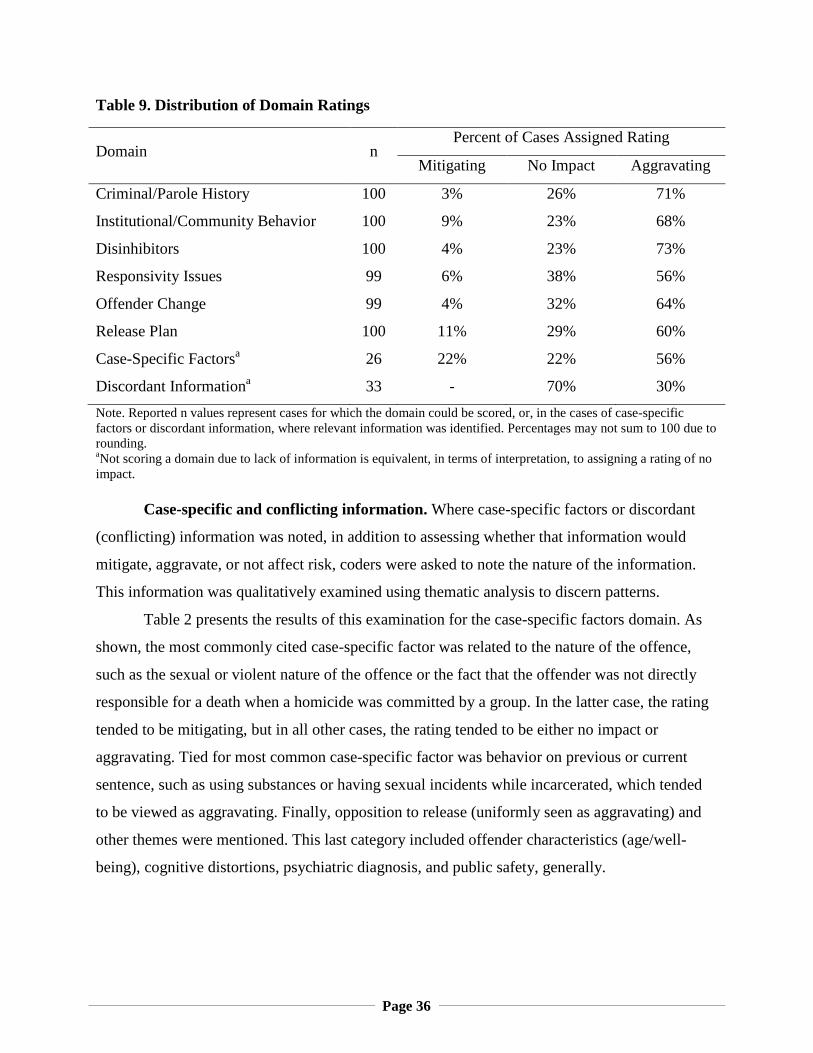
Domain ratings. Ratings in each of the Framework domains were also examined and are
presented in Table 1. (In interpreting this table, it is important to recall that for the latter two
domains, case-specific factors and discordant information, ratings are included in the table only
if information relevant to the domain was identified in the offender’s file.) One of the most
readily apparent conclusions stemming from examination of this table is that coders less
frequently perceived information in particular domains as mitigating rather than aggravating.
This was true across all domains, though the case-specific factors domain was the one most
likely at 23% to receive a mitigating rating. Table 1 also clearly shows that for the domains
criminal/parole history, disinhibitors, and institutional/community behavior, more than two-
thirds of cases were rated as aggravating15.
15 In considering how these results apply to the actual use of the Framework, it is important to acknowledge that the coders involved in this exercise and the board members may have used different thresholds in determining the rating for each domain.
High 22%
Moderate-high 13%
Moderate 35%
Low-moderate 4%
Low 26%
Note. N = 97.
Page 36
Table 9. Distribution of Domain Ratings
Domain n Percent of Cases Assigned Rating
Mitigating No Impact Aggravating
Criminal/Parole History 100 3% 26% 71%
Institutional/Community Behavior 100 9% 23% 68%
Disinhibitors 100 4% 23% 73%
Responsivity Issues 99 6% 38% 56%
Offender Change 99 4% 32% 64%
Release Plan 100 11% 29% 60%
Case-Specific Factorsa 26 22% 22% 56%
Discordant Informationa 33 - 70% 30% Note. Reported n values represent cases for which the domain could be scored, or, in the cases of case-specific factors or discordant information, where relevant information was identified. Percentages may not sum to 100 due to rounding. aNot scoring a domain due to lack of information is equivalent, in terms of interpretation, to assigning a rating of no impact. Case-specific and conflicting information. Where case-specific factors or discordant
(conflicting) information was noted, in addition to assessing whether that information would
mitigate, aggravate, or not affect risk, coders were asked to note the nature of the information.
This information was qualitatively examined using thematic analysis to discern patterns.
Table 2 presents the results of this examination for the case-specific factors domain. As
shown, the most commonly cited case-specific factor was related to the nature of the offence,
such as the sexual or violent nature of the offence or the fact that the offender was not directly
responsible for a death when a homicide was committed by a group. In the latter case, the rating
tended to be mitigating, but in all other cases, the rating tended to be either no impact or
aggravating. Tied for most common case-specific factor was behavior on previous or current
sentence, such as using substances or having sexual incidents while incarcerated, which tended
to be viewed as aggravating. Finally, opposition to release (uniformly seen as aggravating) and
other themes were mentioned. This last category included offender characteristics (age/well-
being), cognitive distortions, psychiatric diagnosis, and public safety, generally.
Page 37
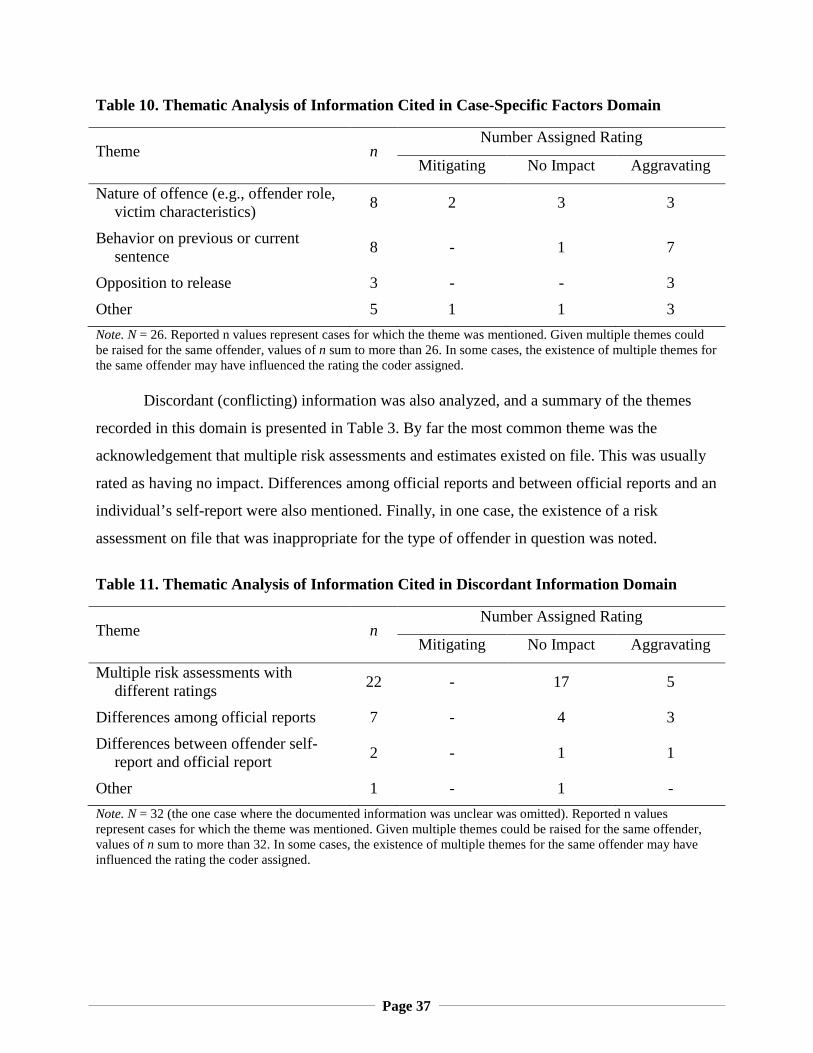
Table 10. Thematic Analysis of Information Cited in Case-Specific Factors Domain
Theme n Number Assigned Rating
Mitigating No Impact Aggravating
Nature of offence (e.g., offender role, victim characteristics) 8 2 3 3
Behavior on previous or current sentence 8 - 1 7
Opposition to release 3 - - 3
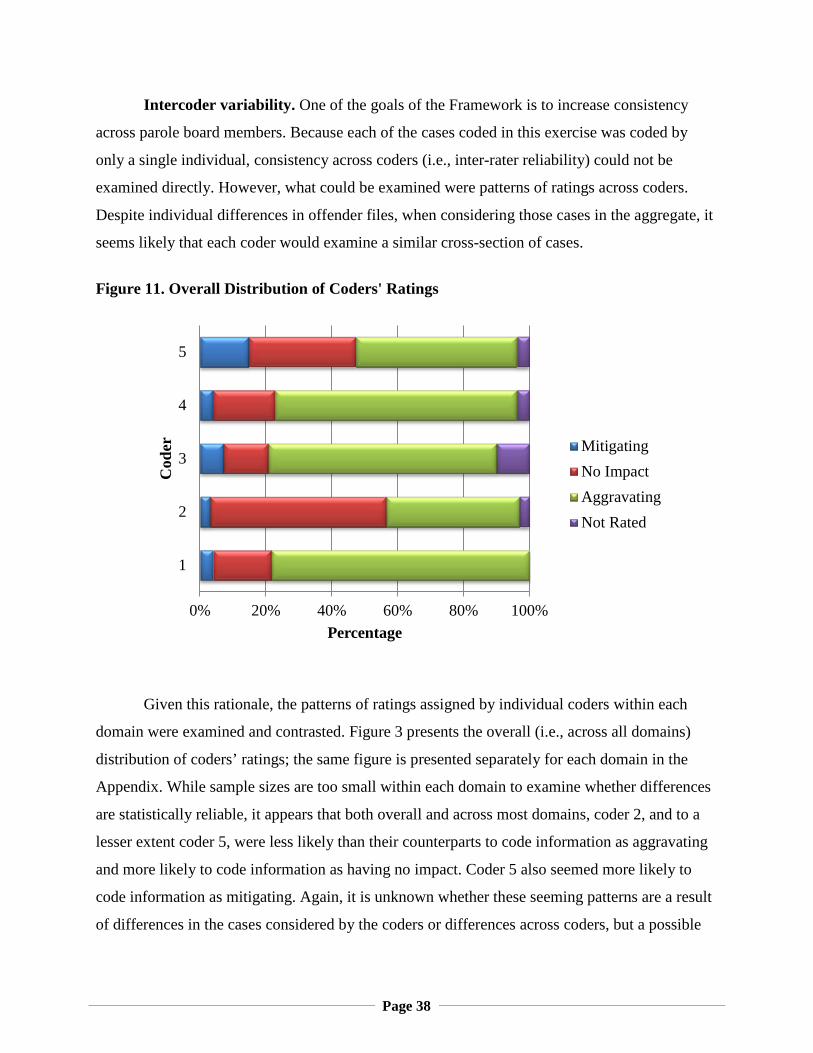
Other 5 1 1 3 Note. N = 26. Reported n values represent cases for which the theme was mentioned. Given multiple themes could be raised for the same offender, values of n sum to more than 26. In some cases, the existence of multiple themes for the same offender may have influenced the rating the coder assigned. Discordant (conflicting) information was also analyzed, and a summary of the themes
recorded in this domain is presented in Table 3. By far the most common theme was the
acknowledgement that multiple risk assessments and estimates existed on file. This was usually
rated as having no impact. Differences among official reports and between official reports and an
individual’s self-report were also mentioned. Finally, in one case, the existence of a risk
assessment on file that was inappropriate for the type of offender in question was noted.
Table 11. Thematic Analysis of Information Cited in Discordant Information Domain
Theme n Number Assigned Rating
Mitigating No Impact Aggravating
Multiple risk assessments with different ratings 22 - 17 5
Differences among official reports 7 - 4 3
Differences between offender self-report and official report 2 - 1 1
Other 1 - 1 - Note. N = 32 (the one case where the documented information was unclear was omitted). Reported n values represent cases for which the theme was mentioned. Given multiple themes could be raised for the same offender, values of n sum to more than 32. In some cases, the existence of multiple themes for the same offender may have influenced the rating the coder assigned.
Page 38
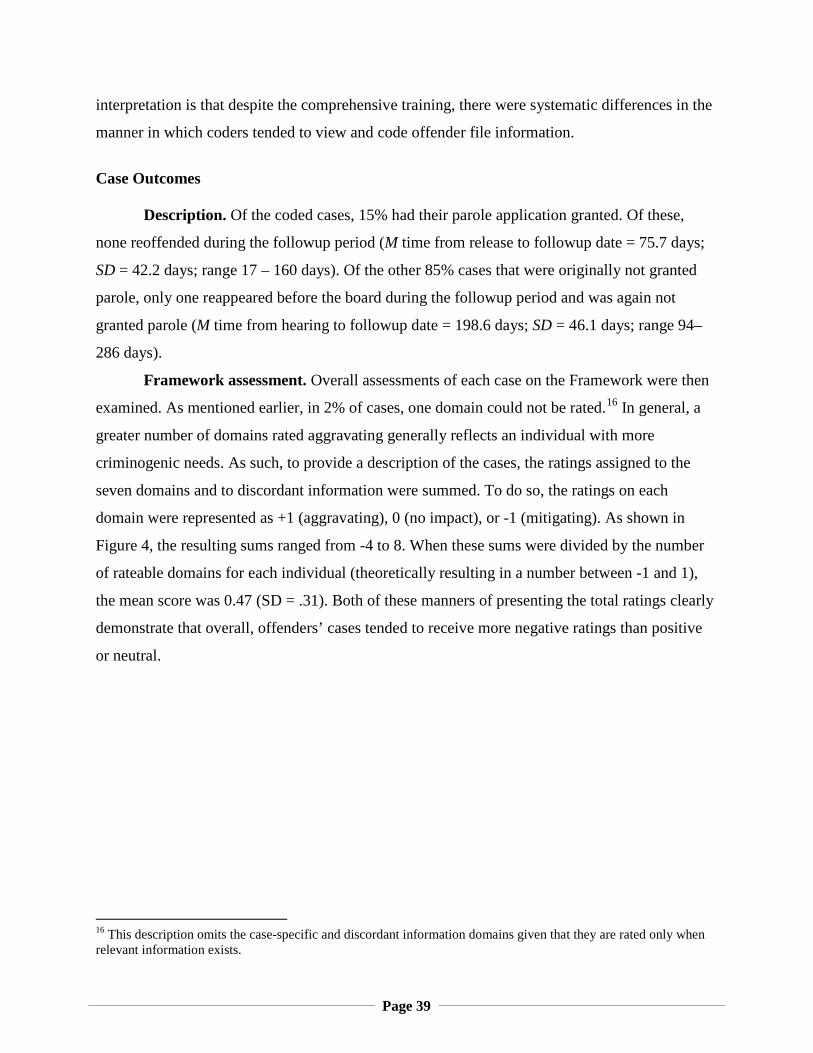
Intercoder variability. One of the goals of the Framework is to increase consistency
across parole board members. Because each of the cases coded in this exercise was coded by
only a single individual, consistency across coders (i.e., inter-rater reliability) could not be
examined directly. However, what could be examined were patterns of ratings across coders.
Despite individual differences in offender files, when considering those cases in the aggregate, it
seems likely that each coder would examine a similar cross-section of cases.
Figure 11. Overall Distribution of Coders' Ratings
Given this rationale, the patterns of ratings assigned by individual coders within each
domain were examined and contrasted. Figure 3 presents the overall (i.e., across all domains)
distribution of coders’ ratings; the same figure is presented separately for each domain in the
Appendix. While sample sizes are too small within each domain to examine whether differences
are statistically reliable, it appears that both overall and across most domains, coder 2, and to a
lesser extent coder 5, were less likely than their counterparts to code information as aggravating
and more likely to code information as having no impact. Coder 5 also seemed more likely to
code information as mitigating. Again, it is unknown whether these seeming patterns are a result
of differences in the cases considered by the coders or differences across coders, but a possible
0% 20% 40% 60% 80% 100%
1
2
3
4
5
Percentage
Cod
er
MitigatingNo ImpactAggravatingNot Rated
Page 39
interpretation is that despite the comprehensive training, there were systematic differences in the
manner in which coders tended to view and code offender file information.
Case Outcomes Description. Of the coded cases, 15% had their parole application granted. Of these,
none reoffended during the followup period (M time from release to followup date = 75.7 days;
SD = 42.2 days; range 17 – 160 days). Of the other 85% cases that were originally not granted
parole, only one reappeared before the board during the followup period and was again not
granted parole (M time from hearing to followup date = 198.6 days; SD = 46.1 days; range 94–
286 days).
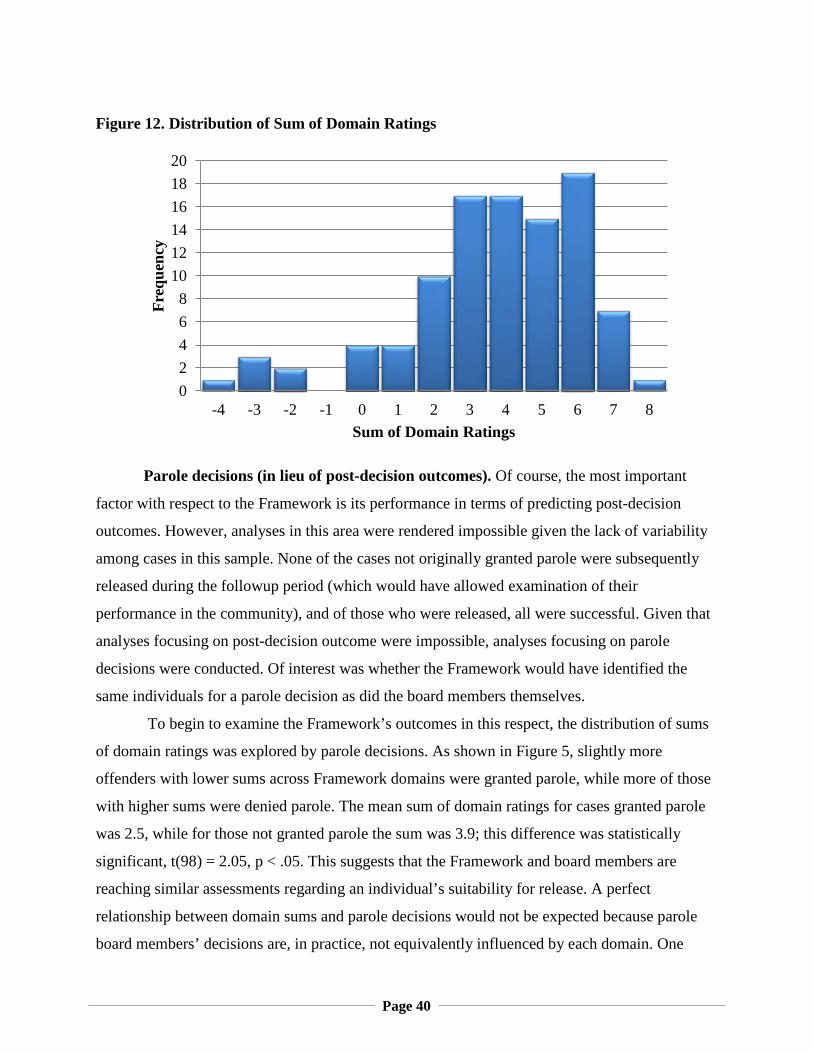
Framework assessment. Overall assessments of each case on the Framework were then
examined. As mentioned earlier, in 2% of cases, one domain could not be rated.16 In general, a
greater number of domains rated aggravating generally reflects an individual with more
criminogenic needs. As such, to provide a description of the cases, the ratings assigned to the
seven domains and to discordant information were summed. To do so, the ratings on each
domain were represented as +1 (aggravating), 0 (no impact), or -1 (mitigating). As shown in
Figure 4, the resulting sums ranged from -4 to 8. When these sums were divided by the number
of rateable domains for each individual (theoretically resulting in a number between -1 and 1),
the mean score was 0.47 (SD = .31). Both of these manners of presenting the total ratings clearly
demonstrate that overall, offenders’ cases tended to receive more negative ratings than positive
or neutral.
16 This description omits the case-specific and discordant information domains given that they are rated only when relevant information exists.
Page 40
Figure 12. Distribution of Sum of Domain Ratings
Parole decisions (in lieu of post-decision outcomes). Of course, the most important
factor with respect to the Framework is its performance in terms of predicting post-decision
outcomes. However, analyses in this area were rendered impossible given the lack of variability
among cases in this sample. None of the cases not originally granted parole were subsequently
released during the followup period (which would have allowed examination of their
performance in the community), and of those who were released, all were successful. Given that
analyses focusing on post-decision outcome were impossible, analyses focusing on parole
decisions were conducted. Of interest was whether the Framework would have identified the
same individuals for a parole decision as did the board members themselves.
To begin to examine the Framework’s outcomes in this respect, the distribution of sums
of domain ratings was explored by parole decisions. As shown in Figure 5, slightly more
offenders with lower sums across Framework domains were granted parole, while more of those
with higher sums were denied parole. The mean sum of domain ratings for cases granted parole
was 2.5, while for those not granted parole the sum was 3.9; this difference was statistically
significant, t(98) = 2.05, p < .05. This suggests that the Framework and board members are
reaching similar assessments regarding an individual’s suitability for release. A perfect
relationship between domain sums and parole decisions would not be expected because parole
board members’ decisions are, in practice, not equivalently influenced by each domain. One
02468
101214161820
-4 -3 -2 -1 0 1 2 3 4 5 6 7 8
Freq
uenc
y
Sum of Domain Ratings
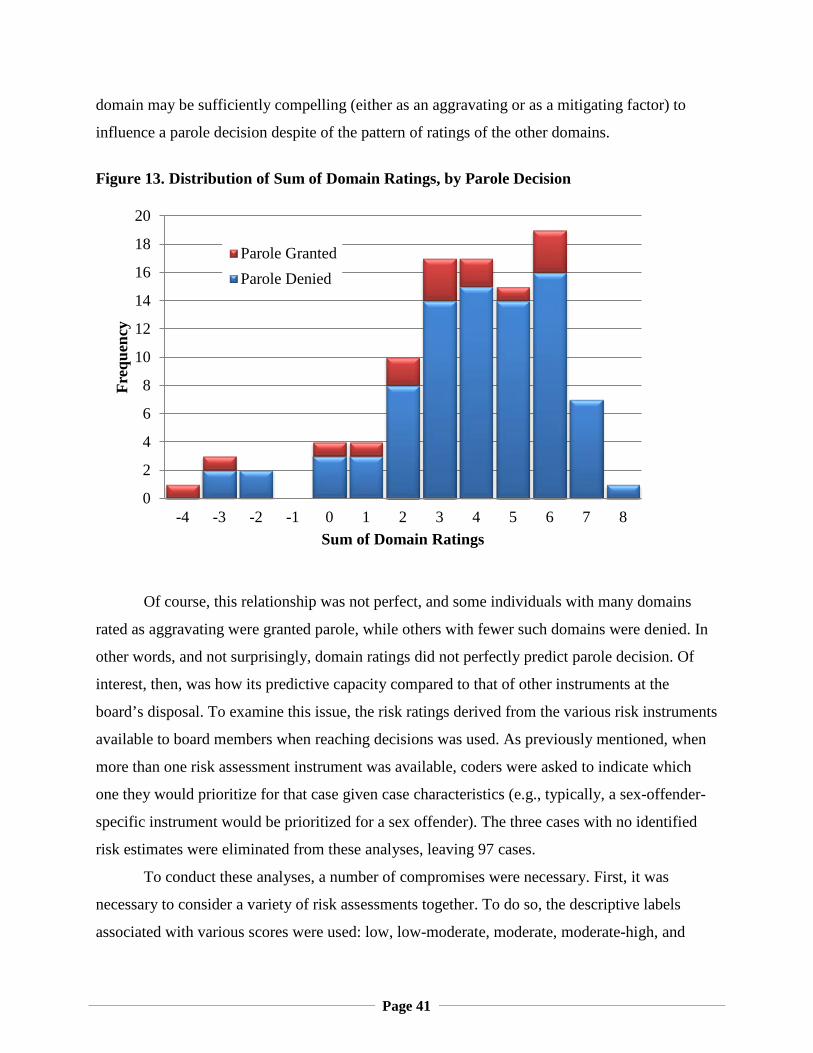
Page 41
domain may be sufficiently compelling (either as an aggravating or as a mitigating factor) to
influence a parole decision despite of the pattern of ratings of the other domains.
Figure 13. Distribution of Sum of Domain Ratings, by Parole Decision
Of course, this relationship was not perfect, and some individuals with many domains
rated as aggravating were granted parole, while others with fewer such domains were denied. In
other words, and not surprisingly, domain ratings did not perfectly predict parole decision. Of
interest, then, was how its predictive capacity compared to that of other instruments at the
board’s disposal. To examine this issue, the risk ratings derived from the various risk instruments
available to board members when reaching decisions was used. As previously mentioned, when
more than one risk assessment instrument was available, coders were asked to indicate which
one they would prioritize for that case given case characteristics (e.g., typically, a sex-offender-
specific instrument would be prioritized for a sex offender). The three cases with no identified
risk estimates were eliminated from these analyses, leaving 97 cases.
To conduct these analyses, a number of compromises were necessary. First, it was
necessary to consider a variety of risk assessments together. To do so, the descriptive labels
associated with various scores were used: low, low-moderate, moderate, moderate-high, and
0
2
4
6
8
10
12
14
16
18
20
-4 -3 -2 -1 0 1 2 3 4 5 6 7 8
Freq
uenc
y
Sum of Domain Ratings
Parole GrantedParole Denied
Page 42
high. These were provided a rank-ordered score from 1 to 5, and these rank-ordered scores were
used in analyses. This approach, however, was necessarily inexact because each original risk
instrument aims to measure different outcomes, uses different followup periods, and uses
different language. This was further complicated by the fact that limitations of the data (i.e., lack
of post-decision outcome variability) meant that analyses had to be focused on the parole
decision, which is not what the instruments were developed to measure.
Second, the Framework is not intended to be used rigidly—that is, it is intended to be
used as an aide rather than to produce a specific score. However, for the purposes of a validation
exercise, it was necessary to do so. In other words, it was necessary to create a Framework-
informed “risk rating” and compare it to the previously described ranked risk category, which
was based on results that informed actual parole decisions. A very simplistic approach was used
to do so. The simplicity of this approach, together with the compromises outlined above, are
acknowledged as limitations to any conclusions drawn from this report, but given that the
purpose of this exercise was to provide only a very preliminary validation, they were considered,
at the least, illustrative.
Specifically, a summation approach was used. Scores on the Framework domains and the
new ranked risk category were both considered. The domain sums calculated previously were
added to the risk category (ranging from 1 to 5), but to represent the primacy of the actuarial
estimate of risk, this score was first multiplied by 3.17 This approach resulted in total scores
ranging from 0 to 22. Overall, these computations resulted in three possible predictors of
decision:
1. The new ranked risk category
2. The sum of the domains only
3. The summed risk category and domains rating
The possible predictors were compared in terms of their ability to predict the decisional
outcome of the parole hearing. Comparisons were conducted using the Receiver Operating
Characteristic (ROC) Area Under the Curve (AUC). An AUC is essentially an estimate of the
likelihood that a random case with the outcome of interest (granted parole) will have a higher
17 This multiplier was chosen given that the guidelines for Framework completion suggest that the domain scores should reflect approximately one risk category.
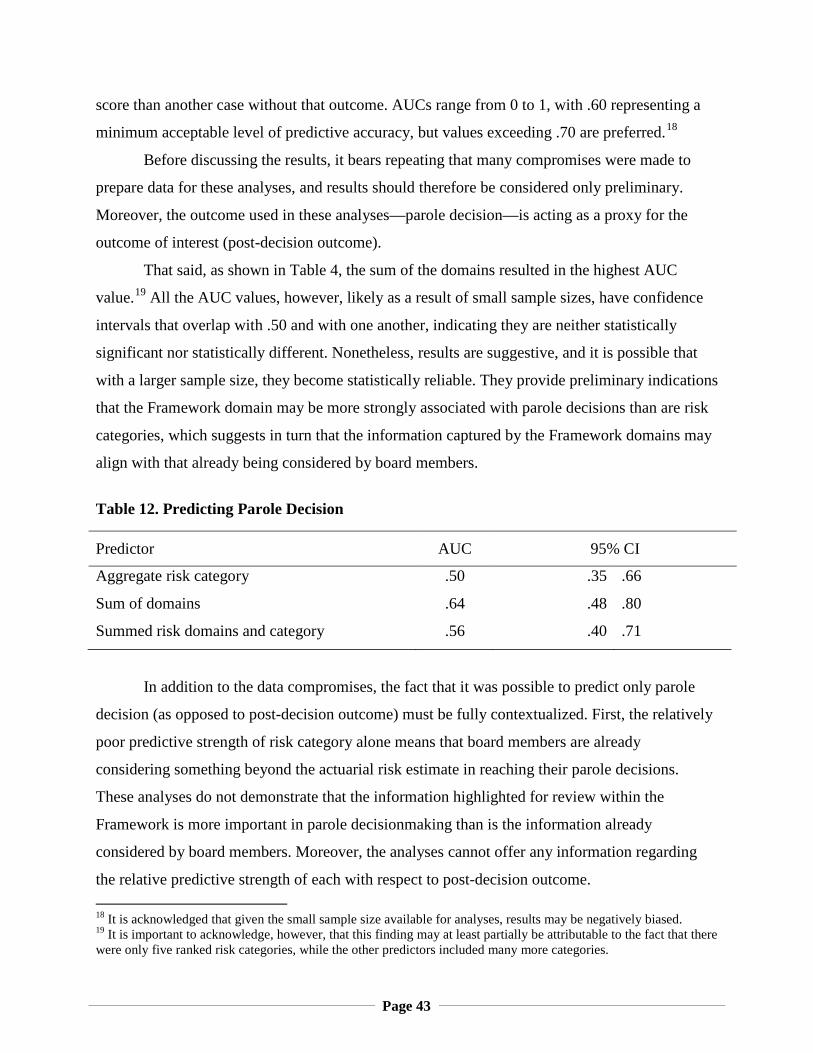
Page 43
score than another case without that outcome. AUCs range from 0 to 1, with .60 representing a
minimum acceptable level of predictive accuracy, but values exceeding .70 are preferred.18
Before discussing the results, it bears repeating that many compromises were made to
prepare data for these analyses, and results should therefore be considered only preliminary.
Moreover, the outcome used in these analyses—parole decision—is acting as a proxy for the
outcome of interest (post-decision outcome).
That said, as shown in Table 4, the sum of the domains resulted in the highest AUC
value.19 All the AUC values, however, likely as a result of small sample sizes, have confidence
intervals that overlap with .50 and with one another, indicating they are neither statistically
significant nor statistically different. Nonetheless, results are suggestive, and it is possible that
with a larger sample size, they become statistically reliable. They provide preliminary indications
that the Framework domain may be more strongly associated with parole decisions than are risk
categories, which suggests in turn that the information captured by the Framework domains may
align with that already being considered by board members.
Table 12. Predicting Parole Decision
Predictor AUC 95% CI
Aggregate risk category .50 .35 .66
Sum of domains .64 .48 .80
Summed risk domains and category .56 .40 .71
In addition to the data compromises, the fact that it was possible to predict only parole
decision (as opposed to post-decision outcome) must be fully contextualized. First, the relatively
poor predictive strength of risk category alone means that board members are already
considering something beyond the actuarial risk estimate in reaching their parole decisions.
These analyses do not demonstrate that the information highlighted for review within the
Framework is more important in parole decisionmaking than is the information already
considered by board members. Moreover, the analyses cannot offer any information regarding
the relative predictive strength of each with respect to post-decision outcome. 18 It is acknowledged that given the small sample size available for analyses, results may be negatively biased. 19 It is important to acknowledge, however, that this finding may at least partially be attributable to the fact that there were only five ranked risk categories, while the other predictors included many more categories.
Page 44
Implications and Conclusion Examination of the exploratory retrospective application of the Structured
Decisionmaking Framework to a sample of approximately 100 offender cases in each of three
states (Ohio, Connecticut, and Kansas) revealed interesting patterns both with respect to the
completion of the Framework itself and to its overall results as compared to actual post-release
outcomes. With respect to the Framework, a number of findings are noted:
1. Though the authors intend that the Framework be completed according to each board
member’s expertise, personal experience, and knowledge, there were some items noted
under the case-specific factors domain that we believe should not have been completed,
or should have been completed in a different manner. Several items (e.g., behavior on this
or a previous sentence) could and should more appropriately have been captured in other
Framework domains. It is also noted that in some cases, the nature of the offence itself
was cited as an aggravating case-specific factor. Each board will approach this issue
differently, but it bears noting that the nature of the offence was already considered in
sentencing decisions and should perhaps not be considered again during a parole hearing.
For some boards, some items were rated inconsistently, such as the existence of victim
and/or prosecutor opposition. Though the appropriate role of victim and/or prosecutor
opposition and support in parole decisionmaking is still under debate, without weighing
in on whether and how this input should be considered, in many cases, it seems likely that
it should at least be considered consistently—that is, either always as aggravating or
always as no impact.
2. Inter-coder variability was also noted. When the Framework is applied in practice, board
members are expected to vary as a result of their backgrounds, experience, knowledge,
and beliefs. However, an effort was made to obtain consistency among coders for the
purposes of this validation exercise, and this did not appear to be wholly successful.
Though it would be inappropriate to draw conclusions with respect to board members’
use of the Framework based on this exercise, it would not be surprising if there is some overlap
among coders’ and board members’ understanding of the Framework, given the training was
delivered by the same authors. If this is the case, the above-noted findings highlight that there
may be benefit in periodic ongoing training in the use of the Framework to ensure an accurate
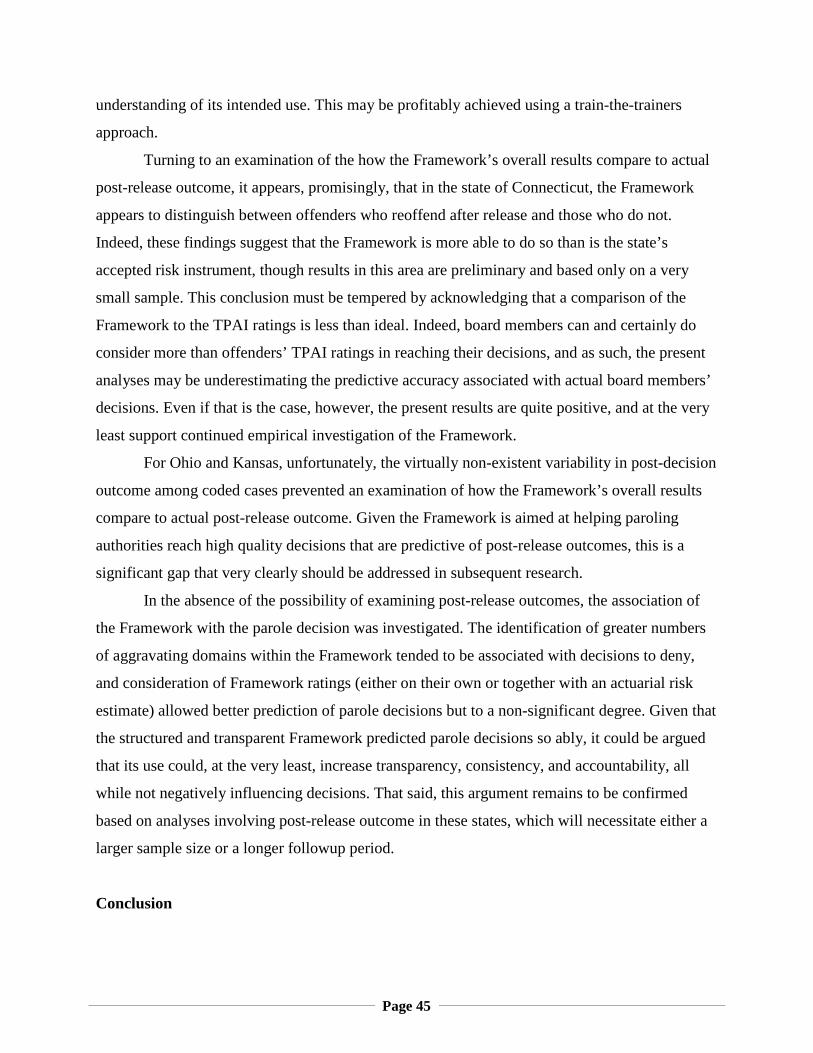
Page 45
understanding of its intended use. This may be profitably achieved using a train-the-trainers
approach.
Turning to an examination of the how the Framework’s overall results compare to actual
post-release outcome, it appears, promisingly, that in the state of Connecticut, the Framework
appears to distinguish between offenders who reoffend after release and those who do not.
Indeed, these findings suggest that the Framework is more able to do so than is the state’s
accepted risk instrument, though results in this area are preliminary and based only on a very
small sample. This conclusion must be tempered by acknowledging that a comparison of the
Framework to the TPAI ratings is less than ideal. Indeed, board members can and certainly do
consider more than offenders’ TPAI ratings in reaching their decisions, and as such, the present
analyses may be underestimating the predictive accuracy associated with actual board members’
decisions. Even if that is the case, however, the present results are quite positive, and at the very
least support continued empirical investigation of the Framework.
For Ohio and Kansas, unfortunately, the virtually non-existent variability in post-decision
outcome among coded cases prevented an examination of how the Framework’s overall results
compare to actual post-release outcome. Given the Framework is aimed at helping paroling
authorities reach high quality decisions that are predictive of post-release outcomes, this is a
significant gap that very clearly should be addressed in subsequent research.
In the absence of the possibility of examining post-release outcomes, the association of
the Framework with the parole decision was investigated. The identification of greater numbers
of aggravating domains within the Framework tended to be associated with decisions to deny,
and consideration of Framework ratings (either on their own or together with an actuarial risk
estimate) allowed better prediction of parole decisions but to a non-significant degree. Given that
the structured and transparent Framework predicted parole decisions so ably, it could be argued
that its use could, at the very least, increase transparency, consistency, and accountability, all
while not negatively influencing decisions. That said, this argument remains to be confirmed
based on analyses involving post-release outcome in these states, which will necessitate either a
larger sample size or a longer followup period.
Conclusion
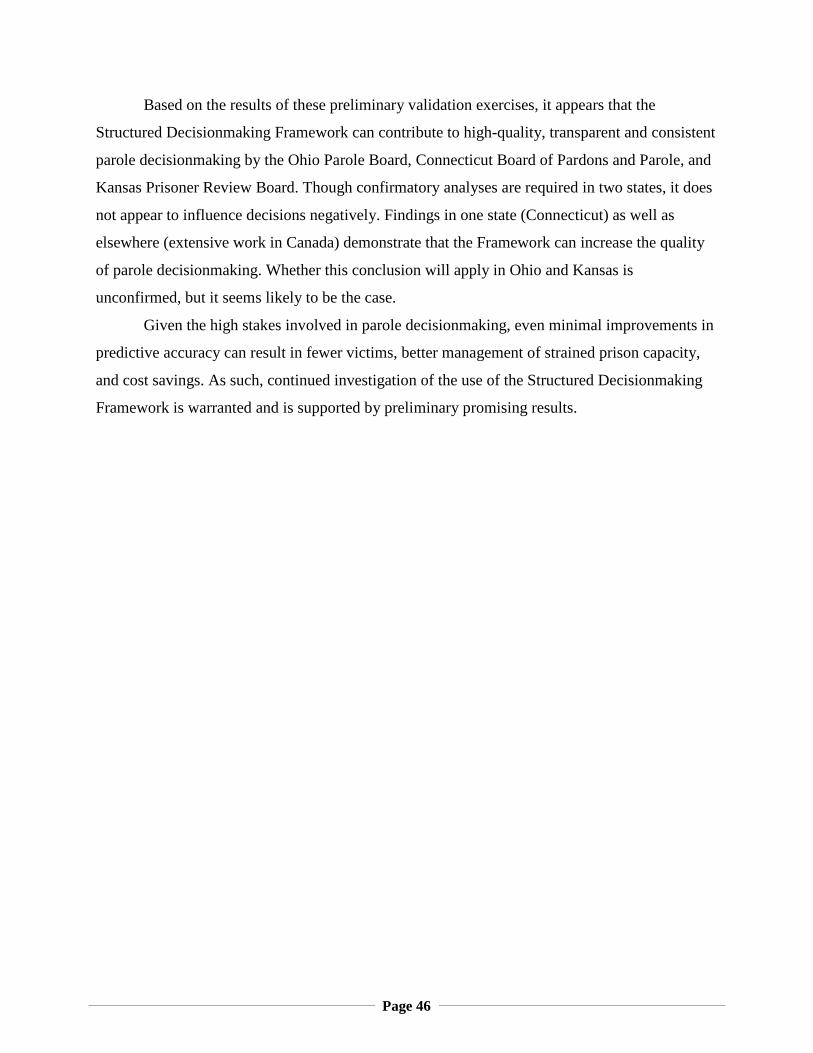
Page 46
Based on the results of these preliminary validation exercises, it appears that the
Structured Decisionmaking Framework can contribute to high-quality, transparent and consistent
parole decisionmaking by the Ohio Parole Board, Connecticut Board of Pardons and Parole, and
Kansas Prisoner Review Board. Though confirmatory analyses are required in two states, it does
not appear to influence decisions negatively. Findings in one state (Connecticut) as well as
elsewhere (extensive work in Canada) demonstrate that the Framework can increase the quality
of parole decisionmaking. Whether this conclusion will apply in Ohio and Kansas is
unconfirmed, but it seems likely to be the case.
Given the high stakes involved in parole decisionmaking, even minimal improvements in
predictive accuracy can result in fewer victims, better management of strained prison capacity,
and cost savings. As such, continued investigation of the use of the Structured Decisionmaking
Framework is warranted and is supported by preliminary promising results.
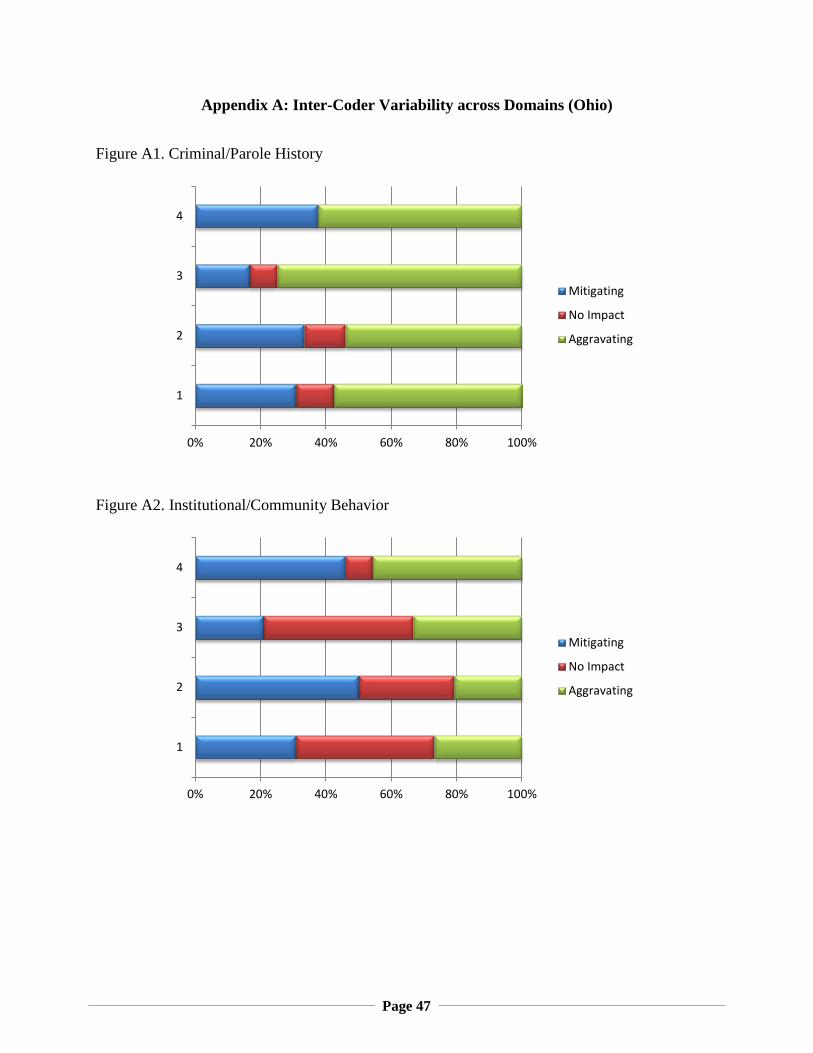
Page 47
Appendix A: Inter-Coder Variability across Domains (Ohio)
Figure A1. Criminal/Parole History
Figure A2. Institutional/Community Behavior
0% 20% 40% 60% 80% 100%
1
2
3
4
Mitigating
No Impact
Aggravating
0% 20% 40% 60% 80% 100%
1
2
3
4
Mitigating
No Impact
Aggravating
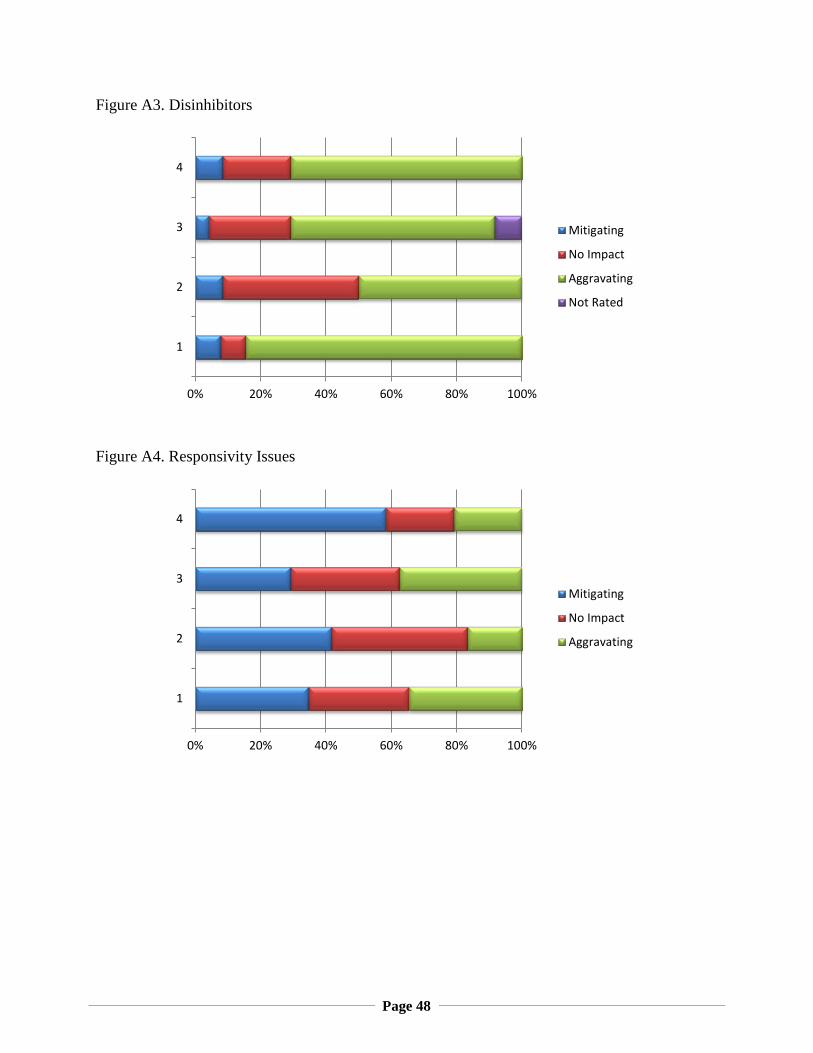
Page 48
Figure A3. Disinhibitors
Figure A4. Responsivity Issues
0% 20% 40% 60% 80% 100%
1
2
3
4
Mitigating
No Impact
Aggravating
Not Rated
0% 20% 40% 60% 80% 100%
1
2
3
4
Mitigating
No Impact
Aggravating
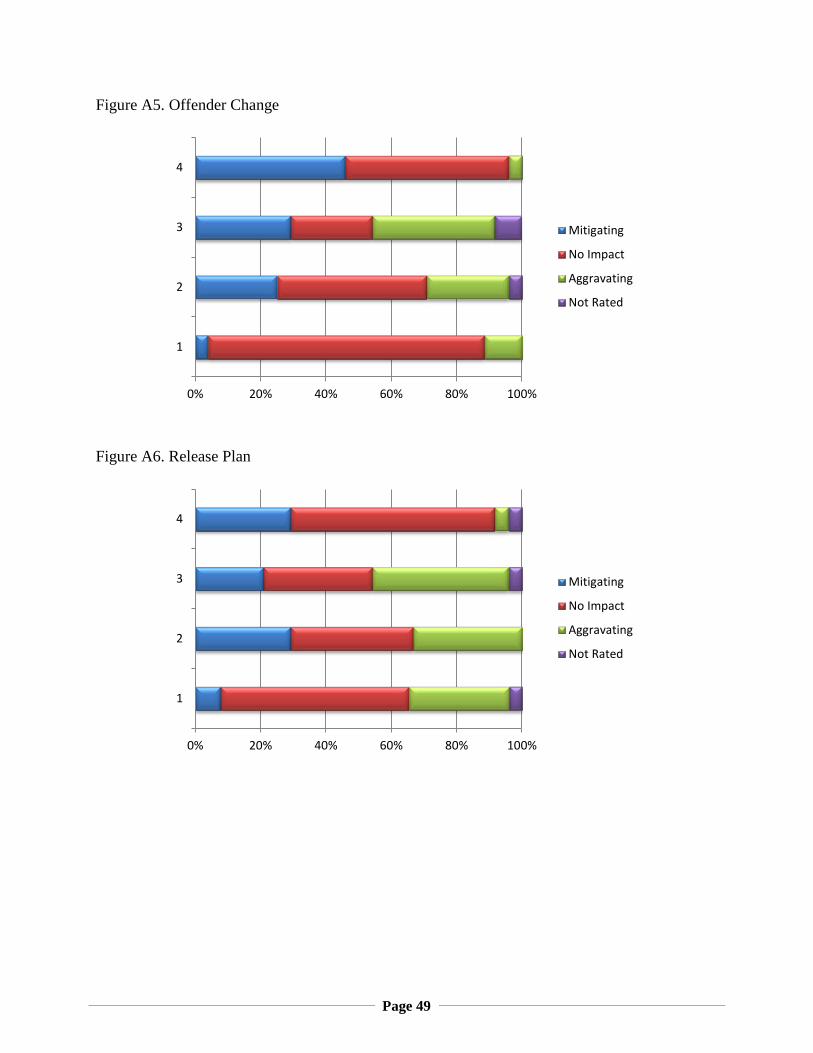
Page 49
Figure A5. Offender Change
Figure A6. Release Plan
0% 20% 40% 60% 80% 100%
1
2
3
4
Mitigating
No Impact
Aggravating
Not Rated
0% 20% 40% 60% 80% 100%
1
2
3
4
Mitigating
No Impact
Aggravating
Not Rated
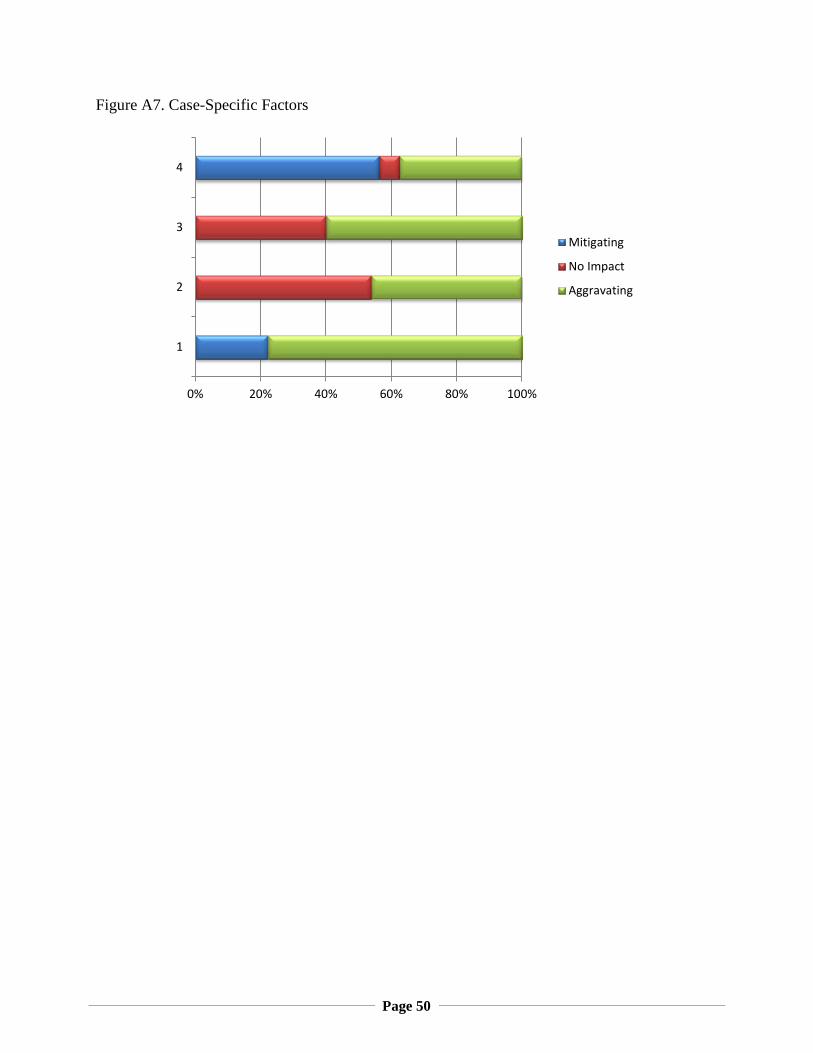
Page 50
Figure A7. Case-Specific Factors
0% 20% 40% 60% 80% 100%
1
2
3
4
Mitigating
No Impact
Aggravating
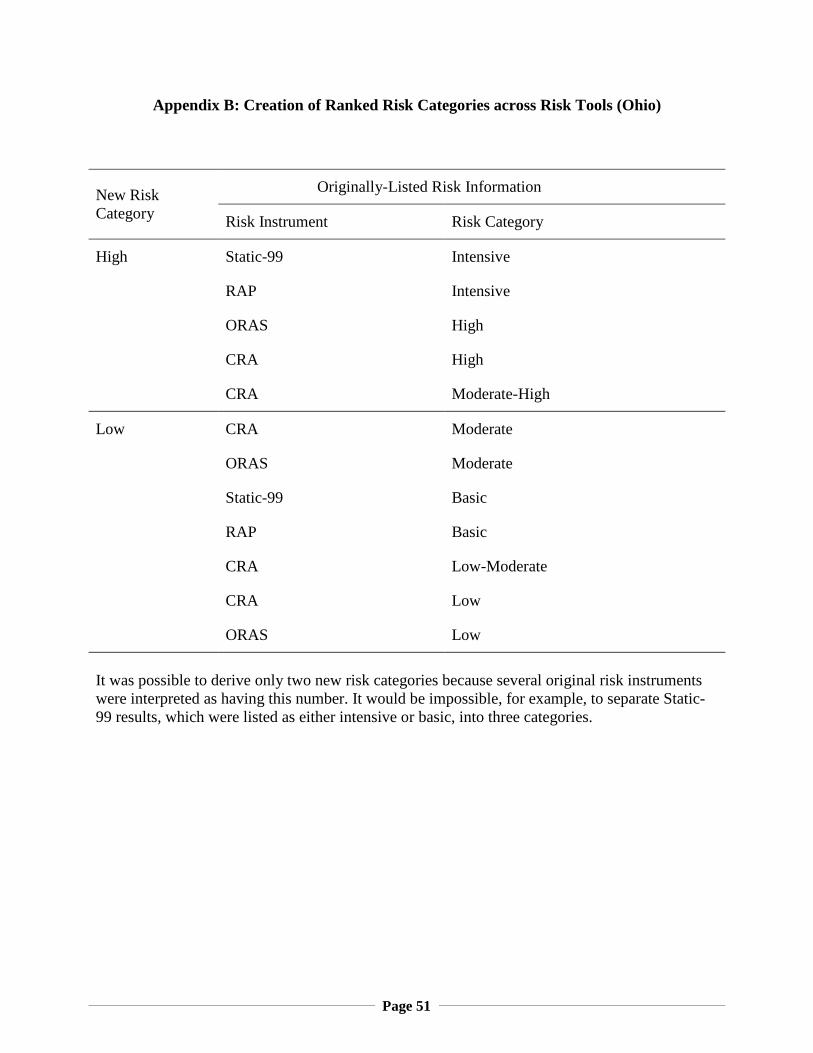
Page 51
Appendix B: Creation of Ranked Risk Categories across Risk Tools (Ohio)
New Risk Category
Originally-Listed Risk Information
Risk Instrument Risk Category
High Static-99 Intensive
RAP Intensive
ORAS High
CRA High
CRA Moderate-High
Low CRA Moderate
ORAS Moderate
Static-99 Basic
RAP Basic
CRA Low-Moderate
CRA Low
ORAS Low
It was possible to derive only two new risk categories because several original risk instruments were interpreted as having this number. It would be impossible, for example, to separate Static-99 results, which were listed as either intensive or basic, into three categories.
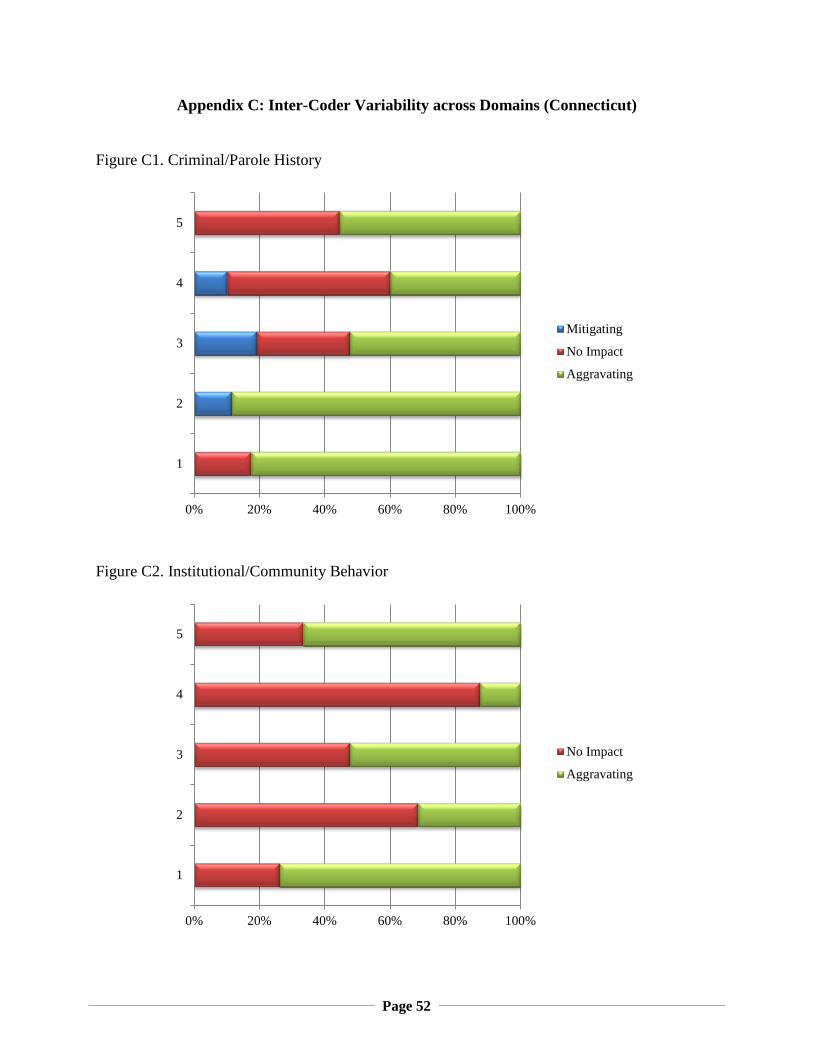
Page 52
Appendix C: Inter-Coder Variability across Domains (Connecticut)
Figure C1. Criminal/Parole History
Figure C2. Institutional/Community Behavior
0% 20% 40% 60% 80% 100%
1
2
3
4
5
Mitigating
No Impact
Aggravating
0% 20% 40% 60% 80% 100%
1
2
3
4
5
No Impact
Aggravating
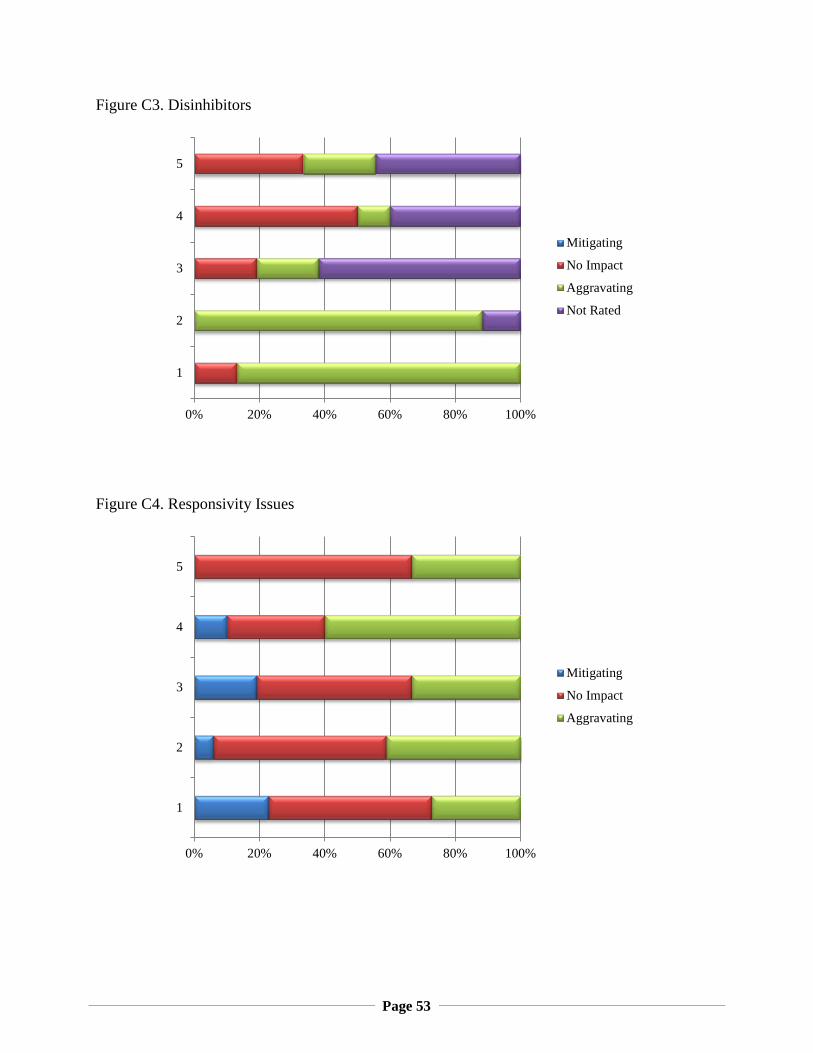
Page 53
Figure C3. Disinhibitors
Figure C4. Responsivity Issues
0% 20% 40% 60% 80% 100%
1
2
3
4
5
Mitigating
No Impact
Aggravating
Not Rated
0% 20% 40% 60% 80% 100%
1
2
3
4
5
Mitigating
No Impact
Aggravating
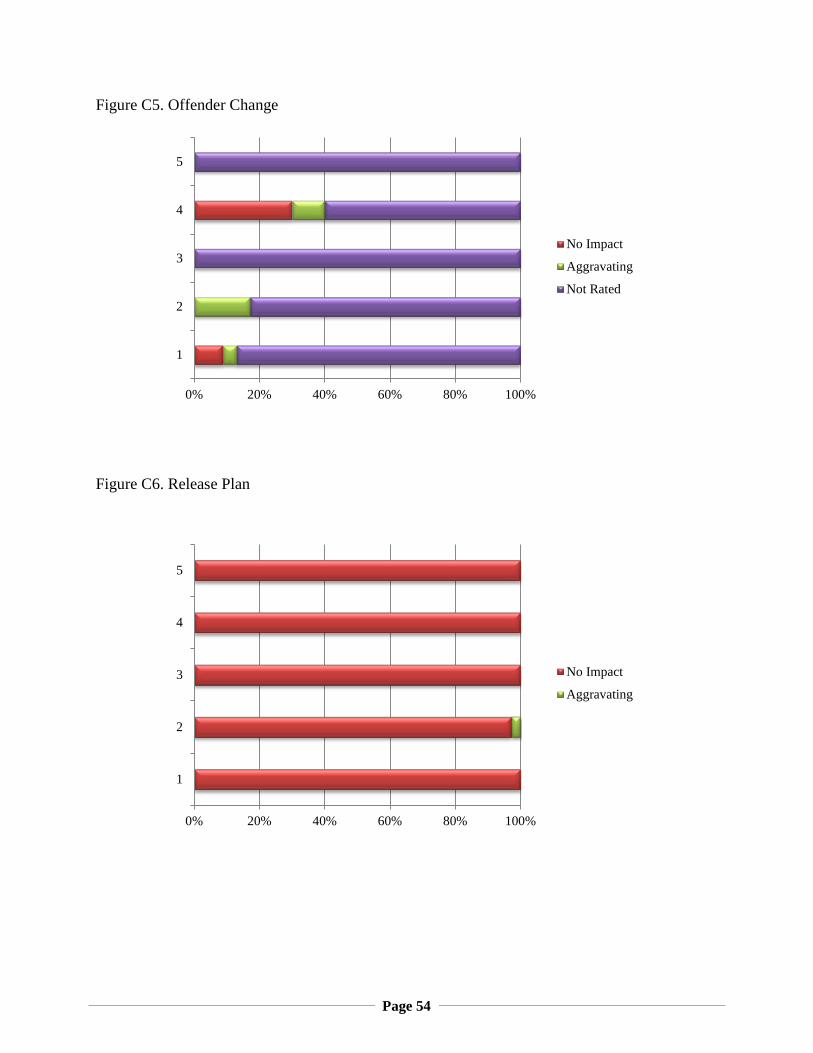
Page 54
Figure C5. Offender Change
Figure C6. Release Plan
0% 20% 40% 60% 80% 100%
1
2
3
4
5
No Impact
Aggravating
Not Rated
0% 20% 40% 60% 80% 100%
1
2
3
4
5
No Impact
Aggravating
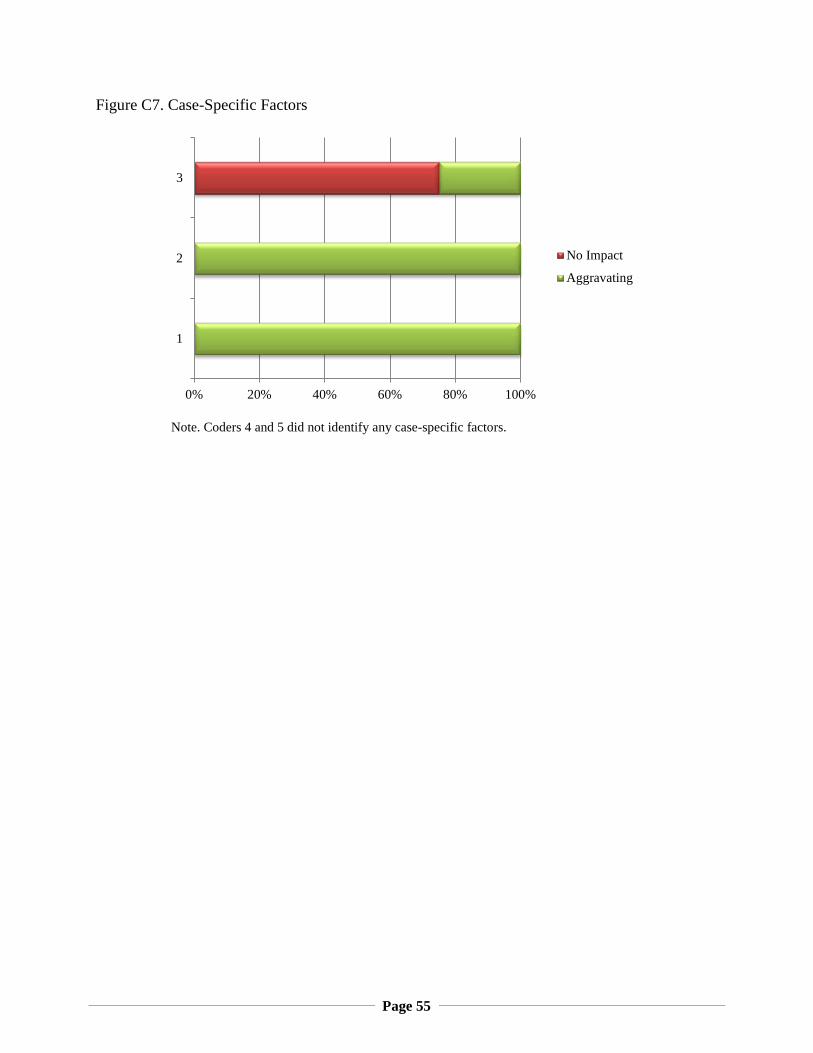
Page 55
Figure C7. Case-Specific Factors
Note. Coders 4 and 5 did not identify any case-specific factors.
0% 20% 40% 60% 80% 100%
1
2
3
No Impact
Aggravating
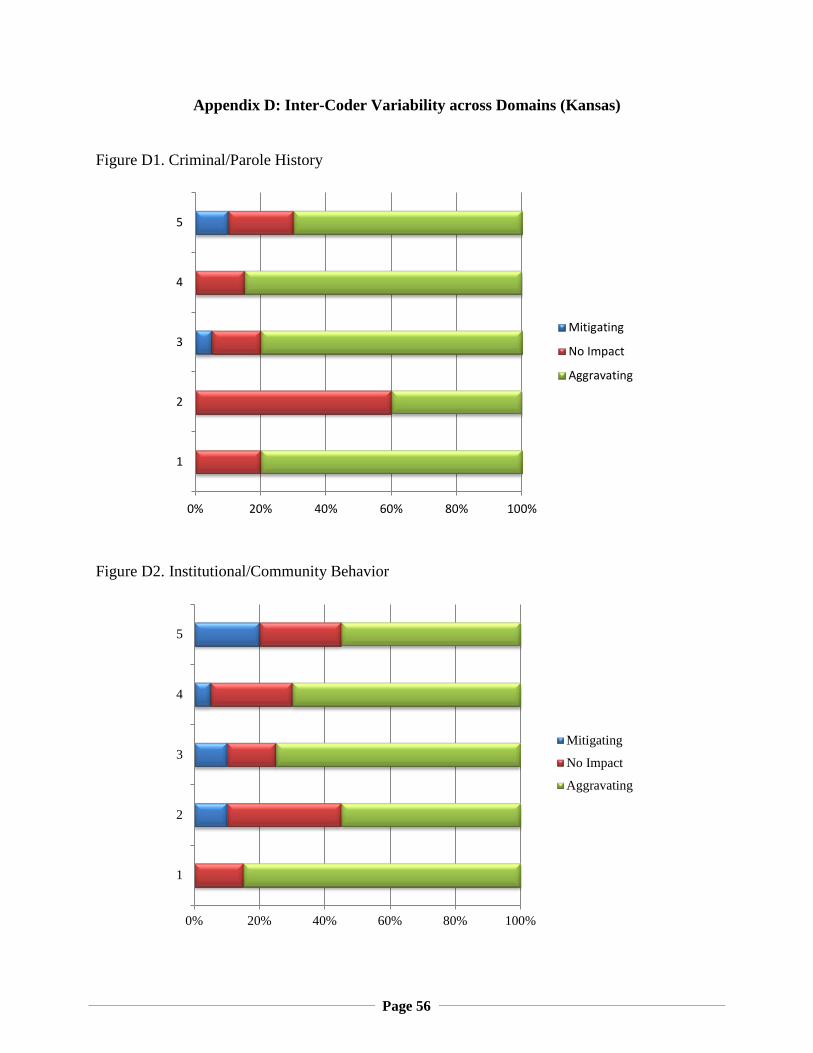
Page 56
Appendix D: Inter-Coder Variability across Domains (Kansas)
Figure D1. Criminal/Parole History
Figure D2. Institutional/Community Behavior
0% 20% 40% 60% 80% 100%
1
2
3
4
5
Mitigating
No Impact
Aggravating
0% 20% 40% 60% 80% 100%
1
2
3
4
5
Mitigating
No Impact
Aggravating
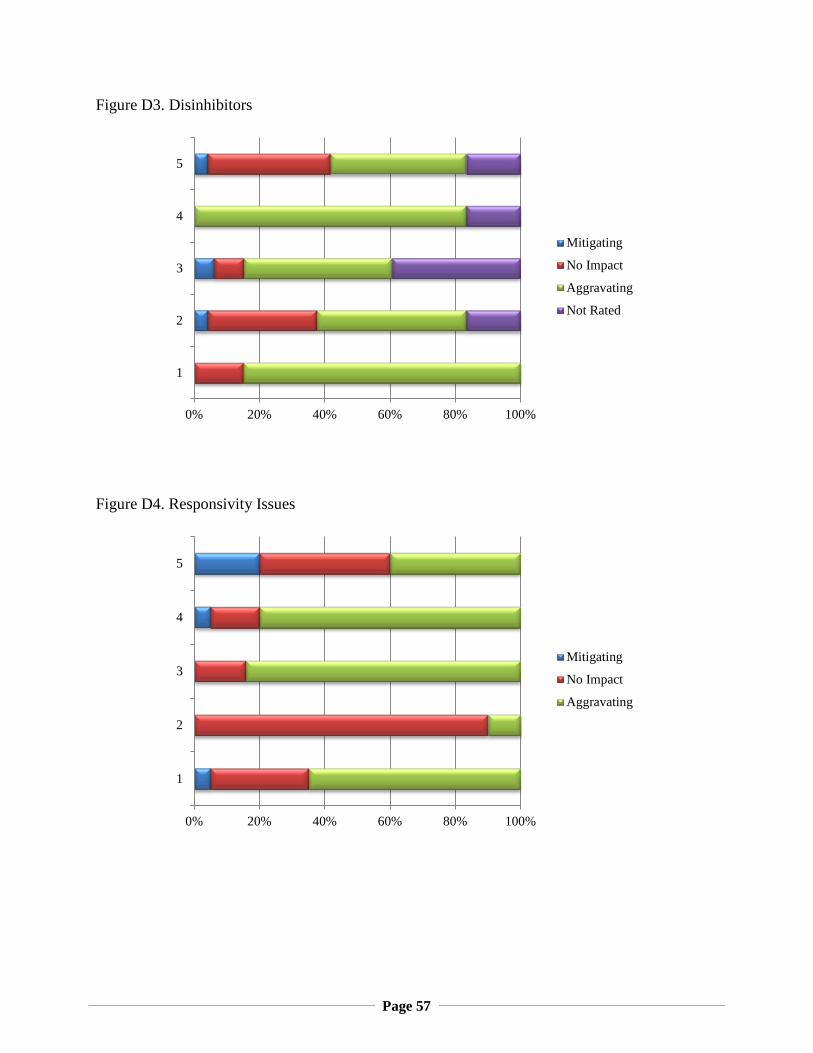
Page 57
Figure D3. Disinhibitors
Figure D4. Responsivity Issues
0% 20% 40% 60% 80% 100%
1
2
3
4
5
Mitigating
No Impact
Aggravating
Not Rated
0% 20% 40% 60% 80% 100%
1
2
3
4
5
Mitigating
No Impact
Aggravating
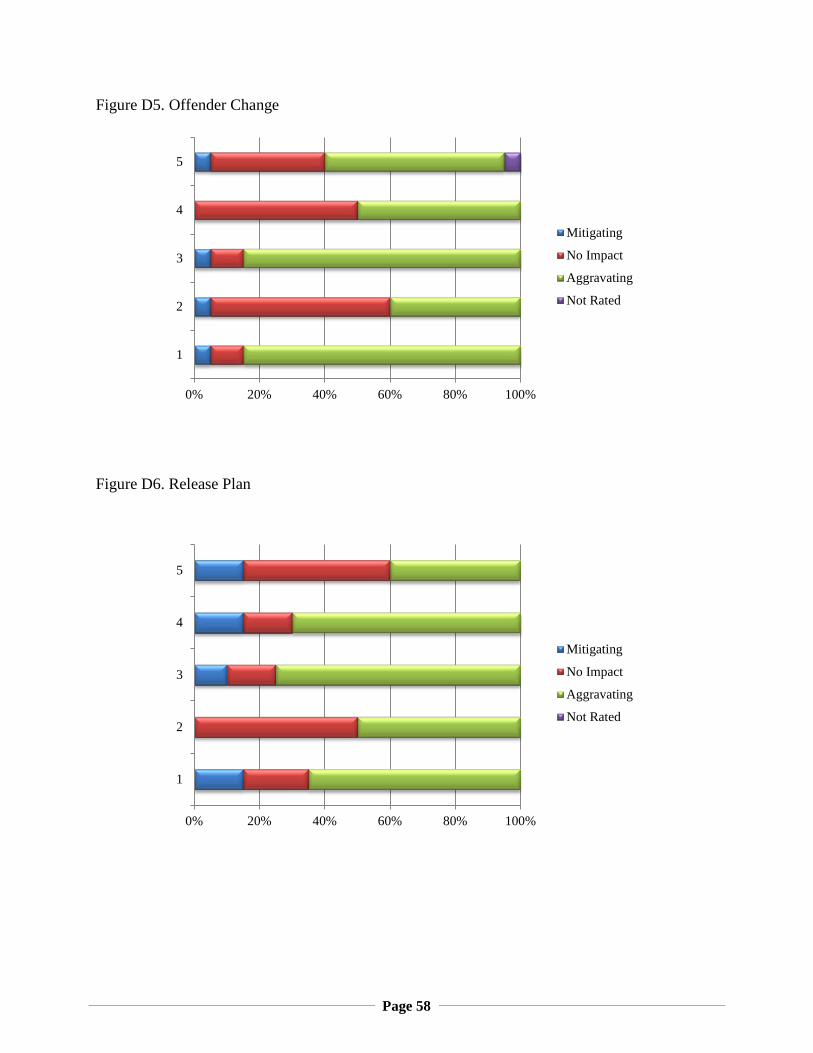
Page 58
Figure D5. Offender Change
Figure D6. Release Plan
0% 20% 40% 60% 80% 100%
1
2
3
4
5
Mitigating
No Impact
Aggravating
Not Rated
0% 20% 40% 60% 80% 100%
1
2
3
4
5
Mitigating
No Impact
Aggravating
Not Rated
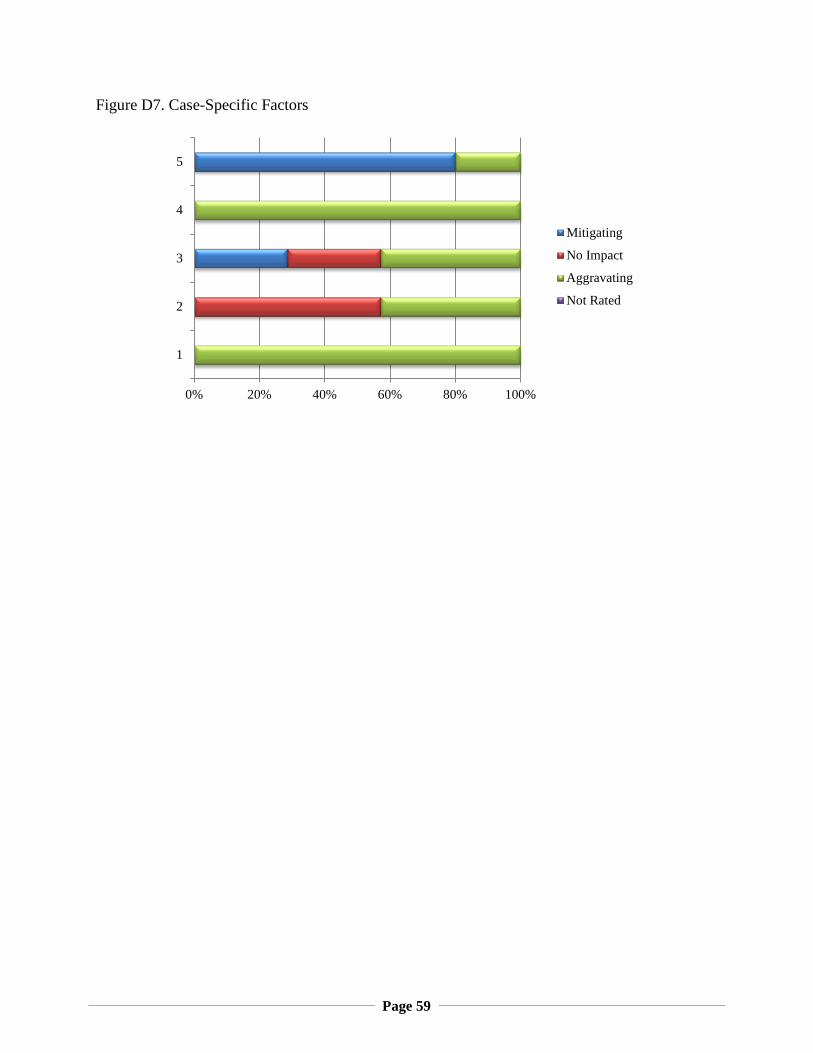
Page 59
Figure D7. Case-Specific Factors
0% 20% 40% 60% 80% 100%
1
2
3
4
5
Mitigating
No Impact
Aggravating
Not Rated
Recommended