American Transactions on Engineering & Applied Sciences
http://TuEngr.com/ATEAS
Analysis of Roll Rotation Mechanism of a Butterfly for Development of a Small Flapping Robot Masahiro SHINDO a*, Taro FUJIKAWA b, Koki KIKUCHI a
a Department of Advanced Robotics, Chiba Institute of Technology, JAPAN b Department of Robotics and Mechatronics, Tokyo Denki University, JAPAN A R T I C L E I N F O
A B S T RA C T
Article history: Received July 24, 2014 Accepted July 31, 2014 Available online August 01, 2014 Keywords: CFD; Flapping flight; Roll rotation; Posture control; Aerodynamic characteristics.
In this paper, we investigated the aerodynamic characteristics during roll rotation of a butterfly based on computational fluid dynamics using a three-dimensional high-speed camera information. This method allows to create a numerical model of a butterfly from the camera images and to analyze the flow field corresponding to the captured behavior. We photographed two behaviors different in rotational axis and analyzed the roll rotational mechanism. In a typical pitch rotational flight, the differential pressure was concentrated on the tip of fore wings. The magnitudes of reaction forces on left and right wings were roughly matched each other. On the other hands, the differential pressure of the roll rotational flight was distributed in the whole of wings. The magnitude of the right reaction force was twice greater than that of left at the first down stroke. The roll angle changed largely at the same time. These results show that a butterfly rotates about roll by changing the reaction forces on each side.
2014 Am. Trans. Eng. Appl. Sci.
1. Introduction Birds and insects flap to achieve flight and can perform wonderful aerial feats such as
vertical takeoff and landing, snap turns, and hovering. They gain high maneuverability by
utilizing the vortices around the wings. A butterfly is a suitable model on which to base
2014 American Transactions on Engineering & Applied Sciences.
*Corresponding author (Masahiro Shindo). Email address: [email protected]. 2014. American Transactions on Engineering & Applied Sciences. Volume 3 No. 4 ISSN
2229-1652 eISSN 2229-1660 Online Available at http://TUENGR.COM/ATEAS/V03/0233.pdf. 233
autonomous micro aerial vehicles (MAV), due to its sub-gram weight, low flapping frequency
and a few degrees of freedom compared to other flying insects. To develop a small flapping
robot, many studies on the flight mechanism of butterflies have been carried out (Wood 2011,
2013 and Shen 2012). Takahashi et al. have developed a micro strain sensor using micro
electronic mechanical systems (MEMS) and measured the pressure by mounting it on the wings
(Takahashi, 2012). The result of measurement showed that the differential pressure on the fore
wings was dominant over the pressure on the hind wings. However, in this experiment, the
butterfly flew while pulling a signal wire because the sensor was physically connected to an
external circuit board. Therefore, it is possible that the flight behavior was different to that of an
untethered butterfly. Fuchiwaki et al. have visualized vortices around two kinds of butterfly
using particle image velocimetry (PIV) (Fuchiwaki, 2013). The results show that a vortex ring
is formed at the beginning of the down stroke and passes over the body with growing vortices
and flow speed regardless of the type of a butterfly. The PIV method is able to analyze the air
flow in an arbitrary plane in space; however, flapping is a complex 3D action which requires the
3D visualization of vortices.
We clarify the attitude recovering mechanism of a butterfly by analyzing an untethered
butterfly and visualizing the pressure and vortices. We photograph the flapping behavior using
a 3D high speed camera system. The 3D data from different points on the butterfly wings are
obtained from all three directions. The attitude (roll, pitch, and yaw angles) and flapping angle
are determined by using these points. These points and velocities are also used as the boundary
conditions for computational fluid dynamics (CFD). By reproducing the actual behavior of a
butterfly in a computer, the airflow around the measured points can be deduced. Based on this
numerical procedure, the magnitude and distribution of pressure and the behavior of the vortices
can be visualized. Accordingly, the lift and drag forces on the butterfly are calculated by
considering the pressure over the whole wing. This study clarifies the roll rotation mechanism
of a butterfly by determining the reaction force exerted and the angular moments during flight.
2. Photography of Flight Behavior
2.1 Analysis of the Images In this study, we photographed the free flight behavior of Papilio xuthus using a 3D high
speed camera system (Figure 1). The camera coordinate system has three axes parallel to the
234 Masahiro Shindo, Taro Fujikawa, and Koki Kikuchi
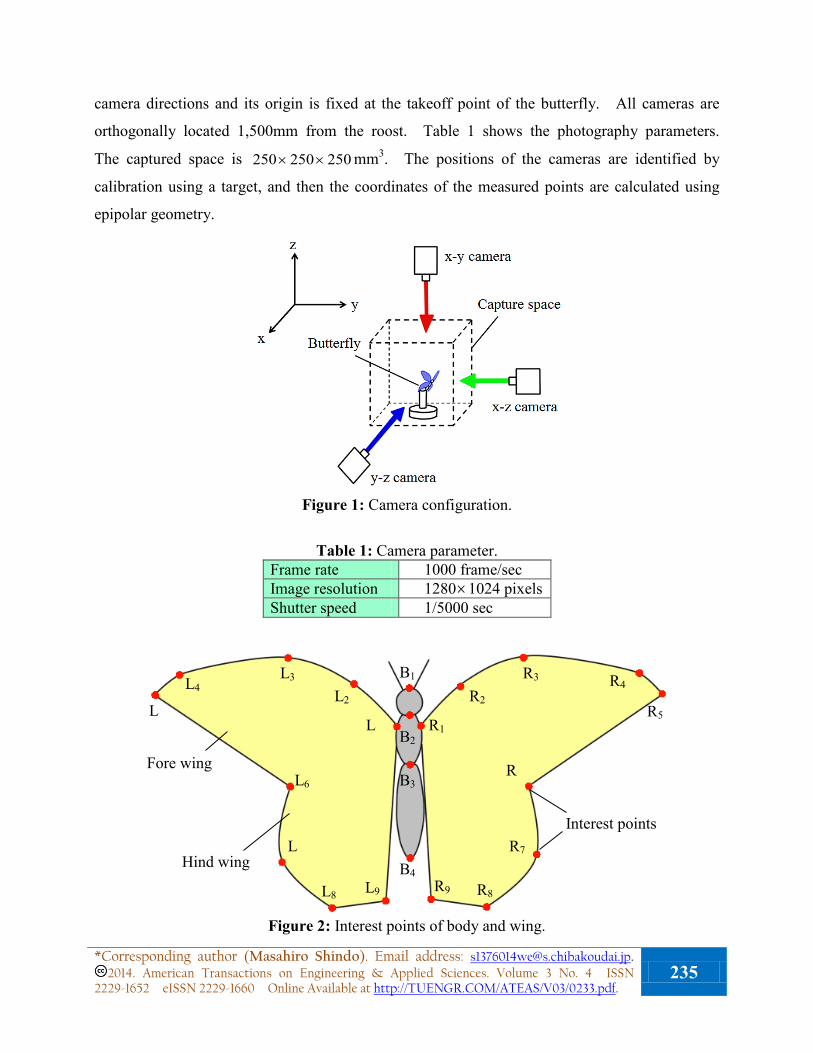
camera directions and its origin is fixed at the takeoff point of the butterfly. All cameras are
orthogonally located 1,500mm from the roost. Table 1 shows the photography parameters.
The captured space is 250250250 ×× mm3. The positions of the cameras are identified by
calibration using a target, and then the coordinates of the measured points are calculated using
epipolar geometry.
Figure 1: Camera configuration.
Table 1: Camera parameter. Frame rate 1000 frame/sec Image resolution 1280×1024 pixels Shutter speed 1/5000 sec
Figure 2: Interest points of body and wing.
Interest points
Fore wing
R1
R2 R3 R4
R5
R
R7
R8 R9
L
L2 L3 L4
L
L6
L
L8 L9
B1
B2
B3
B4 Hind wing
*Corresponding author (Masahiro Shindo). Email address: [email protected]. 2014. American Transactions on Engineering & Applied Sciences. Volume 3 No. 4 ISSN
2229-1652 eISSN 2229-1660 Online Available at http://TUENGR.COM/ATEAS/V03/0233.pdf. 235
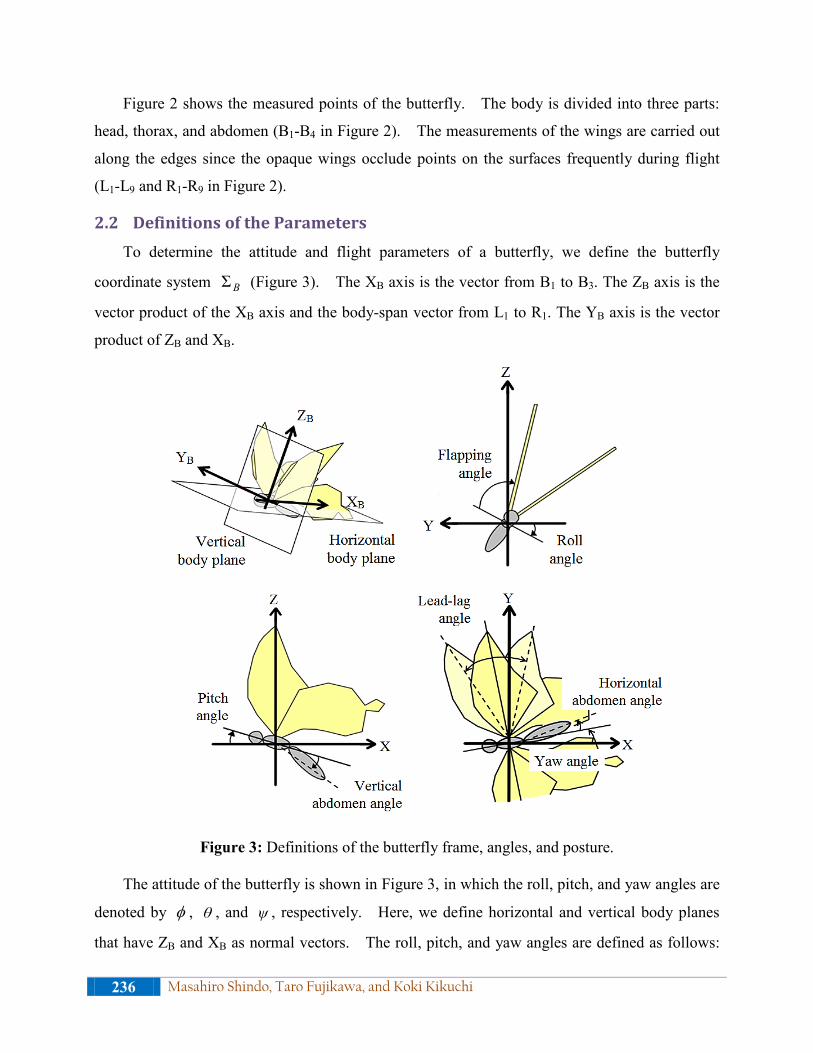
Figure 2 shows the measured points of the butterfly. The body is divided into three parts:
head, thorax, and abdomen (B1-B4 in Figure 2). The measurements of the wings are carried out
along the edges since the opaque wings occlude points on the surfaces frequently during flight
(L1-L9 and R1-R9 in Figure 2).
2.2 Definitions of the Parameters To determine the attitude and flight parameters of a butterfly, we define the butterfly
coordinate system BΣ (Figure 3). The XB axis is the vector from B1 to B3. The ZB axis is the
vector product of the XB axis and the body-span vector from L1 to R1. The YB axis is the vector
product of ZB and XB.
Figure 3: Definitions of the butterfly frame, angles, and posture.
The attitude of the butterfly is shown in Figure 3, in which the roll, pitch, and yaw angles are
denoted by φ , θ , and ψ , respectively. Here, we define horizontal and vertical body planes
that have ZB and XB as normal vectors. The roll, pitch, and yaw angles are defined as follows:
236 Masahiro Shindo, Taro Fujikawa, and Koki Kikuchi
φ is the angle between the horizontal body plane and the Y axis, θ is the angle between the
horizontal body plane and the X axis, and ψ is the angle between the vertical body plane and
the Y axis.
The flight parameters describing the state of the butterfly are chosen as follows: The angle
between the horizontal body plane and the normal vector of the fore wing is defined as the
flapping angle. The flapping cycle is divided into two phases, up and down strokes. We also
defined the lead-lag angle as a parameter which describes the wing state. The lead-lag motion
of a butterfly controls not only the pressure center on the wings but also the wing area by
overlapping the fore and hind wings (Fujikawa, 2008, 2010 and Udagawa, 2005). This motion
is parameterized by the angle between the vertical body plane and the vector from the root to the
tip of the wing. The parameter describing the state of the abdomen is as follows: A butterfly
swings its abdomen horizontally and vertically as well as flapping. The vertical abdomen angle
is defined as the angle between the horizontal body plane and the abdomen vector from B3 to B4.
The horizontal abdomen angle is the angle between the body and the abdomen vectors.
3. Computational Fluid Dynamics
3.1 Boundary Conditions around a Butterfly In this study, we analyzed the flow field around a real butterfly flying in the photographed
space. Using the measured points and velocities defined in the previous section as the mesh
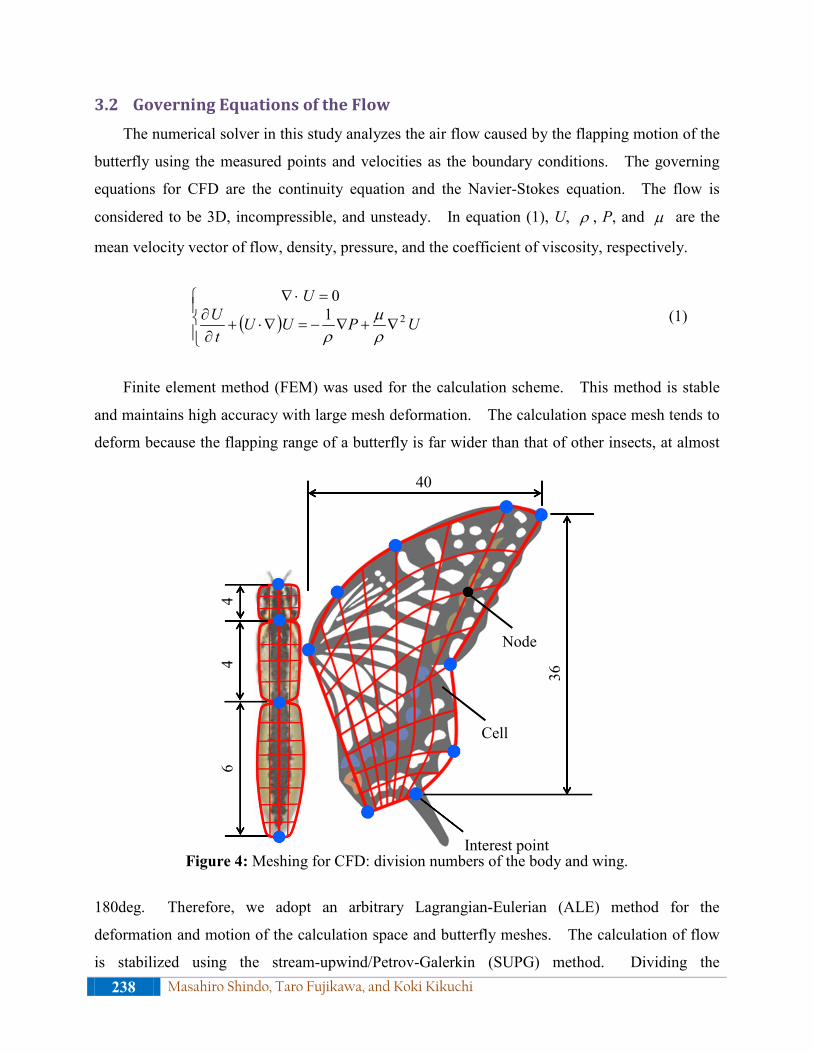
boundaries, the behavior of real vortices can be visualized. The wing and body are divided into
meshes bounded by the measured points (Figure 4). The leading edges of the fore wings (L1-L5
and R1-R5) and the side edges of the hind wings (L6-L8 and R6-R8) are approximated to match a
butterfly wing shape using third order spline interpolation. The body and other wing sections
are divided linearly. To simplify the calculation, our simulation considers the fore and hind
wings as one. The body of the butterfly model is composed of three parts, head, thorax, and
abdomen. These parts are cylindrical and their axes are the lines which join the measured points.
The coordinates of the butterfly are obtained by image processing every millisecond using a 1000
frame per second camera. To improve calculation accuracy, we further divided these data
intervals into 0.01ms periods through the natural third spline interpolation. The approximate
curve is continuous up to second order. *Corresponding author (Masahiro Shindo). Email address: [email protected].
2014. American Transactions on Engineering & Applied Sciences. Volume 3 No. 4 ISSN 2229-1652 eISSN 2229-1660 Online Available at http://TUENGR.COM/ATEAS/V03/0233.pdf.
237
3.2 Governing Equations of the Flow The numerical solver in this study analyzes the air flow caused by the flapping motion of the
butterfly using the measured points and velocities as the boundary conditions. The governing
equations for CFD are the continuity equation and the Navier-Stokes equation. The flow is
considered to be 3D, incompressible, and unsteady. In equation (1), U, ρ , P, and µ are the
mean velocity vector of flow, density, pressure, and the coefficient of viscosity, respectively.
( )
∇+∇−=∇⋅+∂∂
=⋅∇
UPUUt
UU
210
ρµ
ρ (1)
Finite element method (FEM) was used for the calculation scheme. This method is stable
and maintains high accuracy with large mesh deformation. The calculation space mesh tends to
deform because the flapping range of a butterfly is far wider than that of other insects, at almost
Figure 4: Meshing for CFD: division numbers of the body and wing.
180deg. Therefore, we adopt an arbitrary Lagrangian-Eulerian (ALE) method for the
deformation and motion of the calculation space and butterfly meshes. The calculation of flow
is stabilized using the stream-upwind/Petrov-Galerkin (SUPG) method. Dividing the
40
Node
Cell
Interest point
36
4 4
6
238 Masahiro Shindo, Taro Fujikawa, and Koki Kikuchi
Navier-Stokes equation into two terms using a simplified marker and cell method (SMAC)
method allows the explicit and implicit calculations of velocity and pressure, respectively.
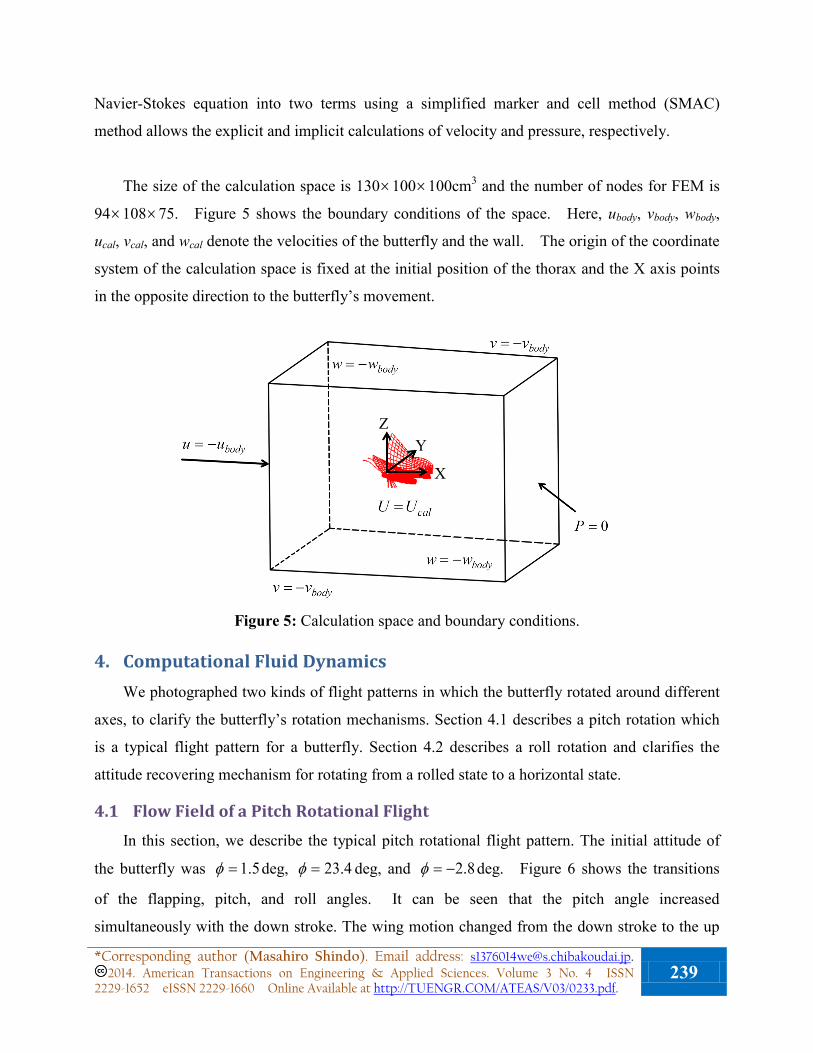
The size of the calculation space is 130×100×100cm3 and the number of nodes for FEM is
94×108×75. Figure 5 shows the boundary conditions of the space. Here, ubody, vbody, wbody,
ucal, vcal, and wcal denote the velocities of the butterfly and the wall. The origin of the coordinate
system of the calculation space is fixed at the initial position of the thorax and the X axis points
in the opposite direction to the butterfly’s movement.
Figure 5: Calculation space and boundary conditions.
4. Computational Fluid Dynamics We photographed two kinds of flight patterns in which the butterfly rotated around different
axes, to clarify the butterfly’s rotation mechanisms. Section 4.1 describes a pitch rotation which
is a typical flight pattern for a butterfly. Section 4.2 describes a roll rotation and clarifies the
attitude recovering mechanism for rotating from a rolled state to a horizontal state.
4.1 Flow Field of a Pitch Rotational Flight In this section, we describe the typical pitch rotational flight pattern. The initial attitude of
the butterfly was 5.1=φ deg, 4.23=φ deg, and 8.2−=φ deg. Figure 6 shows the transitions
of the flapping, pitch, and roll angles. It can be seen that the pitch angle increased
simultaneously with the down stroke. The wing motion changed from the down stroke to the up
Z Y
X
*Corresponding author (Masahiro Shindo). Email address: [email protected]. 2014. American Transactions on Engineering & Applied Sciences. Volume 3 No. 4 ISSN
2229-1652 eISSN 2229-1660 Online Available at http://TUENGR.COM/ATEAS/V03/0233.pdf. 239

stroke at a flapping angle of 70− deg. The pitch angle continued to increase for 10ms after the
stroke reversal. The reaction force on the wing provided the thrust since the stroke was in the
positive X direction. In the up stroke phase from 31ms to 81ms, the butterfly flew forward with
decreasing pitch angle. The down stroke started again at a flapping angle of 80deg. As well as
the first stroke, the pitch angle increased with a delay of 10ms in the second stroke. The roll
angle was almost unchanged throughout the two flapping cycles. The maximal variation was
25deg at a flapping angle of 10− deg during a first upstroke (Figure 6).
Figure 6: Time history of the angles: Pitch rotational flight.
Figure 7 shows the streamlines around the wings caused by the flapping motion. The
streamlines are colored according to the flow speed, where the red lines are faster and blue lines
are slower. The leading-edge vortices (LEV) and wing tip vortices (WTV) which were present
on the upper surface of the wing were generated during the down stroke. These vortices
decrease pressure causing the differential pressure between the top and bottom surfaces of the
wing. Dickinson et al. have reported the lift generation mechanisms (Dickinson, 1999), which
are as follows. Rotational circulation means that the rotation of the wing at the time of the
stroke reversal generates an upward force. The wake capture mechanism explains the increase
in aerodynamic force during the stroke reversal. Figure 8 shows the twist angle of the left and
right wings during two flapping cycles. It shows that the twist angle changed at the time of the
stroke reversal. We think that the lift force was increased by rotational circulation at that time
(Dickinson, 1999). The axes of the vortices are parallel to the wing surface. 240 Masahiro Shindo, Taro Fujikawa, and Koki Kikuchi
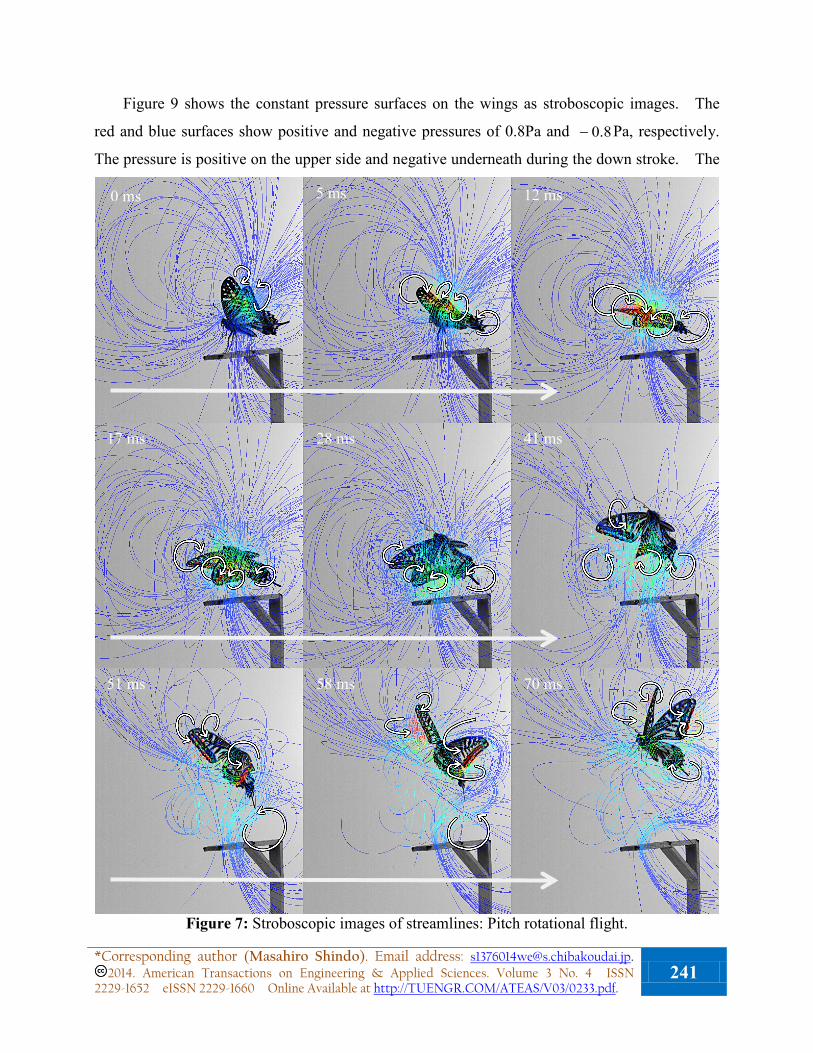
Figure 9 shows the constant pressure surfaces on the wings as stroboscopic images. The
red and blue surfaces show positive and negative pressures of 0.8Pa and 8.0− Pa, respectively.
The pressure is positive on the upper side and negative underneath during the down stroke. The
Figure 7: Stroboscopic images of streamlines: Pitch rotational flight.
0 ms 5 ms 12 ms
17 ms 28 ms 41 ms
51 ms 58 ms 70 ms
*Corresponding author (Masahiro Shindo). Email address: [email protected]. 2014. American Transactions on Engineering & Applied Sciences. Volume 3 No. 4 ISSN
2229-1652 eISSN 2229-1660 Online Available at http://TUENGR.COM/ATEAS/V03/0233.pdf. 241
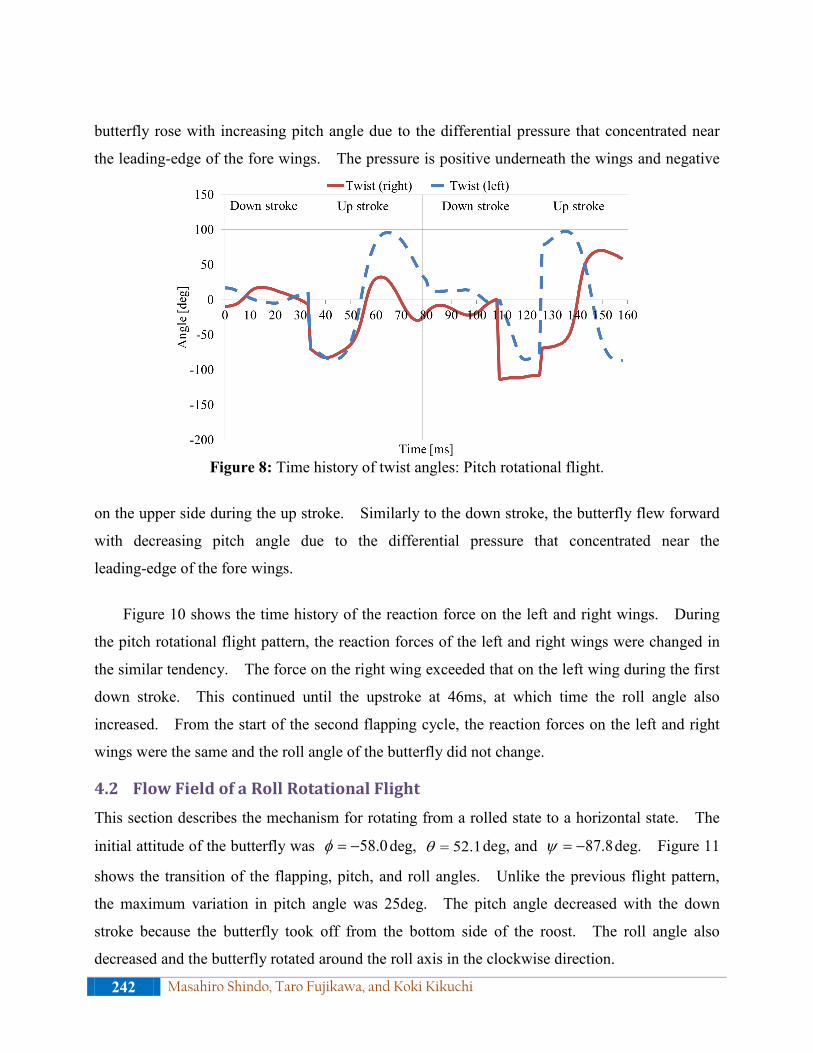
butterfly rose with increasing pitch angle due to the differential pressure that concentrated near
the leading-edge of the fore wings. The pressure is positive underneath the wings and negative
Figure 8: Time history of twist angles: Pitch rotational flight.
on the upper side during the up stroke. Similarly to the down stroke, the butterfly flew forward
with decreasing pitch angle due to the differential pressure that concentrated near the
leading-edge of the fore wings.
Figure 10 shows the time history of the reaction force on the left and right wings. During
the pitch rotational flight pattern, the reaction forces of the left and right wings were changed in
the similar tendency. The force on the right wing exceeded that on the left wing during the first
down stroke. This continued until the upstroke at 46ms, at which time the roll angle also
increased. From the start of the second flapping cycle, the reaction forces on the left and right
wings were the same and the roll angle of the butterfly did not change.
4.2 Flow Field of a Roll Rotational Flight This section describes the mechanism for rotating from a rolled state to a horizontal state. The
initial attitude of the butterfly was 0.58−=φ deg, 1.52=θ deg, and 8.87−=ψ deg. Figure 11
shows the transition of the flapping, pitch, and roll angles. Unlike the previous flight pattern,
the maximum variation in pitch angle was 25deg. The pitch angle decreased with the down
stroke because the butterfly took off from the bottom side of the roost. The roll angle also
decreased and the butterfly rotated around the roll axis in the clockwise direction.
242 Masahiro Shindo, Taro Fujikawa, and Koki Kikuchi
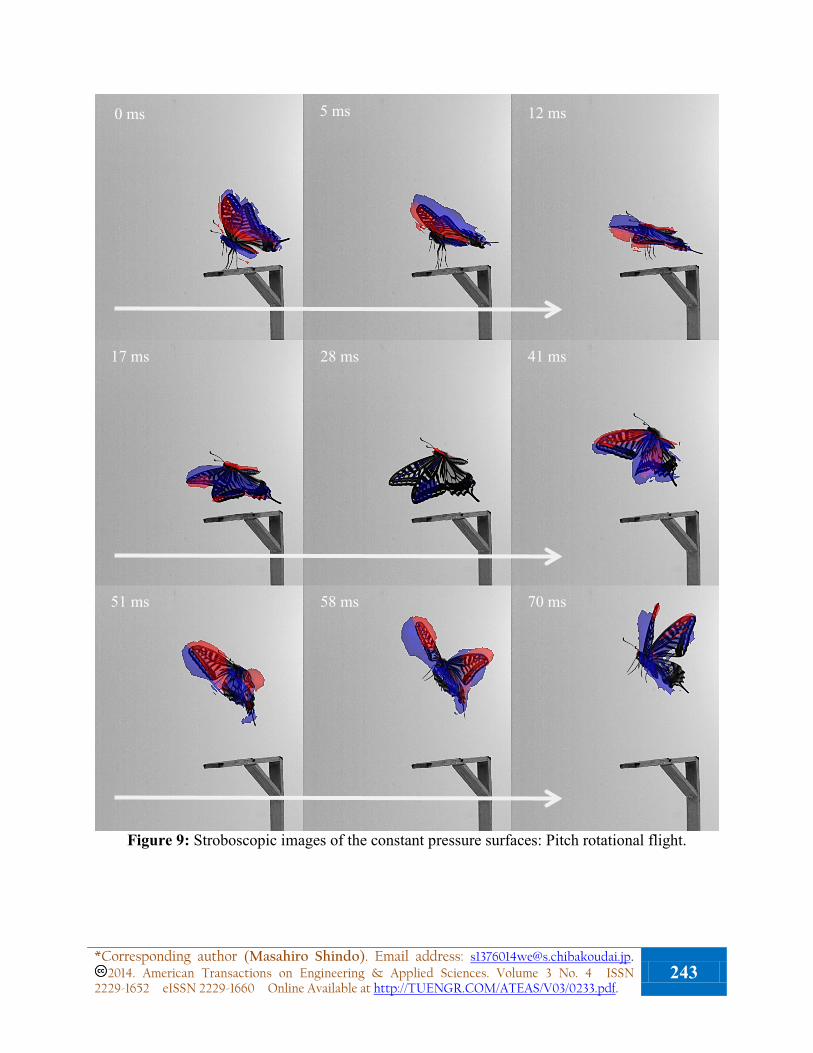
Figure 9: Stroboscopic images of the constant pressure surfaces: Pitch rotational flight.
0 ms 5 ms 12 ms
17 ms 28 ms 41 ms
51 ms 58 ms 70 ms
*Corresponding author (Masahiro Shindo). Email address: [email protected]. 2014. American Transactions on Engineering & Applied Sciences. Volume 3 No. 4 ISSN
2229-1652 eISSN 2229-1660 Online Available at http://TUENGR.COM/ATEAS/V03/0233.pdf. 243
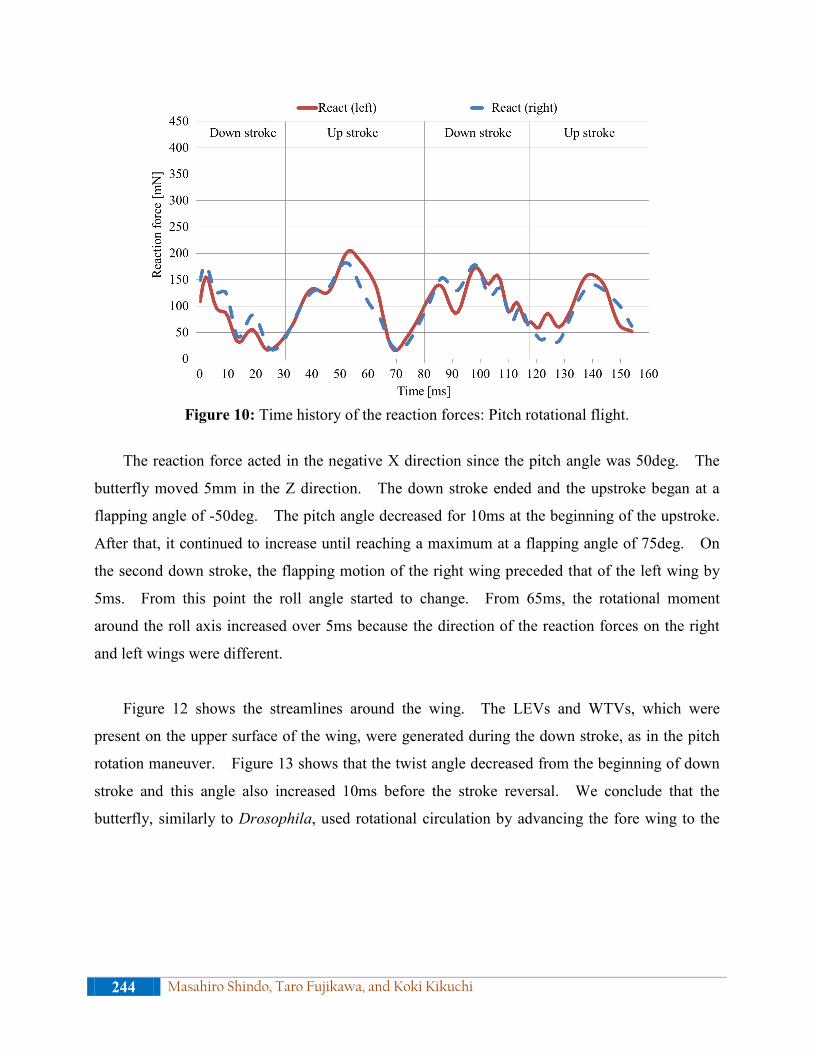
Figure 10: Time history of the reaction forces: Pitch rotational flight.
The reaction force acted in the negative X direction since the pitch angle was 50deg. The
butterfly moved 5mm in the Z direction. The down stroke ended and the upstroke began at a
flapping angle of -50deg. The pitch angle decreased for 10ms at the beginning of the upstroke.
After that, it continued to increase until reaching a maximum at a flapping angle of 75deg. On
the second down stroke, the flapping motion of the right wing preceded that of the left wing by
5ms. From this point the roll angle started to change. From 65ms, the rotational moment
around the roll axis increased over 5ms because the direction of the reaction forces on the right
and left wings were different.
Figure 12 shows the streamlines around the wing. The LEVs and WTVs, which were
present on the upper surface of the wing, were generated during the down stroke, as in the pitch
rotation maneuver. Figure 13 shows that the twist angle decreased from the beginning of down
stroke and this angle also increased 10ms before the stroke reversal. We conclude that the
butterfly, similarly to Drosophila, used rotational circulation by advancing the fore wing to the
244 Masahiro Shindo, Taro Fujikawa, and Koki Kikuchi
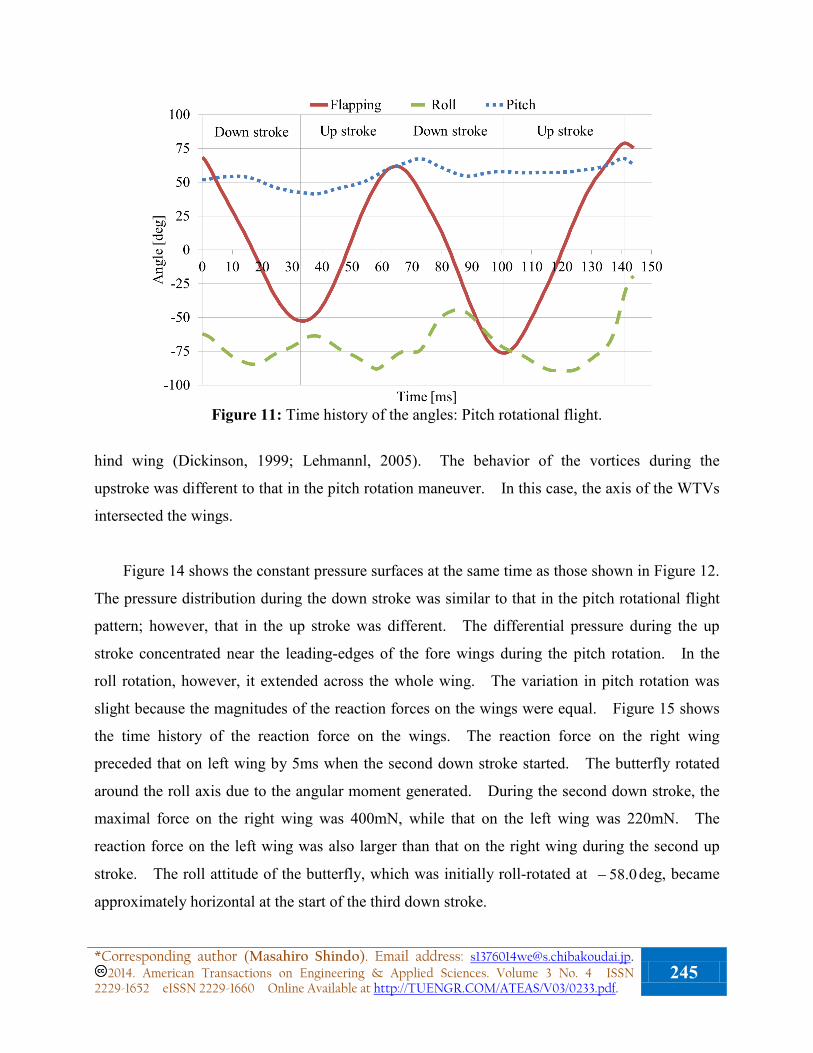
Figure 11: Time history of the angles: Pitch rotational flight.
hind wing (Dickinson, 1999; Lehmannl, 2005). The behavior of the vortices during the
upstroke was different to that in the pitch rotation maneuver. In this case, the axis of the WTVs
intersected the wings.
Figure 14 shows the constant pressure surfaces at the same time as those shown in Figure 12.
The pressure distribution during the down stroke was similar to that in the pitch rotational flight
pattern; however, that in the up stroke was different. The differential pressure during the up
stroke concentrated near the leading-edges of the fore wings during the pitch rotation. In the
roll rotation, however, it extended across the whole wing. The variation in pitch rotation was
slight because the magnitudes of the reaction forces on the wings were equal. Figure 15 shows
the time history of the reaction force on the wings. The reaction force on the right wing
preceded that on left wing by 5ms when the second down stroke started. The butterfly rotated
around the roll axis due to the angular moment generated. During the second down stroke, the
maximal force on the right wing was 400mN, while that on the left wing was 220mN. The
reaction force on the left wing was also larger than that on the right wing during the second up
stroke. The roll attitude of the butterfly, which was initially roll-rotated at 0.58− deg, became
approximately horizontal at the start of the third down stroke.
*Corresponding author (Masahiro Shindo). Email address: [email protected]. 2014. American Transactions on Engineering & Applied Sciences. Volume 3 No. 4 ISSN
2229-1652 eISSN 2229-1660 Online Available at http://TUENGR.COM/ATEAS/V03/0233.pdf. 245
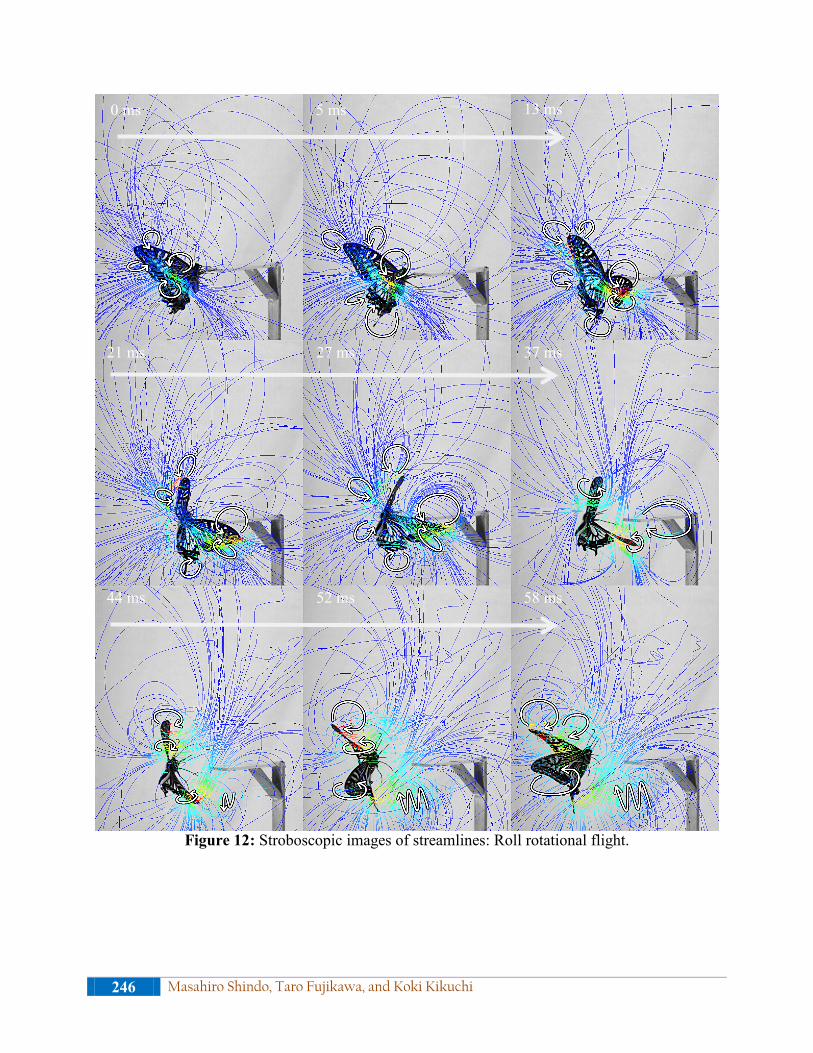
Figure 12: Stroboscopic images of streamlines: Roll rotational flight.
0 ms 5 ms 13 ms
21 ms 27 ms 37 ms
44 ms 52 ms 58 ms
246 Masahiro Shindo, Taro Fujikawa, and Koki Kikuchi
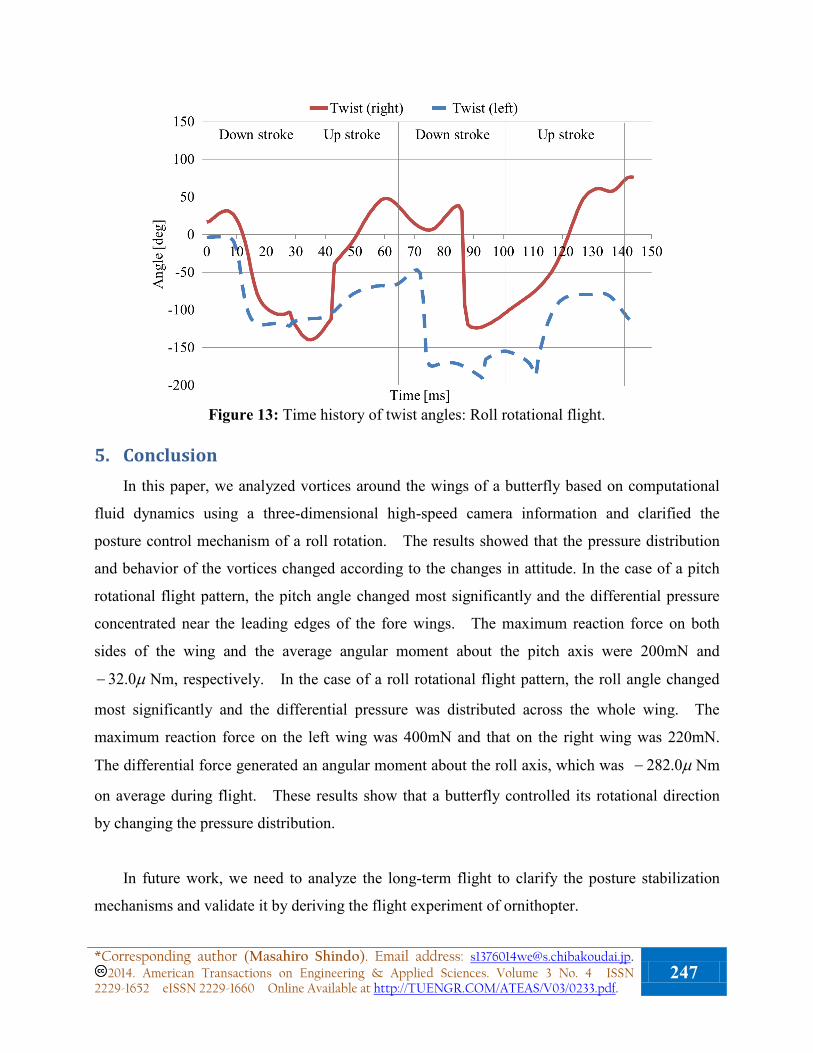
Figure 13: Time history of twist angles: Roll rotational flight.
5. Conclusion In this paper, we analyzed vortices around the wings of a butterfly based on computational
fluid dynamics using a three-dimensional high-speed camera information and clarified the
posture control mechanism of a roll rotation. The results showed that the pressure distribution
and behavior of the vortices changed according to the changes in attitude. In the case of a pitch
rotational flight pattern, the pitch angle changed most significantly and the differential pressure
concentrated near the leading edges of the fore wings. The maximum reaction force on both
sides of the wing and the average angular moment about the pitch axis were 200mN and
µ0.32− Nm, respectively. In the case of a roll rotational flight pattern, the roll angle changed
most significantly and the differential pressure was distributed across the whole wing. The
maximum reaction force on the left wing was 400mN and that on the right wing was 220mN.
The differential force generated an angular moment about the roll axis, which was µ0.282− Nm
on average during flight. These results show that a butterfly controlled its rotational direction
by changing the pressure distribution.
In future work, we need to analyze the long-term flight to clarify the posture stabilization
mechanisms and validate it by deriving the flight experiment of ornithopter.
*Corresponding author (Masahiro Shindo). Email address: [email protected]. 2014. American Transactions on Engineering & Applied Sciences. Volume 3 No. 4 ISSN
2229-1652 eISSN 2229-1660 Online Available at http://TUENGR.COM/ATEAS/V03/0233.pdf. 247
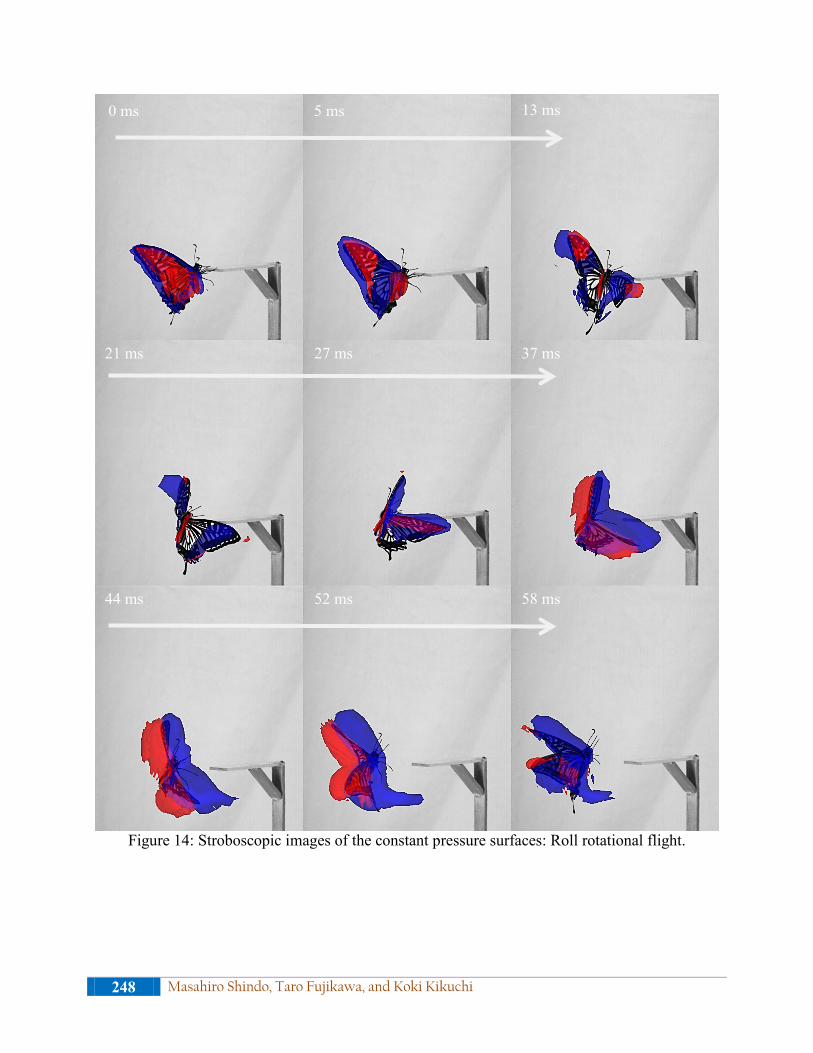
Figure 14: Stroboscopic images of the constant pressure surfaces: Roll rotational flight.
0 ms 5 ms 13 ms
21 ms 27 ms 37 ms
44 ms 52 ms 58 ms
248 Masahiro Shindo, Taro Fujikawa, and Koki Kikuchi
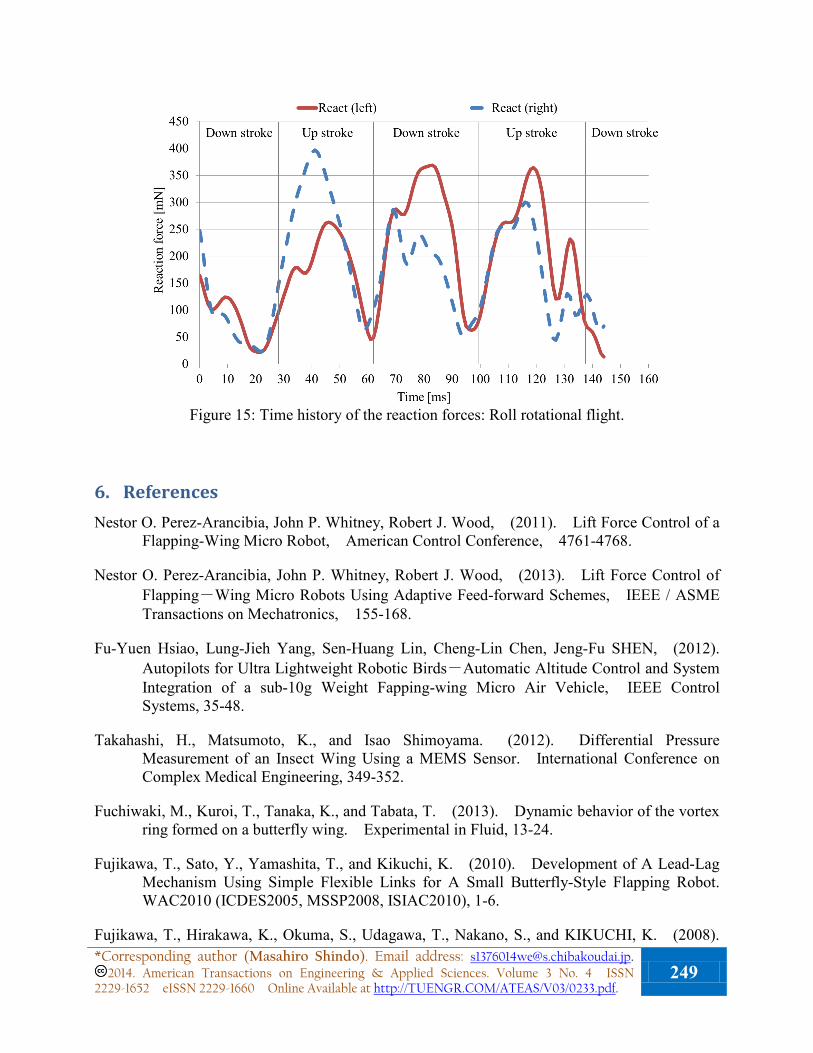
Figure 15: Time history of the reaction forces: Roll rotational flight.
6. References Nestor O. Perez-Arancibia, John P. Whitney, Robert J. Wood, (2011). Lift Force Control of a
Flapping-Wing Micro Robot, American Control Conference, 4761-4768.
Nestor O. Perez-Arancibia, John P. Whitney, Robert J. Wood, (2013). Lift Force Control of Flapping-Wing Micro Robots Using Adaptive Feed-forward Schemes, IEEE / ASME Transactions on Mechatronics, 155-168.
Fu-Yuen Hsiao, Lung-Jieh Yang, Sen-Huang Lin, Cheng-Lin Chen, Jeng-Fu SHEN, (2012). Autopilots for Ultra Lightweight Robotic Birds-Automatic Altitude Control and System Integration of a sub-10g Weight Fapping-wing Micro Air Vehicle, IEEE Control Systems, 35-48.
Takahashi, H., Matsumoto, K., and Isao Shimoyama. (2012). Differential Pressure Measurement of an Insect Wing Using a MEMS Sensor. International Conference on Complex Medical Engineering, 349-352.
Fuchiwaki, M., Kuroi, T., Tanaka, K., and Tabata, T. (2013). Dynamic behavior of the vortex ring formed on a butterfly wing. Experimental in Fluid, 13-24.
Fujikawa, T., Sato, Y., Yamashita, T., and Kikuchi, K. (2010). Development of A Lead-Lag Mechanism Using Simple Flexible Links for A Small Butterfly-Style Flapping Robot. WAC2010 (ICDES2005, MSSP2008, ISIAC2010), 1-6.
Fujikawa, T., Hirakawa, K., Okuma, S., Udagawa, T., Nakano, S., and KIKUCHI, K. (2008). *Corresponding author (Masahiro Shindo). Email address: [email protected].
2014. American Transactions on Engineering & Applied Sciences. Volume 3 No. 4 ISSN 2229-1652 eISSN 2229-1660 Online Available at http://TUENGR.COM/ATEAS/V03/0233.pdf.
249
Development of a small flapping robot: Motion analysis during takeoff by numerical simulation and experiment. Mechanical Systems and Signal Processing, 22, 1304-1315.
Udagawa, T., Fujikawa, T., GAO, X., and Kikuchi, K. (2005). Development of a Small-Sized Flapping Robot. The 1st international conference on design engineering and Science, 283-288.
Dickinson, M., Lehmann, F., and Sane, S. (1999). Wing Rotation and the Aerodynamic Basis of Insect Flight. Science, 284, 1954-1960.
Lehmann, F., Sane, S., and Dickinson, M. (2005). The aerodynamic effects of wing-wing interaction in flapping insect wings. The Journal of Experimental Biology, 208, 3075-3092.
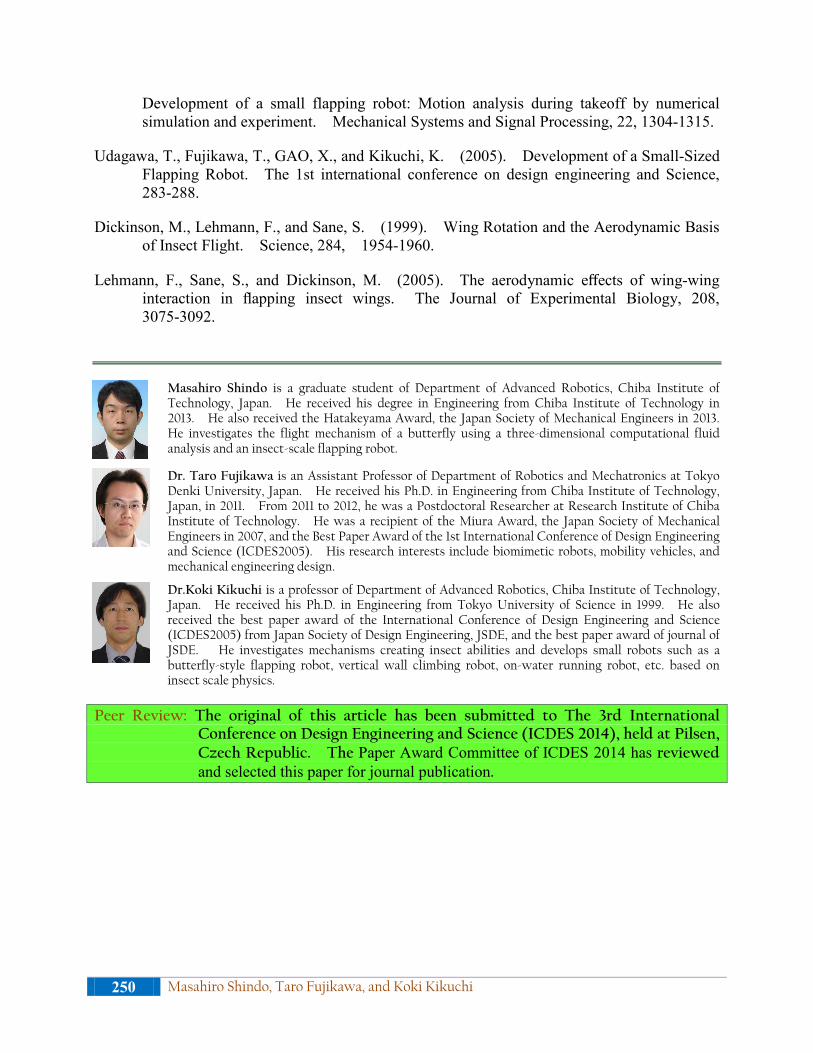
Masahiro Shindo is a graduate student of Department of Advanced Robotics, Chiba Institute of Technology, Japan. He received his degree in Engineering from Chiba Institute of Technology in 2013. He also received the Hatakeyama Award, the Japan Society of Mechanical Engineers in 2013. He investigates the flight mechanism of a butterfly using a three-dimensional computational fluid analysis and an insect-scale flapping robot.
Dr. Taro Fujikawa is an Assistant Professor of Department of Robotics and Mechatronics at Tokyo Denki University, Japan. He received his Ph.D. in Engineering from Chiba Institute of Technology, Japan, in 2011. From 2011 to 2012, he was a Postdoctoral Researcher at Research Institute of Chiba Institute of Technology. He was a recipient of the Miura Award, the Japan Society of Mechanical Engineers in 2007, and the Best Paper Award of the 1st International Conference of Design Engineering and Science (ICDES2005). His research interests include biomimetic robots, mobility vehicles, and mechanical engineering design.
Dr.Koki Kikuchi is a professor of Department of Advanced Robotics, Chiba Institute of Technology, Japan. He received his Ph.D. in Engineering from Tokyo University of Science in 1999. He also received the best paper award of the International Conference of Design Engineering and Science (ICDES2005) from Japan Society of Design Engineering, JSDE, and the best paper award of journal of JSDE. He investigates mechanisms creating insect abilities and develops small robots such as a butterfly-style flapping robot, vertical wall climbing robot, on-water running robot, etc. based on insect scale physics.
Peer Review: The original of this article has been submitted to The 3rd International Conference on Design Engineering and Science (ICDES 2014), held at Pilsen, Czech Republic. The Paper Award Committee of ICDES 2014 has reviewed and selected this paper for journal publication.
250 Masahiro Shindo, Taro Fujikawa, and Koki Kikuchi
Recommended
![Dynamics and flight control of a flapping- wing robotic ... · aerodynamics of flapping-wing flight [8,13–15]. Despite having achieved stable flight, the flapping-wing robot in](https://img.pdfslide.us/doc/110x75/5e232a06436fd7265e4f446b/dynamics-and-flight-control-of-a-flapping-wing-robotic-aerodynamics-of-flapping-wing.jpg)