Analysis of IGCC-Based Plantswith Carbon Capture for an Efficient and
Flexible Electric Power Generation
vorgelegt von
Diplom-Ingenieur, geb. in Berlin
Max Sorgenfrei
von der Fakultät III – Prozesswissenschaften
der Technischen Universität Berlin
zur Erlangung des akademischen Grades
Doktor der Ingenieurwissenschaften
-Dr.-Ing.-
genehmigte Dissertation
Promotionsausschuss
Vorsitzender: Prof. Dr.-Ing. F. Ziegler
Gutachter: Prof. Dr.-Ing. G. Tsatsaronis
Gutachter: Prof. Dr.-Ing. H. Spliethoff
Tag der wissenschaftlichen Aussprache: 15.03.2016
Berlin 2016


Acknowledgement
This work was generated during the period of time I was working as a research as-
sociate at the Department of Energy Engineering and Environmental Protection of
the Berlin Institute of Technology (Technische Universität Berlin). I really enjoyed
the teaching and supervision of students as well as the pleasant and constructive
atmosphere.
I am very thankful to Prof. George Tsatsaronis for having offered the supervision
of this thesis. He always had an open door and supported me at all times. I would also
like to thank Prof. Hartmut Spliethoff for having reviewed this thesis as a specialist in
the field of electric power generation from solid fuels.
I truly appreciate the enjoyable and fruitful discussions with my colleagues Berit
Erlach, Jan Eggers, Andreas Christidis, Mathias Hofmann, Sebastian Spieker, Mathias
Penkuhn, Timo Blumberg, Pieter Mergenthaler, Peter Sahlmann, and the students
Daniela Koch, Victor Adolfo Romo Ibarra. I will always miss the time we spent together.
I am also grateful to Suzanne Linehan Winter for having reviewed the spelling and
grammar. I learned a lot and appreciate the warm and constructive atmosphere.
Finally, I would like to thank my family. Thanks to my lovely wife Eva, my son
Leonard, and my daughter Elisabeth for always supporting me and giving me the
strength to carry on. I would like to thank my beloved mother for having given me this
opportunity and for her unconditional love, support, and encouragement.
i


ZusammenfassungIn der vorliegenden Arbeit werden Potentiale zur effizienten und flexiblen Stromerzeug-
ung auf Basis von kohlegefeuerten Gas- und Dampfkraftwerken (IGCC - Integrated
gasification combined cycle) mit CO2-Abscheidung untersucht.
Als Bewertungsgrundlage dient sowohl ein effizientes als auch ein kostengünstiges
kommerziell verfügbares IGCC. Thermodynamische Ineffizienzen werden zuerst ba-
sierend auf einer konventionellen Exergieanalyse für das effiziente IGCC identifiziert.
Die Ergebnisse zeigen, dass der Vergaser und danach die synthesegasgefeuerte Ga-
sturbinenbrennkammer wichtige Komponenten für den Gesamtprozess darstellen.
Im Rahmen der erweiterten Exergieanalyse werden die Irreversibilitäten einerseits
in einen vermeidbaren und unvermeidbaren Anteil sowie andererseits in einen en-
dogenen und exogenen Anteil untergliedert. So wird etwa die Hälfte der Ineffizien-
zen des Vergasers durch andere Anlagenkomponeten verursacht (exogener Anteil).
Abschließend werden die Kombinationen aus beiden Unterteilungen ermittelt und
bewertet. Aufgrund des großen Einflusses der Gasturbine, wird diese detailliert nach
dem aktuellen Stand der Technik modelliert. Zum besseren Verständnis wurden 12
charakteristische Ineffizienzen der Gasturbine identifiziert und bewertet.
Eine vielversprechende Weiterentwicklung der verfügbaren IGCC-Technologie stellt
die Verbrennung nach dem Verfahren Chemical-Looping Combustion (CLC) dar. Dabei
wird der Luftsauerstoff mittels Metallpartikel, die als Sauerstoffträger dienen, über
einen Redox-Kreislauf an den Brennstoff abgegeben. Dadurch werden die Irreversibili-
täten der Verbrennung gesenkt und die CO2-Abscheidung erfolgt inherent. In dieser
Arbeit werden die für Synthesegas potentiell geeignetsten Sauerstoffträger Nickel-
und Eisenoxid bei verschiedenen Temperaturen untersucht und verschiedene Ver-
gasertypen sowie Konfigurationen des CLC-Verfahrens analysiert. So kann etwa die
Regeneration des Sauerstoffträgers mittels Wasserdampf und Luft erfolgen. Durch die
Reduktion des Wasserdampfes entsteht Wasserstoff, welcher anschließend in einer
Gasturbine genutzt wird. Im Besonderen liegt ein Schwerpunkt auf der Optimierung
des integrierten Wärmemanagements. Die Ergebnisse zeigen ein relativ geringes Po-
tential zur Steigerung des Gesamtwirkungsgrades.
Der wirtschaftliche Betrieb von IGCC-Anlagen kann durch eine Flexibilisierung verbes-
sert werden. Dabei wird die Produktion des Synthesegases kontinuierlich betrieben
und lediglich die Stromerzeugung wird flexibel in Abhängigkeit des Stromerlöses ge-
fahren. Nach einer weiteren Aufreinigung des Synthesegases, besteht das Synthesegas
nahezu ausschließlich aus Wasserstoff und bietet damit ein hohes wirtschaftliches
Potential. Der Gewinn wird basierend auf relevanten Einflussfaktoren abgeschätzt.
iii


Abstract
In this work, systems based on the Integrated gasification combined cycle (IGCC) tech-
nology with carbon capture are analyzed regarding an efficient and flexible electric
power generation.
All analysis are related to a high-efficiency or low-cost IGCC base case with carbon
capture which are both commercially available. In the high-efficiency base case, ther-
modynamic inefficiencies are determined based on a conventional exergy analysis.
The gasifier followed by the combustion chamber of the gas turbine running on syngas
are rated to the largest inefficiencies. Based on an advanced exergy analysis, the ineffi-
ciencies are split into an avoidable and unavoidable part as well as an endogenous
and exogenous part. For example, it was found that about half of the inefficiencies
within the gasifier are caused by other components of the overall system (exogenous
part). Further investigations on the combination of both splitting types are presented.
The gas turbine system is identified to be a major component and therefore a detailed
model was developed using state-of-the-art technologies. Based on this model, 12
types of characteristic inefficiencies were determined and rated by their exergy de-
struction.
Chemical-Looping Combustion (CLC) is one of the most promising technologies to
enhance the available IGCC design. CLC uses composite metal particles acting as an
oxygen carrier to transport oxygen from the air to the fuel gas through a redox-cycle.
Thus, the inefficiencies associated with the combustion process decrease and the
application of physical absorption for capturing CO2 is replaced by an inherent CO2-
capture. In this work, the most suitable oxygen carriers for CLC using syngas (nickel
oxide and iron oxide) are analyzed at different temperatures. Moreover, different types
of gasifier as well as CLC reactor designs are analyzed. Regenerating the oxygen carrier
by steam and air, produces additional hydrogen from the reduction of steam which
is further combusted within the gas turbine. Particularly, the development of the
novel process design focuses on optimizing the heat exchanger network under specific
constraints. The final results show a minor potential for improvement.
Economic benefits are potentially generated by a transition from a base load to a
flexible operation of IGCC plants. In this process, the operation of the syngas produc-
tion path remains constant while the generation of electricity depends on the market
price. Subsequent to an additional purification of the common syngas, the product
gas consists of almost pure hydrogen which can be sold in times of low electricity
prices. The profit is estimated considering major relevant impact factors.
v


Contents
Acknowledgement . . . . . . . . . . . . . . . . . . . . . . . . . . . . . . . . . . iZusammenfassung . . . . . . . . . . . . . . . . . . . . . . . . . . . . . . . . . . iiiAbstract . . . . . . . . . . . . . . . . . . . . . . . . . . . . . . . . . . . . . . . . . vNomenclature . . . . . . . . . . . . . . . . . . . . . . . . . . . . . . . . . . . . . ix
1 Introduction 11.1 Challenges of Clean Electricity Production . . . . . . . . . . . . . . . . . 11.2 Motivation and Scope of This Work . . . . . . . . . . . . . . . . . . . . . 2
2 State of Research 72.1 Carbon Capture and Utilization . . . . . . . . . . . . . . . . . . . . . . . 72.2 Integrated Gasification Combined Cycle . . . . . . . . . . . . . . . . . . 9
2.2.1 Process Design and Benchmark . . . . . . . . . . . . . . . . . . . 92.2.2 Gasification Technology and Polygeneration . . . . . . . . . . . . 162.2.3 Experiences of Commercial IGCC Power Plants . . . . . . . . . . 17
2.3 Gas Turbine System . . . . . . . . . . . . . . . . . . . . . . . . . . . . . . . 182.4 Chemical-Looping Combustion . . . . . . . . . . . . . . . . . . . . . . . 19
2.4.1 Fundamentals . . . . . . . . . . . . . . . . . . . . . . . . . . . . . . 192.4.2 Research on CLC-Based Systems . . . . . . . . . . . . . . . . . . . 23
2.5 Flexible Electric Power Generation . . . . . . . . . . . . . . . . . . . . . . 25
3 Methodology 273.1 Thermodynamic Analysis . . . . . . . . . . . . . . . . . . . . . . . . . . . 27
3.1.1 Energy Analysis . . . . . . . . . . . . . . . . . . . . . . . . . . . . . 273.1.2 Conventional Exergy Analysis . . . . . . . . . . . . . . . . . . . . . 283.1.3 Advanced Exergy Analysis . . . . . . . . . . . . . . . . . . . . . . . 30
3.2 Cost Estimation . . . . . . . . . . . . . . . . . . . . . . . . . . . . . . . . . 333.3 Software and Simulation . . . . . . . . . . . . . . . . . . . . . . . . . . . . 34
4 Modeling 394.1 Overview of Cases and Subsystems . . . . . . . . . . . . . . . . . . . . . . 394.2 Basic Assumptions . . . . . . . . . . . . . . . . . . . . . . . . . . . . . . . 404.3 Steam Cycle . . . . . . . . . . . . . . . . . . . . . . . . . . . . . . . . . . . 41
4.3.1 Equation-Based Model . . . . . . . . . . . . . . . . . . . . . . . . . 414.3.2 Integrated Heat Management . . . . . . . . . . . . . . . . . . . . . 43
vii
Contents
4.4 Gas Turbine System . . . . . . . . . . . . . . . . . . . . . . . . . . . . . . . 484.4.1 Determination of Inefficiencies . . . . . . . . . . . . . . . . . . . . 484.4.2 Gas Turbine Model . . . . . . . . . . . . . . . . . . . . . . . . . . . 494.4.3 Cases Running on Different Fuels . . . . . . . . . . . . . . . . . . 51
4.5 Reference IGCC with Pre-Combustion Decarbonisation . . . . . . . . . 554.5.1 High-Efficiency IGCC Using a Shell Gasifier . . . . . . . . . . . . 554.5.2 Low-Cost IGCC Using a GEE Gasifier . . . . . . . . . . . . . . . . 59
4.6 IGCC Using Chemical-Looping Combustion . . . . . . . . . . . . . . . . 634.6.1 Modeling of the CLC System . . . . . . . . . . . . . . . . . . . . . 644.6.2 IGCC Using a Two-Reactor CLC Unit . . . . . . . . . . . . . . . . 644.6.3 IGCC Using a Three-Reactor CLC Unit . . . . . . . . . . . . . . . 71
4.7 Operation Under Off-Design Conditions . . . . . . . . . . . . . . . . . . 77
5 Results and Discussion 815.1 Inefficiencies of the Reference IGCC . . . . . . . . . . . . . . . . . . . . . 81
5.1.1 Energy Analysis . . . . . . . . . . . . . . . . . . . . . . . . . . . . . 825.1.2 Conventional Exergy Analysis IGCC-1 . . . . . . . . . . . . . . . . 835.1.3 Advanced Exergy Analysis IGCC-1 . . . . . . . . . . . . . . . . . . 85
5.2 Inefficiencies of the Gas Turbine System . . . . . . . . . . . . . . . . . . 905.3 Improvement of the Overall Net Efficiency . . . . . . . . . . . . . . . . . 95
5.3.1 IGCC Using a Two-Reactor CLC Unit . . . . . . . . . . . . . . . . 955.3.2 IGCC Using a Three-Reactor CLC Unit . . . . . . . . . . . . . . . 975.3.3 Comparison of the Analyzed Cases . . . . . . . . . . . . . . . . . 100
5.4 Operation with High Electricity Price Volatility . . . . . . . . . . . . . . . 1045.4.1 Flexible Operation of the Reference IGCC . . . . . . . . . . . . . . 1045.4.2 Costs of Hydrogen . . . . . . . . . . . . . . . . . . . . . . . . . . . 107
6 Conclusions and Outlook 111
Bibliography 115
A Temperature Profiles and Flow Diagrams 129
B Exergy Analysis 135
C Off-Design 141
viii
Nomenclature
Nomenclature
Roman symbols
A m2 heat transfer area
b - coefficient NTU method
c∗ - coefficient NTU method
C kW/K heat capacity flow rate
cga % cold gas efficiency
D m diameter
E MW exergy flow rate
ED MW rate of exergy destruction
EL MW rate of exergy loss
h kJ/kg mass-specific enthalpy
h kJ/kg mole-specific enthalpy
H i MJ/kg lower heating value (inferior)
Hs MJ/kg higher heating value (superior)
H MW enthalpy flow rate
m - number of system components
m kg/s mass flow rate
n - polytropic exponent
n kmol/s mole flow rate
p bar pressure
Q MW rate of heat transfer
R kJ/(kmol K) universal gas constant
Re - Reynolds number
s kJ/(kg K) mole-specific entropy
SL - longitudinal pitch
ST - transversal pitch
T °C, K temperature
U W/(m2 K) heat transfer coefficient
v m3/kg specific volume
W MW mechanical or electrical power
x kmol/kmol mole fraction
x kgsteam/kgtot steam quality
yD % exergy destruction ratio
ix
Contents
Greek symbols
α - correction factor wetness
∆ - difference
ε % exergetic efficiency
ε % heat transfer effectiveness
ηpol % polytropic efficiency
ηs % isentropic efficiency
µ - exponent for off-design correlation
Subscripts
0 refers to ambient or design conditions
ar as-received
c compressor
cv control volume
el electric
F fuel
g gaseous
i element index
j stream of matter or heat transfer index
k system component index
l liquid
maf moisture- and ash-free
P product
r system component index
ref reference
SKE german standard coal trading unit
t turbine
tot total
Superscripts
AV avoidable
CH chemical
x
Nomenclature
EN endogenous
EX exogenous
mexo mexogenous
PH physical
sat saturated
UN unavoidable
Abbreviations
abLA german apportionment for interruptible loads
AC air compressor
AGR acid gas removal
AR air reactor
ASU air separation unit
BAFA german federal office for economic affairs and export control
BGL British Gas Lurgi
CC combined cycle
CC combustion chamber
CCS carbon capture and storage
CCU carbon capture and utilization
CEPCI Chemical Engineering plant cost index
CFD computational fluid dynamics
CLC chemical-looping combustion
CNG compressed natural gas
COT combustor outlet temperature
DCL direct chemical-looping
DEPG dimethyl ether of polyethylene glycol
DOE U.S. Energy Information Association
ECBM enhanced coal bed methane
Eco economizer
EEG german renewable energies law
EES Engineering Equation Solver
EGR enhanced gas recovery
EIA U.S. Department of Energy
EOR enhanced oil recovery
FGD flue gas desulfurization
xi
Contents
FR fuel reactor
GEE General Electric Energy
GT gas turbine
HGCU hot gas cleaning unit
HGD hot gas desulfurization
HP high pressure
HRSG heat-recovery steam generator
HT-WGS high-temperature water gas shift
IAPWS International Association for the Properties of Water and Steam
IEA International Energy Agency
IGCC integrated gasification combines cycle
IGFC integrated gasification fuel cell
IGT Institute of Gas Technology
IP intermediate pressure
ISO International Organization for Standardization
LNG liquefied natural gas
LP low pressure
LPG liquefied petroleum gas
LT-WGS low-temperature water gas shift
M metal
MCFC molten carbonate fuel cell
MO metal oxide
NETL U.S. National Energy Technology Laboratory
NGGT gas turbine running on syngas
NIST National Institute of Standards and Technology
NTU number of transfer units
O&M operating and maintenance
OTM oxygen transfer membrane
PBI polybinzimidazole polymer membrane
PC pulverized coal
PC-SAFT perturbed chain statistical association fluid theory
PSA pressure swing adsorption
R&D research and development
RKS-BM Redlich-Kwong-Soave with Boston-Matthias alpha function
SCOT Shell Claus off-gas treating
SGT gas turbine running on natural gas
xii
Nomenclature
SMR steam methane reforming
SNG substitute natural gas
SOFC solid oxide fuel cell
SPECO specific exergy costing
SR steam reactor
STIG steam-injected gas turbine
TBC thermal barrier coating
TCI total capital investment
TIT turbine inlet temperature
TREMP® Topsøe’s recycle methanation process
WGS water gas shift
xiii

List of Figures
1.1 Temperature development through the IGCC-based systems. . . . . . . 31.2 Annual load curve of a flexible IGCC plant producing electricity or hy-
drogen. . . . . . . . . . . . . . . . . . . . . . . . . . . . . . . . . . . . . . . 4
2.1 Schematic of an Integrated Gasification Combined Cycle (IGCC). . . . 102.2 Range of overall net efficiencies (based on Hi) for coal-based technologies. 112.3 Flow diagram of the Selexol® process. . . . . . . . . . . . . . . . . . . . . 132.4 Applications of gasification technology. . . . . . . . . . . . . . . . . . . . 172.5 Schematic of CLC using a) two-reactors and b) three-reactors. . . . . . 202.6 Range of overall net efficiencies (based on Hi) for coal-fuelled CLC systems. 24
3.1 Options for splitting the exergy destruction within a component in anadvanced exergy analysis. . . . . . . . . . . . . . . . . . . . . . . . . . . . 31
3.2 Structure chart of the entropy calculation in EES. . . . . . . . . . . . . . 36
4.1 Flow diagram of the steam cycle of case IGCC-1. . . . . . . . . . . . . . . 454.2 Temperature profiles of the heat transfer (case IGCC-1). . . . . . . . . . 464.3 Flow diagram of the gas turbine system. . . . . . . . . . . . . . . . . . . . 504.4 Temperature and cooling/ sealing air of the turbine stages. . . . . . . . 534.5 T-s diagram of the gas turbine system (SGT case): (left) overall, (right)
first turbine stage. . . . . . . . . . . . . . . . . . . . . . . . . . . . . . . . . 554.6 Flow diagram of the IGCC plant with carbon capture using a Shell gasifier
(case IGCC-1). . . . . . . . . . . . . . . . . . . . . . . . . . . . . . . . . . . 564.7 Flow diagram of the IGCC plant with carbon capture using a GEE gasifier
(case IGCC-2). . . . . . . . . . . . . . . . . . . . . . . . . . . . . . . . . . . 614.8 Temperature profiles of the heat transfer within case IGCC-2. . . . . . . 634.9 Flow diagram of the IGCC plant using a two-reactor CLC unit and a Shell
gasifier. . . . . . . . . . . . . . . . . . . . . . . . . . . . . . . . . . . . . . . 664.10 Temperature profiles of heat transfer (case CLC-Ni3). . . . . . . . . . . . 674.11 Flow diagram of the IGCC plant using a two-reactor CLC unit and a BGL
gasifier. . . . . . . . . . . . . . . . . . . . . . . . . . . . . . . . . . . . . . . 694.12 Temperature profiles of heat transfer (case CLC-Ni5). . . . . . . . . . . . 704.13 Flow diagram of the IGCC plant using a three-reactor CLC unit and a
Shell gasifier. . . . . . . . . . . . . . . . . . . . . . . . . . . . . . . . . . . . 734.14 Temperature profiles of heat transfer (case CLC-Fe1). . . . . . . . . . . . 75
xv

List of Figures
4.15 Flow diagram of the IGCC plant using a three-reactor CLC unit and aBGL gasifier. . . . . . . . . . . . . . . . . . . . . . . . . . . . . . . . . . . . 76
4.16 Temperature profiles of heat transfer (case CLC-Fe3). . . . . . . . . . . . 784.17 Off-design characteristic of the gas turbine used in the case IGCC-2 (acc.
to [157]). . . . . . . . . . . . . . . . . . . . . . . . . . . . . . . . . . . . . . 79
5.1 Detailed results of the conventional exergy analysis (case IGCC-1). . . . 845.2 Unavoidable and avoidable exergy destruction (case IGCC-1). . . . . . 865.3 Endogenous and exogenous exergy destruction (case IGCC-1). . . . . . 875.4 Unavoidable, avoidable endogenous and avoidable exogenous exergy
destruction (case IGCC-1). . . . . . . . . . . . . . . . . . . . . . . . . . . . 905.5 Results of the advanced exergy analysis for the gasifier and GT combus-
tion chamber presented by the exergy destruction ratio yD in [%] (caseIGCC-1). . . . . . . . . . . . . . . . . . . . . . . . . . . . . . . . . . . . . . 91
5.6 Hierarchy of inefficiencies ordered by their exergy destruction (caseIGCC-1). . . . . . . . . . . . . . . . . . . . . . . . . . . . . . . . . . . . . . 92
5.7 Exergy destruction of some inefficiencies within the combustion cham-ber and gas turbine (case IGCC-1). . . . . . . . . . . . . . . . . . . . . . . 93
5.8 Exergy flow diagram of the gas turbine system running on syngas (caseIGCC-1). . . . . . . . . . . . . . . . . . . . . . . . . . . . . . . . . . . . . . 94
5.9 Power distribution and overall net efficiency of the analyzed cases usinga two-reactor CLC system. . . . . . . . . . . . . . . . . . . . . . . . . . . . 95
5.10 Power distribution and overall net efficiency of the analyzed cases usinga three-reactor CLC design. . . . . . . . . . . . . . . . . . . . . . . . . . . 98
5.11 Overall net efficiencies of the analyzed cases. . . . . . . . . . . . . . . . 1005.12 Exergy destruction and loss ratios at the subsystem level of selected cases.1015.13 Exergy destruction ratios within the CLC unit of case CLC-Ni3 and CLC-
Fe1. . . . . . . . . . . . . . . . . . . . . . . . . . . . . . . . . . . . . . . . . 1025.14 Exergy destruction ratios of the steam cycle (case IGCC-1, CLC-Ni3 and
CLC-Fe1). . . . . . . . . . . . . . . . . . . . . . . . . . . . . . . . . . . . . . 1035.15 Flow diagram of the steam cycle of case IGCC-2 under design and off-
design conditions. . . . . . . . . . . . . . . . . . . . . . . . . . . . . . . . 1065.16 T-s diagram of the steam turbine under design and off-design conditions.1075.17 Hydrogen operation costs for the analyzed cases. . . . . . . . . . . . . . 109
1.1 Temperature profiles of heat transfer within the IGCC plant using atwo-reactor CLC and a Shell gasifier (Case CLC-Ni1). . . . . . . . . . . . 129
1.2 Temperature profiles of heat transfer within the IGCC plant using atwo-reactor CLC and a Shell gasifier (Case CLC-Ni2). . . . . . . . . . . . 130
1.3 Temperature profiles of heat transfer within the IGCC plant using atwo-reactor CLC and a Shell gasifier (Case CLC-Ni4). . . . . . . . . . . . 130
1.4 Temperature profiles of heat transfer within the IGCC plant using athree-reactor CLC and a Shell gasifier (case CLC-Fe2). . . . . . . . . . . 131
1.5 Temperature profiles of heat transfer within the IGCC plant using athree-reactor CLC and a BGL gasifier (Case CLC-Fe4). . . . . . . . . . . 131
xvi

List of Figures
1.6 Temperature profiles of heat transfer within the IGCC plant using athree-reactor CLC and a BGL gasifier (Case CLC-Fe5). . . . . . . . . . . 132
1.7 Flow diagram of the steam cycle of the cases featuring a Shell gasifierand a 2 reactor CLC unit. . . . . . . . . . . . . . . . . . . . . . . . . . . . . 133
1.8 Flow diagram of the steam cycle of the cases featuring a Shell gasifierand a 3 reactor CLC unit. . . . . . . . . . . . . . . . . . . . . . . . . . . . . 134
xvii

List of Tables
2.1 Physical properties of the oxygen carriers in reduction reactions [30, 80]. 222.2 Abilities of various large-scale power plants. . . . . . . . . . . . . . . . . 25
3.1 Specifications for the cost analysis. . . . . . . . . . . . . . . . . . . . . . . 34
4.1 Specifications of the analyzed cases. . . . . . . . . . . . . . . . . . . . . . 404.2 Basic assumptions of all cases. . . . . . . . . . . . . . . . . . . . . . . . . 414.3 Assumptions of the subsystem auxiliaries [6]. . . . . . . . . . . . . . . . 424.4 Fixed and adjusted parameters from literature (case NGGT). . . . . . . 524.5 Simulation results for the selected flows of case IGCC-1. . . . . . . . . . 574.6 Assumptions of case IGCC-1. . . . . . . . . . . . . . . . . . . . . . . . . . 584.7 Assumptions of case IGCC-2 . . . . . . . . . . . . . . . . . . . . . . . . . 604.8 Simulation results for the selected flows of case IGCC-2. . . . . . . . . . 624.9 Simulation results for the selected flows of case CLC-Ni3. . . . . . . . . 674.10 Simulation results for the selected flows of case CLC-Ni5. . . . . . . . . 704.11 Assumptions of cases using a BGL gasifier or a HGD unit. . . . . . . . . 714.12 Simulation results for selected flows of the case CLC-Fe1. . . . . . . . . 744.13 Simulation results for selected flows of the case CLC-Fe3. . . . . . . . . 77
5.1 Power distribution of the reference cases based on Hi,ar in [%]. . . . . . 825.2 Results obtained from the conventional exergy analysis for the aggre-
gated subsystems (case IGCC-1.) . . . . . . . . . . . . . . . . . . . . . . . 835.3 Results of the advanced exergy analysis for gasifier and the GT combus-
tion chamber concerning the interactions on subsystem level in [MW](case IGCC-1). . . . . . . . . . . . . . . . . . . . . . . . . . . . . . . . . . . 88
5.4 Selected results of the analyzed cases using a two-reactor CLC system. 965.5 Selected results of the analysed cases using a three-reactor CLC system. 995.6 Power distribution of the IGCC plant using a GEE gasifier based on Hi,ar
in [%]. . . . . . . . . . . . . . . . . . . . . . . . . . . . . . . . . . . . . . . . 1055.7 Total capital investment (TCI) of the analyzed cases. . . . . . . . . . . . 108
2.1 Results of the conventional and advanced exergy analyses for the tencomponents with the highest exergy destruction in case IGCC-1. . . . . 135
2.2 Exergy destruction of all inefficiencies within the gas turbine system(case IGCC-1). . . . . . . . . . . . . . . . . . . . . . . . . . . . . . . . . . . 136
2.3 Results of the conventional exergy analyses for characteristic cases - part 1.137
xix
List of Tables
2.4 Results of the conventional exergy analyses for characteristic cases - part 2.138
3.1 State variables of the steam cycle under design (case IGCC-2) and off-design conditions (case IGCC-H2/IGCC-H2i) - part 1. . . . . . . . . . . 141
3.2 State variables of the steam cycle under design (case IGCC-2) and off-design conditions (case IGCC-H2/IGCC-H2i) - part 2. . . . . . . . . . . 142
xx
Chapter 1
Introduction
1.1 Challenges of Clean Electricity Production
One of today‘s major challenges is represented by the reduction of greenhouse gas
emissions to the environment as well as the depletion of fossil fuels. On that account,
CO2 was identified as being a pollutant which significantly facilitates global warming.
In the past, the CO2 emissions growth accelerated due to a higher energy demand
associated with rapid economic growth and an increase in the share of coal in the
global fuel mix. In the year 2012, about 45 % of the worldwide CO2 emissions from
fuel combustion derived from the combustion of carbon intensive coal [1]. On that ac-
count, especially bituminous coal accounts for nearly half of the world‘s coal reserves
[2], and will continue to play an important role in the future. The future trend in the
field of electricity generation tends to increase the worldwide share of low-emission
renewable energies while the use of low-emission nuclear energies strongly depend
on the governmental policy, respectively.
In 2010, the energy supply sector was responsible for approximately 35 % of the
total anthropogenic greenhouse gas emissions. Reducing the carbon intensity of the
electricity generation is a key component of cost-effective mitigation strategies in
achieving low-stabilization levels as decarbonization happens more rapidly than in
the industry, buildings, and transport sectors. [3]
Based on the scenario of global electricity production published by the Inter-
national Energy Agency (IEA), the future share of coal should in fact decrease by
6.7 %-points from the year 2011 to the year 2030 but the absolute coal consumption
should increase by 29.7 %. The overall consumption is strongly affected by the growth
of the non-OECD nations, where the demand for electricity will increase significantly
by 54 % [4]. The U.S. Energy Information Association (EIA) expects the world primary
1
Chapter 1 Introduction
energy consumption to increase by about 30 % by the year 2030, while the electricity
generation doubles [5]. Today a lot of energy providers intensify their investments
into technologies using natural gas as prices have decreased the last couple of years
which is mainly maintained by an increasing shale gas production. However, coal is
still the most abundant and least expensive fossil fuel for electric power generation.
A reduction of greenhouse gas emissions can be realized by multiple options, like
e.g. efficiency improvements in energy conversion, transmission, distribution, as well
as fuel switching. Another suitable solution is represented by using carbon capture.
The effect of storing the captured CO2 depends on the type of storage. In the long
term, a conversion into carbonates can be a useful option. The storage in depleted
fossil fuel mining areas and other underground regions represents another possibility
but still a competition to other storage materials, such as natural gas, and potentially
high emission rate to the environment remain. In this process, public acceptance is
one of the major challenges because leakages potentially cause rapid CO2 emissions
that substitute oxygen and in this way may cause fatalities. Further utilization of CO2
should be preferred in order to replace carbon from fossil sources but still a lot of
research is required to find proper solutions. While all components of carbon capture
system are in use today by the fossil fuel extraction and refining industry, the success
of large-scale carbon capture technologies is subject to the price of CO2 emission
certificates.
Regarding the efficiency of coal-fired plants with CO2 capture, the U.S. Depart-
ment Of Energy (DOE) recommends that an electric power generation by Integrated
Gasification Combined Cycle (IGCC) power plants should be preferred over Pulverized
Coal (PC) steam power plants [6]. The U.S. DOE has further investigated different
setups and components of an IGCC plant with carbon capture. Using a Shell gasifier
and a dry syngas quench was found to be the most efficient option. From an economic
point of view, using a GEE radiant gasifier and a water quench represents the best
option [7].
1.2 Motivation and Scope of This Work
This work focuses on the future trend analysis of the IGCC technology. The results of
this analysis provide the fundamentals for generating an ecologically and economically
worthwhile policy framework. Accordingly, the overall efficiency and the economic
feasibility are the major challenges.
2
1.2 Motivation and Scope of This Work
1 2 3 4 5 6 7 8 9 10 11 12 130
300
600
900
1,200
1,500
1,800
Path through the system
Tem
pera
ture
[°C
]Conventional Enhanced path A Enhanced path B
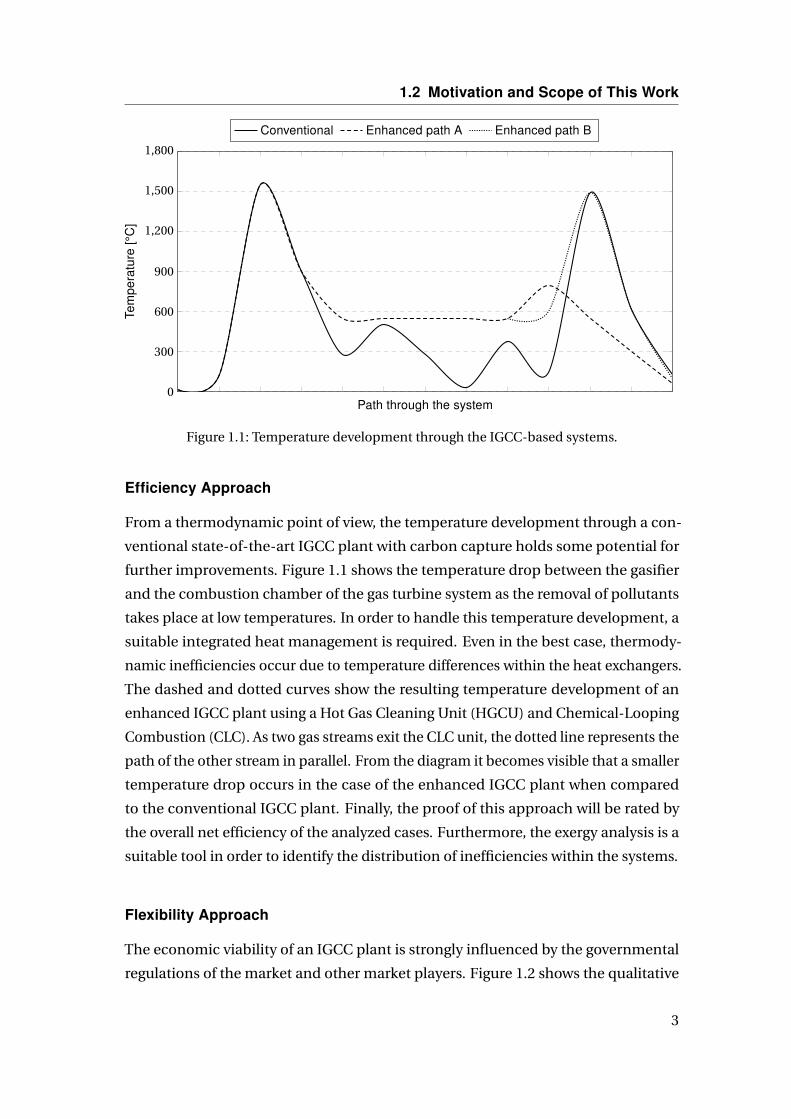
Figure 1.1: Temperature development through the IGCC-based systems.
Efficiency Approach
From a thermodynamic point of view, the temperature development through a con-
ventional state-of-the-art IGCC plant with carbon capture holds some potential for
further improvements. Figure 1.1 shows the temperature drop between the gasifier
and the combustion chamber of the gas turbine system as the removal of pollutants
takes place at low temperatures. In order to handle this temperature development, a
suitable integrated heat management is required. Even in the best case, thermody-
namic inefficiencies occur due to temperature differences within the heat exchangers.
The dashed and dotted curves show the resulting temperature development of an
enhanced IGCC plant using a Hot Gas Cleaning Unit (HGCU) and Chemical-Looping
Combustion (CLC). As two gas streams exit the CLC unit, the dotted line represents the
path of the other stream in parallel. From the diagram it becomes visible that a smaller
temperature drop occurs in the case of the enhanced IGCC plant when compared
to the conventional IGCC plant. Finally, the proof of this approach will be rated by
the overall net efficiency of the analyzed cases. Furthermore, the exergy analysis is a
suitable tool in order to identify the distribution of inefficiencies within the systems.
Flexibility Approach
The economic viability of an IGCC plant is strongly influenced by the governmental
regulations of the market and other market players. Figure 1.2 shows the qualitative
3
Chapter 1 Introduction
Ele
ctric
ity s
pot p
rice
Equivalent hydrogen price
Max. availability
Operation costs IGCC plant
Profit from electricity production Additional profit from H2 productionE
lect
ricity
spo
t pric
e
(a)
(b)
Ele
ctric
ity s
pot p
rice (c)
Time
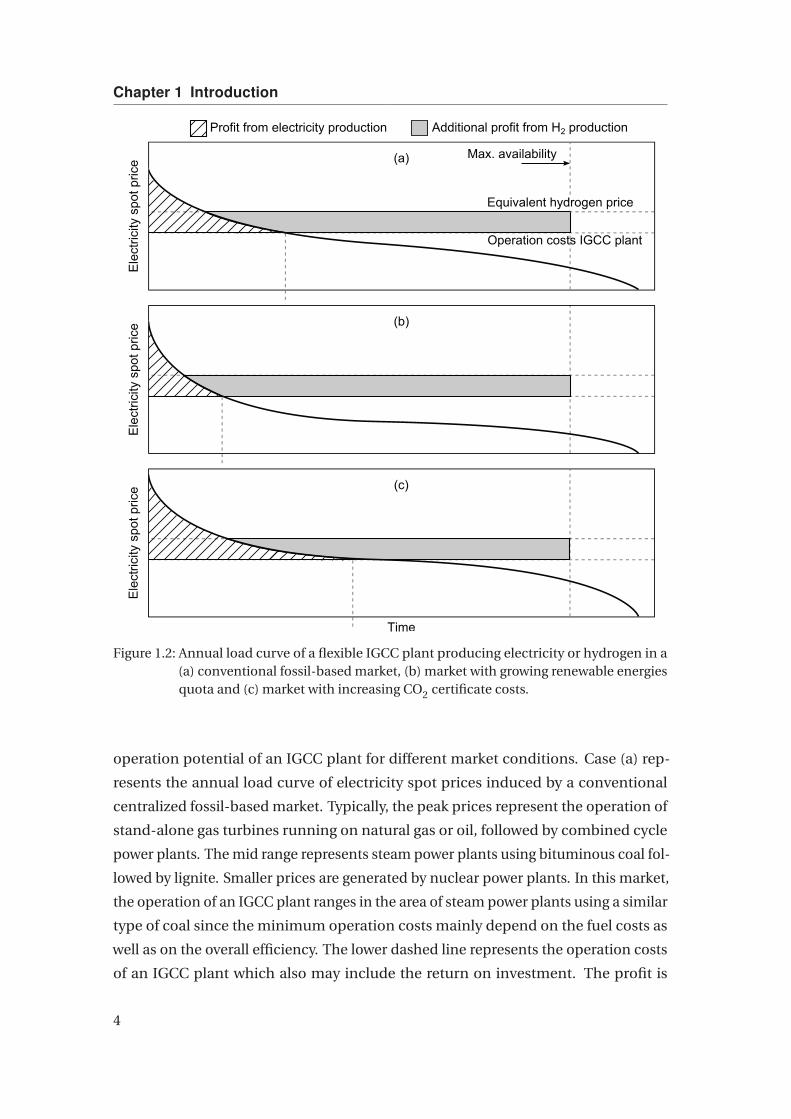
Figure 1.2: Annual load curve of a flexible IGCC plant producing electricity or hydrogen in a(a) conventional fossil-based market, (b) market with growing renewable energiesquota and (c) market with increasing CO2 certificate costs.
operation potential of an IGCC plant for different market conditions. Case (a) rep-
resents the annual load curve of electricity spot prices induced by a conventional
centralized fossil-based market. Typically, the peak prices represent the operation of
stand-alone gas turbines running on natural gas or oil, followed by combined cycle
power plants. The mid range represents steam power plants using bituminous coal fol-
lowed by lignite. Smaller prices are generated by nuclear power plants. In this market,
the operation of an IGCC plant ranges in the area of steam power plants using a similar
type of coal since the minimum operation costs mainly depend on the fuel costs as
well as on the overall efficiency. The lower dashed line represents the operation costs
of an IGCC plant which also may include the return on investment. The profit is
4
1.2 Motivation and Scope of This Work
generated by the difference of the electricity spot price and the operation costs as long
as the electricity spot prices is higher. In addition, some technical limitations causing
down time may further reduce the availability of units assumed in this diagram.
The upper dashed line represents the equivalent hydrogen price determined by
the hydrogen market price and the ratio of efficiencies producing either electricity or
hydrogen. The corresponding value strongly depends on the costs of natural gas as
today most of the available hydrogen is produced by Steam Methane Reforming (SMR).
In Germany, the resulting price is higher when compared to the operation costs of an
IGCC plant. By assuming a constant production of syngas, purified hydrogen can be
sold at times right to the intersection limited by the maximum availability of the IGCC
plant. In this way, additional profit can be generated by a flexible production.
Considering a market with growing renewable energies quota (case (b)), typically
the electricity spot prices decrease but the peak prices increase. This reduces the
operation time and, simultaneously, the profit of an IGCC plant which only generates
electric power. Finally, this scenario even more favors a flexible co-production of
hydrogen.
Case (c) represents an electricity market with increasing CO2 certificate costs. In
general, the prices increase due to the CO2 emissions of the technologies, respectively.
Particularly, the emissions depend on the fuel carbon fraction and the overall efficiency.
The increase of stand-alone gas turbines and steam power plants using bituminous
coal is supposed to be almost the same. Using lignite is even worse. Combined-cycle
power plants feature the highest efficiency resulting in a very small increase and
nuclear power plants operate with almost no CO2 emissions. The higher electricity
spot prices left to the intersection increase the profit from the electricity generation. A
flexible co-production of hydrogen is still advantageous but the additional profit is
smaller compared to the other scenarios.
Cases (b) an (c) show an opposing trend. Depending on the future policy frame-
work, the profit of commercial IGCC plants as well as the commitment of a flexible
hydrogen co-production can be advantageous.
5

Chapter 2
State of Research
2.1 Carbon Capture and Utilization
Generally, there are two strategies how to handle captured carbon dioxide. Carbon
Capture and Storage (CCS) refers to the storage in geological rock formations, depleted
oil and gas fields (on- and offshore), as well as saline aquifers. Carbon Capture and
Utilization (CCU) refers to the reuse of CO2 for synthetic products.
Carbon Capture
In the power industry, CO2 arises from the combustion or oxidation of hydrocarbons.
Especially processes using fossil fuels that have high specific CO2 emissions have great
potential to decrease the global CO2 emissions using carbon capture. Depending on
the overall efficiency and the carbon content of the fuel, lignite and bituminous coal
should be considered first. Commercially available capturing systems decrease the
overall efficiency by 8-10 %, including the transport to a storage location [8].
In general, CO2 capture can be performed by applying absorption, adsorption or
membranes. Pressure Swing Adsorption (PSA) is the most experienced process and
the use of membranes is still under research. The capture technologies are divided
into three superior groups:
• Pre-combustion capture:
CO2 gets captured from a reformed synthesis gas of an upstream gasification
unit prior to combustion. Typically, physical absorption is used at a high partial
pressure of CO2. Common physical solvents or processes are namely Selexol®,
Rectisol®, Purisol®, Sepasolv MPE, Fluor solvent, Sulfolane, and Estasolvan [6].
• Post-combustion capture:
CO2 gets captured from the flue gas stream subsequent to combustion. Typically,
7
Chapter 2 State of Research
chemical absorption is applied at a low partial pressure of CO2. Common
chemical reagents are namely MEA, DEA, DGA, TEA, DIPA, MDEA, and other
amines or carbonates [6]. Compared to pre-combustion capture, a larger unit
size is needed based on a larger volumetric flow rate, and the regeneration of
the acid gases from the solvent is more costly [9].
• Oxyfuel combustion:
The combustion process uses almost pure oxygen instead of air. Hence, the com-
bustion gas mainly consists of CO2 and H2O. By cooling and thereby condensing
the water vapor, CO2 can easily be separated. Usually, oxygen is provided by an
Air Separation Unit (ASU), and the CO2-rich flue gas stream is recycled to avoid
thermal damage within the steam generator [8].
Applying hybrid solvents is another possibility. They combine the high treated-gas
purity offered by chemical solvents with the flash regeneration ability and lower energy
requirements of physical solvents (e.g. Sulfinol®, Flexsorb® PS, and Ucarsol® LE) [6].
IGCC-based concepts apply pre-combustion capture which has been studied in
several demonstration projects. Since 2008, the Nakoso IGCC power station in Japan
has been conducting a feasibility study injecting the captured CO2 below the ocean
in a depleted gas reservoir. In 2009, the Polk Power IGCC plant started a CCS pilot
project capturing CO2 from a 30 % syngas side stream. The CO2 gets injected into a
saline formation more than 1500 m below the power station. In 2010, a R&D project
investigating the capture of CO2 was started at the Puertollano IGCC power plant.
In order to investigate an industrial-scale operation and obtain reliable economic
data, 2 % of the coal-derived syngas was used. A stream of 99.99 % pure hydrogen was
produced while 90 % carbon capture efficiency was obtained. [10]
Carbon Utilization
A significant amount of CO2 emissions can be avoided by using CCU when applying
a mix of several technologies. CO2 could be used as a source for the synthesis of
platform or bulk chemicals, as well as for increasing the utilization of manufacturing
polymers and fine chemicals. The production of urea and synthetic fuels, like e.g.
methanol, are already commercially available. Another option is represented by
refining the polyoligomer Oxymethylether-4. The synthesis is simple and, compared
to diesel, has the same properties, such as temperature stability. Since no particles
are formed during combustion, particulate filters are obsolete [11]. Usually, a high
purity of the exit CO2 stream is required when it is used in the chemical industry
8
2.2 Integrated Gasification Combined Cycle
because impurities may poison catalysts. Using unicellular organisms represents
another option to reuse captured CO2. Blue algae additionally needs solar radiation
to directly produce ethanol which can be used to substitute conventional gasoline.
Other organisms producing ethanol without the need for solar radiation are already
under research. Under certain circumstances, the production of Synthetic Natural Gas
(SNG) for the transport industry has some potential benefits. For the synthesis process
additional hydrogen is required, which could be produced by excessive renewable
energies.
Today, CO2 is used for Enhanced Oil Recovery (EOR), Enhanced Gas Recovery
(EGR), and Enhanced Coal Bed Methane (ECBM). By increasing the pressure within
the production field, the discharge flow rate increases when applying EOR or EGR.
The ECBM technology uses CO2 injected into a bituminous coal bed to occupy pore
space, and, subsequently, methane gets displaced for recovery. This technology is
particularly used for unminable coal seams. Today, in the western USA more than
2500 km of CO2 pipelines are operating to transport CO2 from natural gas sources to
EOR projects [12]. During the transport, the ambient temperature is decisive for the
aggregate state of CO2. Above the critical point it behaves like a liquid with respect to
its density and flow characteristic.
2.2 Integrated Gasification Combined Cycle
2.2.1 Process Design and Benchmark
General
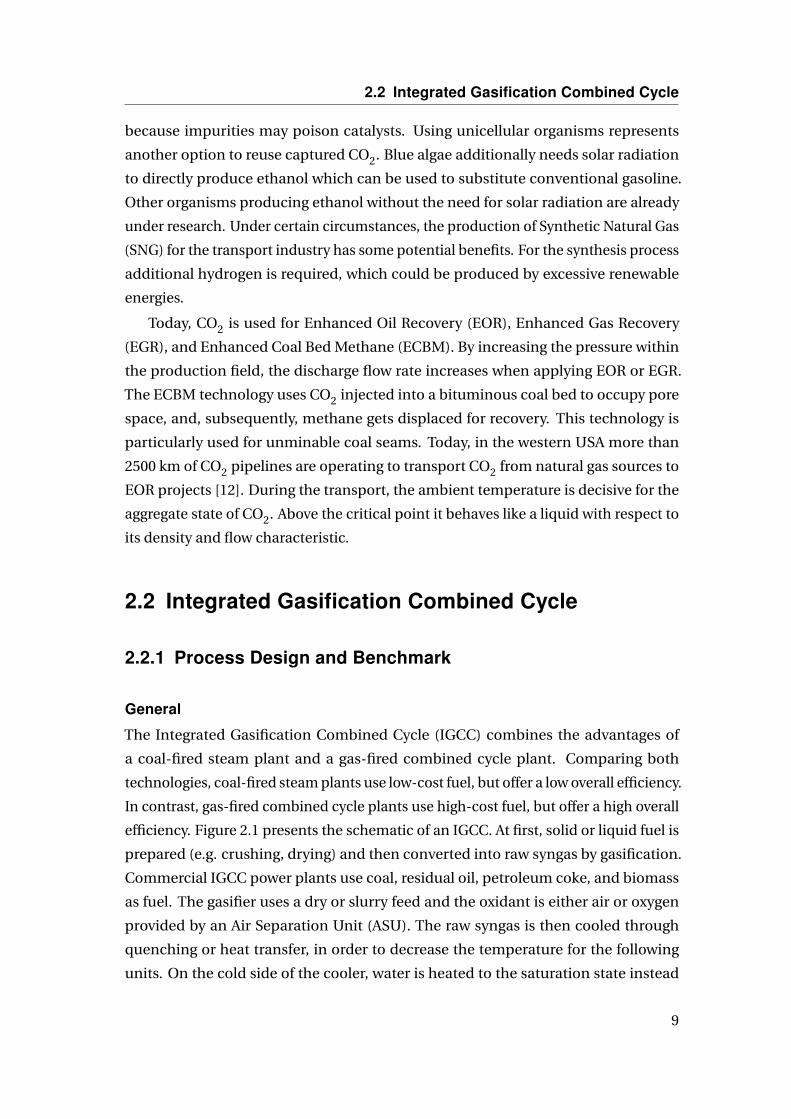
The Integrated Gasification Combined Cycle (IGCC) combines the advantages of
a coal-fired steam plant and a gas-fired combined cycle plant. Comparing both
technologies, coal-fired steam plants use low-cost fuel, but offer a low overall efficiency.
In contrast, gas-fired combined cycle plants use high-cost fuel, but offer a high overall
efficiency. Figure 2.1 presents the schematic of an IGCC. At first, solid or liquid fuel is
prepared (e.g. crushing, drying) and then converted into raw syngas by gasification.
Commercial IGCC power plants use coal, residual oil, petroleum coke, and biomass
as fuel. The gasifier uses a dry or slurry feed and the oxidant is either air or oxygen
provided by an Air Separation Unit (ASU). The raw syngas is then cooled through
quenching or heat transfer, in order to decrease the temperature for the following
units. On the cold side of the cooler, water is heated to the saturation state instead
9

Chapter 2 State of Research
FuelPpreparation
Gasifier
WGSreactor
AGRunit
FuelP(e.g.Pcoal)
ASU
CoolerGasPturbine
system HRSG
SteamPturbine
Vent
Air Heat
Pollutants
Offgas
Electricity
Steam
Figure 2.1: Schematic of an Integrated Gasification Combined Cycle (IGCC).
of producing thermodynamically preferred superheated steam. This decreases the
average temperature of the tube materials and thereby reduces the capital costs.
The relatively high fraction of sulfur and hydrogen within the product gas may also
cause serious problems with corrosion. Subsequently, an Acid Gas Removal (AGR)
unit removes pollutants like particulates, mercury, hadrogen sulfide (H2S), carbonyl
sulfide (COS), and optionally CO2 from the syngas. In case of applying carbon capture,
CO generated by the gasification process is shifted into CO2 and H2 through a Water
Gas Shift (WGS) reactor by additionally injecting steam. The arrangement of AGR unit
and WGS reactor depends on the application of a clean or sour shift configuration
which refers to the contact of H2S and the catalyst of the WGS reactor. The cleaned
syngas then gets fired in a gas turbine system producing electricity. Finally, the hot
flue gas of the gas turbine system is used to produce steam through a Heat-Recovery
Steam Generator (HRSG) in order to run a steam turbine.
An exergy-based rating of inefficiencies of an IGCC plant was performed several
times before [13–16]. In this work, a very detailed analysis is performed in order to
understand the shift of inefficiencies when novel technologies are integrated into the
conventional process. An advanced exergy analysis of the conventional process has
only been performed by the author.
System Integration
Generally, the ASU should be integrated into the IGCC process as much as possi-
ble to increase the overall efficiency [8]. Thereby the air flow needed by the ASU is
completely provided by the gas turbine compressor, and the nitrogen product flow
is totally expanded in the gas turbine. However, this yields a decrease in operational
flexibility. The advantage of the degree of integration depends on the operating pres-
10
2.2 Integrated Gasification Combined Cycle
IGCC IGCCcapture
PCcapture
Oxyfuelcapture
IGCCwith CLCcapture
IGCCmembrane
capture
IGFCcapture
25
30
35
40
45
50
55N
etef
ficie
ncy
base
don
Hi
[%]
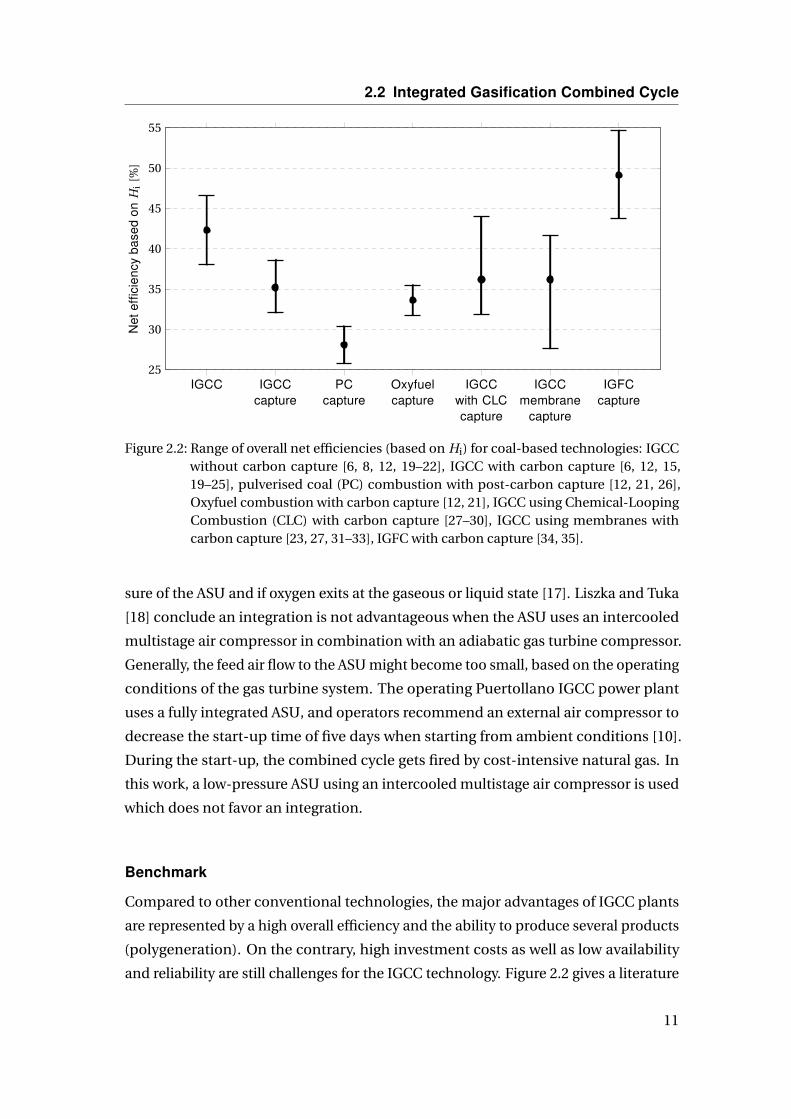
Figure 2.2: Range of overall net efficiencies (based on Hi) for coal-based technologies: IGCCwithout carbon capture [6, 8, 12, 19–22], IGCC with carbon capture [6, 12, 15,19–25], pulverised coal (PC) combustion with post-carbon capture [12, 21, 26],Oxyfuel combustion with carbon capture [12, 21], IGCC using Chemical-LoopingCombustion (CLC) with carbon capture [27–30], IGCC using membranes withcarbon capture [23, 27, 31–33], IGFC with carbon capture [34, 35].
sure of the ASU and if oxygen exits at the gaseous or liquid state [17]. Liszka and Tuka
[18] conclude an integration is not advantageous when the ASU uses an intercooled
multistage air compressor in combination with an adiabatic gas turbine compressor.
Generally, the feed air flow to the ASU might become too small, based on the operating
conditions of the gas turbine system. The operating Puertollano IGCC power plant
uses a fully integrated ASU, and operators recommend an external air compressor to
decrease the start-up time of five days when starting from ambient conditions [10].
During the start-up, the combined cycle gets fired by cost-intensive natural gas. In
this work, a low-pressure ASU using an intercooled multistage air compressor is used
which does not favor an integration.
Benchmark
Compared to other conventional technologies, the major advantages of IGCC plants
are represented by a high overall efficiency and the ability to produce several products
(polygeneration). On the contrary, high investment costs as well as low availability
and reliability are still challenges for the IGCC technology. Figure 2.2 gives a literature
11
Chapter 2 State of Research
overview of the overall net efficiencies based on the lower heating value Hi of the
IGCC compared to other competing coal-fired technologies. The presented efficiency
range incorporates different configurations and assumptions, such as the type of
gasifier or heat integration concept. Each mark represents the arithmetic average.
The average difference between the IGCC with and without carbon capture results to
7.1 %-points. Considering carbon capture, the IGCC outperforms thermodynamically
the Pulverized Coal (PC) technology used in conventional steam plants, as well as
the Oxyfuel concept. Increasing the overall efficiency of a conventional IGCC with
carbon capture is feasible by applying Chemical-Looping Combustion (CLC). From the
literature, a maximum efficiency of 44 % indicates the high potential of this technology.
However, a large-scale operation has not been tested so far. Further discussions are
presented in Section 2.4. Still being under research, the use of membranes within
the IGCC potentially increases the overall net efficiency to an upper limit of 41.6 %.
In general, membranes could be used in different subsystems. An Oxygen Transfer
Membrane (OTM) replaces the thermal separation column within the ASU [23, 32].
Other studies investigate the application within the WGS reactor or AGR unit [27, 31,
32]. By separating H2 through a high-temperature membrane, the steam demand of
the WGS reaction will decrease significantly [8]. Applying a Polybinzimidazole Polymer
Membrane (PBI) in order to separate CO2 from the syngas has been investigated by
Krishnan et al. [33]. However, the development of membranes is still challenging since
the almost similar size of molecules poses a huge obstacle for the development of
molecular sieve and dense polymer membranes. Additionally, the major challenge
for dense ceramic and metallic membranes are tolerances to syngas impurities, high
operating temperatures, and material instability [36].
Replacing the gas turbine system of an IGCC by a fuel cell significantly increases the
overall net efficiency [34, 35]. The resulting concept is called Integrated Gasification
Fuell Cell (IGFC). Due to the preferred high-temperature operation, systems using a
Solid Oxide Fuel Cell (SOFC) or Molten Carbonate Fuel Cell (MCFC) are potentially
useful. In literature, mostly concepts using SOFCs are analyzed. In the long term,
the use of SOFCs is reasonable, but in the near term, SOFCs in large-scale plant size
are not commercially available and combining a large number of SOFCs increases
the investment costs significantly. On the contrary, the largest fuel cell plant using
MCFCs has a net output of 59 MW [37]. Catalytic gasification is another promising
long-term technology. Compared to conventional gasification, the methane content
of the product gas increases which is advantageous for fuell cells like the SOFC [34].
12
2.2 Integrated Gasification Combined Cycle
Steam from HRSG
CO2
absorber
H2S absorber
CO2
M
M
Water
Acid gas to Claus plant
Sour gas from WGS unit
Clean gas
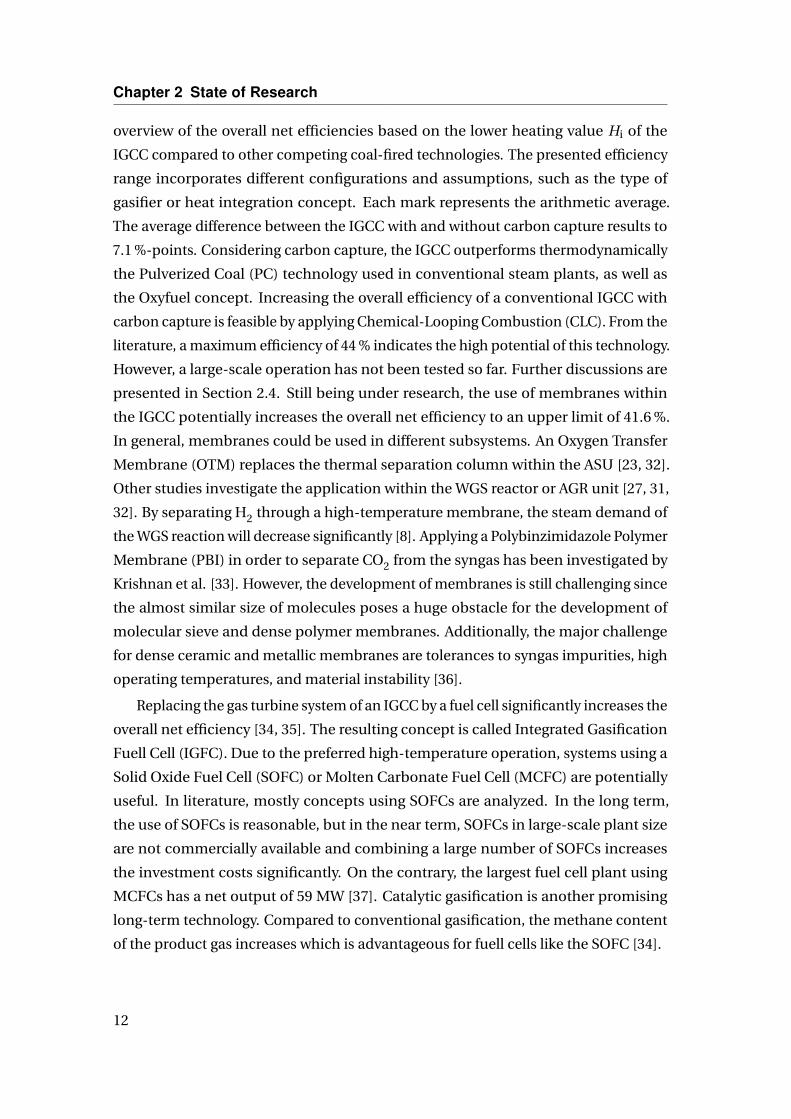
Figure 2.3: Flow diagram of the Selexol® process (according to [38, 39]).
Conventional Gas Cleaning
Compared to conventional PC steam plants, the removal of pollutants is much more
simple and cost-effective due to a smaller gas volume flow [6]. The major pollutants of
the raw syngas produced by gasification are mercury, ammonia, H2S, and COS. Fine
particulates are already captured by using a cyclone as well as a scrubber. For the
removal of mercury, usually activated, sulphur-impregnated carbon bed adsorption is
used prior to the H2S capture unit. In this work, the removal of mercury is not part
of the simulation because it has no significant impact on the syngas conditions. The
WGS reactor operates in the so-called sour CO shift, which denotes the removal of H2S
subsequent to the WGS reactor.
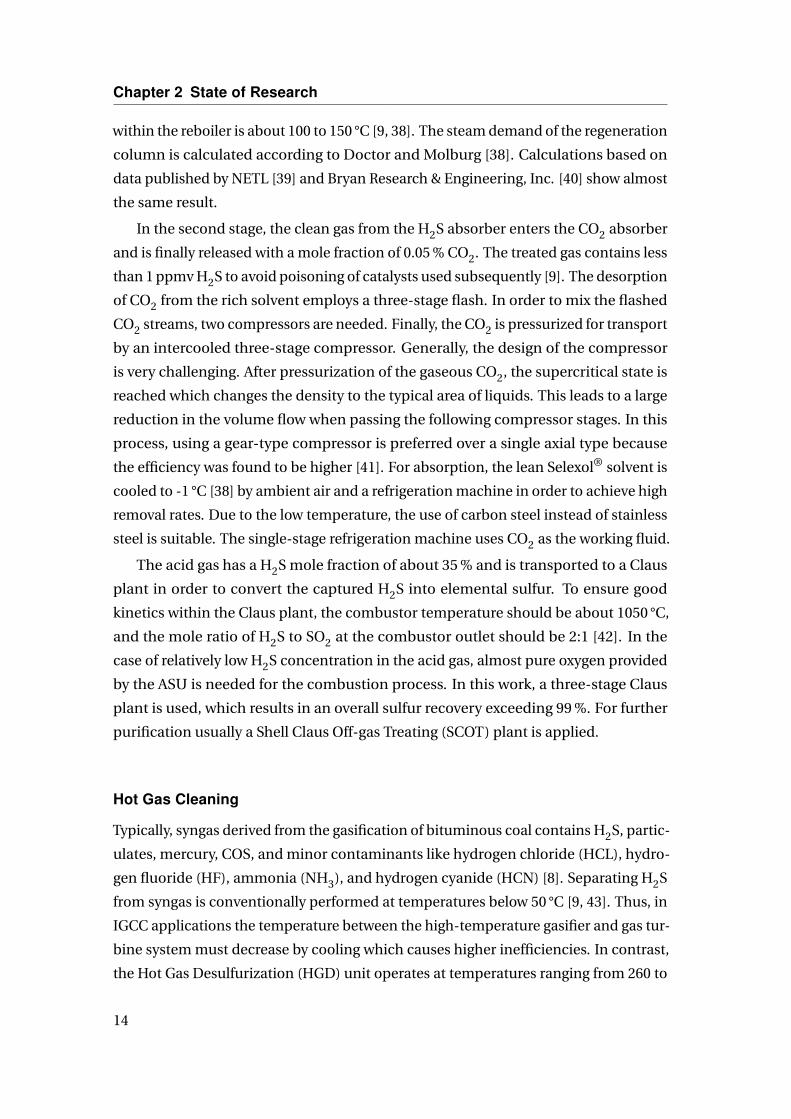
Figure 2.3 shows the flow diagram of the AGR unit used in this work. Depending on
the particular case, either the first stage or both stages are used. Within the first stage,
H2S is removed from the sour shift gas in a separation column by applying physical
absorption. In this work, the physical solvent Selexol®, licensed by the Union Carbide
Corporation, is applied as it has been used in a number of gasification applications
[9]. In general, there are many process designs possible. A H2S-rich acid gas stream
can be accomplished by using a H2S concentrator, which includes two flash stages
and a compressor to recycle the flash gas. A regeneration column has to be used
to separate the acid gas from the Selexol® solvent. The temperature of the solution
13
Chapter 2 State of Research
within the reboiler is about 100 to 150 °C [9, 38]. The steam demand of the regeneration
column is calculated according to Doctor and Molburg [38]. Calculations based on
data published by NETL [39] and Bryan Research & Engineering, Inc. [40] show almost
the same result.
In the second stage, the clean gas from the H2S absorber enters the CO2 absorber
and is finally released with a mole fraction of 0.05 % CO2. The treated gas contains less
than 1 ppmv H2S to avoid poisoning of catalysts used subsequently [9]. The desorption
of CO2 from the rich solvent employs a three-stage flash. In order to mix the flashed
CO2 streams, two compressors are needed. Finally, the CO2 is pressurized for transport
by an intercooled three-stage compressor. Generally, the design of the compressor
is very challenging. After pressurization of the gaseous CO2, the supercritical state is
reached which changes the density to the typical area of liquids. This leads to a large
reduction in the volume flow when passing the following compressor stages. In this
process, using a gear-type compressor is preferred over a single axial type because
the efficiency was found to be higher [41]. For absorption, the lean Selexol® solvent is
cooled to -1 °C [38] by ambient air and a refrigeration machine in order to achieve high
removal rates. Due to the low temperature, the use of carbon steel instead of stainless
steel is suitable. The single-stage refrigeration machine uses CO2 as the working fluid.
The acid gas has a H2S mole fraction of about 35 % and is transported to a Claus
plant in order to convert the captured H2S into elemental sulfur. To ensure good
kinetics within the Claus plant, the combustor temperature should be about 1050 °C,
and the mole ratio of H2S to SO2 at the combustor outlet should be 2:1 [42]. In the
case of relatively low H2S concentration in the acid gas, almost pure oxygen provided
by the ASU is needed for the combustion process. In this work, a three-stage Claus
plant is used, which results in an overall sulfur recovery exceeding 99 %. For further
purification usually a Shell Claus Off-gas Treating (SCOT) plant is applied.
Hot Gas Cleaning
Typically, syngas derived from the gasification of bituminous coal contains H2S, partic-
ulates, mercury, COS, and minor contaminants like hydrogen chloride (HCL), hydro-
gen fluoride (HF), ammonia (NH3), and hydrogen cyanide (HCN) [8]. Separating H2S
from syngas is conventionally performed at temperatures below 50 °C [9, 43]. Thus, in
IGCC applications the temperature between the high-temperature gasifier and gas tur-
bine system must decrease by cooling which causes higher inefficiencies. In contrast,
the Hot Gas Desulfurization (HGD) unit operates at temperatures ranging from 260 to
14
2.2 Integrated Gasification Combined Cycle
600 °C. The HDG unit is part of the Hot Gas Cleaning unit (HGCU), which represents
the overall section for gas cleaning. Compared to the conventional cold gas cleaning,
the application of an HGCU increases the overall efficiency by about 2.5 %-points
[44]. Typically, the HGD unit consists of a redox cycle where a metal circulates among
two interconnected fluidized-bed reactors. The oxides of the metal Zn, Fe, Cu, Mn,
Mo, Co and V are potentially promising but no single metal performs optimally as
a desulfurization sorbent [45]. Zinc oxide (ZnO) represents a highly suitable metal
for H2S capture because concentrations below 10 ppmv are obtainable and reactions
feature a high equilibrium constant. However, kinetics are very slow and ZnO may
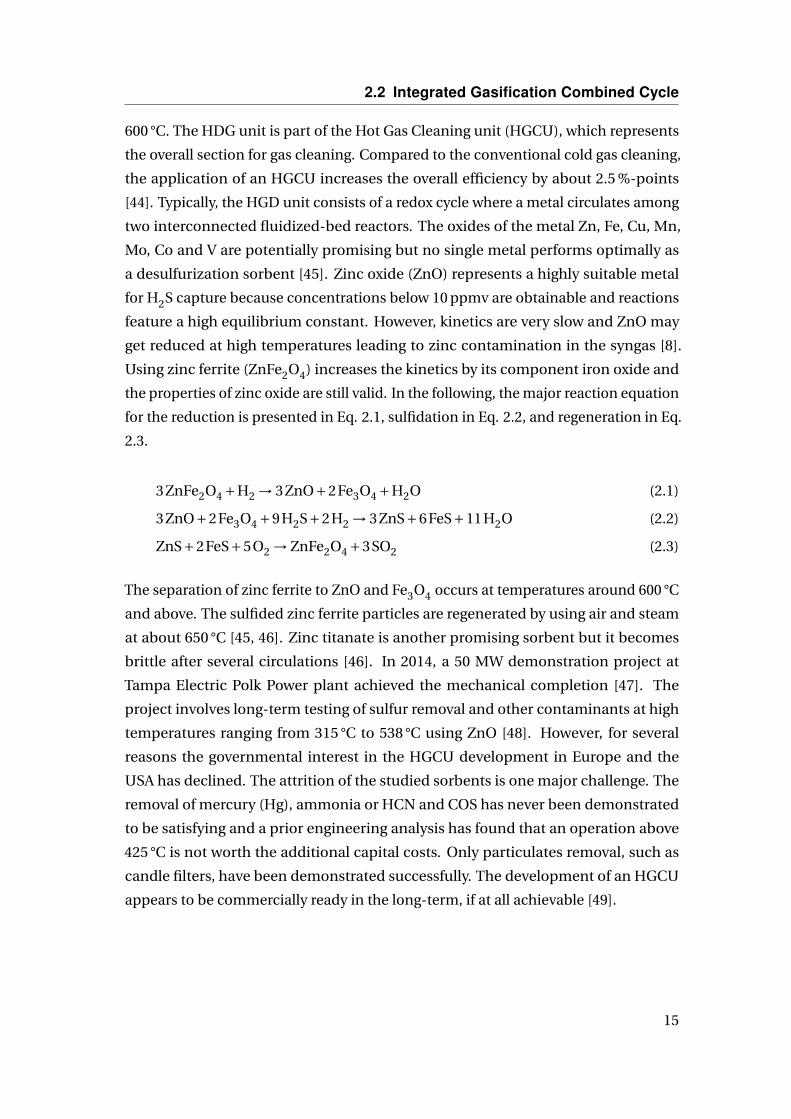
get reduced at high temperatures leading to zinc contamination in the syngas [8].
Using zinc ferrite (ZnFe2O4) increases the kinetics by its component iron oxide and
the properties of zinc oxide are still valid. In the following, the major reaction equation
for the reduction is presented in Eq. 2.1, sulfidation in Eq. 2.2, and regeneration in Eq.
2.3.
3ZnFe2O4 +H2 → 3ZnO+2Fe3O4 +H2O (2.1)
3ZnO+2Fe3O4 +9H2S+2H2 → 3ZnS+6FeS+11H2O (2.2)
ZnS+2FeS+5O2 → ZnFe2O4 +3SO2 (2.3)
The separation of zinc ferrite to ZnO and Fe3O4 occurs at temperatures around 600 °C
and above. The sulfided zinc ferrite particles are regenerated by using air and steam
at about 650 °C [45, 46]. Zinc titanate is another promising sorbent but it becomes
brittle after several circulations [46]. In 2014, a 50 MW demonstration project at
Tampa Electric Polk Power plant achieved the mechanical completion [47]. The
project involves long-term testing of sulfur removal and other contaminants at high
temperatures ranging from 315 °C to 538 °C using ZnO [48]. However, for several
reasons the governmental interest in the HGCU development in Europe and the
USA has declined. The attrition of the studied sorbents is one major challenge. The
removal of mercury (Hg), ammonia or HCN and COS has never been demonstrated
to be satisfying and a prior engineering analysis has found that an operation above
425 °C is not worth the additional capital costs. Only particulates removal, such as
candle filters, have been demonstrated successfully. The development of an HGCU
appears to be commercially ready in the long-term, if at all achievable [49].
15

Chapter 2 State of Research
2.2.2 Gasification Technology and Polygeneration
Classification of Gasifiers
In general, three reactor types are used for gasification: moving-bed (sometimes
called fixed-bed), fluidized-bed, and entrained-flow. About 75 % of the worldwide
gasified coal is converted into gas by moving-bed gasifiers with dry ash removal
[50]. Moving-bed gasifiers are characterized by long residence times, thereby the hot
sythesis gas of the gasification zone preheats and pyrolyzes the coal in a counter-
current arrangement. Compared to other gasfier types, the oxygen demand and
temperature is very low and the pyrolysis products are present in the product gas. The
discharge of ash is either dry or molten (slagging type) [51].
IGCC power plants mostly use entrained-flow gasifiers. The residence time of
the coal particles is short which leads to a smaller unit size. The major advantages
compared to other types are represented by the use of different types of coal, low
steam demand, production of almost oil and tar-free gases, high carbon conversion,
low methane fraction in the product gas, high flow capacity based on high reaction
rates, as well as easy discharge of molten slag [51]. On the other hand, additional
components like a mill and a dryer or slurry tank, are required. Compared to other
gasifier types, the cost of entrained-flow gasifiers may increase due to a high oxygen
demand and high operating temperature [51].
Fluidized-bed gasifiers offer a limited carbon conversion because a good mixing
of oxidant and feed ensures an even distribution of the material in the bed. Hence,
a lot of fluidized-bed gasifiers use a recycle. The temperature is moderate and stays
below the softening point of the ash, since ash slagging will interrupt the fluidized bed.
Recent IGCC power plants apply gasifiers of the moving-bed or entrained-flow type.
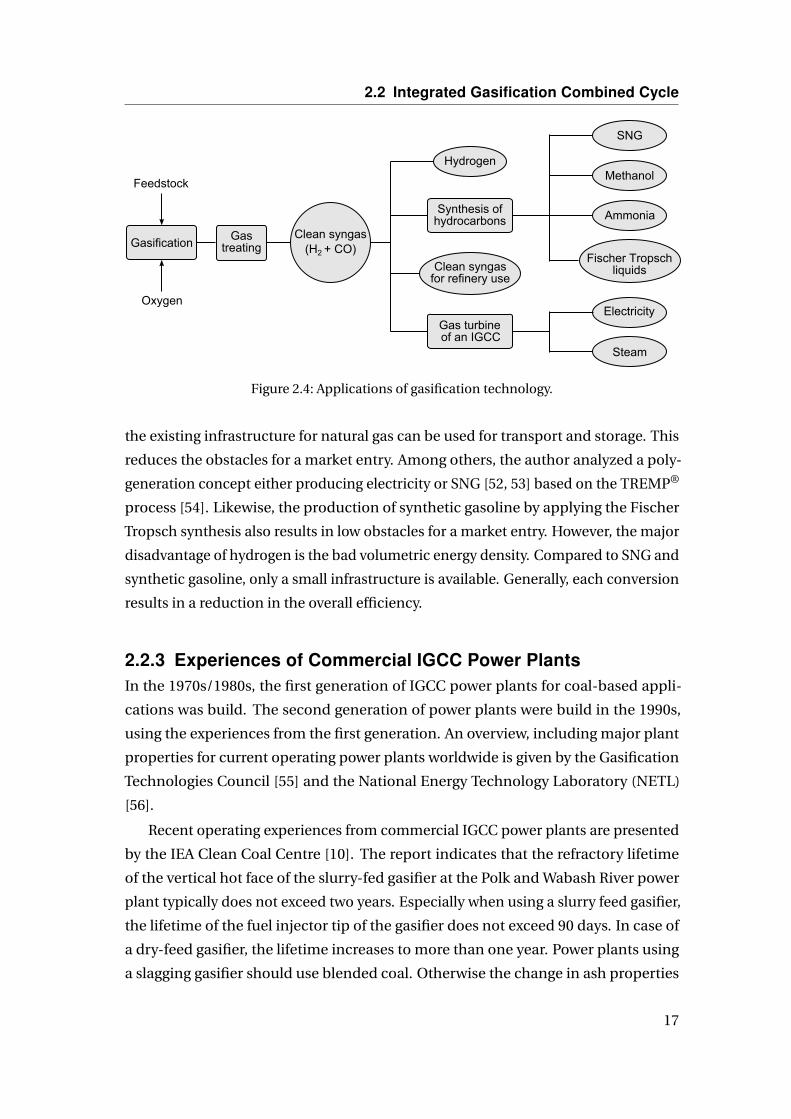
Polygeneration
According to the IGCC technology, polygeneration refers to systems that use gas de-
rived from coal or biomass gasification to generate basic products, secondary energy
products or electricity. Figure 2.4 gives an overview of potential gasification applica-
tions. Rectangular items represent processes, whereas round items represent material
products. The final product determines the process design and requirements. With
respect to a market with small peak electricity prices, the generation of electricity may
be enhanced by the production of a by-product. One of the most suitable options is
represented by the production of Substitute Natural Gas (SNG) because worldwide
16
2.2 Integrated Gasification Combined Cycle
Gasification
Feedstock
Oxygen
CleanMsyngas(H2M+MCO)
SynthesisMofMhydrocarbons
GasMturbineMofManMIGCC
CleanMsyngasforMrefineryMuse
Hydrogen
GasMtreating
Methanol
SNG
Ammonia
FischerMTropschliquids
Electricity
Steam
Figure 2.4: Applications of gasification technology.
the existing infrastructure for natural gas can be used for transport and storage. This
reduces the obstacles for a market entry. Among others, the author analyzed a poly-
generation concept either producing electricity or SNG [52, 53] based on the TREMP®
process [54]. Likewise, the production of synthetic gasoline by applying the Fischer
Tropsch synthesis also results in low obstacles for a market entry. However, the major
disadvantage of hydrogen is the bad volumetric energy density. Compared to SNG and
synthetic gasoline, only a small infrastructure is available. Generally, each conversion
results in a reduction in the overall efficiency.
2.2.3 Experiences of Commercial IGCC Power PlantsIn the 1970s/1980s, the first generation of IGCC power plants for coal-based appli-
cations was build. The second generation of power plants were build in the 1990s,
using the experiences from the first generation. An overview, including major plant
properties for current operating power plants worldwide is given by the Gasification
Technologies Council [55] and the National Energy Technology Laboratory (NETL)
[56].
Recent operating experiences from commercial IGCC power plants are presented
by the IEA Clean Coal Centre [10]. The report indicates that the refractory lifetime
of the vertical hot face of the slurry-fed gasifier at the Polk and Wabash River power
plant typically does not exceed two years. Especially when using a slurry feed gasifier,
the lifetime of the fuel injector tip of the gasifier does not exceed 90 days. In case of
a dry-feed gasifier, the lifetime increases to more than one year. Power plants using
a slagging gasifier should use blended coal. Otherwise the change in ash properties
17

Chapter 2 State of Research
may cause serious problems blocking the slag trap. Another option to overcome this
blockade is represented by the installation of a slag crusher to avoid outages of several
days. When applying a syngas cooler subsequent to the gasifier, the installation of
flexible tube connectors is recommended because vibration caused by changes in
the gasifier parameters may indicate leakages in the tubes. Particularly during the
start-up the top part of the syngas cooler can be blocked by fly ash deposits.
The Buggenum IGCC power plant has a considerable experience in biomass co-
gasification. The maximum biomass contribution of untreated wood was approxi-
mately 15 %, based on the heating value. When using biomass, the cold gas efficiency
of a high-temperature gasifier decreases because biomass gasification favors low tem-
peratures. Using a thermal pre-treatment of the biomass producing torrefied wood
increased the maximum contribution to 70 % [10]. The plant was shut down in April
2013 for economic reasons [55].
2.3 Gas Turbine System
In general, gas turbines are used for propulsion or electricity generation. For stationary
gas turbines, the electrical power generation ranges from only a few kW to more than
350 MW. Larger heavy-duty gas turbines are typically used in a simple or a combined
cycle mode for centralized electrical power generation. In the combined cycle mode,
the highest electrical net efficiency among all thermal energy conversion systems is
available, which is approximately 60 % based on the lower heating value [57]. Another
important ability is represented by its fast change in electricity generation due to a
worldwide increasing volatile production of renewable energies.
Compared to the well-known combustion of natural gas, the combustion of hydro-
gen and carbon monoxide involves a higher flame velocity, higher flame temperature
and wide flammability range, along with low ignition energy and low density which
may cause blowouts or flashbacks [10, 58]. The combustion of H2-rich fuel in gas
turbine systems has been demonstrated by General Electric in a full-scale combustor,
but the turbine design needed further development [59]. Until the year 2010, the
maximum volumetric content of hydrogen by volume used in F-class operation was
45 %, and in industrial operation up to 95 % [60]. Syngas produced by gasification in
common IGCC plants without carbon capture typically contains 12-38 vol-% of H2.
Problems concerning vibration and hot spots were detected and eliminated. Generally,
the firing temperature of a gas turbine running on syngas is about 110-170 °C lower
compared to the equivalent running on natural gas [10].
18

2.4 Chemical-Looping Combustion
Several studies [61–65] report on the exergy analysis of the compressor, combus-
tion chamber and turbine based on a simple gas turbine model according to ISO 2314
[66]. A more detailed conventional exergy analysis was performed by El-Masri [67] who
focused on the inefficiencies associated with the cooling system based on a simplified
three-stage gas turbine model. The results showed the trade-offs between decreasing
combustion losses and increasing turbine cooling losses affecting the overall efficiency.
Another study on the cooling system was performed by Khodak and Romakhova [68].
The inefficiencies were determined by splitting the total system into a topping cycle
producing electricity and a bottoming cycle representing the process management of
the cooling air flows. It was found that the inefficiencies within the cooling system
are caused by heat transfer between the main gas and coolant, the bottoming cycle
itself as well as mixing at different compositions. Staudacher and Zeller [69] evaluated
different setups of the secondary air system of an aircraft turbine supported by data
from Rolls-Royce. The study presents the results of a conventional exergy analysis
based on grouping characteristic inefficiencies focusing on the secondary air system.
This work focuses on the detailed modeling and evaluation of a heavy-duty gas
turbine system running on syngas derived from the gasification of bituminous coal
using subsequent CO2 capture. The detail level of the model is selected to give a distri-
bution of inefficiencies among all components divided by its characteristic sources.
To account for the real cooling system, the bleed air of the compressor is further split
into cooling and sealing parts. Basically, the developed model can be applied for the
combustion of any gaseous fuel which provides a sufficient heating value in order to
reach the firing temperature presented in Section 4.4.3.
2.4 Chemical-Looping Combustion
2.4.1 Fundamentals
Principle of CLC
The idea of using a redox cycle to decrease the inefficiencies of a combustion process
has been proposed by Knoche and Richter [70]. This technology is based on the
principle of energy conversion within the human organism. The human organism uses
a lot of organic intermediate reactions to convert food and oxygen into mechanical
work performed by the muscles. In technical applications, an inorganic matter should
be used. The technical fundamentals were introduced by the steam-iron process
19
Chapter 2 State of Research
Fuel reactor
Airreactor
M
MO
Fuel
Depleted air
Air
CO2+H2O
Fuel reactor
Steamreactor
M
MO
Fuel
Steam
CO2+H2O
Airreactor
Depleted air
Air
H2+ H2O
M+ MO
a) b)
Figure 2.5: Schematic of CLC using a) two-reactors and b) three-reactors.
[71] in the late 19th century. In this process, metallic fixed-bed reactors were used
to produce hydrogen from gaseous fuels. In 1949, Lewis and Gilliand [72] applied a
patent using a metal-based redox cycle in interconnected reactors for the production
of pure carbon dioxide. For the reduction of the metal oxides, a fluidized-bed or
moving-bed reactor can be potentially used. In 1987, Ishida et al. [73] introduced the
term Chemical-Looping Combustion (CLC), which can be understood as an oxyfuel
combustion without the need for air separation. Simultaneously, an inherent capture
of CO2 is possible which enables a higher carbon capture efficiency compared to a
post-combustion capture with a typical efficiency of 80 to 95 %. Higher efficiencies
require a larger unit size, causing higher costs and a greater loss in the overall net
efficiency [74]. Investigations on CLC started using gaseous fuels such as natural
gas and syngas produced by gasification of solid fuels. A general overview about the
development is given by Adanez et al. [75]. Later, the direct use of solid fuel like coal
and biomass was investigated [76]. Both also present the experimental status of CLC.
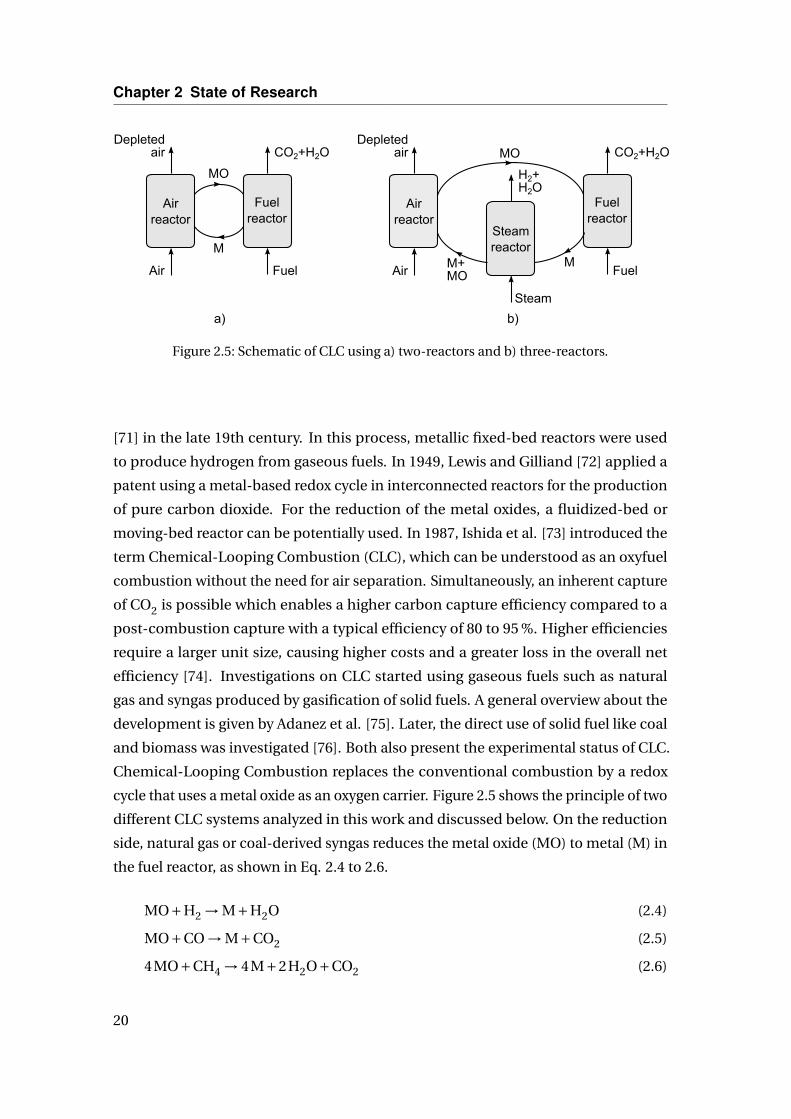
Chemical-Looping Combustion replaces the conventional combustion by a redox
cycle that uses a metal oxide as an oxygen carrier. Figure 2.5 shows the principle of two
different CLC systems analyzed in this work and discussed below. On the reduction
side, natural gas or coal-derived syngas reduces the metal oxide (MO) to metal (M) in
the fuel reactor, as shown in Eq. 2.4 to 2.6.
MO+H2 → M+H2O (2.4)
MO+CO → M+CO2 (2.5)
4MO+CH4 → 4M+2H2O+CO2 (2.6)
20
2.4 Chemical-Looping Combustion
On the oxidation side, the reduced metal is re-oxidized into a metal by using air or
steam, see Eq. 2.7 and 2.8. Using steam is preferred for the oxidation due to the
co-production of H2. However, a full regeneration of the metal is not possible when
using steam, therefore, further oxidation with oxygen or air is needed, resulting in a
three-reactor system. The minimum residual oxygen in the flue gas of an air reactor is
4 mol-% [77]. In this work, most of the reactors use a fluidized-bed, which has been
demonstrated in the pilot plant scale by the Institute of Gas Technology (IGT) [78].
M+H2O → MO+H2 (2.7)
2M+O2 → 2MO (2.8)
Unlike conventional combustion, at least two streams exit the CLC unit. Depleted air
exits a cyclone subsequent to the air reactor, and a mixture of CO2 and H2O exits the
fuel reactor. Due to the highly exothermic reactions taking place in the air reactor, the
hot depleted air can be used to produce steam or dilute the combustion gas of a gas
turbine system. It has to be taken into consideration that air reactor temperatures
above 1000 °C require the use of cost-intensive ceramic materials in the subsequent
cyclone instead of alloy steel which is more common. When using the three-reactor
system, an additional mixture of H2 and H2O exits the steam reactor because only part
of the steam can be converted into hydrogen. Depending on the reactor temperature,
the maximum conversion of H2O to H2 is 74.8 %, if only Fe was consumed [79]. By
cooling the mixture of CO2 and H2O in a heat-recovery steam generator (HRSG), the
water vapor condenses. Finally, high-purity CO2 exits the HRSG without the need for
a conventional absorption process. After compression, the CO2 is ready for transport
and sequestration. Usually the air reactor is operating as a riser, transporting the
oxygen carrier particles to the top level of the CLC unit. After being separated by
a cyclone, the particles drop to the fuel and steam reactor, forced by gravity. The
fuel gas and steam enter the reactor in the counter-current direction. Experimental
studies on CLC often use nitrogen or steam for sealing the interconnections among
the reactors. In this work, no auxiliaries for sealing are assumed because, so far, a
realistic estimation underlies large uncertainties.
Oxygen Carrier
A number of oxygen carriers have been proposed and tested for CLC. The oxygen
carrier particles mostly consist of a metal oxide and a support material. Some of
21
Chapter 2 State of Research
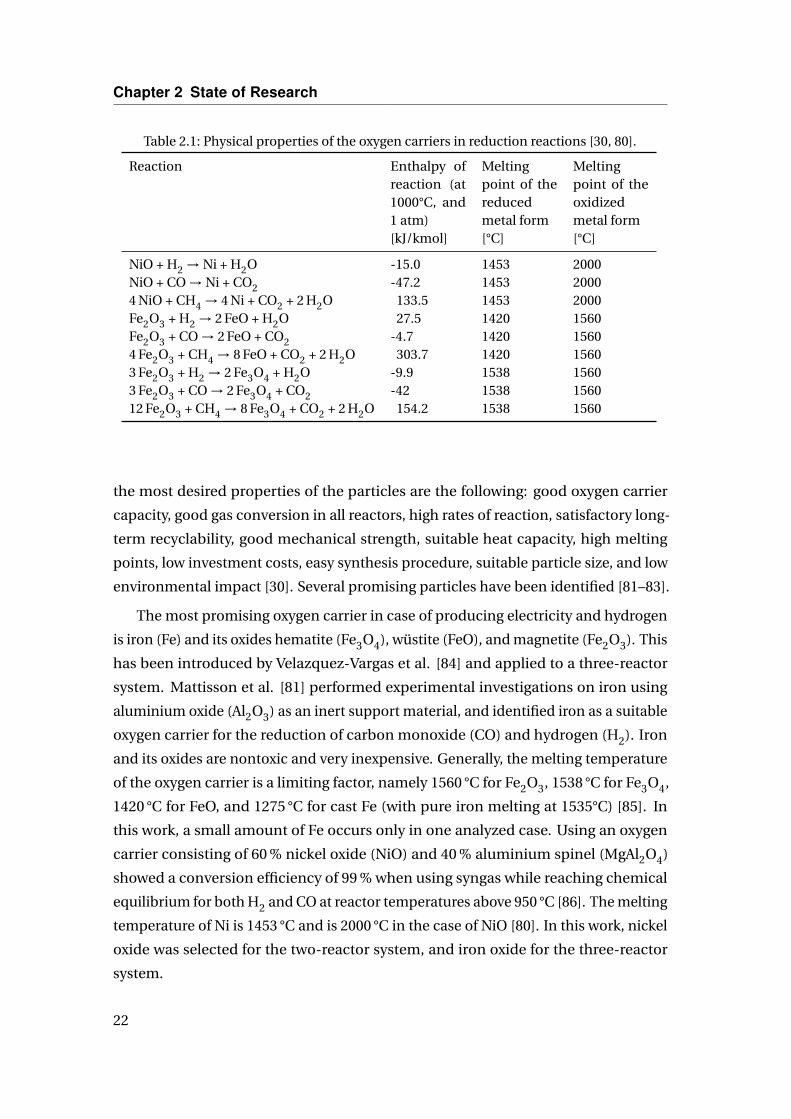
Table 2.1: Physical properties of the oxygen carriers in reduction reactions [30, 80].
Reaction Enthalpy ofreaction (at1000°C, and1 atm)
Meltingpoint of thereducedmetal form
Meltingpoint of theoxidizedmetal form
[kJ/kmol] [°C] [°C]
NiO + H2 → Ni + H2O -15.0 1453 2000NiO + CO → Ni + CO2 -47.2 1453 20004 NiO + CH4 → 4 Ni + CO2 + 2 H2O 133.5 1453 2000Fe2O3 + H2 → 2 FeO + H2O 27.5 1420 1560Fe2O3 + CO → 2 FeO + CO2 -4.7 1420 15604 Fe2O3 + CH4 → 8 FeO + CO2 + 2 H2O 303.7 1420 15603 Fe2O3 + H2 → 2 Fe3O4 + H2O -9.9 1538 15603 Fe2O3 + CO → 2 Fe3O4 + CO2 -42 1538 156012 Fe2O3 + CH4 → 8 Fe3O4 + CO2 + 2 H2O 154.2 1538 1560
the most desired properties of the particles are the following: good oxygen carrier
capacity, good gas conversion in all reactors, high rates of reaction, satisfactory long-
term recyclability, good mechanical strength, suitable heat capacity, high melting
points, low investment costs, easy synthesis procedure, suitable particle size, and low
environmental impact [30]. Several promising particles have been identified [81–83].
The most promising oxygen carrier in case of producing electricity and hydrogen
is iron (Fe) and its oxides hematite (Fe3O4), wüstite (FeO), and magnetite (Fe2O3). This
has been introduced by Velazquez-Vargas et al. [84] and applied to a three-reactor
system. Mattisson et al. [81] performed experimental investigations on iron using
aluminium oxide (Al2O3) as an inert support material, and identified iron as a suitable
oxygen carrier for the reduction of carbon monoxide (CO) and hydrogen (H2). Iron
and its oxides are nontoxic and very inexpensive. Generally, the melting temperature
of the oxygen carrier is a limiting factor, namely 1560 °C for Fe2O3, 1538 °C for Fe3O4,
1420 °C for FeO, and 1275 °C for cast Fe (with pure iron melting at 1535°C) [85]. In
this work, a small amount of Fe occurs only in one analyzed case. Using an oxygen
carrier consisting of 60 % nickel oxide (NiO) and 40 % aluminium spinel (MgAl2O4)
showed a conversion efficiency of 99 % when using syngas while reaching chemical
equilibrium for both H2 and CO at reactor temperatures above 950 °C [86]. The melting
temperature of Ni is 1453 °C and is 2000 °C in the case of NiO [80]. In this work, nickel
oxide was selected for the two-reactor system, and iron oxide for the three-reactor
system.
22

2.4 Chemical-Looping Combustion
The physical properties of the oxygen carriers NiO and Fe2O3 used in this work are
presented in Table 2.1. The single reactions including CO or H2 have an exothermic
characteristic except the reaction of Fe2O3 and H2. Reactions including H2 are merely
slightly exothermic compared to the reactions including CO. The syngas includes
methane (CH4) at relatively low concentrations only when using a BGL gasifier. The
reactions including CH4 have an endothermic characteristic.
2.4.2 Research on CLC-Based Systems
Anheden and Svedberg [87] conclude that a power plant using the two-reactor CLC
system has approximately the same efficiency compared to a conventional IGCC plant
without carbon capture. An exergy analysis of a CLC unit combined with a gas turbine
system was performed. Compared to a conventional combustion of the same fuel,
the exergy destruction decreases by about 12 % when using nickel oxide or iron oxide
as the oxygen carrier for the reduction of syngas which has a mole fraction of 51.7 %
CO and 29.2 % H2, provided by coal gasification [88]. Erlach and the author of this
work [89, 90] complemented this study by comparing the power plant using CLC with
a conventional IGCC plant with carbon capture. This work includes some further
changes in the assumptions and the flow diagram to satisfy a suitable comparison of
all analyzed cases based on stringent input parameters.
Figure 2.6 presents the overall net efficiencies for CLC-based IGCC concepts found
by other researchers. When using a two-reactor system consisting of a fuel and an air
reactor, higher efficiencies can be obtained when nickel oxide is used as the oxygen
carrier. The average efficiency is calculated to 33.9 %. The air reactor temperature
varies from 920 °C [28] to 1200 °C [27]. Mantripragada and Rubin [91] performed an
analysis of this system design by using an additional CO2 turbine subsequent to the
fuel reactor. Rezvani et al. [27] applied this system by using a double-stage CLC unit
and found an increase of the efficiency of about 1.5 %-points. In this case, additional
investment costs have to be considered. Cormos [28, 29] analyzed a CLC-based IGCC
concept using a two-reactor system which consisted of a fuel and a steam reactor. Iron
oxide is used as the oxygen carrier for the co-production of electricity and hydrogen.
When producing only electricity, the overall net efficiency increases to an average
value of 36.2 %. The efficiency mainly depends on the choice of gasifier type as well as
concept for cooling the syngas. Romano et al. [22] present a CLC-based IGCC concept,
using two fixed-bed reactors. The best pressure of a co-current reactor system was
found to be 20 bar. The overall net efficiency increased by 5.7 %-points, compared
23
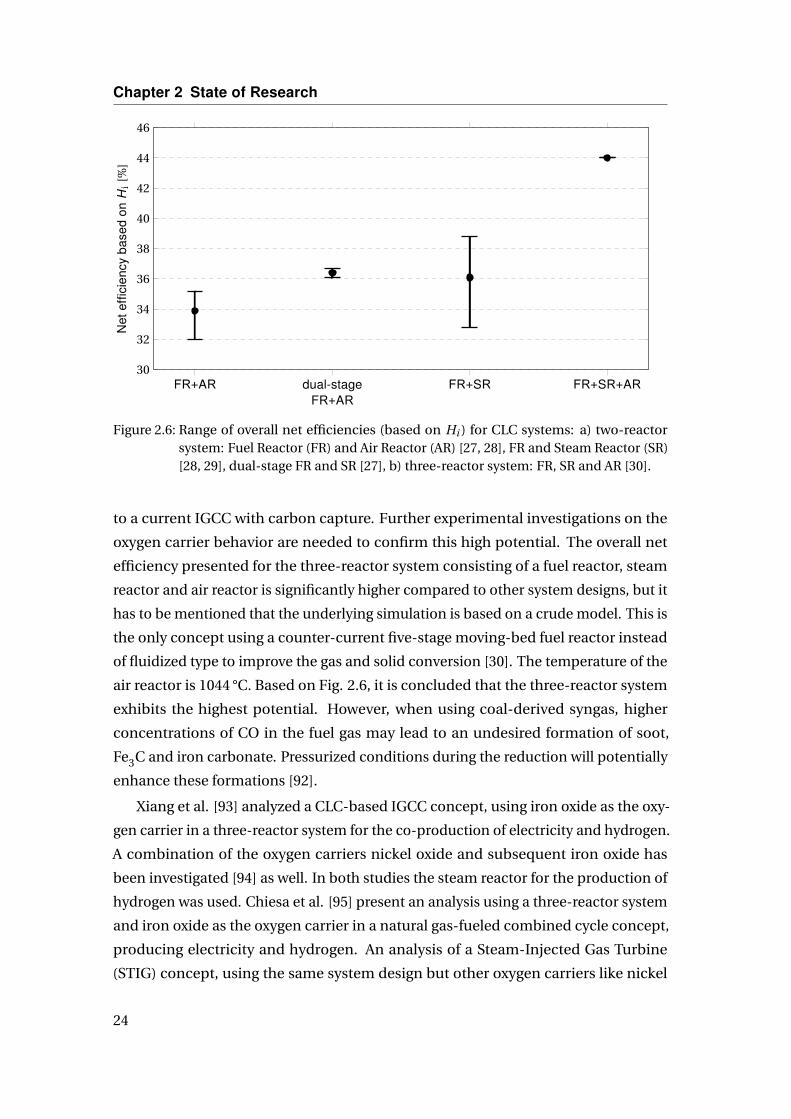
Chapter 2 State of Research
FR+AR dual-stageFR+AR
FR+SR FR+SR+AR30
32
34
36
38
40
42
44
46N
etef
ficie
ncy
base
don
Hi
[%]
Figure 2.6: Range of overall net efficiencies (based on Hi ) for CLC systems: a) two-reactorsystem: Fuel Reactor (FR) and Air Reactor (AR) [27, 28], FR and Steam Reactor (SR)[28, 29], dual-stage FR and SR [27], b) three-reactor system: FR, SR and AR [30].
to a current IGCC with carbon capture. Further experimental investigations on the
oxygen carrier behavior are needed to confirm this high potential. The overall net
efficiency presented for the three-reactor system consisting of a fuel reactor, steam
reactor and air reactor is significantly higher compared to other system designs, but it
has to be mentioned that the underlying simulation is based on a crude model. This is
the only concept using a counter-current five-stage moving-bed fuel reactor instead
of fluidized type to improve the gas and solid conversion [30]. The temperature of the
air reactor is 1044 °C. Based on Fig. 2.6, it is concluded that the three-reactor system
exhibits the highest potential. However, when using coal-derived syngas, higher
concentrations of CO in the fuel gas may lead to an undesired formation of soot,
Fe3C and iron carbonate. Pressurized conditions during the reduction will potentially
enhance these formations [92].
Xiang et al. [93] analyzed a CLC-based IGCC concept, using iron oxide as the oxy-
gen carrier in a three-reactor system for the co-production of electricity and hydrogen.
A combination of the oxygen carriers nickel oxide and subsequent iron oxide has
been investigated [94] as well. In both studies the steam reactor for the production of
hydrogen was used. Chiesa et al. [95] present an analysis using a three-reactor system
and iron oxide as the oxygen carrier in a natural gas-fueled combined cycle concept,
producing electricity and hydrogen. An analysis of a Steam-Injected Gas Turbine
(STIG) concept, using the same system design but other oxygen carriers like nickel
24
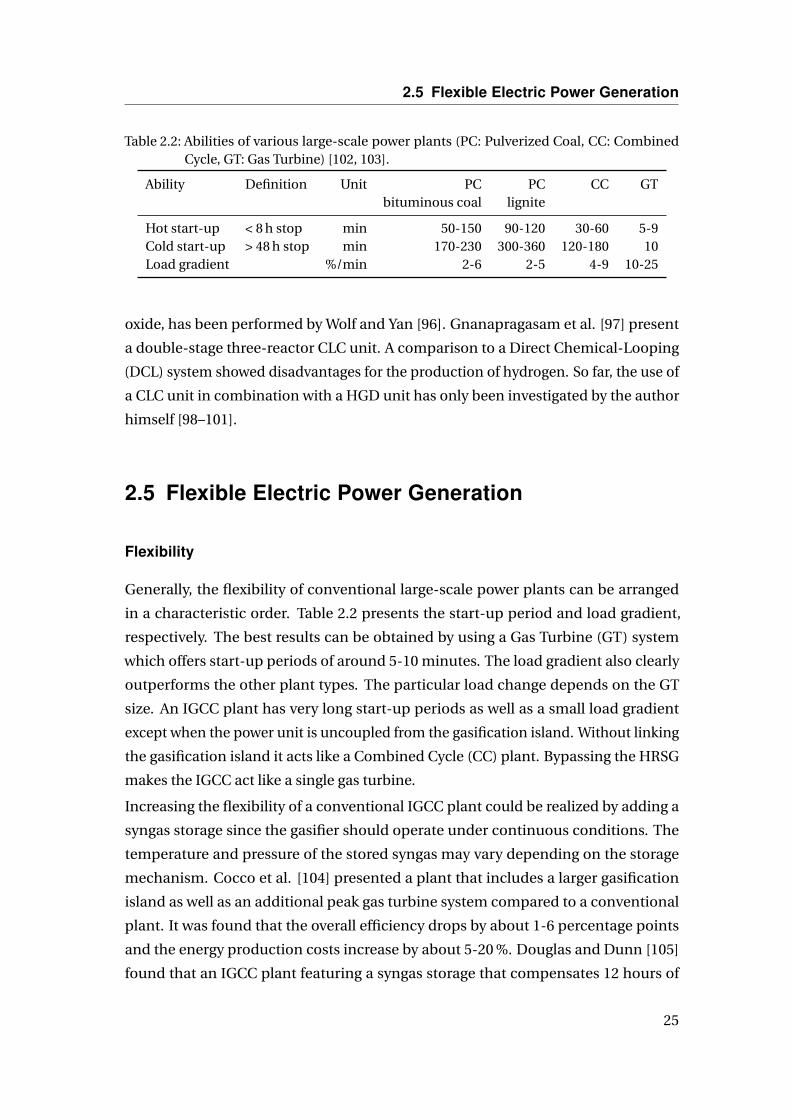
2.5 Flexible Electric Power Generation
Table 2.2: Abilities of various large-scale power plants (PC: Pulverized Coal, CC: CombinedCycle, GT: Gas Turbine) [102, 103].
Ability Definition Unit PC PC CC GTbituminous coal lignite
Hot start-up < 8 h stop min 50-150 90-120 30-60 5-9Cold start-up > 48 h stop min 170-230 300-360 120-180 10Load gradient %/min 2-6 2-5 4-9 10-25
oxide, has been performed by Wolf and Yan [96]. Gnanapragasam et al. [97] present
a double-stage three-reactor CLC unit. A comparison to a Direct Chemical-Looping
(DCL) system showed disadvantages for the production of hydrogen. So far, the use of
a CLC unit in combination with a HGD unit has only been investigated by the author
himself [98–101].
2.5 Flexible Electric Power Generation
Flexibility
Generally, the flexibility of conventional large-scale power plants can be arranged
in a characteristic order. Table 2.2 presents the start-up period and load gradient,
respectively. The best results can be obtained by using a Gas Turbine (GT) system
which offers start-up periods of around 5-10 minutes. The load gradient also clearly
outperforms the other plant types. The particular load change depends on the GT
size. An IGCC plant has very long start-up periods as well as a small load gradient
except when the power unit is uncoupled from the gasification island. Without linking
the gasification island it acts like a Combined Cycle (CC) plant. Bypassing the HRSG
makes the IGCC act like a single gas turbine.
Increasing the flexibility of a conventional IGCC plant could be realized by adding a
syngas storage since the gasifier should operate under continuous conditions. The
temperature and pressure of the stored syngas may vary depending on the storage
mechanism. Cocco et al. [104] presented a plant that includes a larger gasification
island as well as an additional peak gas turbine system compared to a conventional
plant. It was found that the overall efficiency drops by about 1-6 percentage points
and the energy production costs increase by about 5-20 %. Douglas and Dunn [105]
found that an IGCC plant featuring a syngas storage that compensates 12 hours of
25
Chapter 2 State of Research
operation economically outperforms a PC plant. Adding a natural gas fuel switching
capability significantly enhances the profitability by roughly 20 % [106].
Hydrogen Transport and Storage
The storage of H2 faces the challenge that a) the energy density is only about one third
of the natural gas density, b) H2 makes most metals brittle and c) enables diffusion
through the storage chamber wall. Alternatively, H2 can potentially be transported or
stored by using high-pressure tubes or spheric tanks, cryogenic liquid vessels, as well
as underground salt or excavated rock caverns. Typically, H2 is stored at low-pressure
(about 170 bar) tubes for a moderate period of time. This option is well known from
the storage of Liquefied Petroleum Gas (LPG), Liquefied Natural Gas (LNG), and
Compressed Natural Gas (CNG). Generally, the capacity of H2 increases at higher
pressures. Regarding the transport of H2, trailers are loaded at the processing facility
and off-loaded at the fueling station. In this work, the produced H2 is pressurized and
distributed to a pipeline network which usually operates at low pressure (20 to 80 bar).
The storage mechanism may be enhanced by using alternative H2 carriers which are
roughly presented in the following.
Alternative liquid hydrogen carriers include pure liquids, solutions, or slurries.
For example, liquid hydrocarbons like ethylcarbizole, a solution including chemical
hydrides like aqueous sodium borohydride, or a slurry including metal hydrides like
magnesium are potentially useful. It was found that the H2 carriers have far more
impact on the overall costs than, for example, trailer capital costs. Moreover, the
alternative carriers have the potential to be less expensive than the transport of pure
liquid H2. [107]
Unlike liquid carriers, solid-state H2 carriers remain on the trailer usually in form of
powders. Potential materials are carbon sorbents such as AX-21 or complex hydrides
like sodium alanate (NaA1H4). In comparison of both carriers, the carbon sorbent
features faster kinetics which supports a rapid desorption. Unlike liquid carriers,
the powder remains on the trailer for transport. From an economic point of view,
it was found that dropping off the trailer is much more expensive than off-loading
the H2 [107]. In general, finding a suitable carrier depends on factors such as energy
consumption, greenhouse gas emissions, total costs, and potential hazard. It might be
advantageous to use different carriers depending on the scale, available infrastructure,
and time frame.
26
Chapter 3
Methodology
3.1 Thermodynamic Analysis
This section provides the fundamentals of the energy analysis as well as the conven-
tional and advanced exergy analysis. Particular definitions are given in Appendix B,
Eq. 2.1 to 2.12.
3.1.1 Energy Analysis
Energetic state variables are calculated by solving the global energy balance. In this
work, the global energy balance is simplified by assuming only stationary processes
and neglecting differences in kinetic and potential energy. The remaining energy
balance for an open system control volume of the k-th component contains enthalpy
flow rates H j of the inlet (index in) and outlet (index out) streams, mechanical or
electrical power Wcv and rate of heat transfer Qcv of the control volume (index cv).
0 = Qcv +Wcv +∑
jH j ,in +
∑j
H j ,out (3.1)
The characteristics of turbomachinery components, such as compressors (index c)
and turbines (index t), are represented by either using the isentropic efficiency ηs or
the polytropic efficiency ηpol. Therefore, the term hs,out represents the exit specific
enthalpy determined by the inlet specific entropy and exit pressure.
ηs,c = (hs,out −hin)/(hout −hin) (3.2)
ηs,t = (hin −hout)/(hin −hs,out) (3.3)
27
Chapter 3 Methodology
ηpol,c =∫ 2
1vdp/(hout −hin) (3.4)
ηpol,t = (hout −hin)/∫ 2
1vdp (3.5)
The energetic conversion of a solid feedstock through gasification within a gasifier is
rated by the cold gas efficiency cga. In this work, the lower heating value Hi is used
instead of the higher heating value.
cga = Hi,product/Hi,fuel (3.6)
The rating of the overall system is performed by applying the overall net efficiency ηtot.
In this work, the product under design operations is consistently net electric power
Wel,net and the total fuel depends on the mass flow rate and lower heating value of the
fuel.
ηtot = Wel,net/(m ·Hi)fuel (3.7)
3.1.2 Conventional Exergy Analysis
The exergy analysis is a convenient and powerful tool to quantify inefficiencies of
thermal systems from a thermodynamically unbiased point of view. The exergy con-
cept has proven to be advantageous, with its methodology and capabilities being well
established [108–110]. Exergy is defined as the maximum theoretical useful work ob-
tainable as the system is brought into complete thermodynamic equilibrium with the
thermodynamic environment while the system interacts with this environment only
[110]. The exergy flow rate of a stream of matter E j is given by the physical, chemical,
magnetic, kinetic, and potential exergy flow rate. The contribution of kinetic, potential
as well as magnetic exergies is neglected in the following.
E j = E CHj + E PH
j (3.8)
E PHj = n · ((h − h0)−T0 · (s − s0)
)(3.9)
E CHj = n ·
(∑i
xi eCHi + RT0 ·
∑i
xi ln(xi )
)(3.10)
The calculation of the chemical exergy flow rate E CHj , according to Eq. 3.10, is only
valid for a mixture of ideal gases. The chemical exergy of a stream, including a gas and
liquid phase, is calculated by their phase fractions if condensation occurs at ambient
28
3.1 Thermodynamic Analysis
conditions (15 °C and 1 bar). The model of Szargut [108] is used as the reference
environment.
The chemical and physical exergies were calculated by directly using the simula-
tion environment Aspen Plus®. Based on internal Fortran routines, each stream is
flashed to ambient conditions whereas physical properties are taken from the simula-
tion database. Particularly the condensation of water has to be considered. However,
the exergies of solids were calculated outside of the simulation. The determination of
the physical exergies of solids was carried out based on fitting polynoms also using
physical properties supplied by the simulation database. Thereby the coefficients
were adapted closely to the temperature range needed within the simulations in order
to provide a good accuracy.
Under steady state conditions, the rate of exergy destruction within the k-th com-
ponent ED,k is calculated as the difference between the exergy transfer associated with
heat (first summand of Eq. 3.11), mechanical or electric power, exergy flow rates at the
inlet to the exergy flow rates at the exit. The temperature T j represents the average
temperature of the rate of heat transfer at the location on the boundary of the control
volume. However, the exergy destruction quantifies the thermodynamic irreversibil-
ities within the component in regard and is only caused by chemical reaction, heat
transfer, friction, and mixing.
ED,k =∑j
(1− Q j
T j
)+Wcv +
∑j
E j ,in −∑
jE j ,out (3.11)
yD,k = ED,k /EF,tot (3.12)
The exergy destruction ratio yD,k is a dimensionless variable representing the exergy
destruction rate within the k-th component related to the exergy rate of the total
plant fuel EF,tot. In general, dimensionless variables ease the interpretation of results
compared to absolute values. The exergetic efficiency εk of the k-th component is
calculated by the ratio of the exergy rate associated with the fuel EF,k and the exergy
rate associated with the product EP,k . The SPECO approach [111] is used to define
EF,k and EP,k .
εk = EP,k /EF,k = 1− ED,k /EF,k (3.13)
The difference between EF,k and EP,k equals the sum of ED,k and the rate of exergy
loss EL,k . The exergy loss refers to losses of the overall system to the environment, for
29
Chapter 3 Methodology
example hot flue gases or heat losses, whereas the exergy destruction to components
only. Applying an exergy analysis provides information which is not available through
a conventional energy analysis. Thereby, possible means to improve the system are
easily derived. However, it does not become clear whether the modifications proposed
by a conventional exergetic evaluation lead to an improved overall system [112] as
no implications caused by the structure of the overall system are taken into account.
The real available improvement potential can only be determined by conducting an
advanced exergy analysis.
3.1.3 Advanced Exergy Analysis
The advanced exergy analysis concept [113] provides the framework for the identi-
fication of the thermodynamic interactions of each system component, as well as
their real improvement potentials. Thus, the exergy destruction within the system
component is split into its endogenous and exogenous parts as well as its avoidable
and unavoidable parts, respectively. A general overview is given by Fig. 3.1, including
all options for splitting the exergy destruction of a component.
Splitting the exergy destruction of the k-th component into its endogenous (index
EN) and exogenous (index EX) parts reveals the thermodynamic interdependencies
among the system components. Moreover, the substitution of a system component or
changing the process arrangement is rated by this splitting.
ED,k = E END,k + E EX
D,k (3.14)
The endogenous exergy destruction E END,k is associated with the irreversibilities of the
k-th component operating with the default exergetic efficiency εk but the remaining
components of the overall system operate in an ideal way without any exergy destruc-
tion [112]. In contrast, the exogenous exergy destruction E EXD,k is defined as the part
of the exergy destruction within the k-th component caused by irreversibilities of
other system components. Calculating the endogenous exergy destruction does not
need an additional simulation. The necessary set of equations includes the specific
default exergies used in the definitions of the exergy rate of products and fuel as well
as the leveling of every involved mass flow rate based on a characteristic mass flow
rate. As an additional result, the productive mass flow rate of the component in regard
is identified.
30
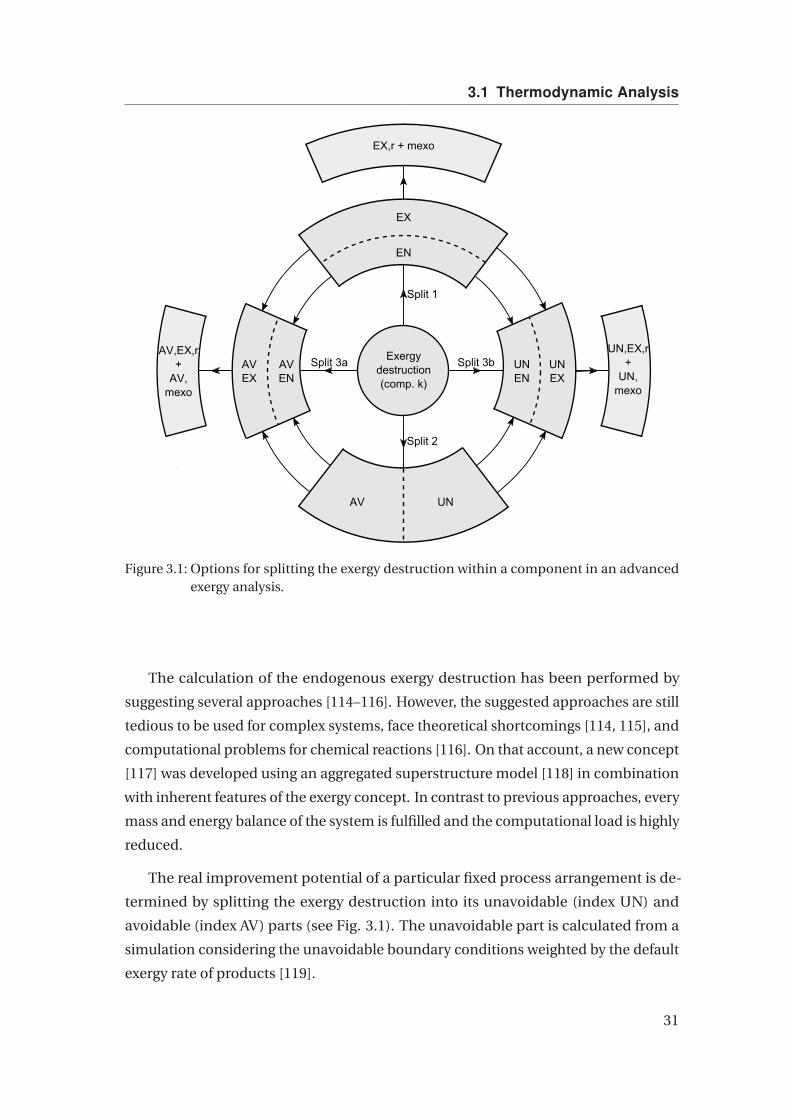
3.1 Thermodynamic Analysis
EX
EN
UNEN
UNEX
AVEX
AVEN
AV,EX,r+
AV, mexo
UN,EX,r+
UN, mexo
EX,r + mexo
Split 1
Split 2
Split 3a Split 3b
UNAV
Exergydestruction(comp. k)
Figure 3.1: Options for splitting the exergy destruction within a component in an advancedexergy analysis.
The calculation of the endogenous exergy destruction has been performed by
suggesting several approaches [114–116]. However, the suggested approaches are still
tedious to be used for complex systems, face theoretical shortcomings [114, 115], and
computational problems for chemical reactions [116]. On that account, a new concept
[117] was developed using an aggregated superstructure model [118] in combination
with inherent features of the exergy concept. In contrast to previous approaches, every
mass and energy balance of the system is fulfilled and the computational load is highly
reduced.
The real improvement potential of a particular fixed process arrangement is de-
termined by splitting the exergy destruction into its unavoidable (index UN) and
avoidable (index AV) parts (see Fig. 3.1). The unavoidable part is calculated from a
simulation considering the unavoidable boundary conditions weighted by the default
exergy rate of products [119].
31
Chapter 3 Methodology
E UND,k = EP,k ·
(ED,k /EP,k
)UN(3.15)
ED,k = E UND,k + E AV
D,k (3.16)
The unavoidable exergy destruction E UND,k is associated with the amount of exergy
destruction that cannot be further reduced. These constraints are set by techno-
economic limitations such as availability, cost of materials, as well as manufacturing
methods. This enables engineers to identify and quantify potential changes in design
and operation for the particular component based on their knowledge, experience,
and expectations. The remaining avoidable exergy destruction E AVD,k represents the
potential savings in irreversibilities of the k-th component.
The combination of both splittings of exergy destruction shows the final results of
an advanced exergy analysis. The determination of the most promising modifications
for improving the overall system is represented by the avoidable endogenous exergy
destruction E AV,END,k and avoidable exogenous exergy destruction E AV,EX
D,k (see Fig. 3.1).
ED,k = E UN,END,k + E UN,EX
D,k + E AV,END,k + E AV,EX
D,k (3.17)
E AV,END,k = E EN
D,k − E UN,END,k (3.18)
E AV,EXD,k = E AV
D,k − E AV,END,k (3.19)
The unavoidable endogenous exergy destruction is calculated by taking the results
of the simulation used for the unavoidable case, and assuming that the remaining
system components operate in an ideal way without any exergy destruction. Hence,
no additional simulation is needed.
In order to further improve the understanding of interdependencies among the
components, the exogenous exergy destruction of the k-th component is further split
in order to account for binary component interactions between component k and
r [115] (see Fig. 3.1). Hence, component r is also operating at its default exergetic
efficiency, while the other of the m system components operate ideally.
E EXD,k =
m∑r 6=k
E EX,rD,k + E mexo
D,k (3.20)
The remaining difference to the exogenous exergy destruction is called the mexoge-
nous exergy destruction E mexoD,k , representing the simultaneous interactions among all
32
3.2 Cost Estimation
other components together. A large amount of the mexogenous exergy destruction
indicates strong component interactions as a part of a highly integrated systems.
From the thermodynamic point of view, the components with the largest sum
of the avoidable exergy destruction E AV,ΣD,k should be given the highest priority for
improvement when the arrangement of the system components remains constant.
E AV,ΣD,k = E AV,EN
D,k +m∑
r �=kE AV,EX,r
D,k (3.21)
Based on simple rules, the simultaneous consideration of the different parts of exergy
destruction identifies the real potential for improving the component in regard, as
well as the overall system [113]. The results from the advanced exergy concept provide
the system designer and operator with information that cannot be derived from any
other method available. The calculation algorithm is given in the end of Appendix B.
3.2 Cost Estimation
In this work, an economic analysis is performed in order to valuate an additional H2
production during periods of low electricity prices. The bare erected costs estimation
of the conventional IGCC system components are taken from the same reference
which was mainly used for the simulation [6]. The particular subsystem costs were
adapted using cost degression exponents ranging from 0.75 to 0.93 [109, 120]. The
calculation of additional costs for engineering, contingencies, operating and main-
tenance (O&M) and others are taken from Simbeck and Chang [120] in order to use
the same economic boundary conditions as the competing steam methane reforming
(SMR) plant. Table 3.1 presents the specifications of the cost analysis. Compared to the
reference case IGCC-2, the production of hydrogen requires further purification using
pressure swing adsorption (PSA) as well as an H2 compressor to meet the transport
pressure. The competing SMR plant requires an additional CO2 compressor to satisfy
the same pipeline transport pressure of the IGCC cases.
In order to estimate the operation costs, a price for coal is required. The average
coal price in Germany is taken from the BAFA [123]. The average value of the year 2014
results in 72.9e/tSKE based on data given by German power plant operators. Within
the result section, the coal prices are presented based on the standard trading unit
(SKE). In the case IGCC-2, the prices were adjusted to the analyzed coal type (Illionois
No.6) by weighting their heating value.
33
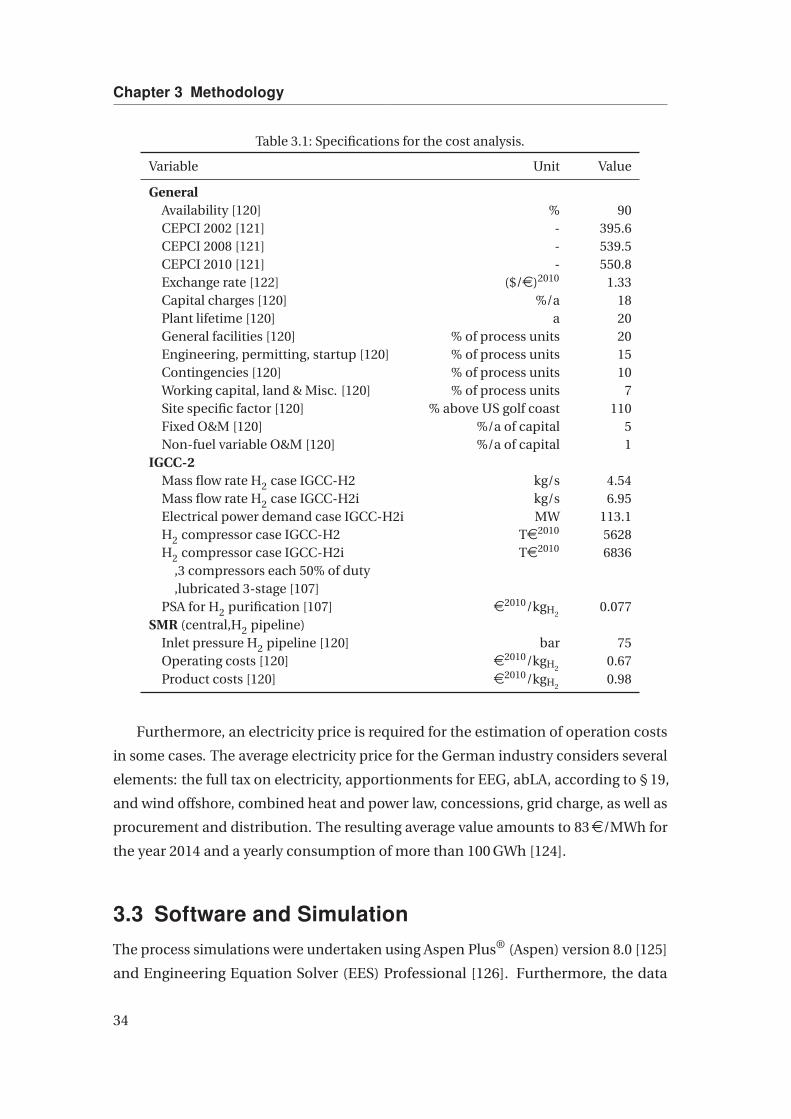
Chapter 3 Methodology
Table 3.1: Specifications for the cost analysis.
Variable Unit Value
GeneralAvailability [120] % 90CEPCI 2002 [121] - 395.6CEPCI 2008 [121] - 539.5CEPCI 2010 [121] - 550.8Exchange rate [122] ($/e)2010 1.33Capital charges [120] %/a 18Plant lifetime [120] a 20General facilities [120] % of process units 20Engineering, permitting, startup [120] % of process units 15Contingencies [120] % of process units 10Working capital, land & Misc. [120] % of process units 7Site specific factor [120] % above US golf coast 110Fixed O&M [120] %/a of capital 5Non-fuel variable O&M [120] %/a of capital 1
IGCC-2Mass flow rate H2 case IGCC-H2 kg/s 4.54Mass flow rate H2 case IGCC-H2i kg/s 6.95Electrical power demand case IGCC-H2i MW 113.1H2 compressor case IGCC-H2 Te2010 5628H2 compressor case IGCC-H2i Te2010 6836
,3 compressors each 50% of duty,lubricated 3-stage [107]
PSA for H2 purification [107] e2010/kgH20.077
SMR (central,H2 pipeline)Inlet pressure H2 pipeline [120] bar 75Operating costs [120] e2010/kgH2
0.67Product costs [120] e2010/kgH2
0.98
Furthermore, an electricity price is required for the estimation of operation costs
in some cases. The average electricity price for the German industry considers several
elements: the full tax on electricity, apportionments for EEG, abLA, according to § 19,
and wind offshore, combined heat and power law, concessions, grid charge, as well as
procurement and distribution. The resulting average value amounts to 83e/MWh for
the year 2014 and a yearly consumption of more than 100 GWh [124].
3.3 Software and Simulation
The process simulations were undertaken using Aspen Plus® (Aspen) version 8.0 [125]
and Engineering Equation Solver (EES) Professional [126]. Furthermore, the data
34

3.3 Software and Simulation
management and some additional calculations have been conducted using MATLAB®
[127]. Each analysis in this work has been performed at steady-state conditions.
In Aspen, the property method Redlich-Kwong-Soave with Boston Matthias Alpha
function (RKS-BM) was used for modeling the gas path. In the acid gas removal
system, the property method based on the Perturbed Chain Statistical Association
Fluid Theory (PC-SAFT) equation of state was used for the glycol Dimethyl Ether of
Polyethylene Glycol (DEPG) representing the Selexol® solvent. The introduction of
the corresponding model properties is available from the Aspen Technology, Inc. [128].
For the simulation of Chemical-Looping Combustion, the properties of solids were
taken from the Aspen inorganic database. Especially for iron and its oxides, property
coefficients were implemented in the Aspen software taken from the literature [129–
131]. In Aspen, the material properties derive from the NIST database [132].
The steam cycle of each IGCC simulation has been implemented using the EES
software. The properties of water and steam were calculated based on the steam
table formulation IAPWS‘95 [133] which is the most accurate method available so far.
Optimization has been performed using the non-linear Nelder-Mead Simplex method
which is only available from the professional EES version.
Application of Aspen Plus®
Generally, the simulation has been run in the sequential modular mode. In order to
specify the outlet conditions, a lot of internal modules called design specification have
been used within the simulations. The internal module called calculator is useful for
directly calculating characteristic parameters such as efficiencies and the equivalence
ratio. Another internal module called transfer should be used in case the process
design includes more than one loop which is mostly induced by recycle streams.
Most of the reactors were simulated by using the RGIBBS reactor model which
minimizes the Gibbs free energy representing chemical equilibrium. In some cases,
mostly at high amounts of excess agents, the simulation did not converge and there-
fore the reactor model was replaced by the RSTOICH reactor model. However, the
residence time of coal particles within the moving-bed BGL gasifier does not sat-
isfy the chemical equilibrium conditions. Hence, the equilibrium temperature of
each reaction was corrected to adjust the product composition given by the literature
(temperature approach, see Section 4.6.2). For Chemical-Looping Combustion, the
component Fe0.947O is used instead of FeO because it is much more available in the
real environment.
35
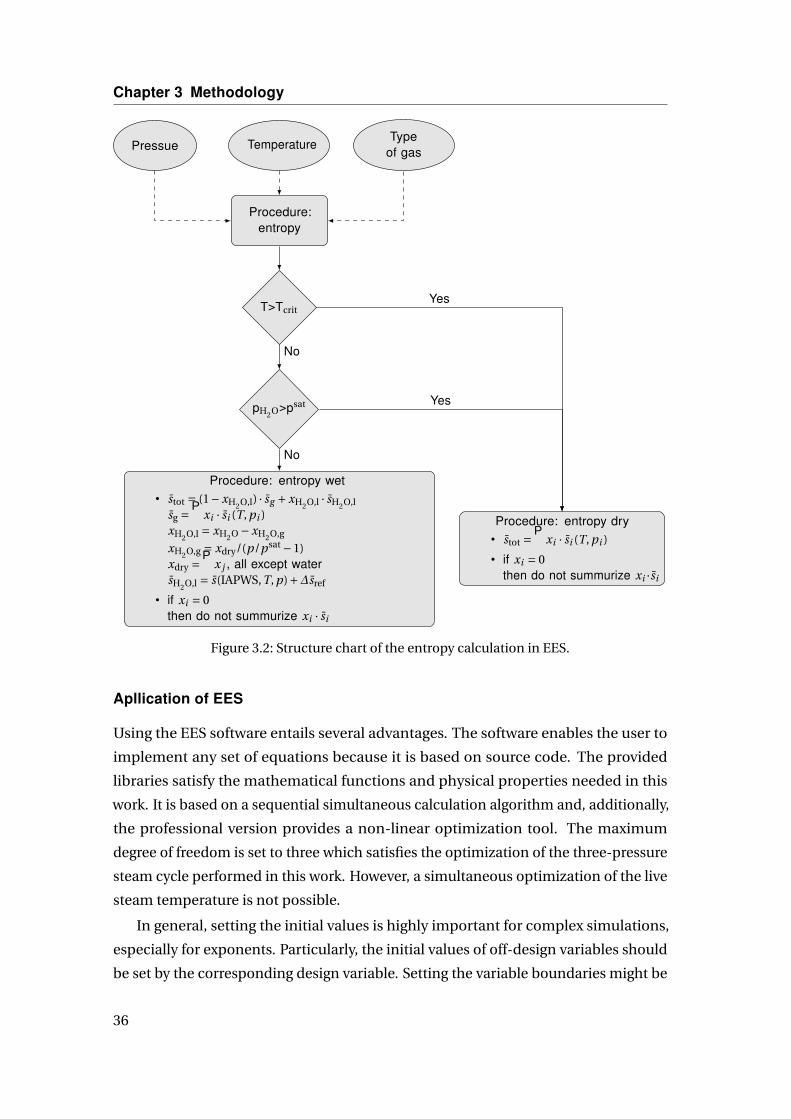
Chapter 3 Methodology
Pressue TemperatureType
of gas
Procedure:entropy
T>Tcrit
pH2O>psat
Procedure: entropy wet
• stot = (1−xH2O,l) · sg +xH2O,l · sH2O,l
sg =∑xi · si (T, pi )xH2O,l = xH2O −xH2O,g
xH2O,g = xdry/(p/psat −1)xdry =
∑x j , all except water
sH2O,l = s(IAPWS,T, p)+∆sref
• if xi = 0then do not summurize xi · si
Procedure: entropy dry
• stot =∑xi · si (T, pi )
• if xi = 0then do not summurize xi ·si
No
Yes
No
Yes
Figure 3.2: Structure chart of the entropy calculation in EES.
Apllication of EES
Using the EES software entails several advantages. The software enables the user to
implement any set of equations because it is based on source code. The provided
libraries satisfy the mathematical functions and physical properties needed in this
work. It is based on a sequential simultaneous calculation algorithm and, additionally,
the professional version provides a non-linear optimization tool. The maximum
degree of freedom is set to three which satisfies the optimization of the three-pressure
steam cycle performed in this work. However, a simultaneous optimization of the live
steam temperature is not possible.
In general, setting the initial values is highly important for complex simulations,
especially for exponents. Particularly, the initial values of off-design variables should
be set by the corresponding design variable. Setting the variable boundaries might be
36

3.3 Software and Simulation
useful in some cases but for optimization this may lead to convergence problems. It is
recommended to manually edit the accuracy of equations and number of iterations
used by the solver. Optimization convergence problems may be overcome by starting
at a low accuracy. The results from this first step are potentially useful to be used as
initial values for further more accurate optimization steps.
Since only the properties of pure materials are available through the library, the
state variables of mixtures have to be calculated by the user. In this work, external
routines were generated. Particularly, the general formulation for computing the
specific entropy of mixtures might be challenging for the user. Figure 3.2 presents
the structure chart in regard. In general, logical operators such as if-else statements
can be implemented in so-called procedures. In contrast to this sequential operation
mode, the so-called subroutines use a simultaneous operation mode. When calling
the entropy procedure, the pressure, temperature, and type of gas have to be assigned.
The composition depends on the type of gas and is taken from values deposit within
the procedure.
Checking the condensation of water is necessary for mixtures that include a large
amount of water. Prior to that, the temperature should be below the critical tempera-
ture to avoid errors within the calculation. The final calculation of the entropy with or
without condensation is performed sequentially. If a material component does not
occur within the mixture, it should not be considered in the calculation algorithm
because the partial pressure becomes zero, leading to an error message by the EES
software. In case of liquid water, the entropy derives from the steam table formulation
IAPWS’95 corrected by a reference point shift. Additionally, the composition of the
gas phase has to be re-calculated based on the liquid fraction.
Adding inequalities to the model can help checking the results of a simulation.
For example, an auxiliary variable is defined as the ratio of the component inlet and
outlet temperature of a particular stream. In combination with the setting of the
auxiliary variable limits between zero and one, this equation acts like an inequation.
A direct implementation is not possible. The software constrains the equation if the
ratio exceeds the limits and displays the constrained equations after finishing the
calculations. For smaller simulations, the convergence does not depend on either the
enthalpy is a function of the temperature or the other way around. However, in case of
larger simulations this dependency may become important.
37

Chapter 4
Modeling
In this chapter, the assumptions and models used for the analysis in this work are
presented.
4.1 Overview of Cases and Subsystems
The thermodynamic and economic assessment depends on characteristic cases given
in Table 4.1 that are further introduced in the following sections. Each analysis uses
an IGCC base case for the evaluation. All cases consider carbon capture. The base
case IGCC-1 represents a high-efficiency conventional IGCC power plant using a Shell
gasifier (see Section 4.5.1) and is used to analyze the thermodynamic potential. The
second base case IGCC-2 is introduced in Section 4.5.2 and represents a low-cost
conventional IGCC plant using a General Electric Energy (GEE) gasifier.
The cases IGCC-H2i and IGCC-H2 represent the off-design operation of the base
case IGCC-2. The product switches from electrical power to hydrogen. In both cases,
the steam cycle only provides the water streams required by the scrubber, quench
unit, WGS unit as well as saturator if required and some electric power generated by
the LP steam turbine. In the case IGCC-H2i, the electric power demand is satisfied by
the steam turbine and external purchases. On the contrary, in the case IGCC-H2 the
electric power demand is completely generated internally representing a stand-alone
operation.
The IGCC plants including a Chemical-Looping Combustion (CLC) unit are sepa-
rated into two categories depending on the reactor system design. The choice of the
particular oxygen carrier depends on the thermodynamic characteristics presented in
Section 2.4. In general, two different types of gasifiers are selected in the underlying
cases. The selection is presented in the following detailed case description sections.
The air reactor temperature is one of the major parameters and therefore a sensitivity
39
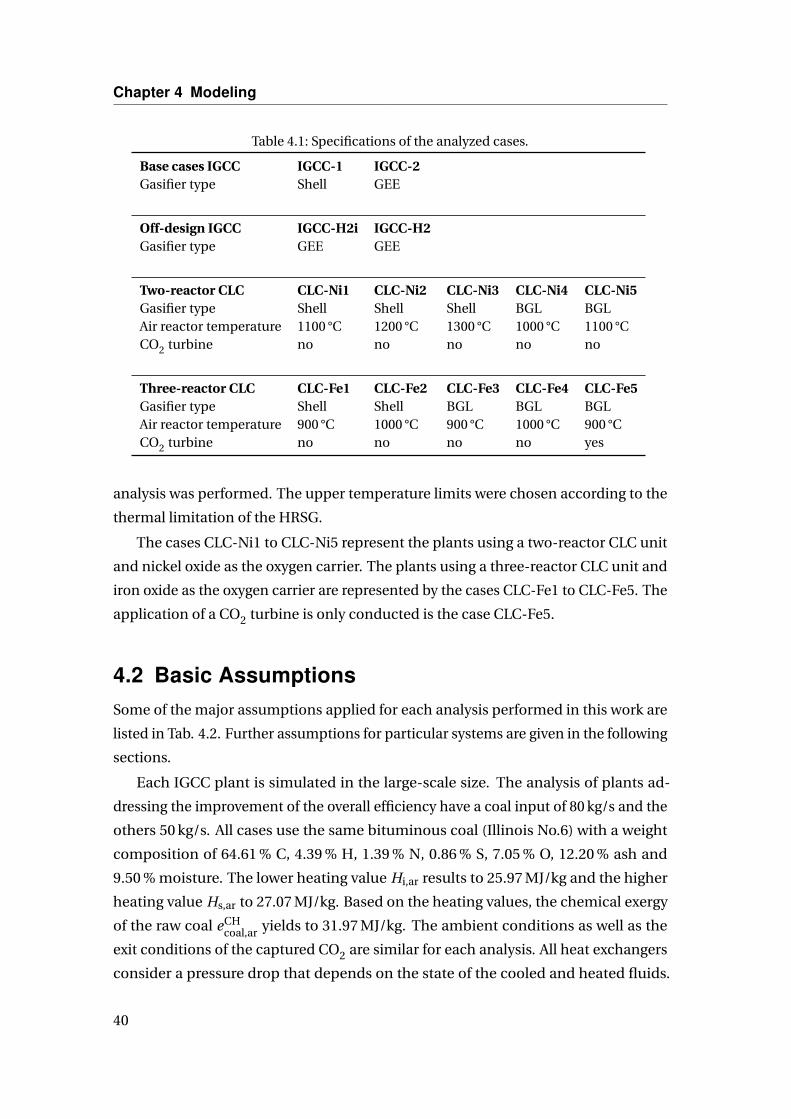
Chapter 4 Modeling
Table 4.1: Specifications of the analyzed cases.
Base cases IGCC IGCC-1 IGCC-2Gasifier type Shell GEE
Off-design IGCC IGCC-H2i IGCC-H2Gasifier type GEE GEE
Two-reactor CLC CLC-Ni1 CLC-Ni2 CLC-Ni3 CLC-Ni4 CLC-Ni5Gasifier type Shell Shell Shell BGL BGLAir reactor temperature 1100 °C 1200 °C 1300 °C 1000 °C 1100 °CCO2 turbine no no no no no
Three-reactor CLC CLC-Fe1 CLC-Fe2 CLC-Fe3 CLC-Fe4 CLC-Fe5Gasifier type Shell Shell BGL BGL BGLAir reactor temperature 900 °C 1000 °C 900 °C 1000 °C 900 °CCO2 turbine no no no no yes
analysis was performed. The upper temperature limits were chosen according to the
thermal limitation of the HRSG.
The cases CLC-Ni1 to CLC-Ni5 represent the plants using a two-reactor CLC unit
and nickel oxide as the oxygen carrier. The plants using a three-reactor CLC unit and
iron oxide as the oxygen carrier are represented by the cases CLC-Fe1 to CLC-Fe5. The
application of a CO2 turbine is only conducted is the case CLC-Fe5.
4.2 Basic Assumptions
Some of the major assumptions applied for each analysis performed in this work are
listed in Tab. 4.2. Further assumptions for particular systems are given in the following
sections.
Each IGCC plant is simulated in the large-scale size. The analysis of plants ad-
dressing the improvement of the overall efficiency have a coal input of 80 kg/s and the
others 50 kg/s. All cases use the same bituminous coal (Illinois No.6) with a weight
composition of 64.61 % C, 4.39 % H, 1.39 % N, 0.86 % S, 7.05 % O, 12.20 % ash and
9.50 % moisture. The lower heating value Hi,ar results to 25.97 MJ/kg and the higher
heating value Hs,ar to 27.07 MJ/kg. Based on the heating values, the chemical exergy
of the raw coal eCHcoal,ar yields to 31.97 MJ/kg. The ambient conditions as well as the
exit conditions of the captured CO2 are similar for each analysis. All heat exchangers
consider a pressure drop that depends on the state of the cooled and heated fluids.
40
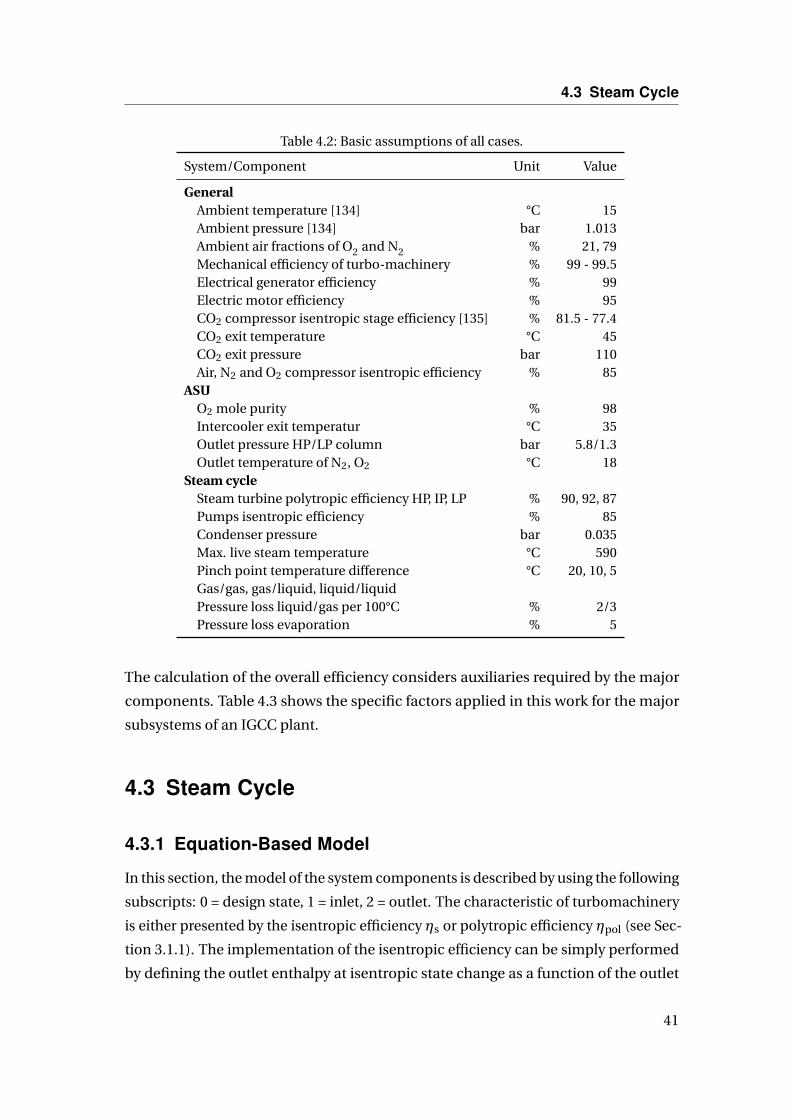
4.3 Steam Cycle
Table 4.2: Basic assumptions of all cases.
System/Component Unit Value
GeneralAmbient temperature [134] °C 15Ambient pressure [134] bar 1.013Ambient air fractions of O2 and N2 % 21, 79Mechanical efficiency of turbo-machinery % 99 - 99.5Electrical generator efficiency % 99Electric motor efficiency % 95CO2 compressor isentropic stage efficiency [135] % 81.5 - 77.4CO2 exit temperature °C 45CO2 exit pressure bar 110Air, N2 and O2 compressor isentropic efficiency % 85
ASUO2 mole purity % 98Intercooler exit temperatur °C 35Outlet pressure HP/LP column bar 5.8/1.3Outlet temperature of N2, O2 °C 18
Steam cycleSteam turbine polytropic efficiency HP, IP, LP % 90, 92, 87Pumps isentropic efficiency % 85Condenser pressure bar 0.035Max. live steam temperature °C 590Pinch point temperature difference °C 20, 10, 5Gas/gas, gas/liquid, liquid/liquidPressure loss liquid/gas per 100°C % 2/3Pressure loss evaporation % 5
The calculation of the overall efficiency considers auxiliaries required by the major
components. Table 4.3 shows the specific factors applied in this work for the major
subsystems of an IGCC plant.
4.3 Steam Cycle
4.3.1 Equation-Based Model
In this section, the model of the system components is described by using the following
subscripts: 0 = design state, 1 = inlet, 2 = outlet. The characteristic of turbomachinery
is either presented by the isentropic efficiency ηs or polytropic efficiency ηpol (see Sec-
tion 3.1.1). The implementation of the isentropic efficiency can be simply performed
by defining the outlet enthalpy at isentropic state change as a function of the outlet
41

Chapter 4 Modeling
Table 4.3: Assumptions of the subsystem auxiliaries [6].
System Unit Value
Coal handling kW/(kg/s) wet coal 7.85Slag handling kW/(kg/s) slag 93.67Air separation unit kW/(kg/s) air in 5.14Cooling tower fans % of cooling duty 0.65Gas turbine % of net power 0.216Steam turbine % of net power 0.048
pressure and inlet entropy. When implementing the polytropic efficiency, the use of
the polytropic exponent n is necessary to solve the integral of v ·dp. Hence, Eq. 4.1 is
used to reformulate the definition of the polytropic efficiency into Eq. 4.2. In Eq. 4.2,
the unit of the pressure is [kPa]. The limits of the polytropic exponent should be set
very closely to the final value, e.g. 1.1 < n < 1.6 in case of the steam turbine. Otherwise
the solver of the EES software might not find a solution.
p1 · vn1 = p2 · vn
2 (4.1)
(h2 −h1) ·(1− 1
n
)= ηpol ·p
( 1n
)1 · v1 ·
(p(1− 1
n
)2 −p
(1− 1
n
)1
)(4.2)
Usually, within the low-pressure steam turbine some amount of steam condenses
whereby the dry polytropic efficiency ηpol,dry has to be corrected resulting in the wet
polytropic efficiency ηpol,wet. The first approach was presented by Baumann [136]
who found a factor for the correction of the dry efficiency as a function of the average
steam quality. Later, this approach has been enhanced because is not likely that wet
efficiency is proportional to dry efficiency. The approach by Smith [137] considers
the correction factor as being independent of the dry efficiency (see Eq. 4.3). At high
pressures, the correction factor α is 0.9, and it is 0.7 at low pressures.
ηpol,wet = ηpol,dry −α ·(1− x1 −x2
2
)(4.3)
The heat transfer within a heat exchanger is determined by the mass flow rates as
well as enthalpies of the hot and cold stream, respectively. Thereby, the enthalpy
is a function of the composition, temperature, and pressure, or rather the state of
matter instead of temperature or pressure. As a result of the calculated rate of heat
transfer Q, the product of the heat transfer coefficient U and the heat transfer area A
can be calculated by using the Fourrier law for a counter-current flow arrangement,
as presented in Eq. 4.4. The resulting area is typically used for cost estimations or
42
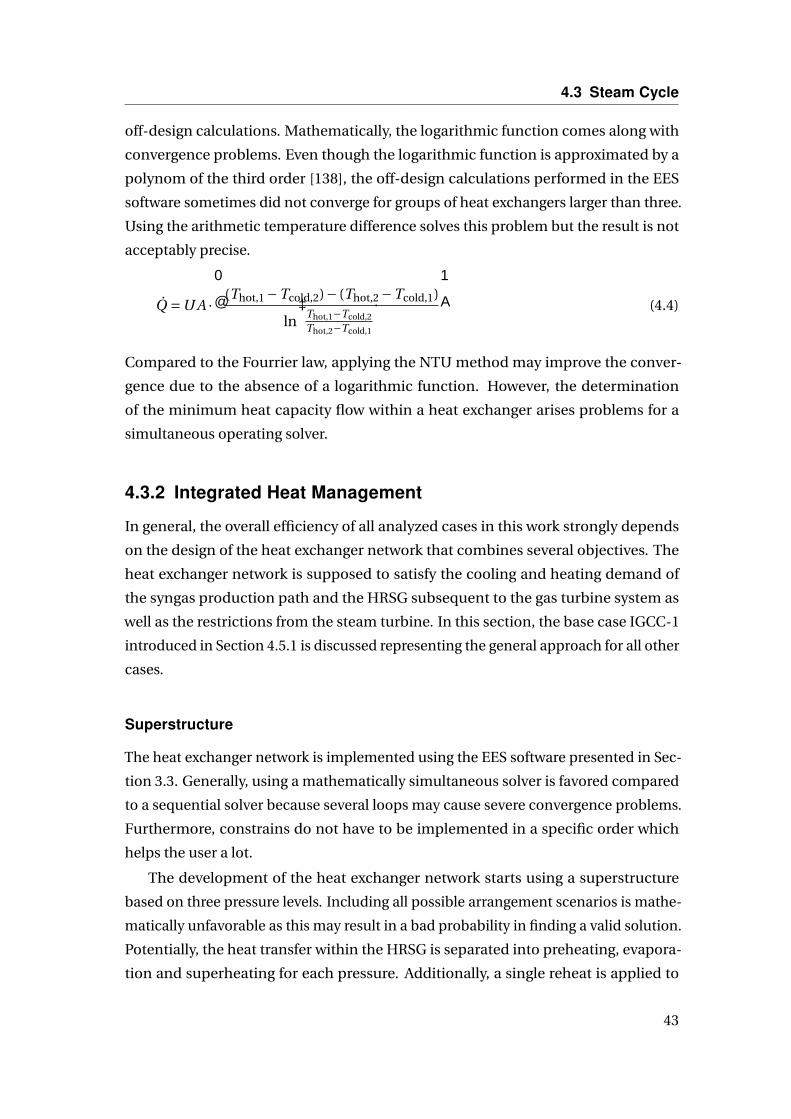
4.3 Steam Cycle
off-design calculations. Mathematically, the logarithmic function comes along with
convergence problems. Even though the logarithmic function is approximated by a
polynom of the third order [138], the off-design calculations performed in the EES
software sometimes did not converge for groups of heat exchangers larger than three.
Using the arithmetic temperature difference solves this problem but the result is not
acceptably precise.
Q =U A · (Thot,1 −Tcold,2)− (Thot,2 −Tcold,1)
ln(
Thot,1−Tcold,2Thot,2−Tcold,1
) (4.4)
Compared to the Fourrier law, applying the NTU method may improve the conver-
gence due to the absence of a logarithmic function. However, the determination
of the minimum heat capacity flow within a heat exchanger arises problems for a
simultaneous operating solver.
4.3.2 Integrated Heat Management
In general, the overall efficiency of all analyzed cases in this work strongly depends
on the design of the heat exchanger network that combines several objectives. The
heat exchanger network is supposed to satisfy the cooling and heating demand of
the syngas production path and the HRSG subsequent to the gas turbine system as
well as the restrictions from the steam turbine. In this section, the base case IGCC-1
introduced in Section 4.5.1 is discussed representing the general approach for all other
cases.
Superstructure
The heat exchanger network is implemented using the EES software presented in Sec-
tion 3.3. Generally, using a mathematically simultaneous solver is favored compared
to a sequential solver because several loops may cause severe convergence problems.
Furthermore, constrains do not have to be implemented in a specific order which
helps the user a lot.
The development of the heat exchanger network starts using a superstructure
based on three pressure levels. Including all possible arrangement scenarios is mathe-
matically unfavorable as this may result in a bad probability in finding a valid solution.
Potentially, the heat transfer within the HRSG is separated into preheating, evapora-
tion and superheating for each pressure. Additionally, a single reheat is applied to
43
Chapter 4 Modeling
increase the steam cycle efficiency. However, the sensible heat exchangers can be
split into parts depending on the conditions needed by external sources. In this work,
the superstructure already excludes some heat exchangers that are supposed to be
improper.
The objective function of the mathematical optimization maximizes the net elec-
tric power output of the steam cycle by varying the live steam pressure of the three
lines, respectively. The lower boundary of the particular pressure is determined by the
extraction pressure if there is any. In case of a higher pressure which is found by the
solver to be optimal, a throttling unit uncouples the extraction pressure. After running
a first optimization using the superstructure, heat exchangers are disabled that only
share a very small amount of the overall heat transfer and, accordingly, a very small
water mass flow rate. This is an alternative approach to the optimization featuring a
mixed-integer problem. In a second optimization run, the pressures are recalculated
resulting in small differences compared to the first run.
Component Arrangement
Figure 4.1 presents the final flow diagram of the base case IGCC-1 and the correspond-
ing temperature profiles are shown in Fig. 4.2. The higher temperatures of the hot
gas streams at the inlet of the syngas cooler (900 °C) and the gasifier (1550 °C) are
not presented to give a valuable overview about the other streams. Furthermore, the
internal heat transfer from the Low-Temperature Water Gas Shift (LT-WGS) cooler to
the saturator is not displayed.
Starting subsequent to the condensate pump, the liquid water is mixed with the
make-up stream which substitutes the water demand of the gasifier, scrubber and
WGS unit. The water is then preheated at a pressure of 2 bar by, primary, cooling the
product gas of the LT-WGS unit, and, secondary, cooling the flue gas in the HRSG
directly before entering the stack. On that account, the offgas temperature at the HRSG
exit is limited by the low-temperature demand of the WGS unit. The saturated water is
then pressurized by the pumps of the three pressure levels. The overall efficiency is
mostly affected by the high pressure (HP) and intermediate pressure (IP). The mass
flow rate of the HP section is determined by the cooling demand of the syngas cooler
and How-Temperature Water Gas Shift (HT-WGS) unit cooler. Both heat exchangers
at first preheat the HP water to the corresponding saturation temperature, and then
evaporation takes place outside of the HRSG. The superheating of the HP steam within
the HRSG is split into two parts to enable a high IP live steam temperature between
44

4.3 Steam Cycle
HP IP LP
Preh
eate
r
Evap
orat
or
Supe
rhea
ter
G
Syng
as c
oole
r
Gas
ifier
HT-
WG
S un
it
AGR
uni
t
LT-W
GS
unit
Mak
e-up
wat
er
Scru
bber
Coa
l dry
er
Hea
t-rec
over
y st
eam
gen
erat
or (H
RSG
)
Feed
wat
er
pum
ps
Con
dens
ate
pum
pC
onde
nser
Stea
m tu
rbin
e
Offg
as
GT
exha
ust g
as PP
P
PP
T
T
T
T
TT
P T T
Com
pone
nts
Spec
ifica
tions
Pres
sure
Tem
pera
ture
Tem
pera
ture
diffe
renc
e
T
Figure 4.1: Flow diagram of the steam cycle of case IGCC-1.
45

Chapter 4 Modeling
0 200 400 600 800 1,000 1,200 1,4000
100
200
300
400
500
600
700
HRSG
Gasifier
Syngas cooler
HT-WGS
LT-WGS
Dryer
AGR
Enthalpy rate difference [MW]
Tem
pera
ture
[°C
]
Figure 4.2: Temperature profiles of the heat transfer (case IGCC-1).
both superheaters. The HP live steam is fed to the HP steam turbine and the outlet
pressure of this turbine is determined by the pressure of the IP line. Subsequently, the
outlet stream is mixed into the IP main stream to further reheat the IP steam.
The arrangement of the IP section starts using a preheater, which supplies the tem-
perature needed for the wet-type scrubber. The extract needed by the scrubber passes
through a throttling unit to separate the scrubber pressure from the intermediate
pressure determined by the results of the mathematical optimization. Based on the
throttling process, a small temperature drop occurs. Prior to the scrubber extraction,
the stream is split to produce saturated IP steam within the low-temperature part of
the syngas cooler. The preheated IP water is then further preheated and evaporated
within the HRSG. Evaporation takes place parallelly within the membrane wall of the
gasifier to facilitate a high cooling demand restricted by the surface area as well as
the isothermal heat transfer. The saturated IP steam is partly used to heat nitrogen
required by the coal dryer. The corresponding recycle stream is then mixed into the
main IP stream subsequent to the IP pump. The smaller part of the IP saturated steam
is partly superheated to provide steam for the WGS unit. Afterwards, a small part is
split from the main stream and is further superheated to provide steam needed for the
gasification process. Like the extraction for the scrubber, a throttling unit uncouples
the pressure needed by the shift reaction and gasification process from the optimized
IP pressure.
After the expansion within the IP turbine, low pressure (LP) superheated steam is
mixed into the off-steam to increase the power generation within the LP turbine. The
46
4.3 Steam Cycle
LP live steam is only produced within the HRSG. However, a part of the IP saturated
steam is discharged to satisfy the heat demand of the AGR regeneration column. The
recycle stream consists of boiling liquid and enters the LP evaporator within the HRSG
again. Within the LP turbine, the steam quality should not underrun 85 % to avoid
erosion caused by water droplets [139, 140]. In the case IGCC-1, the share of the HRSG
on the overall heat transfer results to about 55%.
Specifications
Finding a proper set of specifications represents the most difficult part for the process
engineer. The number of specifications needed is determined by the number and
arrangement of the heat exchangers, mixers, splitters, and turbomachinery. Finally,
the degree of freedom must be zero to start a calculation. Difficulties may occur
in the process of placing the specifications. It is recommended to start assigning
specifications to the components by their priority to the overall system. Finding proper
assignings is supported by the Computational Flow Window in the EES software,
which presents the grouped matrices that are sequentially used for solving the set of
equations. Checking the temperature profile (see Fig. 4.2) can help the engineer if the
software finds a solution.
In general, a preheater followed by an evaporator is specified to produce a boil-
ing liquid. Moreover, all evaporators producing saturated steam have a smaller exit
temperature compared to the inlet because the pressure drops decreases the corre-
sponding saturation temperature. Figure 4.1 shows the specifications applied for the
steam cycle of case IGCC-1. For obvious reasons, the inlet conditions as well as the
exit temperature of the external gas streams outside of the HRSG have to be provided.
The parameters of the extractions also have to be given. For the simulation of the
HRSG the conditions of the gas turbine exhaust gas are provided.
Other important specifications are represented by the HP and IP live steam tem-
peratures which are set to be max. 590 °C in this work. The HP live steam temperature
is fixed to be 590 °C as the turbine exhaust temperature is about 613 °C. However,
the LP and IP live steam temperature can be smaller determined by the minimum
temperature difference between the exhaust gas and superheated steam (20 °C) as well
as the gas turbine exhaust mass flow rate. The same temperature difference is used
to determine the exit steam temperature of the first HP superheater. Typically, the
pinch point occurs at the beginning of boiling of the liquid state. Thus, a temperature
difference of 10 °C is specified for the exit of the IP and LP preheater which are both
47

Chapter 4 Modeling
producing boiling liquid. Finally, the LP steam turbine outlet pressure is determined
by the ambient temperature and the temperature difference within the condenser.
In this work, the pressure is fixed at 0.035 bar. The feedwater pressure is set to be
2 bar. However, the live steam pressures must be provided or determined by applying
mathematical optimization.
In the case IGCC-1, the maximum electric power generation calculated by op-
timization occurs at live steam pressures of 164 bar/42 bar/3 bar, respectively. The
corresponding live steam temperatures are found to be 590 °C/562 °C/192 °C, resulting
in a vapor fraction of 87.4 % at the steam turbine outlet. The steam cycle produces
about 38 % of the overall gross electric power.
Generally, under off-design conditions the steam cycle should work at fixed design
pressures to ensure the same evaporation temperatures compared to the design case.
In contrast, a sliding pressure may cause critical issues, for example to the membrane
wall cooling within the gasifier. More detailed information are given in Section 5.4.1.
4.4 Gas Turbine System
The real gas turbine is a highly complex system. The design and a lot of parameters
depend on the particular application. This section presents the modeling of a heavy-
duty gas turbine at steady-state conditions. A lot of conditions depend on design
constrains by the particular manufacturer. For a very detailed simulation featuring
a high accuracy, CFD (Computational Fluid Dynamics) should be used but a lot
of parameters and assumptions make the mathematical model very complex. In
this work, the level of detail is chosen to determine the inefficiencies within the
overall system and to confirm characteristic parameters that are typically given by
the manufacturers. The process simulations were undertaken using the Aspen Plus®
software.
4.4.1 Determination of Inefficiencies
Generally, exergy destruction is only caused by friction, mixing, heat transfer and
chemical reactions. In this work, the following incorporated twelve processes are
associated with characteristic inefficiencies in a heavy-duty gas turbine system:
• Compression,
• Stoichiometric combustion,
• Addition of excess air,
48
4.4 Gas Turbine System
• Convective cooling in vanes/blades,
• Pressure drop (caused by the transport of working fluids),
• Expansion,
• Mixing at different pressures,
• Mixing at different temperatures,
• Mixing at different compositions,
• Heat loss,
• Transport of shaft work,
• Conversion of mechanical energy to electrical energy.
The characteristic inefficiencies are selected to provide a comprehensible overview
among the components of the gas turbine system based on an exergy analysis. Partic-
ularly, the mixing processes are subdivided into three types: first, the high-pressure
stream gets throttled by a hypothetical throttling unit to the minimum inlet pressure
of the mixer. Then the temperature change at isobaric conditions follows which is
represented by the difference in physical exergies. At last, the change in composition
at isobaric and isothermal conditions takes place, represented by the difference in
chemical exergies. The expansion process is modeled by using the isentropic effi-
ciency which includes the friction losses associated with: a) surface friction of the
housing, b) incidence caused by the angle between the air and blade, c) profile losses
due to a negative velocity gradient in the blade boundary layer, d) surface friction on
the blade and annular walls, e) clearance between the blade tip and the casing and f)
wake produced at the end of the rotary [141].
4.4.2 Gas Turbine Model
In this section, the gas turbine model is introduced independently of the particular
fuel. The flow diagram is shown in Fig. 4.3. Broadly, the gas turbine system consists
of an air compressor (AC), a combustion chamber (CC) and a gas turbine (GT). The
air compressor pressurizes ambient air at a pressure ratio of 1.255 for each of its 13
stages. In this work, the suction loss at the compressor inlet is incorporated by the
polytropic efficiency. The pressure of the bleed air flows used for cooling and sealing
the turbine is assumed to be at least 10 % higher than the pressure at the inlet of the
gas turbine, but at least 1 bar [142]. Altogether, seven cooling and seven sealing flows
are considered. Within the combustion chamber, the pressure loss (6.5 % of the inlet
pressure) is separated into two parts: for combustion purposes, the exit air of the
compressor needs to be throttled from almost sonic speed within the diffusor (T1).
49

Chapter 4 Modeling
1-8 9-11 12-13
ACx(13xStages)
G
CC
Naturalxgasorxsyngas
Vanexcooling
VanexsealingBladexcoolingBladexsealing
GT(4xStages)x
Air
Excessxair
Coolingxair
Fluexgas
Combustionxgas
Airxfromxcompressor
Vanex(i) Bladex(i) Vanex(i+1)
Coolingxandxsealingxair
T1
T2
HX
Figure 4.3: Flow diagram of the gas turbine system.
The larger part occurs within the combustor (T2) because this has a positive effect on
the mixing of fuel and air as well as on the combustion process [143].
Subsequently, the compressed air is split into a stoichiometric and an excess part.
The stoichiometric air enters the throttling unit (T2) representing the pressure losses
caused by the combustor swirler at the combustor inlet. Compared to the compressed
air, the fuel gas enters the system at a higher pressure. It gets throttled to the lower
pressure of the compressed air and is then mixed with the stoichiometric air flow.
Hence, the combustor uses the pre-mixing configuration. The subsequent stoichio-
metric combustion results in the adiabatic combustion temperature at the combustor
exit. The combustion gas is then mixed with the excess air flow which decreases
the temperature. Prior to that, the excess air is throttled to the lower pressure of the
combustion gas. The heat loss of the overall system caused by high temperatures
is represented by the cooler HX. At the outlet of the combustion chamber, the com-
bustion air is mixed with the throttled cooling air of the combustion chamber. The
particular design of the combustion chamber is highly complex and strongly depends
on the choice of the manufacturer.
The model of each turbine stage according to Kail [142] is presented in Fig. 4.3
within the dotted line in the upper right corner. Only within the last stage no cooling
air is needed because the main gas temperature drops below the maximum acceptable
temperature of the vanes and blades surface without TBC of 950 °C [144]. The pressure
ratio (about 0.5) is assumed to stay constant among the turbine stages. Furthermore,
50
4.4 Gas Turbine System
the pressure drop of the vane caused by profile and surface friction is represented by
a throttling unit. The first three stages are cooled by convective heat transfer as well
as an air film layer to protect the materials against the high temperature of the main
gas stream. The amount of convective heat transfer within the vanes and blades is
estimated by the temperature of the exiting cooling air, which is 600 °C in case of the
first and second stage, and 480 °C in case of the third stage [142].
The sealing air prevents the main gas stream from passing the vane or blade
through the clearance between tip and casing. The limited ability of the sealing air to
generate mechanical power is represented by mixing the air into the main gas stream
subsequent to the blades. Before the cooling or sealing air is mixed into the main
gas stream, it is throttled to the lower pressure level of the main stream representing
the mixing at different pressures. The cooling air of the blades is then mixed into the
main stream. On the one hand, a part of this air produces work through the blades but
on the other hand, a part of the vane cooling air does not produce work through the
blades. Based on the assumptions presented by Kail [142], both effects compensate
each other approximately. Finally, the sealing air of the blades is mixed into the main
gas stream subsequent to the throttling unit representing the pressure loss of the next
stage vane. Throttling within the secondary air system includes the pressure drop
caused by transport as well as the mixing at different pressures. The determination
of the losses associated with transport depends on the particular design considering
the pipe diameter, pipe length and air velocity. The preparation of ambient air by
filtering is not part of this work. The developed model potentially enables engineers to
perform a sensitivity analysis, for example, on the stage pressure ratio or the working
fluid. Changing the firing temperature will need further modeling enhancements.
4.4.3 Cases Running on Different Fuels
Gas turbine systems running on natural gas are widely used in the industry and major
parameters are well published. Data of gas turbine systems running on H2-rich syngas
are not that much available, and some systems are still under research. Based on
characteristic parameters identified by simulating a gas turbine running on natural
gas, a gas turbine running on syngas was simulated. Both systems are further denoted
as:
• NGGT - Gas Turbine running on Natural Gas,
• SGT - Gas Turbine running on Syngas.
First, the description of the NGGT case is presented and then the SGT case follows.
51
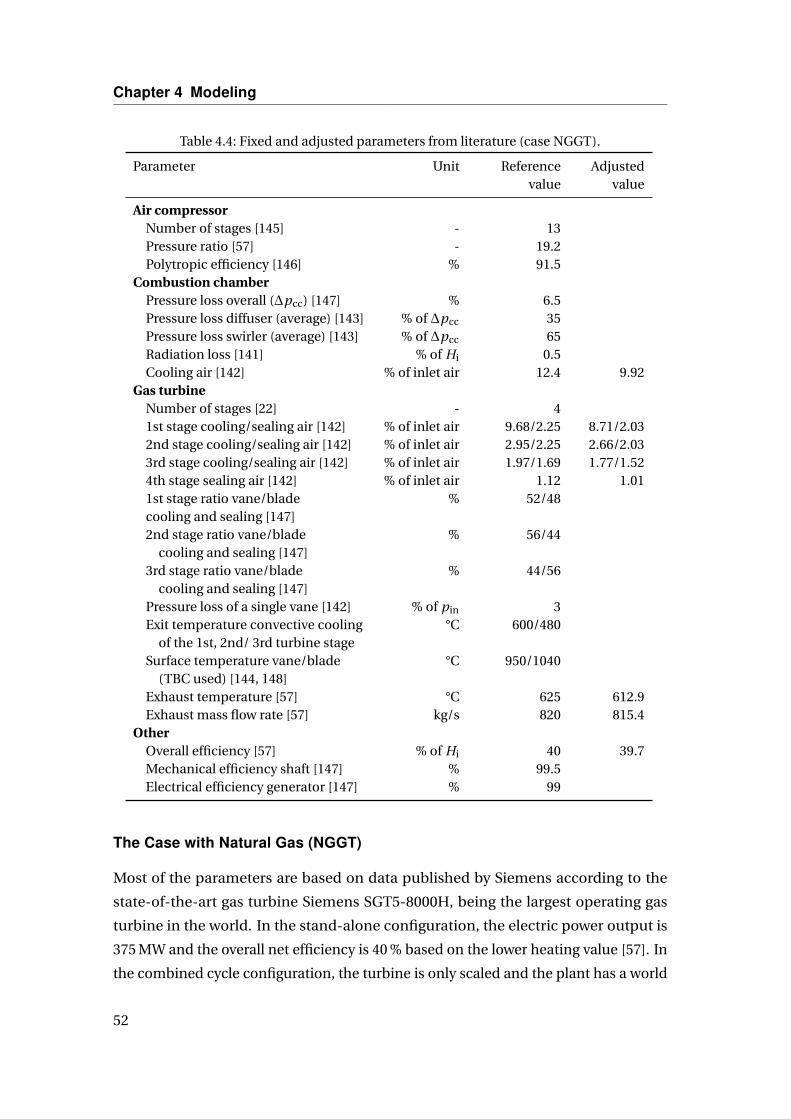
Chapter 4 Modeling
Table 4.4: Fixed and adjusted parameters from literature (case NGGT).
Parameter Unit Reference Adjustedvalue value
Air compressorNumber of stages [145] - 13Pressure ratio [57] - 19.2Polytropic efficiency [146] % 91.5
Combustion chamberPressure loss overall (∆pcc) [147] % 6.5Pressure loss diffuser (average) [143] % of ∆pcc 35Pressure loss swirler (average) [143] % of ∆pcc 65Radiation loss [141] % of Hi 0.5Cooling air [142] % of inlet air 12.4 9.92
Gas turbineNumber of stages [22] - 41st stage cooling/sealing air [142] % of inlet air 9.68/2.25 8.71/2.032nd stage cooling/sealing air [142] % of inlet air 2.95/2.25 2.66/2.033rd stage cooling/sealing air [142] % of inlet air 1.97/1.69 1.77/1.524th stage sealing air [142] % of inlet air 1.12 1.011st stage ratio vane/blade % 52/48cooling and sealing [147]2nd stage ratio vane/blade % 56/44
cooling and sealing [147]3rd stage ratio vane/blade % 44/56
cooling and sealing [147]Pressure loss of a single vane [142] % of pin 3Exit temperature convective cooling °C 600/480
of the 1st, 2nd/ 3rd turbine stageSurface temperature vane/blade °C 950/1040
(TBC used) [144, 148]Exhaust temperature [57] °C 625 612.9Exhaust mass flow rate [57] kg/s 820 815.4
OtherOverall efficiency [57] % of Hi 40 39.7Mechanical efficiency shaft [147] % 99.5Electrical efficiency generator [147] % 99
The Case with Natural Gas (NGGT)
Most of the parameters are based on data published by Siemens according to the
state-of-the-art gas turbine Siemens SGT5-8000H, being the largest operating gas
turbine in the world. In the stand-alone configuration, the electric power output is
375 MW and the overall net efficiency is 40 % based on the lower heating value [57]. In
the combined cycle configuration, the turbine is only scaled and the plant has a world
52
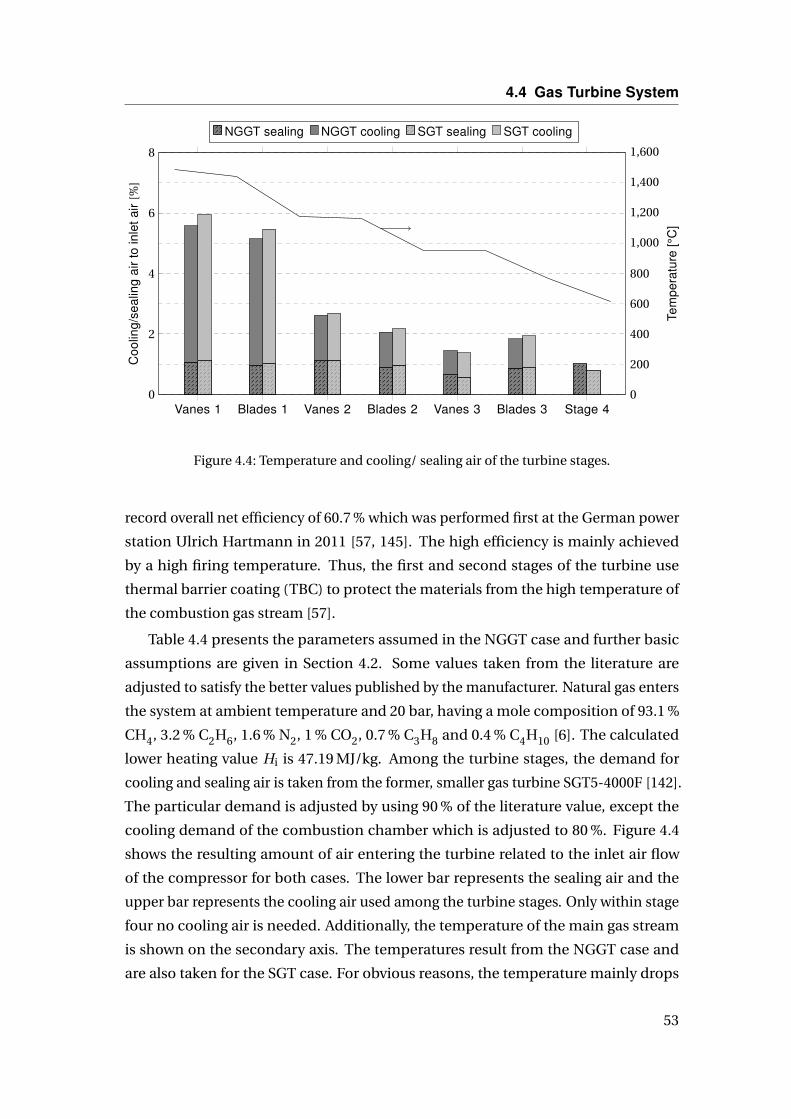
4.4 Gas Turbine System
1 2 3 4 5 6 7 80
200
400
600
800
1,000
1,200
1,400
1,600
Tem
pera
ture
[°C
]
Vanes 1 Blades 1 Vanes 2 Blades 2 Vanes 3 Blades 3 Stage 40
2
4
6
8
Coo
ling/
seal
ing
air
t oin
leta
ir[%
]NGGT sealing NGGT cooling SGT sealing SGT cooling
Figure 4.4: Temperature and cooling/ sealing air of the turbine stages.
record overall net efficiency of 60.7 % which was performed first at the German power
station Ulrich Hartmann in 2011 [57, 145]. The high efficiency is mainly achieved
by a high firing temperature. Thus, the first and second stages of the turbine use
thermal barrier coating (TBC) to protect the materials from the high temperature of
the combustion gas stream [57].
Table 4.4 presents the parameters assumed in the NGGT case and further basic
assumptions are given in Section 4.2. Some values taken from the literature are
adjusted to satisfy the better values published by the manufacturer. Natural gas enters
the system at ambient temperature and 20 bar, having a mole composition of 93.1 %
CH4, 3.2 % C2H6, 1.6 % N2, 1 % CO2, 0.7 % C3H8 and 0.4 % C4H10 [6]. The calculated
lower heating value Hi is 47.19 MJ/kg. Among the turbine stages, the demand for
cooling and sealing air is taken from the former, smaller gas turbine SGT5-4000F [142].
The particular demand is adjusted by using 90 % of the literature value, except the
cooling demand of the combustion chamber which is adjusted to 80 %. Figure 4.4
shows the resulting amount of air entering the turbine related to the inlet air flow
of the compressor for both cases. The lower bar represents the sealing air and the
upper bar represents the cooling air used among the turbine stages. Only within stage
four no cooling air is needed. Additionally, the temperature of the main gas stream
is shown on the secondary axis. The temperatures result from the NGGT case and
are also taken for the SGT case. For obvious reasons, the temperature mainly drops
53
Chapter 4 Modeling
through the blades during the expansion. The overall cooling and sealing demand
amounts to 19.7 % in case of the turbine and 9.9 % in case of the combustion chamber.
The COT (Combustor Outlet Temperature) results to 1490 °C and the isentropic
stage efficiencies of the blades, starting from the first stage, are 90.5 %, 91 %, 91.5 % and
92 %, respectively. According to the ISO 2314 standard, the Turbine Inlet Temperature
TITISO is calculated to 1309 °C, and the isentropic efficiency of the compressor and
turbine are 88.2 % and 87.9 %, respectively. Furthermore, the air-fuel equivalence
ratio amounts to 1.79 in the case of the combustion chamber, and 2.54 for the overall
system.
The Case with Syngas (SGT)
Based on the characteristic parameters found by the simulation of the NGGT case, a
gas turbine model firing syngas was developed. The syngas is produced by gasification
of the coal type Illinois No.6 (see Section 4.2) within an IGCC plant with carbon capture
described in Section 4.5.1 (case IGCC-1). The final mole composition of the prepared
syngas amounts to 80.6 % H2, 2.8 % CO, 12.5 % H2O, 4.1 % N2 and on the balance CH4
and CO2. The final temperature is 145.1 °C and the pressure is 34.1 bar.
The model design is similar to the NGGT case (see Fig 4.3). Identical assumptions
are made for a) the air compressor pressure ratio, b) each isentropic efficiency and c)
the combustion chamber. Compared to the NGGT case, the temperatures of the main
gas flow within the turbine remain constant which corresponds to the same material
limitations. Hence, it is feasible to keep the isentropic efficiencies of the rotor stages
constant. The demand of cooling and sealing air gets adjusted by the constant outlet
temperatures of each mixing process within the turbine. The exit temperature of the
cooling air leaving the vanes and blades after convective heat transfer is assumed to
remain constant at 600 °C in the case of the first and second stage and 480 °C in the
case of the third stage.
The state changes are shown by the T-s diagram in Fig. 4.5. Thereby the presented
entropy relates to the mass flow rate of air at the compressor inlet. On the left side, the
overall system is presented including the convective heat transfer within the vanes and
blades. The calculated adiabatic combustion temperature is presented at 2366 °C. On
the right side, the state variables of the first turbine stage are presented in detail. The
cooling and sealing demand of the whole turbine related to the compressor inlet air
amounts to 20.4 % and in the case of the combustion chamber to 10.6 %. Compared
to the NGGT case, the overall cooling demand increases due to a higher specific
54

4.5 Reference IGCC with Pre-Combustion Decarbonisation
0 0.3 0.6 0.9 1.2 1.50
500
1,000
1,500
2,000
2,500
Entropy [kJ/kgK]
Tem
pera
ture
[°C
]
1.04 1.06 1.08 1.1 1.12 1.141,100
1,200
1,300
1,400
1,500
1,600
Entropy [kJ/kgK]
Tem
pera
ture
[°C
]
Figure 4.5: T-s diagram of the gas turbine system (SGT case): (left) overall, (right) first turbinestage.
heat capacity of the combustion gas determined by the combustion of syngas. The
adiabatic combustion temperature increases slightly due to the higher mass-based
heating value of hydrogen as well as the higher fuel gas temperature. The resulting
air-fuel equivalence ratio is 2.1 in case of the combustion chamber and 2.9 for the
overall system. Furthermore, the TITISO results in 1313°C, and the isentropic efficiency
of the compressor and turbine are 88.2 % and 89.1 %, respectively. The overall net
efficiency increases by 2.1 % points to 41.8 %.
4.5 Reference IGCC with Pre-CombustionDecarbonisation
4.5.1 High-Efficiency IGCC Using a Shell Gasifier
The IGCC plants using CLC are benchmarked against a conventional, high-efficiency
IGCC process serving as the reference case. The plant configuration was chosen
according to plants discussed by the U.S. DOE [6] and others. A simplified flow diagram
of case IGCC-1 is shown in Fig. 4.6, and a selection of flows from the simulation is
presented in Table 4.5. The basic assumptions and type of coal are presented in
Section 4.2, and further assumptions of this case are shown in Table 4.6. The major
subsystems of the IGCC are the gasification island, Air Separation Unit (ASU), Acid Gas
Removal (AGR) unit, gas turbine system, and steam cycle. A dry coal-fed Shell gasifier
is used for gasification, this being a well-proven and efficient technology. The received
bituminous coal containing 9.5 % moisture enters the dryer unit and is dried to a
residual moisture of 5 %, using heated nitrogen within the dryer. The prepared coal is
55

Chapter 4 Modeling
G
Fly
Bash
Sla
gQue
nchB
gasB
blo
wer
Mill
Gas
ifier
Raw ga
sBco
oler
Ste
amBfr
om
BH
RS
G
Wet
BN6B
vent
MM
Coa
l
Bla
ckB
wat
erScr
ubbe
r HT
9WG
S
LT9W
GS
Ste
amBfr
om
BH
RS
G
Offg
as
Gas
Bturb
ine
Hea
t9re
cove
ryBs
team
Bgen
erat
or
Syn
gas
Nitr
oge
n
Oxy
genLo
ckho
pper
Mem
bra
new
all
Dry
er
Sat
ura
tor
CO
6B
abso
rber
H6S
Bab
sorb
er
CO
6B
Ste
am
4
57
8
9 5U
54
O6B
from
BBBA
SU
SB
M
MM
5
Cla
usBp
lant
Offg
as
6
3
56
53
55
56
57
5859
6U
64
65
65
ToB
Cla
usB
plan
t
6
Sel
exo
lBuni
t
Ste
amBtu
rbin
e
AS
U
Wat
er
Air
Air
55
G
6663
Wat
erBfr
omB
HR
SG
Nitr
oge
n
Wat
er
Figure 4.6: Flow diagram of the IGCC plant with carbon capture using a Shell gasifier (caseIGCC-1).
56
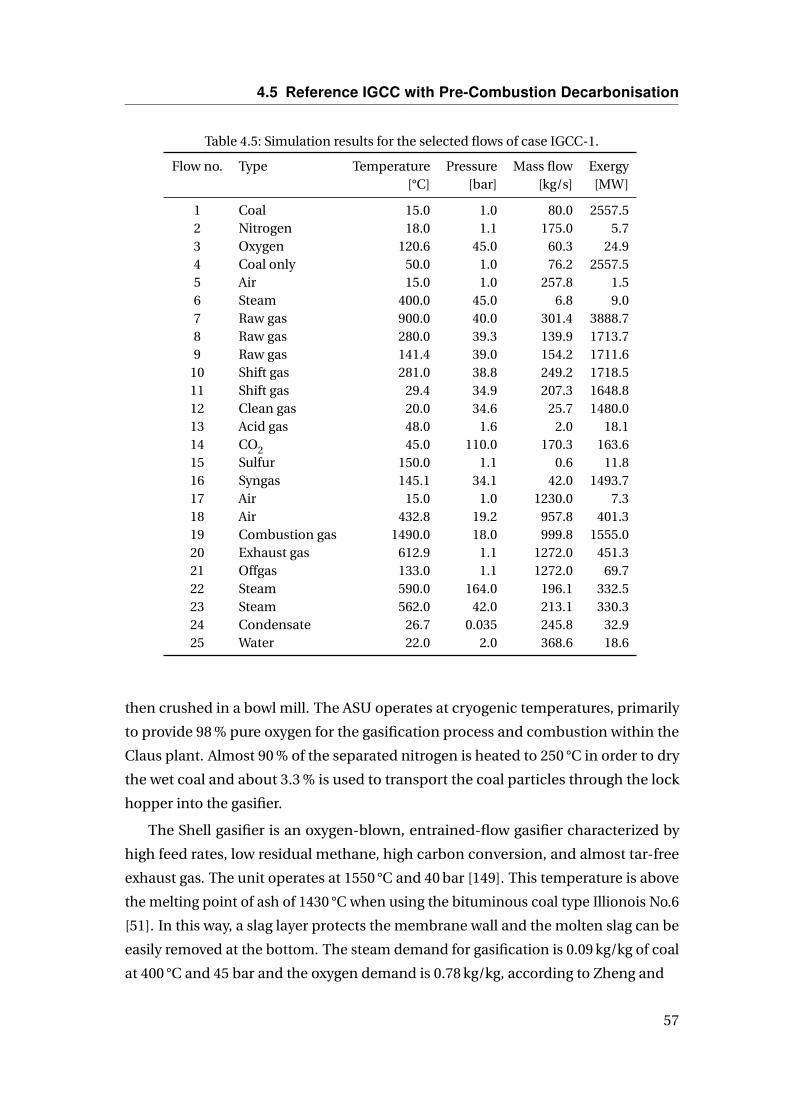
4.5 Reference IGCC with Pre-Combustion Decarbonisation
Table 4.5: Simulation results for the selected flows of case IGCC-1.
Flow no. Type Temperature Pressure Mass flow Exergy[°C] [bar] [kg/s] [MW]
1 Coal 15.0 1.0 80.0 2557.52 Nitrogen 18.0 1.1 175.0 5.73 Oxygen 120.6 45.0 60.3 24.94 Coal only 50.0 1.0 76.2 2557.55 Air 15.0 1.0 257.8 1.56 Steam 400.0 45.0 6.8 9.07 Raw gas 900.0 40.0 301.4 3888.78 Raw gas 280.0 39.3 139.9 1713.79 Raw gas 141.4 39.0 154.2 1711.6
10 Shift gas 281.0 38.8 249.2 1718.511 Shift gas 29.4 34.9 207.3 1648.812 Clean gas 20.0 34.6 25.7 1480.013 Acid gas 48.0 1.6 2.0 18.114 CO2 45.0 110.0 170.3 163.615 Sulfur 150.0 1.1 0.6 11.816 Syngas 145.1 34.1 42.0 1493.717 Air 15.0 1.0 1230.0 7.318 Air 432.8 19.2 957.8 401.319 Combustion gas 1490.0 18.0 999.8 1555.020 Exhaust gas 612.9 1.1 1272.0 451.321 Offgas 133.0 1.1 1272.0 69.722 Steam 590.0 164.0 196.1 332.523 Steam 562.0 42.0 213.1 330.324 Condensate 26.7 0.035 245.8 32.925 Water 22.0 2.0 368.6 18.6
then crushed in a bowl mill. The ASU operates at cryogenic temperatures, primarily
to provide 98 % pure oxygen for the gasification process and combustion within the
Claus plant. Almost 90 % of the separated nitrogen is heated to 250 °C in order to dry
the wet coal and about 3.3 % is used to transport the coal particles through the lock
hopper into the gasifier.
The Shell gasifier is an oxygen-blown, entrained-flow gasifier characterized by
high feed rates, low residual methane, high carbon conversion, and almost tar-free
exhaust gas. The unit operates at 1550 °C and 40 bar [149]. This temperature is above
the melting point of ash of 1430 °C when using the bituminous coal type Illionois No.6
[51]. In this way, a slag layer protects the membrane wall and the molten slag can be
easily removed at the bottom. The steam demand for gasification is 0.09 kg/kg of coal
at 400 °C and 45 bar and the oxygen demand is 0.78 kg/kg, according to Zheng and
57
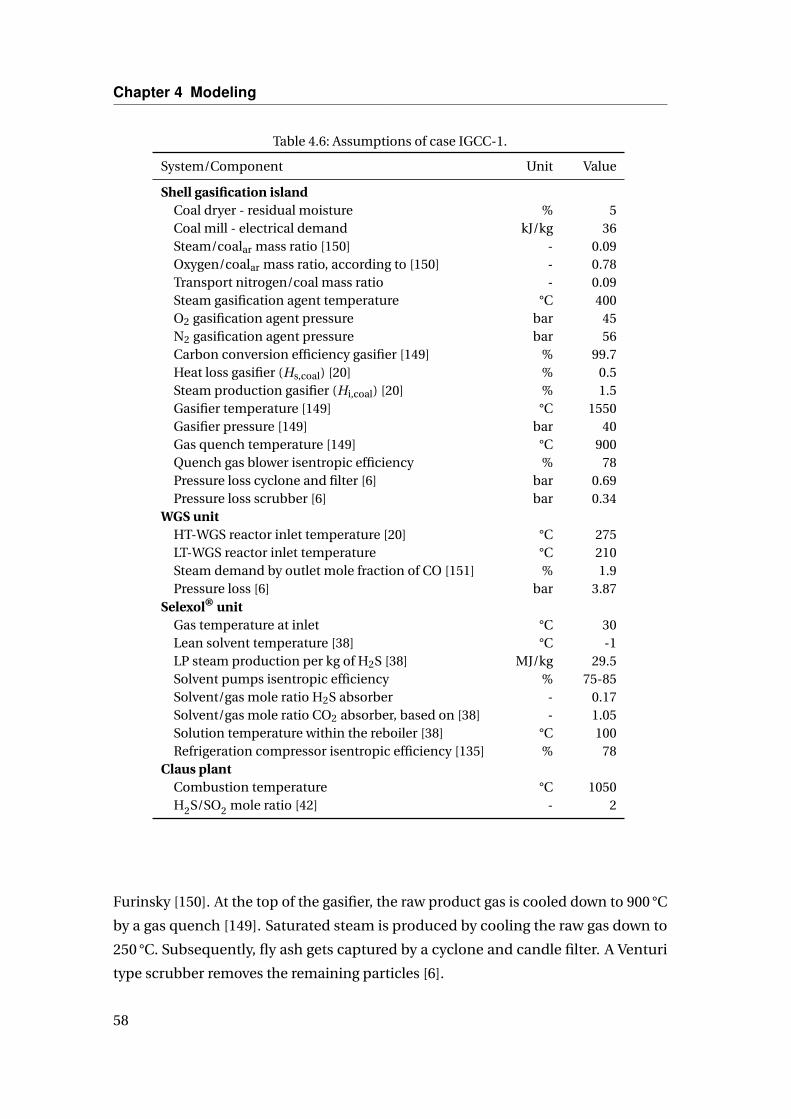
Chapter 4 Modeling
Table 4.6: Assumptions of case IGCC-1.
System/Component Unit Value
Shell gasification islandCoal dryer - residual moisture % 5Coal mill - electrical demand kJ/kg 36Steam/coalar mass ratio [150] - 0.09Oxygen/coalar mass ratio, according to [150] - 0.78Transport nitrogen/coal mass ratio - 0.09Steam gasification agent temperature °C 400O2 gasification agent pressure bar 45N2 gasification agent pressure bar 56Carbon conversion efficiency gasifier [149] % 99.7Heat loss gasifier (Hs,coal) [20] % 0.5Steam production gasifier (Hi,coal) [20] % 1.5Gasifier temperature [149] °C 1550Gasifier pressure [149] bar 40Gas quench temperature [149] °C 900Quench gas blower isentropic efficiency % 78Pressure loss cyclone and filter [6] bar 0.69Pressure loss scrubber [6] bar 0.34
WGS unitHT-WGS reactor inlet temperature [20] °C 275LT-WGS reactor inlet temperature °C 210Steam demand by outlet mole fraction of CO [151] % 1.9Pressure loss [6] bar 3.87
Selexol® unitGas temperature at inlet °C 30Lean solvent temperature [38] °C -1LP steam production per kg of H2S [38] MJ/kg 29.5Solvent pumps isentropic efficiency % 75-85Solvent/gas mole ratio H2S absorber - 0.17Solvent/gas mole ratio CO2 absorber, based on [38] - 1.05Solution temperature within the reboiler [38] °C 100Refrigeration compressor isentropic efficiency [135] % 78
Claus plantCombustion temperature °C 1050H2S/SO2 mole ratio [42] - 2
Furinsky [150]. At the top of the gasifier, the raw product gas is cooled down to 900 °C
by a gas quench [149]. Saturated steam is produced by cooling the raw gas down to
250 °C. Subsequently, fly ash gets captured by a cyclone and candle filter. A Venturi
type scrubber removes the remaining particles [6].
58
4.5 Reference IGCC with Pre-Combustion Decarbonisation
A Water Gas Shift (WGS) reactor converts the CO of the raw syngas into H2 and CO2
by adding steam from the intermediate pressure level at 380 °C. Only a two-stage WGS
reactor is capable of meeting carbon capture efficiencies above 75% [152]. The steam
demand and temperature are selected to reduce the CO mole fraction to about 1.9 %
[151]. The sour gas enters the High-Temperature Water Gas Shift reactor (HT-WGS)
at 275 °C [20] and exits it at 520 °C. The Low-Temperature Water Gas Shift reactor
(LT-WGS) increases the temperature from 210 to 289 °C. The gas is then cooled to 30 °C
and sent to the dual-stage AGR unit introduced in Section 2.2.1.
The Selexol® solvent is used for physical absorption of H2S and CO2. In order
to ensure proper absorption conditions, a refrigeration machine using CO2 as the
working fluid is required. The regeneration of the H2S-rich solvent is realized by an
acid gas stripper, which needs latent heat within the reboiler provided by steam from
the HRSG. The mole composition of the acid gas is 35 % H2S, 52.9 % CO2, 0.2 % H2O,
11 % H2, and the remainder is N2. Subsequently, the amount of H2S is converted
into elemental sulfur by using a three-stage Claus plant. In this process, pure oxygen
provided by the ASU is required. The CO2-rich solvent passes three flash stages in
order to separate the CO2, which is further pressurized by an intercooled three-stage
compressor to ensure the transport conditions. Finally, the clean syngas exits the AGR
unit at 20°C.
Due to the high mole fraction of hydrogen (92.1 %) of the clean syngas, it is rea-
sonable to dilute the syngas before entering the gas turbine. Therefore, a saturator
increases the mole fraction of water to about 12.5 %. Conditioned by hot water, the
temperature of the gas stream increases from 20 °C to 145.1 °C. After conditioning,
the syngas mole composition amounts to 80.6 % H2, 2.8 % CO, 12.5 % H2O, 4.1 % N2
and on the balance CH4 and CO2. The syngas is fired in a gas turbine system which
is described in Section 4.4. Especially the assumptions are presented in Table 4.4.
According to the ISO 2314 standard, the resulting turbine inlet temperature TITISO
is calculated to 1313 °C. The exhaust gas enters the HRSG at 615 °C and is cooled to
132 °C. Details of the steam cycle are presented in Section 4.3.2.
4.5.2 Low-Cost IGCC Using a GEE Gasifier
The IGCC plant presented in this section was developed in order to analyze the po-
tential for a flexible generation of electricity and hydrogen. In general, the plant
configuration and major assumptions were mainly selected according to a plant dis-
cussed by the U.S. DOE [6]. Some units like the ASU, WGS reactor, AGR unit and
59
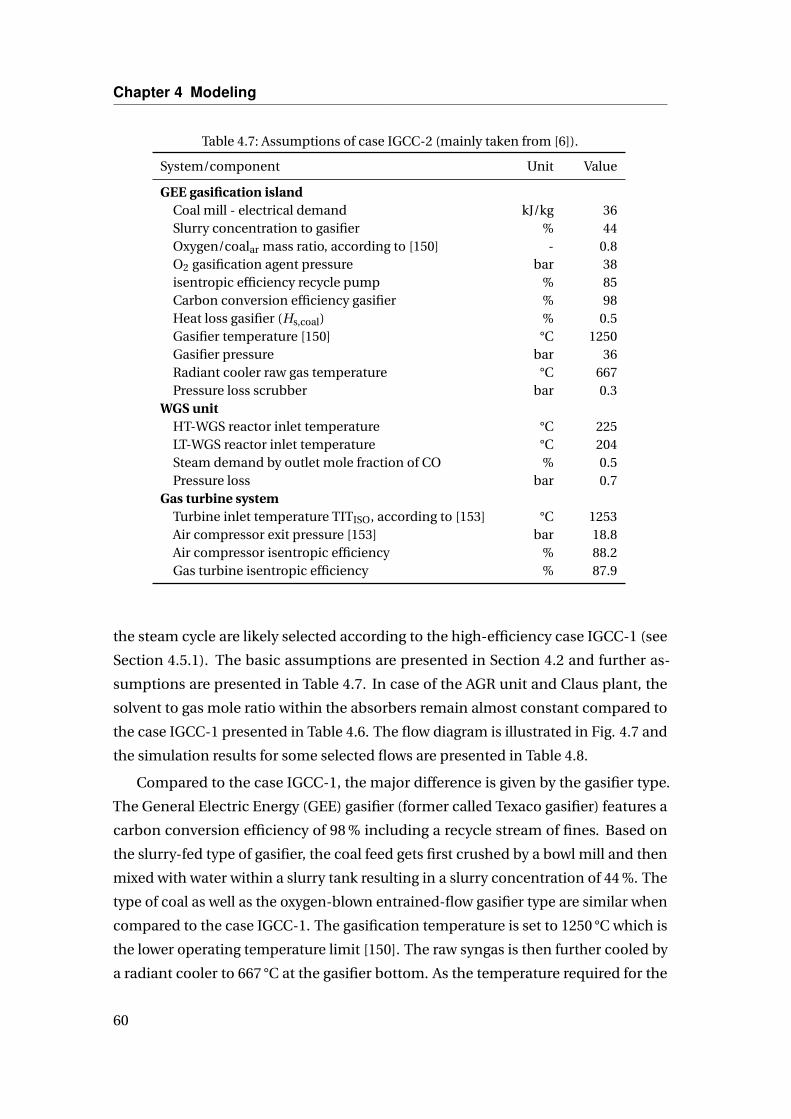
Chapter 4 Modeling
Table 4.7: Assumptions of case IGCC-2 (mainly taken from [6]).
System/component Unit Value
GEE gasification islandCoal mill - electrical demand kJ/kg 36Slurry concentration to gasifier % 44Oxygen/coalar mass ratio, according to [150] - 0.8O2 gasification agent pressure bar 38isentropic efficiency recycle pump % 85Carbon conversion efficiency gasifier % 98Heat loss gasifier (Hs,coal) % 0.5Gasifier temperature [150] °C 1250Gasifier pressure bar 36Radiant cooler raw gas temperature °C 667Pressure loss scrubber bar 0.3
WGS unitHT-WGS reactor inlet temperature °C 225LT-WGS reactor inlet temperature °C 204Steam demand by outlet mole fraction of CO % 0.5Pressure loss bar 0.7
Gas turbine systemTurbine inlet temperature TITISO, according to [153] °C 1253Air compressor exit pressure [153] bar 18.8Air compressor isentropic efficiency % 88.2Gas turbine isentropic efficiency % 87.9
the steam cycle are likely selected according to the high-efficiency case IGCC-1 (see
Section 4.5.1). The basic assumptions are presented in Section 4.2 and further as-
sumptions are presented in Table 4.7. In case of the AGR unit and Claus plant, the
solvent to gas mole ratio within the absorbers remain almost constant compared to
the case IGCC-1 presented in Table 4.6. The flow diagram is illustrated in Fig. 4.7 and
the simulation results for some selected flows are presented in Table 4.8.
Compared to the case IGCC-1, the major difference is given by the gasifier type.
The General Electric Energy (GEE) gasifier (former called Texaco gasifier) features a
carbon conversion efficiency of 98 % including a recycle stream of fines. Based on
the slurry-fed type of gasifier, the coal feed gets first crushed by a bowl mill and then
mixed with water within a slurry tank resulting in a slurry concentration of 44 %. The
type of coal as well as the oxygen-blown entrained-flow gasifier type are similar when
compared to the case IGCC-1. The gasification temperature is set to 1250 °C which is
the lower operating temperature limit [150]. The raw syngas is then further cooled by
a radiant cooler to 667 °C at the gasifier bottom. As the temperature required for the
60

4.5 Reference IGCC with Pre-Combustion Decarbonisation
G
Sla
g
Mill
Gas
ifier
M
Coa
l
Que
nch
andy
scru
bbe
r
HT
6WG
S
LT6W
GS
Ste
amyfr
om
yH
RS
G
Offg
as
Gas
yturb
ine
Hea
t6re
cove
ryys
team
ygen
erat
or
Syn
gas
Oxy
gen
Sat
ura
tor
CO
wyab
sorb
er
CO
wy
Ste
am
B
y7
y9
Owy
from
yyyA
SU
Sy
M
MM
3
Cla
usyp
lant
Offg
as
Bk
BB
Bw
B3
B4B5
B6
B7
Toy
Cla
usy
plan
t
Sel
exo
lyuni
t
Ste
amytu
rbin
e
AS
U
Wat
er
Air
Air
y8
G
Wat
er
Con
den
sate
5
Nitr
oge
n
M
6
4
Slu
rryy
tank
Bla
cky
wat
er
w
wk
wBB8
B9
HwS
yab
sorb
er
Figure 4.7: Flow diagram of the IGCC plant with carbon capture using a GEE gasifier (caseIGCC-2).
61
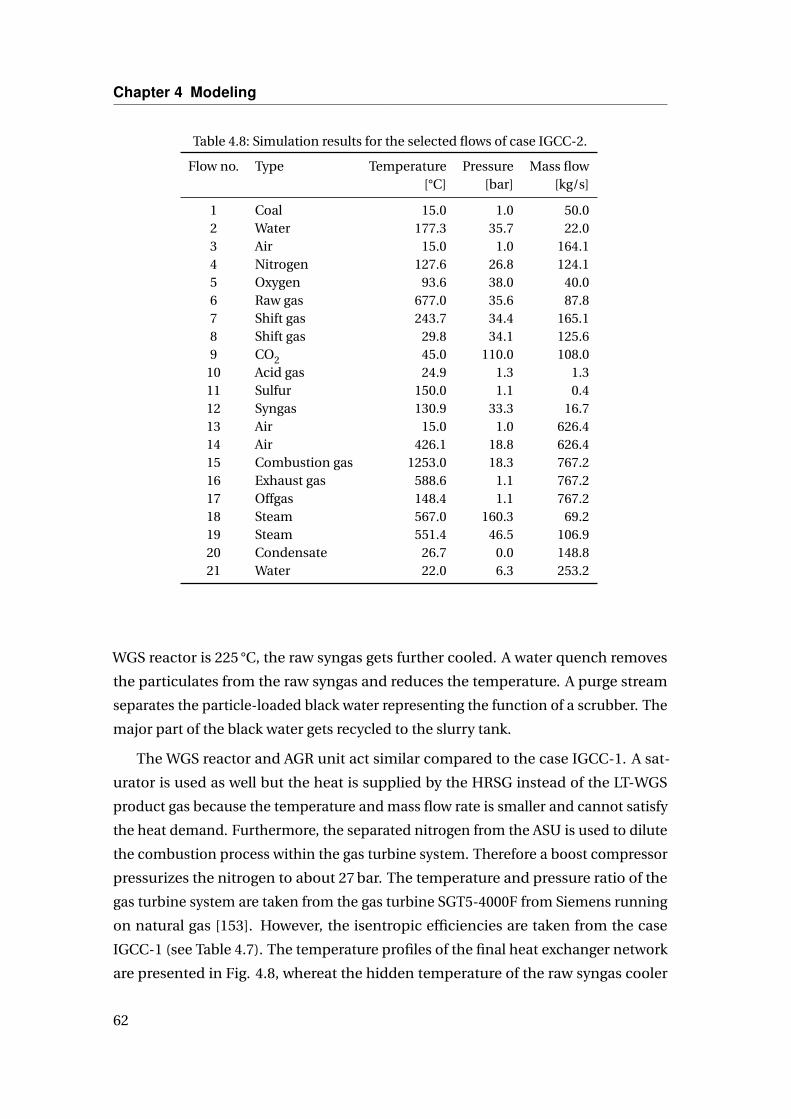
Chapter 4 Modeling
Table 4.8: Simulation results for the selected flows of case IGCC-2.
Flow no. Type Temperature Pressure Mass flow[°C] [bar] [kg/s]
1 Coal 15.0 1.0 50.02 Water 177.3 35.7 22.03 Air 15.0 1.0 164.14 Nitrogen 127.6 26.8 124.15 Oxygen 93.6 38.0 40.06 Raw gas 677.0 35.6 87.87 Shift gas 243.7 34.4 165.18 Shift gas 29.8 34.1 125.69 CO2 45.0 110.0 108.0
10 Acid gas 24.9 1.3 1.311 Sulfur 150.0 1.1 0.412 Syngas 130.9 33.3 16.713 Air 15.0 1.0 626.414 Air 426.1 18.8 626.415 Combustion gas 1253.0 18.3 767.216 Exhaust gas 588.6 1.1 767.217 Offgas 148.4 1.1 767.218 Steam 567.0 160.3 69.219 Steam 551.4 46.5 106.920 Condensate 26.7 0.0 148.821 Water 22.0 6.3 253.2
WGS reactor is 225 °C, the raw syngas gets further cooled. A water quench removes
the particulates from the raw syngas and reduces the temperature. A purge stream
separates the particle-loaded black water representing the function of a scrubber. The
major part of the black water gets recycled to the slurry tank.
The WGS reactor and AGR unit act similar compared to the case IGCC-1. A sat-
urator is used as well but the heat is supplied by the HRSG instead of the LT-WGS
product gas because the temperature and mass flow rate is smaller and cannot satisfy
the heat demand. Furthermore, the separated nitrogen from the ASU is used to dilute
the combustion process within the gas turbine system. Therefore a boost compressor
pressurizes the nitrogen to about 27 bar. The temperature and pressure ratio of the
gas turbine system are taken from the gas turbine SGT5-4000F from Siemens running
on natural gas [153]. However, the isentropic efficiencies are taken from the case
IGCC-1 (see Table 4.7). The temperature profiles of the final heat exchanger network
are presented in Fig. 4.8, whereat the hidden temperature of the raw syngas cooler
62

4.6 IGCC Using Chemical-Looping Combustion
0 100 200 300 400 500 600 7000
200
400
600
800
HRSG
Radiant cooler
HT-WGS
LT WGS
Saturator
AGR
Enthalpy rate difference [MW]
Tem
pera
ture
[°C
]
Figure 4.8: Temperature profiles of the heat transfer within case IGCC-2.
inlet is about 677 °C, see Table 4.8. The flow diagram of the steam cycle is given in
Section 5.4.1 in context of the off-design analysis.
4.6 IGCC Using Chemical-Looping Combustion
This section presents the assumptions as well as the system and component modeling
of the IGCC plants using CLC simulated in the scale of a conventional coal-fired power
plant. All cases, including a CLC unit, use recycled CO2 to transport the coal into the
gasifier instead of using pressurized N2 provided by the ASU to increase the purity of
the captured CO2 stream. Similar to the base cases, the air demand of the ASU is not
provided by the gas turbine system compressor in order to ensure a good operational
flexibility. The temperature profiles of the heat transfer that are not presented in this
section are given in the Appendix A (cases CLC-Ni1,CLC-Ni2,CLC-Ni4,CLC-Fe2,CLC-
Fe4,CLC-Fe5).
Among others, the author of this work already published the analysis of an IGCC
using a two-reactor CLC system with nickel oxide as the oxygen carrier [89, 90] as
well as the results of an IGCC using a three-reactor CLC system with iron oxide as the
oxygen carrier [98–101]. In this work, some system configurations, like e.g. the cooling
concept of the CLC reactors, are changed and a consistent set of assumptions was
used to accomplish a convenient discussion of the results.
63
Chapter 4 Modeling
4.6.1 Modeling of the CLC System
The fundamentals of CLC are introduced in Section 2.4. The two-reactor system
uses NiO and the three-reactor system uses Fe2O3 as the oxygen carrier circulating
among the CLC reactors. The circulation rate of the oxygen carrier is determined by
the reactions within the fuel reactor. Increasing the oxygen carrier circulation rate
increases the fuel conversion. On the contrary, the demand of cooling air within the air
reactor simultaneously increases, which causes a larger component size and therefore
higher capital costs. Additionally, the exit temperature of the fuel reactor increases
slightly as the characteristic of the net reaction is slightly endothermic and on that
account heat is transferred from the oxygen carrier to the product gas. In general,
higher temperatures are potentially useful to produce superheated steam within the
subsequent HRSG but the costs of the HRSG potentially increase due to a higher
thermal resistance required by the heat exchanger materials. However, additional
support material within the CLC unit is not considered within the simulations because
it merely acts as an inert catalyst.
The pressure drop of the CLC reactors is supposed to depend on the factual size
and particular design. Kempkes and Kather [77] present a pressure drop of 200 mbar
used in the air reactor and 300 mbar used in the fuel reactor. In this work, the pressure
drop is higher in all cases.
4.6.2 IGCC Using a Two-Reactor CLC Unit
The CLC unit using a two-reactor system replaces the conventional combustion cham-
ber of the gas turbine system. General assumptions are presented in Section 4.2 and
Table 4.1 presents specifications of the analyzed cases. The complex model of the
gas turbine presented in Section 4.4 is not suitable as the turbine inlet temperature
changes. Instead, a simplified three-component model according to the ISO 2314
standard has been developed using the parameters presented in Table 4.7 similar to
the base case IGCC-2. The turbine inlet temperature corresponds to the air reactor
temperature varied among the analyzed cases.
IGCC Plant Using a Shell Gasifier
The cases CLC-Ni1 to CLC-Ni3 use almost the same system components as the base
case IGCC-1 presented in Section 4.5.1. A simplified flow diagram is shown in Fig. 4.9,
and selected flows of case CLC-Ni3 are presented in Table 4.9. Upward of the scrubber,
64
4.6 IGCC Using Chemical-Looping Combustion
the characteristic parameters and the arrangement of components are identical to
case IGCC-1 except the transport of coal into the gasifier uses recycled CO2 instead
of N2. Physical absorption of CO2 as well as a WGS unit are not required due to the
inherent capture ability. The AGR unit only consists of the H2S capture cycle. However,
without a WGS unit an additional hydrolizer is needed to convert carbonyl sulfide
(COS) into CO2 and H2S ba using steam. For IGCC plants using a high-temperature,
entrained-flow gasifier in combination with a two-reactor CLC unit, applying a hot
gas cleaning unit (HGCU) is not recommended. In respect to a high overall efficiency,
an air reactor temperature should be desired which also causes a high fuel reactor
exit temperature depending on the syngas composition. Temperatures above 1000 °C
increase the costs of the flue gas piping system as well as the subsequent HRSG
significantly. Furthermore, this effect is supported by a higher fuel gas temperature.
Compared to the conventional low-temperature, absorption-based gas cleaning, the
application of an HGCU increases the syngas temperature by about 500 °C.
The cleaned syngas exiting the AGR unit is fed to the fuel reactor of the CLC unit,
introduced in Section 2.4, at 20 °C and 36 bar. The syngas mole composition amounts
to 58.1 % CO, 34.3 % H2, 6.3 % CO2 and on the balance N2. Within the fuel reactor, the
oxygen carrier gets reduced and the gaseous product consists of H2O and CO2. The
product gas is then fed to the HRSG 1. The reduced oxygen carrier gets re-oxidized
in the air reactor at temperatures ranging from 1100 °C to 1300 °C, depending on the
particular case. In the air reactor, pressurized air supplied by the compressor of the gas
turbine system is used to fluidize the metal particles. After reactions took place, the
depleted air is separated by a cyclone and then fed to the gas turbine. The expanded
exhaust gas then enters HRSG 2 and finally exits the overall system through a stack.
Like in the base case, the parameters of the steam cycle are determined by applying
mathematical optimization presented in Section 4.3.2. The resulting temperature
profiles of the overall heat transfer are shown in Fig. 4.10 and the Appendix A. To allow
a clearly arranged view on the overall heat transfers, temperatures exceeding 700 °C
are not indicated within the diagram. The hidden temperatures can be received from
Table 4.9. In HRSG 1, mainly steam is superheated due to the higher temperature on
the hot side compared to HRSG 2. However, HRSG 2 is mainly used for producing
saturated steam. Other configurations were found to be worse. Further remarks on
the heat exchanger network design are presented in Section 4.3.2 and 5.3.1.
65

Chapter 4 Modeling
G
Fly
Cash
Sla
g
Que
nchC
gasC
blo
wer
Mill
Gas
ifier
Raw
Cga
sCco
oler
Ste
amCfr
om
CH
RS
GCU
Wet
CN,C
vent
M
Coa
l
Offg
as
Gas
Cturb
ine
Hea
t3re
cove
ryCs
team
Cgen
erat
orC,
CO
,Cre
cycl
eC
Oxy
gen
Lock
hopp
er
Mem
bra
new
all
Dry
er
Ste
am
,
U
z
M
Hea
t3re
cove
ryCs
team
Cgen
erat
orCU
Con
den
sate
CO
,
B
6
8
U0
U9
,,
,0
,zU8
M
U7A
SU
Ste
amCtu
rbin
e
CO
,Cre
cycl
eC
CO
,8C
H,O
Air
Air
0
G
,A,U
Dep
lete
dC
air
Hyd
roly
zer
Scr
ubbe
r
Ste
amCfr
om
CH
RS
GCU
Sel
exo
lCuni
t
Wat
er
O,C
from
CCCA
SU
SC
Cla
usCp
lant
Offg
asUB
Bla
ckC
wat
er
AirC
reac
tor
Uz
Fue
lCre
acto
r
7
Wat
erCfr
omC
HR
SG
CU
9UA
U,
UU
UB
N,C
vent
Nitr
oge
n
H,S
Cab
sorb
er
U6
Figure 4.9: Flow diagram of the IGCC plant using a two-reactor CLC unit and a Shell gasifier.
66
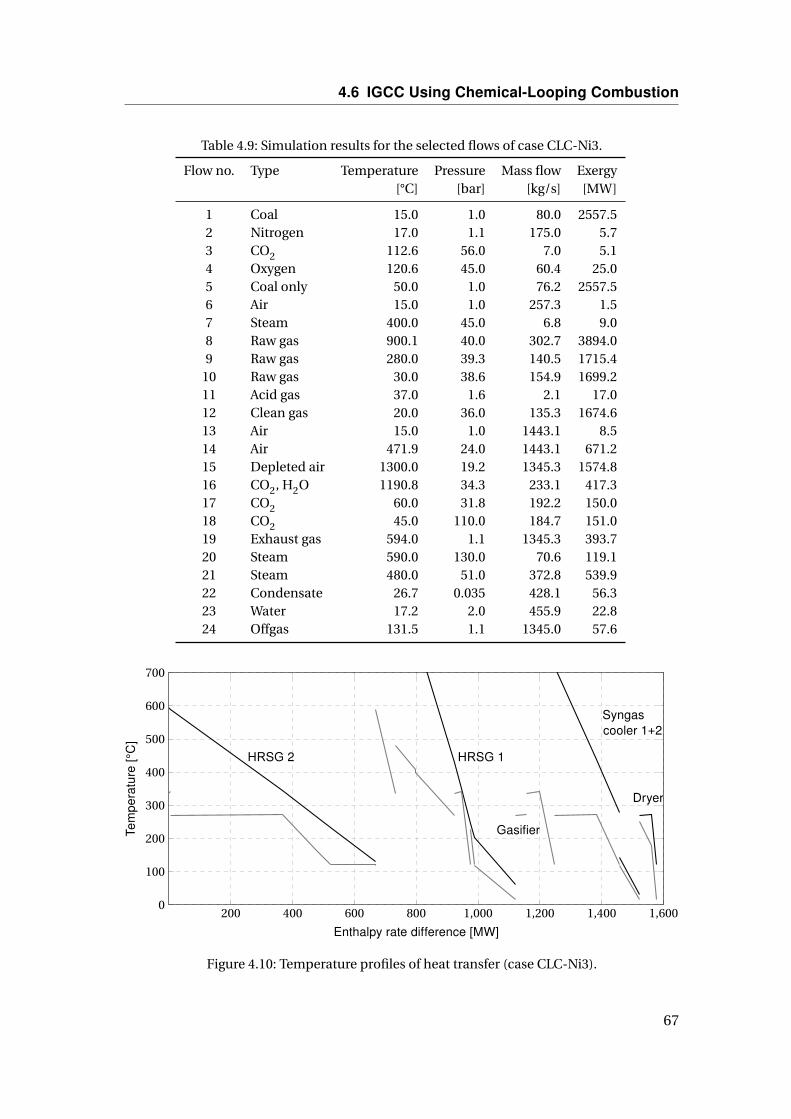
4.6 IGCC Using Chemical-Looping Combustion
Table 4.9: Simulation results for the selected flows of case CLC-Ni3.
Flow no. Type Temperature Pressure Mass flow Exergy[°C] [bar] [kg/s] [MW]
1 Coal 15.0 1.0 80.0 2557.52 Nitrogen 17.0 1.1 175.0 5.73 CO2 112.6 56.0 7.0 5.14 Oxygen 120.6 45.0 60.4 25.05 Coal only 50.0 1.0 76.2 2557.56 Air 15.0 1.0 257.3 1.57 Steam 400.0 45.0 6.8 9.08 Raw gas 900.1 40.0 302.7 3894.09 Raw gas 280.0 39.3 140.5 1715.4
10 Raw gas 30.0 38.6 154.9 1699.211 Acid gas 37.0 1.6 2.1 17.012 Clean gas 20.0 36.0 135.3 1674.613 Air 15.0 1.0 1443.1 8.514 Air 471.9 24.0 1443.1 671.215 Depleted air 1300.0 19.2 1345.3 1574.816 CO2, H2O 1190.8 34.3 233.1 417.317 CO2 60.0 31.8 192.2 150.018 CO2 45.0 110.0 184.7 151.019 Exhaust gas 594.0 1.1 1345.3 393.720 Steam 590.0 130.0 70.6 119.121 Steam 480.0 51.0 372.8 539.922 Condensate 26.7 0.035 428.1 56.323 Water 17.2 2.0 455.9 22.824 Offgas 131.5 1.1 1345.0 57.6
200 400 600 800 1,000 1,200 1,400 1,6000
100
200
300
400
500
600
700
HRSG 2 HRSG 1
Gasifier
Syngascooler 1+2
Dryer
Enthalpy rate difference [MW]
Tem
pera
ture
[°C
]
Figure 4.10: Temperature profiles of heat transfer (case CLC-Ni3).
67

Chapter 4 Modeling
IGCC Plant Using a BGL Gasifier
The cases CLC-Ni4 and CLC-Ni5 use the same system components compared to the
cases CLC-Ni1 to CLC-Ni3 introduced above, except the gasification island and AGR
unit differ (see Fig 4.11). Selected flows of case CLC-Ni5 are given in Table 4.10 and
the major assumptions are shown in Table 4.11. The received coal is first crushed in a
bowl mill and is then fed to the gasifier through a lock hopper. Similar to the cases in
which a Shell gasifier is used, recycled CO2 is used for the coal particle transport to
increase the purity of the exiting CO2 stream.
The gasification takes place in an oxygen-blown, moving-bed, slagging BGL gasi-
fier. Due to the restricted equilibrium within a moving-bed gasifier, the temperature
approach was used for the participating major gasification reactions. The tempera-
tures were adapted to obtain the typical raw syngas composition of a BGL gasifier (see
Table 4.11). The resulting mole composition amounts to 52.9 % CO, 31.1 % H2, 7.7 %
H2O, 4.8 % CH4, 2.4 % CO2, 0.3 % H2S and on the balance N2, according to [51]. The
oxygen demand is provided by a cryogenic ASU introduced in Section 4.5.1, and steam
required for the gasification process is produced within HRSG 1. Fly ash is leaving the
reactor through the raw syngas stream and is captured by a cyclone to ensure a high
carbon conversion efficiency. Moreover, the molten ash gets separated by using a slag
trap and water quenching at the bottom of the gasifier.
The conventional AGR unit and the WGS unit are replaced by a HGD unit. The
gasifier exit temperature is significantly smaller compared to the cases in which a Shell
gasifier is used. The fundamentals of the HGD process are introduced in Section 2.2.1.
Within the desulfurization reactor, the temperature increases slightly by about three
Kelvin. Pressurized air used within the regenerator is provided by a compressor and
after the reaction the product gas is separated from the solid particles by a cyclone.
The SO2 contaminated product gas leaves the system through a turbine to recover
some compression work. A Flue Gas Desulfurization (FGD) unit finally captures the
sulfur entering the overall system as part of the coal by using, for example, limestone.
The clean syngas then enters the fuel reactor of the CLC unit. Further descriptions
are similar to the cases using a Shell gasifier. The temperature profiles of the heat
exchanger network are shown in Fig. 4.12 for the case CLC-Ni5, whereas the tempera-
ture of the hot inlet air of the HRSG 1 is 1158 °C. The other cases temperature profiles
are given in the Appendix A. Further remarks on the heat exchanger network design
are presented in Section 4.3.2 and 5.3.1.
68
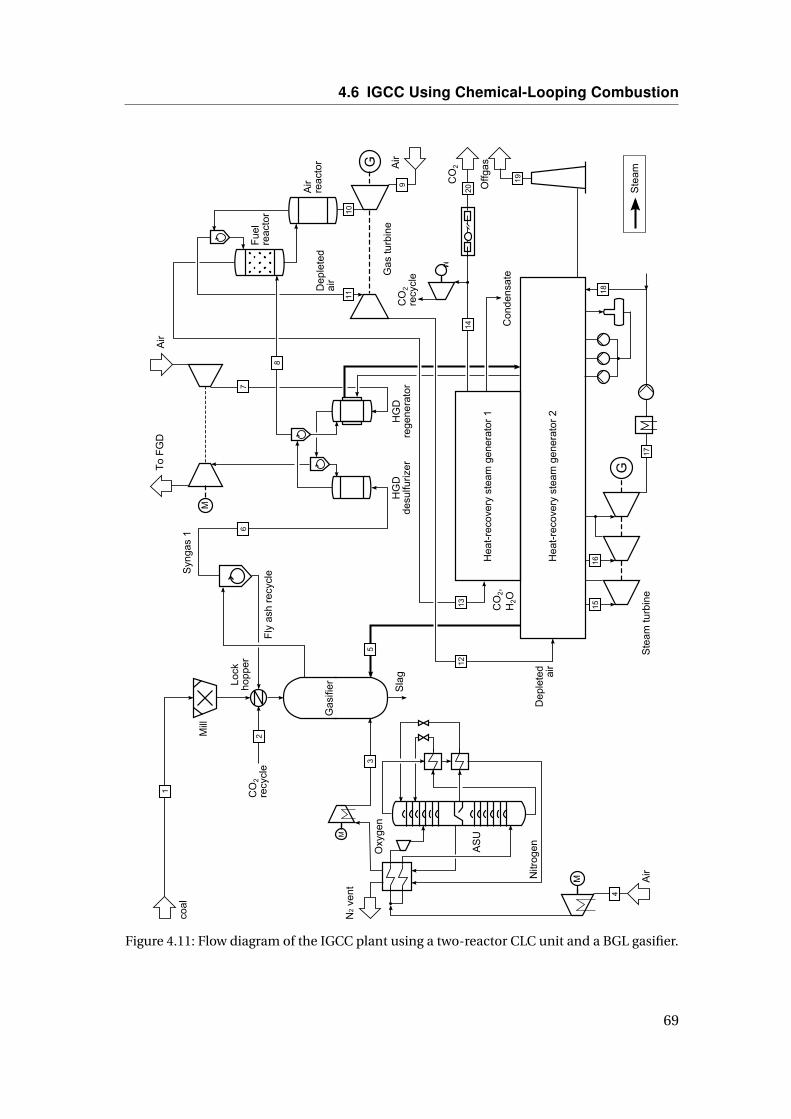
4.6 IGCC Using Chemical-Looping Combustion
Fly
5ash
5rec
ycle
Sla
g
Mill
Gas
ifier
M
coal
5Offg
as
Hea
t3re
cove
ry5s
team
5gen
erat
or52
CO
25re
cycl
e5
Oxy
gen
Lock
hopp
er
Ste
am
T
5
M
HG
Dde
sulfu
rize
r
M
Hea
t3re
cove
ry5s
team
5gen
erat
or5T
Con
den
sate
6
T8
T9
2N
M
Air
HG
Dre
gen
erat
or
AS
U
Ste
am5tu
rbin
e
CO
25re
cycl
e5
CO
2,5
H2O
3
7
8
Syn
gas5
T
CO
2
Air
G
T6T5
2
4
T4
T7
GG
as5tu
rbin
e
Dep
lete
d5
air
Air5
reac
tor
TN
Fue
l5re
acto
r
Air
9
TT
T3
Dep
lete
d5
airT2
N25
vent
Nitr
oge
n
To5
FG
D
Figure 4.11: Flow diagram of the IGCC plant using a two-reactor CLC unit and a BGL gasifier.
69

Chapter 4 Modeling
Table 4.10: Simulation results for the selected flows of case CLC-Ni5.
Flow no. Type Temperature Pressure Mass flow[°C] [bar] [kg/s] ]
1 Coal 15.0 1.0 80.02 CO2 108.5 48.0 7.03 Oxygen 132.1 56.0 37.64 Air 15.0 1.0 158.65 Steam 400.0 40.0 25.46 Raw gas 552.0 31.0 129.57 Air 615.4 44.0 6.68 Syngas 555.1 30.4 129.79 Air 15.0 1.0 2414.6
10 Air 471.9 24.0 2414.611 Depleted air 477.6 19.2 2295.712 Exhaust gas 475.6 1.1 2295.713 CO2, H2O 1158.3 34.3 248.514 CO2 60.0 32.0 195.115 Steam 590.0 137.0 27.016 Steam 590.0 74.0 312.617 Condensate 26.7 0.035 394.418 Water 22.0 2.0 401.219 Offgas 130.5 1.1 2296.020 CO2 45.0 110.0 187.7
200 400 600 800 1,000 1,2000
100
200
300
400
500
600
700
HRSG 2
HRSG 1
Enthalpy rate difference [MW]
Tem
pera
ture
[°C
]
Figure 4.12: Temperature profiles of heat transfer (case CLC-Ni5).
70

4.6 IGCC Using Chemical-Looping Combustion
Table 4.11: Assumptions of cases using a BGL gasifier or a HGD unit.
System/component Unit Value
BGL gasification islandCoal mill - electrical demand kJ/kg 36Steam/coalmaf mass ratio [51] - 0.385Oxygen/coalmaf mass ratio, according to [51] - 0.57O2 gasification agent temperature °C 400O2 gasification agent pressure bar 40CO2 gasification agent pressure bar 48Carbon conversion efficiency gasifier % 99Heat loss gasifier (Hs,coal) % 1Gasifier temperature °C ∼550Gasifier pressure bar 32 bar
HGD unitRegenerator reactor temperature °C 650Air compressor isentropic efficiency % 88Turbine isentropic efficiency % 80Mole ratio ZnS/ZnO in regenerated sorbent [154] - 0.1
Gasifier temperature approachC + H2O → CO + H2 K 461CO + H2O → CO2 + H2 K 1413C + CO2 → 2 CO K 564C + 2 H2 → CH4 K 346CO + 3 H2 → CH4 + H2O K 408
4.6.3 IGCC Using a Three-Reactor CLC Unit
In this section, the modeling of five cases featuring a three-reactor CLC unit is dis-
cussed. Their specifications are presented above in Table 4.1. The assumptions for the
cases using a Shell gasifier (CLC-Fe1 and CLC-Fe2) are presented in Section 4.5.1, Table
4.6. All other cases use a BGL gasifier and a HGD unit as described in Section 4.6.2.
Basic assumptions are given in Section 4.2. All cases analyzed in this section consider
the comprehensive gas turbine model presented in Section 4.4.2. The application of a
CO2 turbine is analyzed in case CLC-Fe5, where the air reactor temperature is 900 °C.
Within the three-reactor CLC system, the fuel reactor is represented by a five-stage,
moving-bed, counter-current reactor. As the solid phase exits at the bottom and the
gaseous phase at the top, the exit temperature of the product gas is higher, whereas the
temperature difference ranges from 13 to 175 °C. The concentrations of H2 and CO are
too small to reduce the Fe2O3 particles to the state of Fe, while assuring complete fuel
conversion. Thus, less H2 can be produced in the subsequent steam reactor. Moreover,
71
Chapter 4 Modeling
due to the absence of Fe the undesirable carbon decomposition cannot take place. It
has been suggested that Fe acts as a catalyst for the reverse Boudouard reaction [79].
Within the steam reactor, the reduced particles exiting the fuel reactor, which
consists of almost pure FeO, are partially re-oxidized to the Fe3O4 state by using
superheated steam at 300 °C and 40 bar. A cyclone separates the gas from the solid
phase and the product gas is subsequently cooled to 600 °C. The Fe3O4 particles
are then fully oxidized to the Fe2O3 state within the air reactor in order to close the
redox cycle. Pressurized air is provided by an intercooled compressor. On the one
hand, this compressor increases the internal power consumption. On the other hand,
depleted air exiting the air reactor is used to dilute the combustion process within
the gas turbine, which reduces compression work used by the gas turbine system air
compressor.
IGCC Plant Using a Shell Gasifier
The plant design and assumptions of the cases incorporating a Shell gasifier (CLC-
Fe1 and CLC-Fe2) are based on the process design of the reference case IGCC-1 (see
Section 4.5.1). Figure 4.13 shows a simplified flow diagram, and Table 4.12 presents
the corresponding simulation results of some selected flows of the case IGCC-Fe1.
Compared to the base case, the WGS unit and AGR unit are replaced by a HGD unit.
The fundamentals of the HGD process are introduced in Section 2.2.1 and some
modeling details are presented in Section 5.3.1 in conjunction with the BGL gasifier.
The cleaned syngas enters the CLC unit at about 550 °C and 38 bar having a mole
composition of 67.2 % CO, 29 % H2, 1.7 % CO2, 1.2 % N2 and on the balance H2O.
Similar to the cases using a two-reactor system, the gaseous product of the fuel
reactor is a mixture of H2O and CO2. General remarks concerning the CLC unit are
presented above in Section 4.6.1. Applying an HGCU in combination with a three-
reactor CLC system is reasonable, compared to the plant using a two-reactor system
(cases CLC-Ni1 to CLC-Ni3) because the product gas exiting the fuel reactor is not
heated that much by the hot oxygen carrier. As a result, a higher fuel gas temperature
is tolerated to maintain an acceptable inlet temperature of the subsequent HRSG.
Although Fig. 4.13 shows only one stream entering the gas turbine, only the ultra-
wet H2 exiting the steam reactor is combusted directly. The depleted air is used as
excess air to dilute the stoichiometric combustion gas. Under ultra-wet conditions, H2
still remains ignitable and the NOx emissions get significantly reduced, based on the
high steam content [155]. Any alternative NOx reduction option, like catalytic exhaust
72
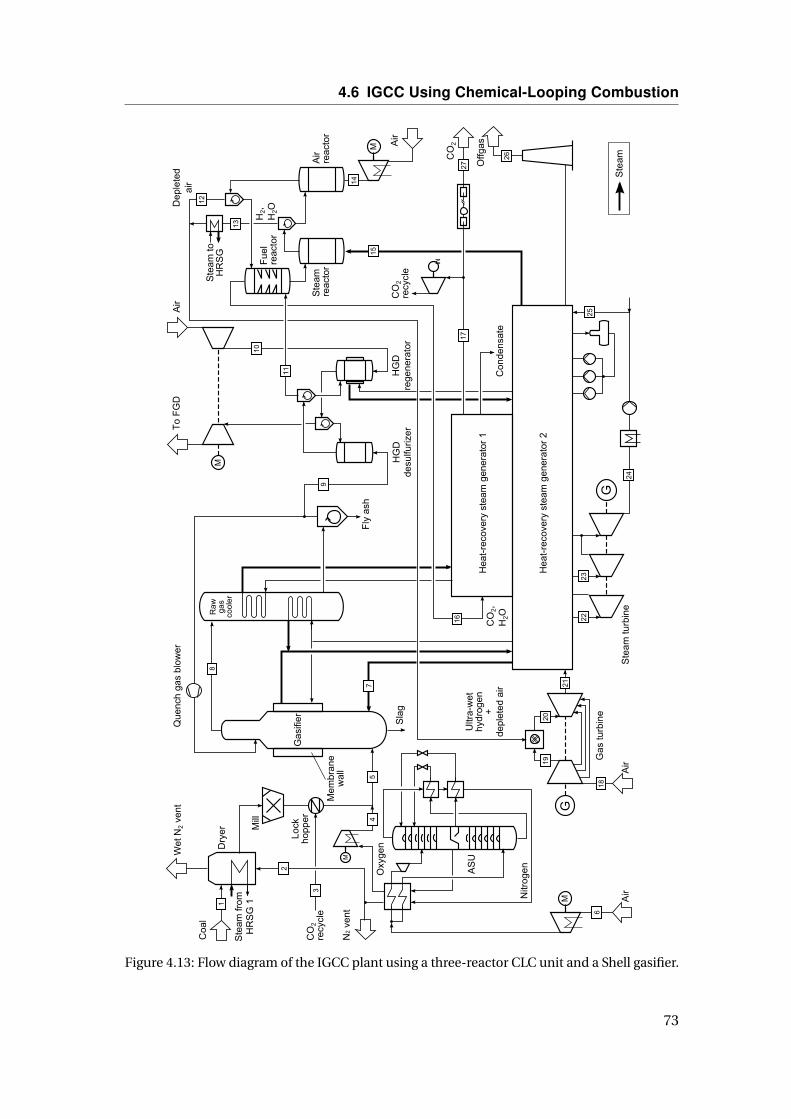
4.6 IGCC Using Chemical-Looping Combustion
G
Fly
2ash
Sla
g
Que
nch2
gas2
blo
wer
Mill
Gas
ifier
Raw
2ga
s2co
oler
Ste
am2fr
om
2H
RS
G20
M
Coa
l
2Offg
as
Gas
2turb
ine
Hea
t6re
cove
ry2s
team
2gen
erat
or23
CO
32re
cycl
e2
Oxy
gen
Lock
hopp
er
Mem
bra
new
all
Dry
er
Ste
am
3
0
U
M
N32
vent
HG
Dde
sulfu
rizer
Fue
l2re
acto
r
Air2
reac
tor
Ste
am2
reac
tor
M
To2
FG
D
M
Hea
t6re
cove
ry2s
team
2gen
erat
or20
Con
den
sate
CO
3Air
+
W
7
8
9
0U
08
0939
30
3U
3+
3W
37
0,
Dep
lete
d2
air
H35
2H
3O
03
M
070W
0+
Air
HG
Dre
gen
erat
or
00
09
AS
U
Ste
am2tu
rbin
e
CO
32re
cycl
e2
CO
352
H3O
Air
Air
Ultr
a6w
ethy
drog
enT
depl
eted
2air
,
G
333,
Ste
am2to
2H
RS
G
Wet
2N32
vent
Nitr
oge
n
Figure 4.13: Flow diagram of the IGCC plant using a three-reactor CLC unit and a Shell gasifier.
73

Chapter 4 Modeling
Table 4.12: Simulation results for selected flows of the case CLC-Fe1.
Flow no. Type Temperature Pressure Mass flow Exergy[°C] [bar] [kg/s] [MW]
1 Coal 15.0 1.0 80.0 2557.52 Nitrogen 12.3 1.1 175.0 5.73 CO2 111.0 56.0 7.0 4.74 Oxygen 120.6 45.0 60.3 24.95 Coal only 50.0 1.0 76.2 2557.56 Air 25.0 1.0 257.6 1.67 Steam 400.0 45.0 6.8 9.08 Raw gas 899.9 40.0 409.3 5554.39 Raw gas 550.1 38.5 133.1 1753.4
10 Air 635.6 48.0 6.6 4.211 Clean gas 567.2 37.9 140.8 1734.112 Depleted air 900.0 22.0 454.5 364.613 H2, H2O 550.0 35.2 195.1 1277.714 Air 154.2 24.0 489.7 144.715 Steam 300.0 40.0 259.1 321.216 CO2, H2O 795.7 36.2 239.9 289.417 CO2, H2O 60.0 34.7 191.3 120.818 Air 15.0 1.0 406.9 2.419 Air 432.8 19.2 90.1 37.820 Combustion gas 1490.0 18.8 739.7 1464.921 Exhaust gas 612.9 1.1 1056.5 491.722 Steam 590.0 170.0 104.7 172.423 Steam 590.0 45.0 149.5 231.824 Condensate 26.7 0.035 161.9 13.725 Water 22.0 2.0 427.8 0.226 Offgas 97.4 1.1 1056.5 122.327 CO2 45.0 110.0 190.9 125.9
treatment or separate steam production, would further reduce the overall efficiency.
The exhaust gas of the gas turbine system only consists of humid, partially depleted air
which is further used within the HRSG 2 for the production of steam. The temperature
profiles of the heat exchanger network are presented in Fig. 4.14 and the Appendix
A. The hidden temperatures can be received from Table 4.12. Further remarks on the
heat exchanger network design are presented in Section 4.3.2 and 5.3.2.
IGCC Plant Using a BGL Gasifier
The cases CLC-Fe3 to CLC-Fe5 use the same system components compared to the
cases CLC-Fe1 and CLC-Fe2 introduced above, except the gasification island and
74

4.6 IGCC Using Chemical-Looping Combustion
200 400 600 800 1,000 1,200 1,4000
100
200
300
400
500
600
700
HRSG 2 HRSG 1
Gasifier
HGD
Syngas cooler
H2 cooler
Dryer
Enthalpy rate difference [MW]
Tem
pera
ture
[°C
]
Figure 4.14: Temperature profiles of heat transfer (case CLC-Fe1).
syngas cooling section differ (see Fig. 4.15). Due to the relatively low gasification
temperature, further cooling of the syngas is not required. The coal dryer is also
obsolete because the BGL gasifier supports a wet feed. Selected flows of case CLC-Fe3
are given in Table 4.13.
The raw coal gets first crushed in a bowl mill and is then fed to the gasifier through
a lock hopper. Moreover, the cryogenic ASU provides 98 % pure oxygen to the gasifier
and steam is provided by the HRSG 2. After the syngas is cleaned by the HGD unit
(see Section 2.2.1) the prepared syngas enters the CLC unit at the same conditions
of the cases CLC-Ni1 to CLC-Ni3 (see Section 5.3.1). The principle of the CLC unit is
described above in Section 4.6.1 and further remarks on the heat exchanger network
design are presented in Section 4.3.2 and 5.3.2. The resulting temperature profiles of
the heat exchanger network are shown in Fig. 4.16 and the Appendix A.
Case CLC-Fe5 exclusively considers a CO2 turbine. Compared to case CLC-Fe3,
the component configuration as well as the characteristic parameters are identical
in order to evaluate the application of a CO2 turbine. On the one hand, additional
electric power is generated by the turbine and the pressure of the hot gas within HRSG
1 is reduced to an elevated pressure, which reduces the capital costs, too. On the other
hand, the expanded gas has to be re-pressurized to meet the CO2 transport conditions,
and furthermore the hot gas temperature of HRSG 1 decreases significantly. Moreover,
the capital costs of a CO2 turbine are supposed to be higher than a charged HRSG.
75

Chapter 4 Modeling
G
Fly
pash
prec
ycle
Sla
g
Mill
Gas
ifier
M
Coa
l
pOffg
as
Gas
pturb
ine
Hea
t0re
cove
ryps
team
pgen
erat
orpR
CO
Rpre
cycl
ep
Oxy
gen
Lock
hopp
er
Ste
am
)
N
M
HG
Dde
sulfu
rize
r
M
M
Hea
t0re
cove
ryps
team
pgen
erat
orp)
Con
den
sate
Air
T
)T
Rw
R+
RN)+
M
)9
)8)7
Air
HG
Dre
gen
erat
or
)w
)(
AS
U
Ste
amptu
rbin
e
CO
Rpre
cycl
ep
CO
R7p
HRO
wG
CO
Rptu
rbin
e3o
ptio
nal
4
7
8
)R
Syn
gasp
)
Fue
lpre
acto
r
Airp
reac
tor
Ste
amp
reac
tor
Dep
lete
dp
air
HR7
pH
RO
Ste
ampto
pH
RS
Gp)
))
9
CO
R
Air
Air
G
R)R(
R
+
)N
RR
Ultr
a0w
ethy
drog
en8
depl
eted
pair
NRp
vent
Nitr
oge
n
Top
FG
D
Figure 4.15: Flow diagram of the IGCC plant using a three-reactor CLC unit and a BGL gasifier.
76
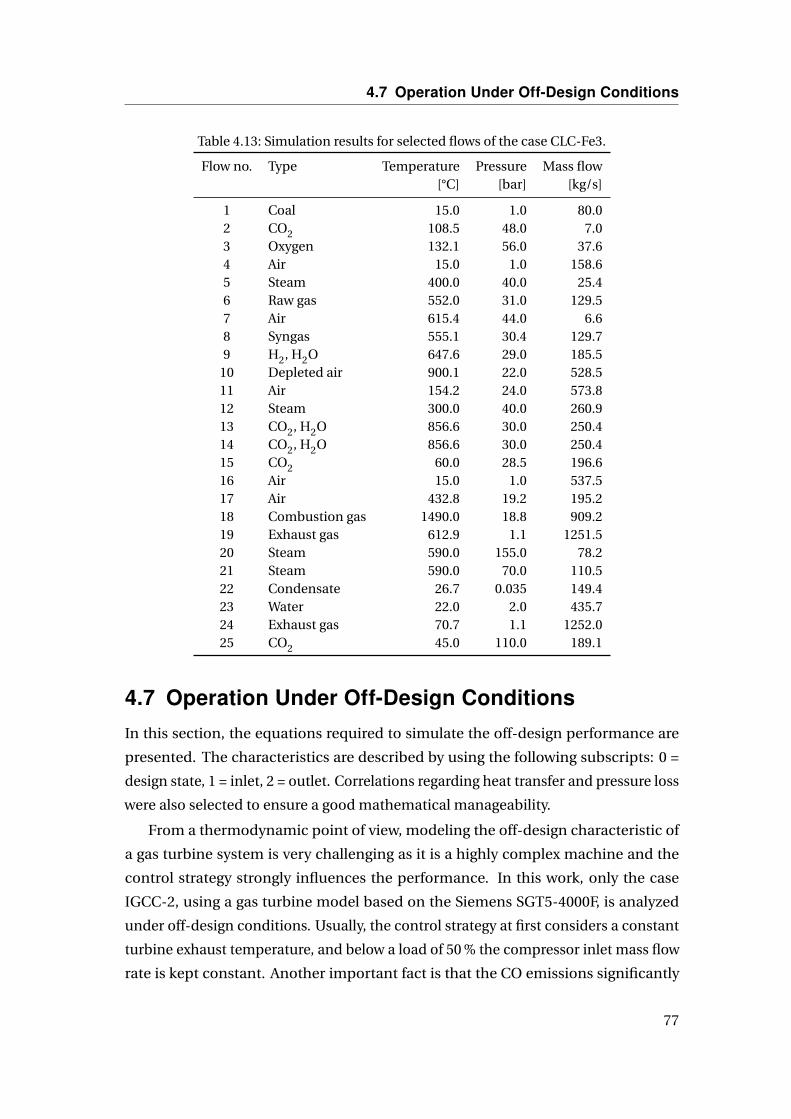
4.7 Operation Under Off-Design Conditions
Table 4.13: Simulation results for selected flows of the case CLC-Fe3.
Flow no. Type Temperature Pressure Mass flow[°C] [bar] [kg/s]
1 Coal 15.0 1.0 80.02 CO2 108.5 48.0 7.03 Oxygen 132.1 56.0 37.64 Air 15.0 1.0 158.65 Steam 400.0 40.0 25.46 Raw gas 552.0 31.0 129.57 Air 615.4 44.0 6.68 Syngas 555.1 30.4 129.79 H2, H2O 647.6 29.0 185.5
10 Depleted air 900.1 22.0 528.511 Air 154.2 24.0 573.812 Steam 300.0 40.0 260.913 CO2, H2O 856.6 30.0 250.414 CO2, H2O 856.6 30.0 250.415 CO2 60.0 28.5 196.616 Air 15.0 1.0 537.517 Air 432.8 19.2 195.218 Combustion gas 1490.0 18.8 909.219 Exhaust gas 612.9 1.1 1251.520 Steam 590.0 155.0 78.221 Steam 590.0 70.0 110.522 Condensate 26.7 0.035 149.423 Water 22.0 2.0 435.724 Exhaust gas 70.7 1.1 1252.025 CO2 45.0 110.0 189.1
4.7 Operation Under Off-Design Conditions
In this section, the equations required to simulate the off-design performance are
presented. The characteristics are described by using the following subscripts: 0 =
design state, 1 = inlet, 2 = outlet. Correlations regarding heat transfer and pressure loss
were also selected to ensure a good mathematical manageability.
From a thermodynamic point of view, modeling the off-design characteristic of
a gas turbine system is very challenging as it is a highly complex machine and the
control strategy strongly influences the performance. In this work, only the case
IGCC-2, using a gas turbine model based on the Siemens SGT5-4000F, is analyzed
under off-design conditions. Usually, the control strategy at first considers a constant
turbine exhaust temperature, and below a load of 50 % the compressor inlet mass flow
rate is kept constant. Another important fact is that the CO emissions significantly
77

Chapter 4 Modeling
200 400 600 800 1,000 1,200 1,4000
100
200
300
400
500
600
700
HRSG 2 HRSG 1
HGD
H2 cooler
Enthalpy rate difference [MW]
Tem
pera
ture
[°C
]
Figure 4.16: Temperature profiles of heat transfer (case CLC-Fe3).
increase below a load of 50 % [156]. A smaller relative load should not be considered.
The dependency of the relative efficiency to the relative power is rarely published in
literature. In this work, the characteristic of a smaller F-class gas turbine by Siemens,
published by Jansen et al. [157], was selected. The characteristic is presented in
Fig. 4.17. In the case IGCC-H2, the relative off-design efficiency of the N2 and H2
compressor was taken to be 90 %.
In the case when a steam turbine operates under off-design conditions, it acts
as an additional throttling unit. This behavior is described by the Stodola law [158],
depending on the mass flow rate m, the inlet and outlet pressure p, as well as the inlet
temperature T1.
(m
m0
)2=(
p21 −p2
2
p21,0 −p2
2,0
)·(
T1,0
T1
)(4.5)
For the off-design correction of the steam turbines efficiency, several approaches
are suitable. In practice, mostly a characteristic polynominal line is used which
satisfies a particular fixed design. In general, a physical correlation is preferred. Ray
[159] presents an equation which uses the difference in enthalpy at isentropic state
change to determine the correction factor for the polytropic efficiency under off-
design conditions ηpol,0.
ηpol = ηpol,0 −2 ·((
h1 −h2,s
h1,0 −h2,s,0
)0.5
−1
)2(4.6)
78

4.7 Operation Under Off-Design Conditions
0 10 20 30 40 50 60 70 80 90 1000
10
20
30
40
50
60
70
80
90
100
Relative electrical power [%]
Rel
ativ
eef
ficie
ncy
[%]
Figure 4.17: Off-design characteristic of the gas turbine used in the case IGCC-2 (acc. to [157]).
Another approach is needed for the correction of heat transfer under off-design con-
ditions. The heat transfer area mostly remains constant and solely the heat transfer
coefficient U has to be corrected. In literature, several approaches are presented. The
correction is generally based on the Nusselt number as well as Reynolds number, de-
pending on a certain type of heat exchanger . In this work, the heat transfer coefficient
is corrected by the mass flow rate m and the exponent µ [160]. This exponent is deter-
mined by the configuration of the tubes within the HSRG. In this work, a staggered
configuration is used in connection with the traverse pitch ST (distance 90° off from
the flow direction between the centers of two adjacent tubes), the longitudinal pitch
SL (the distance in flow direction between the centers of two adjacent tubes) and the
tube diameter D .
U
U0=(
mgas
mgas,0
)µ(4.7)
ST
D= SL
D= 2.5 ⇒µ' 0.57 (4.8)
Within the heat exchanger, the pressure loss of the waterside changes. Several ap-
proaches use the Reynolds number to determine the pressure loss. The following
correlation solely uses the mass flow rate m which is valid for a turbulent flow of a
liquid within a plain tube with 5000 < Re < 105 [161]. Other regimes have not been
used in this work.
(p2 −p1
p2,0 −p1,0
)=(
m1
m1,0
) 78
(4.9)
79

Chapter 4 Modeling
As discussed in Section 4.3.1, the use of the Fourrier law or NTU-method to describe
the heat transfer arises mathematical convergence problems. This becomes particu-
larly important under off-design conditions.
80
Chapter 5
Results and Discussion
This chapter presents the results obtained from the thermodynamic and economic
analysis introduced in Chapter 3. First, the reference IGCC (case IGCC-1) is analyzed
in order to deeply understand the thermodynamic characteristics of the commercially
operating IGCC technology. The inefficiencies associated with the gas turbine system
using syngas are further analyzed since the gas turbine significantly affects the overall
performance. Moreover, a comparison of the results obtained from the simulation of
the IGCC plants using a CLC unit is conducted. Finally, the off-design performance
and the product costs of the base case IGCC-2 are discussed for adressing a flexible
operation mode.
5.1 Inefficiencies of the Reference IGCC
In this section, the energetic characteristics of the base cases are presented and the
high-efficiency base case IGCC-1 is further analyzed from a thermodynamic point of
view. Base case IGCC-1 is introduced in Section 4.5.1 and case IGCC-2 in Section 4.5.2
accordingly. The fundamentals of the energy and exergy analysis are given in Section
3.1.
The identification of thermodynamic improvement potentials is conducted based
on a conventional and advanced exergy analyses. At first, the most important aggre-
gated subsystems are identified rated by their exergy destruction. In the next step, a
detailed conventional exergy analysis is undertaken in order to identify the top ten sys-
tem components. Moreover, these components are analyzed employing the advanced
exergy analysis approach for the identification of the subsystem’s interdependencies
and potential for improvement.
81

Chapter 5 Results and Discussion
Table 5.1: Power distribution of the reference cases based on Hi,ar in [%].
Subsystem IGCC-1 IGCC-2
Gasification island -1.0 -1.0ASU -2.6 -2.6AGR unit -1.7 -1.8CO2 compression -2.9 -3.0N2 compression for GT - -3.7Auxiliaries -0.2 -0.4Gas turbine (GT) 28.6 30.0Steam cycle 17.7 14.5Net power production 37.9 32.1
5.1.1 Energy Analysis
The results obtained from the simulation of both base cases are presented in the
following. The resulting power distribution is given in Table 5.1. To ensure a compre-
hensible view, the values are presented in relation to the thermal input determined by
the product of the as-received coal mass flow rate and the as-received lower heating
value Hi,ar. Obviously, the high-efficiency base case exhibits a larger overall efficiency
that is about 5.8 %-points higher. From an energetic point of view, the gross power
production within the gas turbine system (including the N2 compression) as well as
the steam turbine is worse in case IGCC-2.
Regarding the gasifier efficiency, the cold gas efficiency of the Shell gasifier is
3.4 %-points higher, having an absolute value of 82.4 % based on the lower heating
value which is a reasonable value [149, 162]. The resulting live steam parameters are
already given in Table 4.5 and 4.8 in Section 4.5. In case IGCC-1, the corresponding
parameters are 590 °C and 164 bar as well as 562 °C and 42 bar, compared to 567 °C
and 160 bar as well as 551 °C and 47 bar in case IGCC-2. Especially the high-pressure
live steam temperature is determined by the flue gas temperature at the gas turbine
system outlet which is about 25 °C smaller in case IGCC-2. However, the condensation
pressure and the condenser inlet vapor fraction are similar.
In the case IGCC-1, the temperature of the offgas exiting through the stack is
calculated to be about 132 °C. Further heat recovery is not possible because a lot of
low-temperature heat is already transferred to the steam cycle by the LT-WGS unit
cooler. In the case IGCC-2, the offgas temperature is slightly higher.
82

5.1 Inefficiencies of the Reference IGCC
Table 5.2: Results obtained from the conventional exergy analysis for the aggregated subsys-tems (case IGCC-1.)
ED yD EL
Subsystem [MW] [%] [MW]
Gasification island 857.1 34.35 26.8Gas turbine system 446.4 17.70 9.0Steam cycle 88.1 8.35 126.9AGR unit 75.9 2.95 0.0ASU 34.9 1.38 0.5CO2 compressor 19.2 0.75 163.6
Total 1521.7 65.47 326.8
5.1.2 Conventional Exergy Analysis IGCC-1
The distribution of exergy destructions among the major subsystems of case IGCC-1
is presented in Table 5.2. The gasification island includes the gasifier, compressors for
the gasification agents, coal dryer, quenching and cooling units, particulate removal,
WGS reactors, as well as the saturator. However, the steam cycle includes only heat
transfer within the HRSG and condenser, several pumps, as well as the steam turbine.
Based on high shares in exergy destruction, a dominant role of the gasification
island and the gas turbine system is clearly indicated. Usually, chemical reactions, like
the gasification and combustion process, are highly irreversible, and furthermore the
gasification island also includes a lot of additional components for preparation. The
steam cycle and the AGR unit also show a significant share in exergy destruction.
In order to obtain more detailed information about the components causing
thermodynamic inefficiencies, the subsystems are further disaggregated. However,
the ASU and the CO2 compressor are not further discussed. The largest exergy loss is
represented by the conditioned CO2 stream exiting the overall system due to its high
absolute chemical exergy. Another large exergy loss is represented by the offgas exiting
the HRSG.
Based on a more detailed exergy analysis, the ten components with the highest
exergy destruction among all system components are presented in Fig. 5.1. The
corresponding absolute values are given in Table 2.1 in the Appendix B. The HRSG is
split into its separate heat exchangers. Similar to the initial evaluation, the gasifier and
the GT combustion chamber have the highest shares in exergy destruction. Another
significant share in exergy destruction is caused by heat transfer within the WGS unit
which includes the injection of steam, too. Within the GT turbine, irreversibilities are
83

Chapter 5 Results and Discussion
0 1 2 3 4 5 10 15 20 25
GasifierGT combustion
chamberWGS unit
GT turbine
Syngas cooler
H2S capture
CO2 capture
GT compressor
Gas quench
Condenser
Exergy destruction ratio yD [%]
25.06
13.22
3.34
3.02
2.34
1.39
1.37
1.06
0.94
0.80
. . .
Figure 5.1: Detailed results of the conventional exergy analysis (case IGCC-1).
caused by the mixing of the cooling and sealing air into the main gas stream, blade and
vane cooling, as well as surface friction caused by the main gas stream. The syngas
cooler has a significant share in exergy destruction due to a large rate of heat transfer
and big temperature differences. The H2S and CO2 capture cycles are subsystems of
the AGR unit and exhibit almost the same share in exergy destruction.
The H2S capture cycle has a significant demand for electrical power and cooling
capacity due to the low absorption temperature. The recycle compressor of the H2S
concentrator requires more specific work compared to one of the recycle solvent
pumps. However, the CO2 capture cycle does not require a compressor but some
electric power is needed by the solvent pump. Furthermore, the CO2 desorption from
the rich solvent through a flash process causes a large amount of exergy destruction.
The GT compressor is associated with high exergy destruction due to the large amount
of air required to dilute the syngas within the GT combustion chamber. The gas
quench is calculated to position nine since the temperature difference is in fact about
1260 K, while the gas composition does not change.
Splitting the steam cycle into its components reveals that approximately half of
its exergy destruction is caused by the heat transfer within the HRSG. The steam
turbine, which generates 38 % of the gross electric power, causes approximately a
quarter of this exergy destruction, although the polytropic efficiencies are relatively
high representing the current technology status. Another quarter is represented by the
84
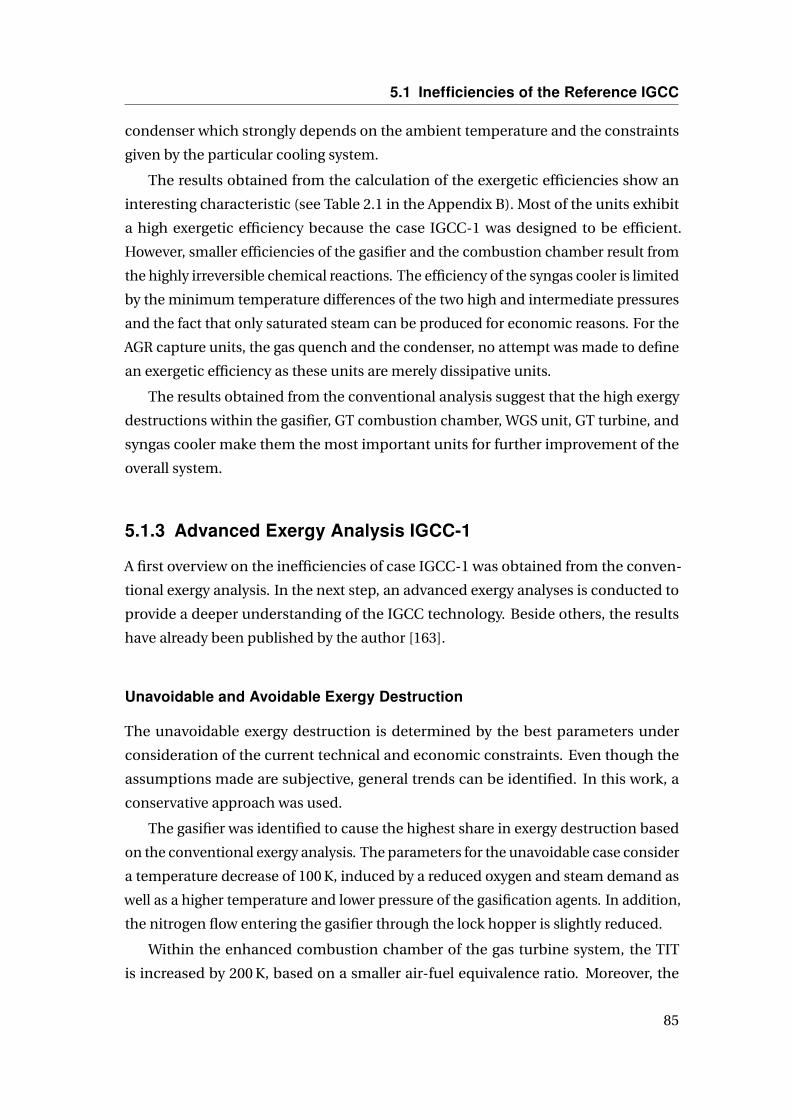
5.1 Inefficiencies of the Reference IGCC
condenser which strongly depends on the ambient temperature and the constraints
given by the particular cooling system.
The results obtained from the calculation of the exergetic efficiencies show an
interesting characteristic (see Table 2.1 in the Appendix B). Most of the units exhibit
a high exergetic efficiency because the case IGCC-1 was designed to be efficient.
However, smaller efficiencies of the gasifier and the combustion chamber result from
the highly irreversible chemical reactions. The efficiency of the syngas cooler is limited
by the minimum temperature differences of the two high and intermediate pressures
and the fact that only saturated steam can be produced for economic reasons. For the
AGR capture units, the gas quench and the condenser, no attempt was made to define
an exergetic efficiency as these units are merely dissipative units.
The results obtained from the conventional analysis suggest that the high exergy
destructions within the gasifier, GT combustion chamber, WGS unit, GT turbine, and
syngas cooler make them the most important units for further improvement of the
overall system.
5.1.3 Advanced Exergy Analysis IGCC-1
A first overview on the inefficiencies of case IGCC-1 was obtained from the conven-
tional exergy analysis. In the next step, an advanced exergy analyses is conducted to
provide a deeper understanding of the IGCC technology. Beside others, the results
have already been published by the author [163].
Unavoidable and Avoidable Exergy Destruction
The unavoidable exergy destruction is determined by the best parameters under
consideration of the current technical and economic constraints. Even though the
assumptions made are subjective, general trends can be identified. In this work, a
conservative approach was used.
The gasifier was identified to cause the highest share in exergy destruction based
on the conventional exergy analysis. The parameters for the unavoidable case consider
a temperature decrease of 100 K, induced by a reduced oxygen and steam demand as
well as a higher temperature and lower pressure of the gasification agents. In addition,
the nitrogen flow entering the gasifier through the lock hopper is slightly reduced.
Within the enhanced combustion chamber of the gas turbine system, the TIT
is increased by 200 K, based on a smaller air-fuel equivalence ratio. Moreover, the
85

Chapter 5 Results and Discussion
0 1 2 3 4 5 10 15 20 25
GasifierGT combustion
chamberWGS unit
GT turbine
Syngas cooler
H2S capture
CO2 capture
GT compressor
Gas quench
Condenser
Exergy destruction ratio yD [%]
Unavoidable Avoidable
22.14 2.92
11.50 1.72
3.15 0.18
2.46 0.56
1.54 0.80
1.37 0.02
1.29 0.08
0.81 0.24
0.94 0.00
0.80 0.00
. . .
Figure 5.2: Unavoidable and avoidable exergy destruction (case IGCC-1).
radiation heat loss is neglected and the pressure drop is slightly reduced. The WGS
unit and the syngas cooler are assumed to produce superheated steam instead of
saturated steam. The units produce as much HP steam as possible and the pressure
drop is reduced. Furthermore, the minimum temperature difference between the
raw gas and water is further reduced and the evaporation pressure of water increases
accordingly.
The enhanced gas turbine considers slightly higher isentropic stage efficiencies.
In this context, the demand for cooling air is reduced by considerung a constant main
gas stream temperature subsequent to the mixing units. It is further assumed that
the exhaust temperature remains constant. In case of the enhanced capture cycles,
the isentropic efficiencies for compression and expansion increase. Additionally, the
pressure drop within the columns is reduced and a smaller temperature difference
for cooling is assumed. The air compressor of the enhanced gas turbine system is
assumed to operate at higher isentropic stage efficiencies. Finally, for the gas quench
and the condenser no changes were taken into account, as these units are subject to
technological or external constraints, respectively.
The modifications effect is illustrated in Fig. 5.2 and the corresponding values
are given in Table 2.1 in the Appendix B. In general, the amount of avoidable exergy
destruction is small and it is apparent that only some components show a considerable
avoidable exergy destruction. This applies to the gasifier, gas turbine system, and
86

5.1 Inefficiencies of the Reference IGCC
0 1 2 3 4 5 10 15 20 25
GasifierGT combustion
chamberWGS unit
GT turbine
Syngas cooler
H2S capture
CO2 capture
GT compressor
Gas quench
Condenser
Exergy destruction ratio yD [%]
Endogenous Exogenous
12.09 12.97
5.43 7.80
1.21 2.13
1.09 1.93
0.84 1.50
0.55 / 0.83
0.51 / 0.86
0.37 / 0.68
0.33 / 0.61
0.28 / 0.52
. . .
Figure 5.3: Endogenous and exogenous exergy destruction (case IGCC-1).
syngas cooler. However, for the WGS unit, both capture cycles, as well as the gas
quench and condenser only a marginal or no potential is identified, respectively.
The largest potentials are available for the GT combustion chamber and the gasifier.
Here small improvements in terms of thermodynamic efficiency are sufficient as the
absolute exergy destruction is already large. The production of superheated HP steam
within the syngas cooler is advantageous over a production within the WGS unit,
due to the larger absolute cooling demand of the syngas cooler. The potential of
the GT turbine, which is the most complex component for simulation, is calculated
to position four. The absolute potential of the GT compressor is almost exhausted.
In summary, it is apparent that only some components have a potential for further
improvement in the future.
Endogenous and Exogenous Exergy Destruction
The exergy destructions related to the component interactions are plotted in Fig.
5.3 and values are presented in Table 2.1 in the Appendix B. The definitions of the
exergetic efficiencies required by the calculation of the endogenous exergy destruction
is given in the Appendix B, Eq. 2.1 to 2.12. Generally, the exogenous part of the exergy
destruction of all incorporated components is significantly large. This characteristic
results from the highly integrated IGCC system design. Moreover, for this set of
87
Chapter 5 Results and Discussion
Table 5.3: Results of the advanced exergy analysis for gasifier and the GT combustion chamberconcerning the interactions on subsystem level in [MW] (case IGCC-1).
Component k
Subsystem r Gasifier GT comb. chamber
EN 311.2 139.7EX 333.7 200.6total 644.9 340.3
EX
ASU 7.0 2.7Gasification island 55.5 119.6
- only gasifier – 70.0AGR 17.3 6.5Gas turbine system 122.0 9.0
- only comb. chamber 82.9 –Steam turbine 4.0 1.5HRSG 12.9 4.9CO2 compressor 3.8 1.5
mexo 111.2 54.9
components, the exogenous exergy destructions is always positive, meaning that
the improvement of other components decreases the exergy destruction within the
component in regard.
The gasifier and the GT combustion chamber exhibit the highest endogenous
exergy destruction, due to the highly irreversible chemical reactions that are taking
place, and having a endogenous share of 48.3 and 41.1 % on the exergy destruction of
the component, respectively. Other components have shares below 40 % which shows
a relatively strong dependence on other components.
The H2S and CO2 capture cycles have the third and fourth largest endogenous
amount. One reason for this is that the separation of pollutants with existing tech-
nologies exhibits inherent limitations due to a high energy demand. However, the
endogenous amount of the following components is almost the same.
As shown above, the gasifier and GT combustion chamber cause the highest
exergy destruction among all system components. Hence, further investigations
on the influence of both units on other components are highly interesting. The
resulting binary interactions are collected in Table 5.3. Whereby in case the k-th
component is part of the subsystem r itself, this component is naturally excluded
from the subsystem. In case of the steam cycle, only major subunits, being the HRSG
and the steam turbine, were considered.
88

5.1 Inefficiencies of the Reference IGCC
From Table 5.3 it is apparent that the gasifier and the GT combustion chamber are
highly interconnected. Particularly the gasifier strongly influences the combustion
chamber (35 % of E EXD ) because the GT fuel gas is produced by gasification. Overall, the
impact on the component in regard correlates to the ranking of exergy destructions
derived from the conventional exergy analysis. In case of the gasifier, a large share of
exergy destruction is caused by the other units of the gasification island. On the con-
trary, the interactions of the GT combustion chamber with the remaining components
of the GT system are small.
The high mexogenous part of the gasifier and the GT combustion chamber reveals
the generally high interdependencies within the IGCC technology. The mexogenous
part of the gasifier and GT combustion chamber is calculated to about one third of the
exogenous exergy destruction. Thus, interdependencies between other subsystems or
units cause about one third additional exergy destruction to the exogenous amount in
both components. In case of the GT combustion chamber, the values are marginally
smaller. A descriptive explanation in the case of the gasifier is the larger syngas stream
required to compensate the irreversibilities within other subsystems.
The values deriving from this splitting are further useful to compare this IGCC
design with other processes that employ the same fuel and product.
Combined Splittings of Exergy Destruction
Based on the combined splittings, the most promising components are identified to
determine the priorities in a potential improvement strategy. The avoidable endoge-
nous and exogenous exergy destructions are illustrated in Fig. 5.4 and Table 2.1 in
the Appendix B present the corresponding values in detail. The previously derived
findings presented above do not change much within this analysis.
Basically, the gasifier and the GT combustion chamber should be improved first,
as both components exhibit the highest potential in independent improvements indi-
cated by the relatively large avoidable endogenous exergy destruction. If modifications
in the operating range of both components can be practically realized, positive effects
on other components likely occur. To a minor extent, the GT turbine and the syngas
cooler should be considered for stand-alone improvement attempts, too. Taking into
account the constraints identified by the previous analyses, improvements are likely
to be realized here. On the contrary, relevant improvements of the WGS unit as well as
in the H2S and CO2 capture cycles can only be realized if technological modifications
are considered.
89

Chapter 5 Results and Discussion
0 1 2 3 4 5 10 15 20 25
GasifierGT combustion
chamberWGS unit
GT turbine
Syngas cooler
H2S capture
CO2 capture
GT compressor
Gas quench
Condenser
Exergy destruction ratio yD [%]
Unavoidable Avoidable endogenous Avoidable exogenous
22.14
11.5
3.15
2.46
1.54
1.37
1.29
0.81
0.94
0.80
1.32 / 1.600.71 / 1.02
0.07 / 0.12
0.20 / 0.36
0.29 / 0.51
0.01 / 0.01
0.03 / 0.05
0.09 / 0.16
0.00 / 0.00
0.00 / 0.00
. . .
Figure 5.4: Unavoidable, avoidable endogenous and avoidable exogenous exergy destruction(case IGCC-1).
Based on the highly integrated IGCC technology, the suggested modifications have
to be examined carefully in order to improve the system’s overall efficiency. In general,
the large amount of exogenous and mexogenous exergy destruction implies a great
potential for improvement if components or subsystems can be replaced by systems
featuring a highly efficient technology.
Finally, the results of the advanced exergy analysis are collected and illustrated in
Fig. 5.5 for the gasifier and GT combustion chamber, which are the two most important
system components. In Fig. 5.5 the area of each splitting of exergy destruction is scaled
to one common standard.
5.2 Inefficiencies of the Gas Turbine System
In this section, the results obtained from the simulation of a gas turbine, using the
model presented in Section 4.4.2, as well as conditions taken from case IGCC-1 are
discussed. Twelve processes are incorporated that are associated with characteristic
inefficiencies in a heavy-duty gas turbine system. The impact of each inefficiency
is rated by a conventional exergy analysis, which is introduced in Section 3.1. The
assessment is based on exergy destruction ratios of the components, respectively. Each
value is given in the Appendix B. The exergy loss of the overall system is represented
90
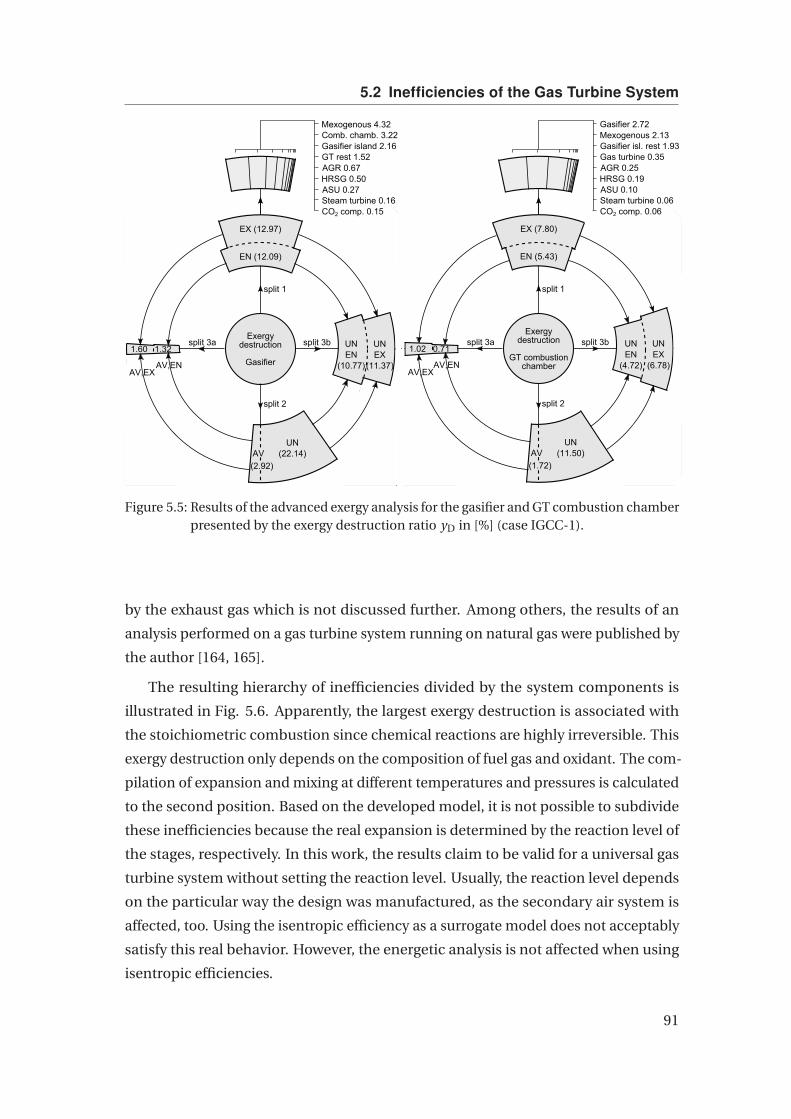
5.2 Inefficiencies of the Gas Turbine System
EX (12.97)
EN (12.09)
UNEN
(10.77)
UNEX
(11.37)
split 1
split 2
split 3a split 3b
UN(22.14)
Exergydestruction
GasifierAV,EX
AV,EN
Gasifier island 2.16
Mexogenous 4.32Comb. chamb. 3.22
GT rest 1.52AGR 0.67HRSG 0.50ASU 0.27Steam turbine 0.16CO2 comp. 0.15
AV
1.60 1.32
(2.92)
EX (7.80)
EN (5.43)
UNEN
(4.72)
UNEX
(6.78)
split 2
split 3a split 3b
UN(11.50)
Exergydestruction
GT combustion chamber
AV,EXAV,EN
Gasifier isl. rest 1.93
Gasifier 2.72Mexogenous 2.13
Gas turbine 0.35AGR 0.25HRSG 0.19ASU 0.10Steam turbine 0.06CO2 comp. 0.06
AV
1.02 0.71
(1.72)
split 1
Figure 5.5: Results of the advanced exergy analysis for the gasifier and GT combustion chamberpresented by the exergy destruction ratio yD in [%] (case IGCC-1).
by the exhaust gas which is not discussed further. Among others, the results of an
analysis performed on a gas turbine system running on natural gas were published by
the author [164, 165].
The resulting hierarchy of inefficiencies divided by the system components is
illustrated in Fig. 5.6. Apparently, the largest exergy destruction is associated with
the stoichiometric combustion since chemical reactions are highly irreversible. This
exergy destruction only depends on the composition of fuel gas and oxidant. The com-
pilation of expansion and mixing at different temperatures and pressures is calculated
to the second position. Based on the developed model, it is not possible to subdivide
these inefficiencies because the real expansion is determined by the reaction level of
the stages, respectively. In this work, the results claim to be valid for a universal gas
turbine system without setting the reaction level. Usually, the reaction level depends
on the particular way the design was manufactured, as the secondary air system is
affected, too. Using the isentropic efficiency as a surrogate model does not acceptably
satisfy this real behavior. However, the energetic analysis is not affected when using
isentropic efficiencies.
91
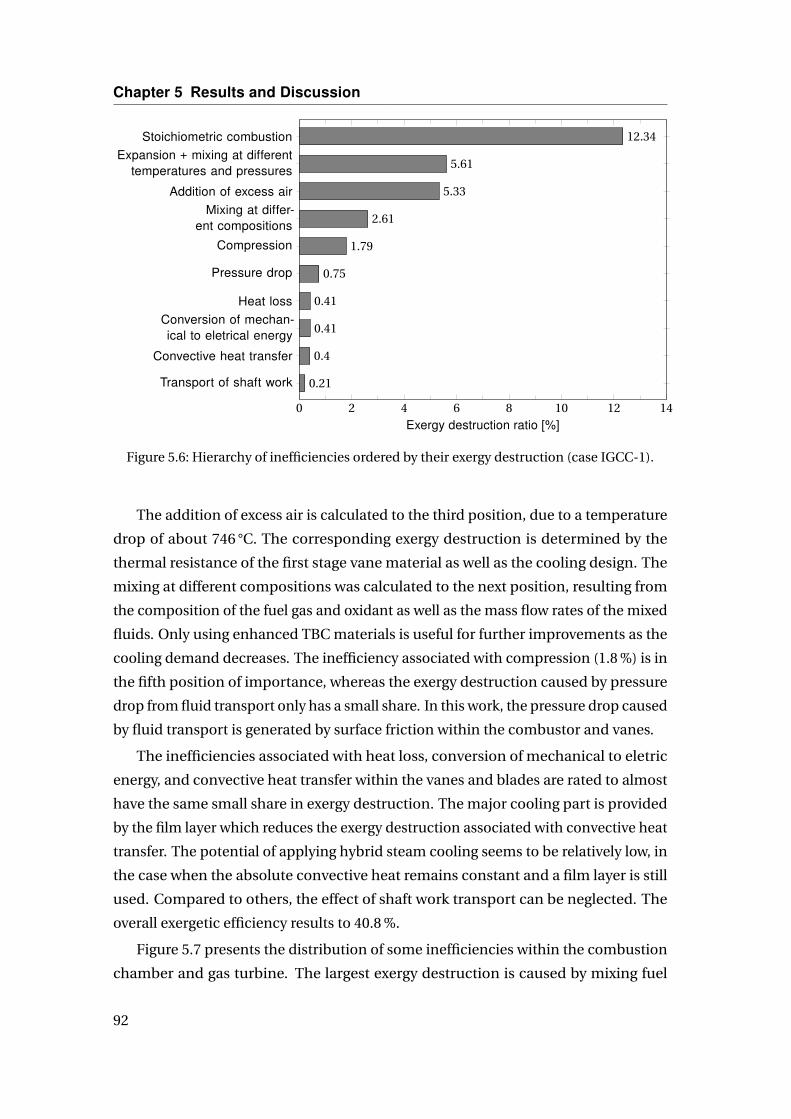
Chapter 5 Results and Discussion
0 2 4 6 8 10 12 14
Transport of shaft work
Convective heat transfer
Conversion of mechan-ical to eletrical energy
Heat loss
Pressure drop
Compression
Mixing at differ-ent compositions
Addition of excess air
Expansion + mixing at differenttemperatures and pressures
Stoichiometric combustion
0.21
0.4
0.41
0.41
0.75
1.79
2.61
5.33
5.61
12.34
Exergy destruction ratio [%]
Figure 5.6: Hierarchy of inefficiencies ordered by their exergy destruction (case IGCC-1).
The addition of excess air is calculated to the third position, due to a temperature
drop of about 746 °C. The corresponding exergy destruction is determined by the
thermal resistance of the first stage vane material as well as the cooling design. The
mixing at different compositions was calculated to the next position, resulting from
the composition of the fuel gas and oxidant as well as the mass flow rates of the mixed
fluids. Only using enhanced TBC materials is useful for further improvements as the
cooling demand decreases. The inefficiency associated with compression (1.8 %) is in
the fifth position of importance, whereas the exergy destruction caused by pressure
drop from fluid transport only has a small share. In this work, the pressure drop caused
by fluid transport is generated by surface friction within the combustor and vanes.
The inefficiencies associated with heat loss, conversion of mechanical to eletric
energy, and convective heat transfer within the vanes and blades are rated to almost
have the same small share in exergy destruction. The major cooling part is provided
by the film layer which reduces the exergy destruction associated with convective heat
transfer. The potential of applying hybrid steam cooling seems to be relatively low, in
the case when the absolute convective heat remains constant and a film layer is still
used. Compared to others, the effect of shaft work transport can be neglected. The
overall exergetic efficiency results to 40.8 %.
Figure 5.7 presents the distribution of some inefficiencies within the combustion
chamber and gas turbine. The largest exergy destruction is caused by mixing fuel
92

5.2 Inefficiencies of the Gas Turbine System
1 2 3 4 5 6 7 8 9 100
2
4
6
8
10
Combustionchamber
Gasturbine
Combustor Coolingsystem
Stage 1 Stage 2 Stage 3 Stage 40
0.5
1
1.5
2
2.5
3
3.5E
xerg
yde
stru
ctio
nra
tio[%
]Expansion+ mixing at different pressures+ mixing at different temperaturesMixing at different compositionsConvective heat transferPressure drop
Figure 5.7: Exergy destruction of some inefficiencies within the combustion chamber and gasturbine (case IGCC-1).
gas and stoichiometric air within the combustor at different temperatures and pres-
sures. Although the fuel gas is heated by hot water within a saturator, the temperature
difference between the mixed flows is about 288 °C. In general, further preheating
improves the exergetic efficiency of the combustion process because the amount of
fuel decreases when a constant combustion outlet temperature is considered. The
autoignition temperature of H2 is well above the fuel gas temperature. As presented
in Fig. 5.6, the combustion gas temperature is significantly reduced when adding
excess air which causes high exergy destruction. Subsequently, the cooling air of the
combustion chamber is mixed into the main combustion gas. In this process, the
major amount of exergy destruction is associated with a mixing at different composi-
tions because the temperature difference accounts to only 124 °C, compared to 746 °C
involved by the addition of excess air.
Within a single gas turbine stage, the exergy destruction has a relatively small
share. Towards lower pressures, the effect of mixing at different compositions de-
creases because the combustion gas composition approaches the composition of air.
This slightly corresponds with the behavior of the group of expansion and mixing at
different pressures and temperatures as the temperature difference of the mixed gases
decreases towards lower pressures. Since the effect of friction increases towards lower
temperatures, the exergy destruction associated with a pressure drop caused by fluid
transfer through the vanes increases within the low-pressure stages.
93
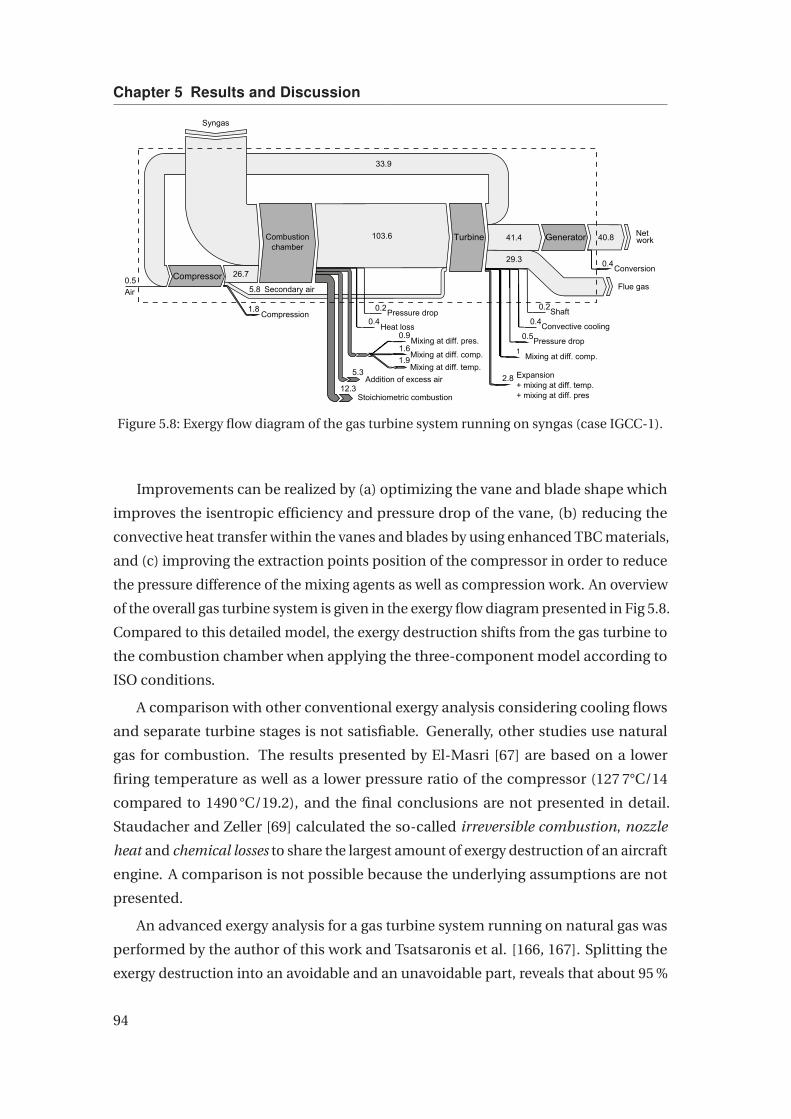
Chapter 5 Results and Discussion
103.6
99.5
41.4 40.8
33.9
29.3
26.7
12.3
Secondary air5.8
5.31.9
2.8
1.8
1.6 1
0.9
0.5
0.5
0.4
0.40.4
0.20.2
Combustion chamber
Syngas
Compressor
Turbine Generator Net
AirFlue gas
Compression
Stoichiometric combustion
Addition of excess air
Pressure drop
Heat loss
Mixing at diff. comp.Mixing at diff. temp.
Mixing at diff. pres.
Expansion+ mixing at diff. temp.+ mixing at diff. pres
.Mixing at diff. comp.
Shaft
Conversion
Convective cooling
Pressure drop
work
Figure 5.8: Exergy flow diagram of the gas turbine system running on syngas (case IGCC-1).
Improvements can be realized by (a) optimizing the vane and blade shape which
improves the isentropic efficiency and pressure drop of the vane, (b) reducing the
convective heat transfer within the vanes and blades by using enhanced TBC materials,
and (c) improving the extraction points position of the compressor in order to reduce
the pressure difference of the mixing agents as well as compression work. An overview
of the overall gas turbine system is given in the exergy flow diagram presented in Fig 5.8.
Compared to this detailed model, the exergy destruction shifts from the gas turbine to
the combustion chamber when applying the three-component model according to
ISO conditions.
A comparison with other conventional exergy analysis considering cooling flows
and separate turbine stages is not satisfiable. Generally, other studies use natural
gas for combustion. The results presented by El-Masri [67] are based on a lower
firing temperature as well as a lower pressure ratio of the compressor (127 7°C/14
compared to 1490 °C/19.2), and the final conclusions are not presented in detail.
Staudacher and Zeller [69] calculated the so-called irreversible combustion, nozzle
heat and chemical losses to share the largest amount of exergy destruction of an aircraft
engine. A comparison is not possible because the underlying assumptions are not
presented.
An advanced exergy analysis for a gas turbine system running on natural gas was
performed by the author of this work and Tsatsaronis et al. [166, 167]. Splitting the
exergy destruction into an avoidable and an unavoidable part, reveals that about 95 %
94
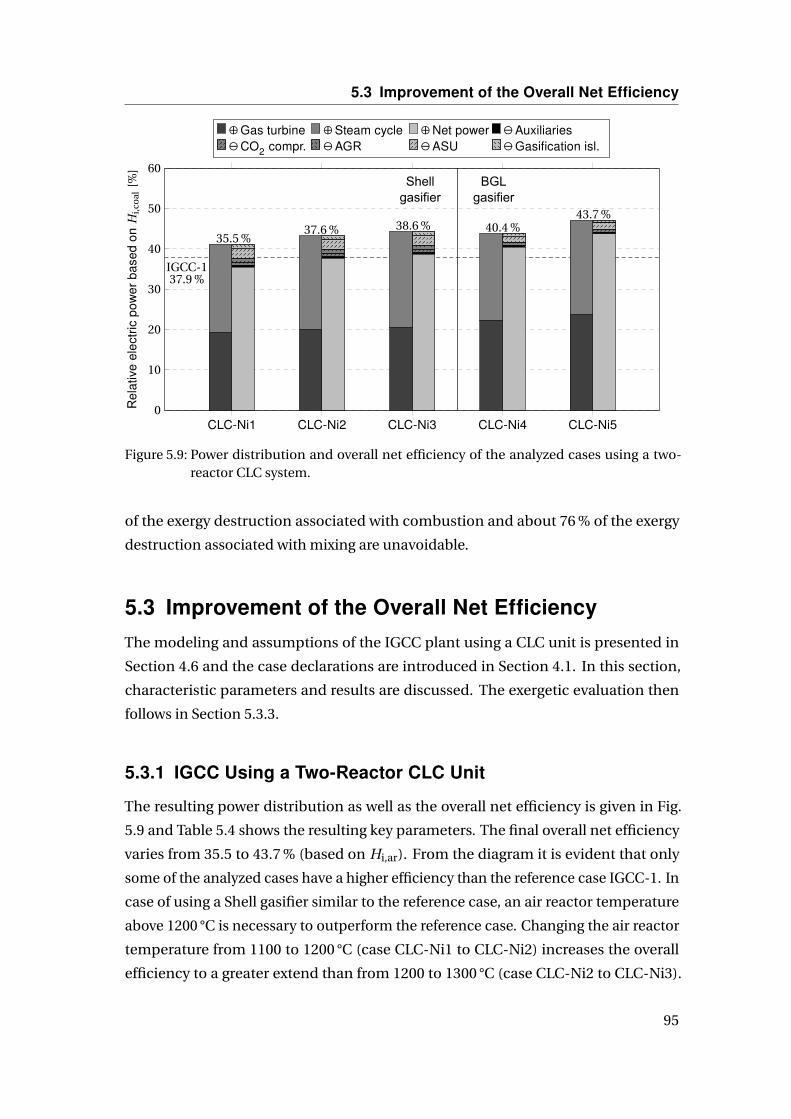
5.3 Improvement of the Overall Net Efficiency
1 100
10
20
30
40
50
60Shell
gasifierBGL
gasifier
IGCC-137.9 %
35.5 %37.6 % 38.6 % 40.4 %
43.7 %
CLC-Ni1 CLC-Ni2 CLC-Ni3 CLC-Ni4 CLC-Ni50
10
20
30
40
50
60
Rel
ativ
eel
ectr
icpo
wer
base
don
Hi,c
oal
[%]
⊕Gas turbine ⊕Steam cycle ⊕Net power ªAuxiliariesªCO2 compr. ªAGR ªASU ªGasification isl.
Figure 5.9: Power distribution and overall net efficiency of the analyzed cases using a two-reactor CLC system.
of the exergy destruction associated with combustion and about 76 % of the exergy
destruction associated with mixing are unavoidable.
5.3 Improvement of the Overall Net Efficiency
The modeling and assumptions of the IGCC plant using a CLC unit is presented in
Section 4.6 and the case declarations are introduced in Section 4.1. In this section,
characteristic parameters and results are discussed. The exergetic evaluation then
follows in Section 5.3.3.
5.3.1 IGCC Using a Two-Reactor CLC Unit
The resulting power distribution as well as the overall net efficiency is given in Fig.
5.9 and Table 5.4 shows the resulting key parameters. The final overall net efficiency
varies from 35.5 to 43.7 % (based on Hi,ar). From the diagram it is evident that only
some of the analyzed cases have a higher efficiency than the reference case IGCC-1. In
case of using a Shell gasifier similar to the reference case, an air reactor temperature
above 1200 °C is necessary to outperform the reference case. Changing the air reactor
temperature from 1100 to 1200 °C (case CLC-Ni1 to CLC-Ni2) increases the overall
efficiency to a greater extend than from 1200 to 1300 °C (case CLC-Ni2 to CLC-Ni3).
95

Chapter 5 Results and Discussion
Table 5.4: Selected results of the analyzed cases using a two-reactor CLC system.
Case CLC-... Ni1 Ni2 Ni3 Ni4 Ni5
Hi syngas to CLC MJ/kg 12.8 12.8 12.8 15.0 15.0Air reactor conversion efficiency % 98.6 98.3 98.1 98.3 98.1Gas turbine exhaust temperature °C 458 535 594 417 476Fuel reactor mole ratio NiO/syngas % 91 91 91 110 110Fuel reactor exit temperature °C 1068 1129 1191 1095 1158HP live steam pressure bar 136 136 130 140 137IP live steam pressure bar 60 54.7 51 60 74LP live steam pressure bar 1.9 1.9 1.9 2.8 1.9HP live steam temperature °C 590 590 590 590 590IP live steam temperature °C 470 480 480 590 590LP live steam temperature °C 278.6 261.1 226.7 310.7 240.1Ratio IP/LP steam production - 2.7 4.1 5.5 2.6 4.5Exit temperature offgas HRSG 1 °C 131.4 131.4 131.5 141.4 130.5
This behavior results from the increasing IP live steam temperature from case CLC-Ni1
to CLC-Ni2 (see Table 5.4). In general, when varying the air reactor temperature, the
internal consumption of the overall plant remains almost constant. However, the
conversion efficiency of the fuel reactor slightly decreases and also the mass flow
rate of the gas turbine decreases due to a reduced cooling demand of the air reactor
at higher temperatures. Contrawise, the turbine inlet temperature simultaneously
increases, having a stronger effect on the overall efficiency. Moreover, the gas turbine
and fuel reactor exit temperature increases which causes a shift from the LP to the IP
steam production at the underlying conditions.
The cases featuring a BGL gasifier outperform the cases featuring a Shell gasifier.
Firstly, the internal consumption by the gasifier island, ASU and AGR unit are smaller
compared to cases using the Shell gasifier. Similar to the discussion above, an increas-
ing air reactor temperature positively affects the overall efficiency. However, this effect
is even stronger when the air reactor temperature is being raised from 1000 to 1100 °C,
then the efficiency increases by about 3 %-points.
Generally, the air reactor temperature is limited upwards and downwards. The
upper limit is determined by the temperature within the CLC reactors and the HRSG
entry at the hot side due to material costs. Otherwise, the lower limit is determined
by several issues. This could be the exit temperature of HRSG 1 resulting from the
constrains of the integrated heat management. In order to satisfy the condensation of
water from the mixture of CO2 and H2O, indirect external cooling could be necessary
causing additional costs. Another limiting issue might be the vapor fraction at the
96

5.3 Improvement of the Overall Net Efficiency
steam turbine outlet which is influenced by the design and constrains of the heat
management system.
Moreover, different options regarding the design of the CLC system are possible.
One option is represented by an atmospheric operation of the air reactor. Thus, an air
compressor is not needed and the hot depleted air can be fed directly to the HRSG
for steam production. However, from a thermodynamic point of view the bottoming
steam cycle affects the overall efficiency less, when compared to the case in which a
topping Joule cycle is included. Furthermore, ensuring good sealing conditions among
the high-pressure fuel reactor and the atmospheric air reactor may cause technical
barriers that have to be overcome.
Another option is represented by applying an intercooled air compressor. This
reduces the air reactor size as the cooling air inlet temperature drops and therefore
the cooling air mass flow rate can be reduced. On the contrary, the mass flow rate of
the Joule cycle simultaneously decreases disproportionately too, which consequently
affects the overall efficiency negatively. In this work, the air reactor pressure is deter-
mined by the desired inlet pressure of the GT combustion chamber which is favorable
over the other options presented above.
In comparison to other studies using a two-reactor CLC system introduced in
Section 2.4, the overall efficiencies obtained from this work result in higher values in all
analyzed cases. Cormos [28] as well as Rezvani [27] analyzed IGCC plants using a Shell
gasifier and a gas quench using the same air reactor temperature range. In this work,
results from simulations that also feature both components showed slightly higher
efficiencies. Furthermore, the results obtained from this work analysis outperform the
IGCC featuring a dual-stage CLC unit analyzed by Rezvani, too. Applying a BGL gasifier
in combination with an HGCU significantly outperforms all other cases analyzed in
this work as well as other convenient literature data.
5.3.2 IGCC Using a Three-Reactor CLC Unit
The dimensionless subsystem performance as well as the overall efficiency of the five
analyzed cases is given in Fig. 5.10 and Table 5.5 shows the resulting key parameters.
The resulting overall net efficiency varies from 36.9 to 41.4 % (based on Hi,ar), which
are higher than the reference case IGCC-1 in almost every case. In general, cases
featuring a BGL gasifier outperform the cases featuring a Shell gasifier by about 3 %-
points at the same air reactor temperature. Through the comparison of cases CLC-Fe3
97
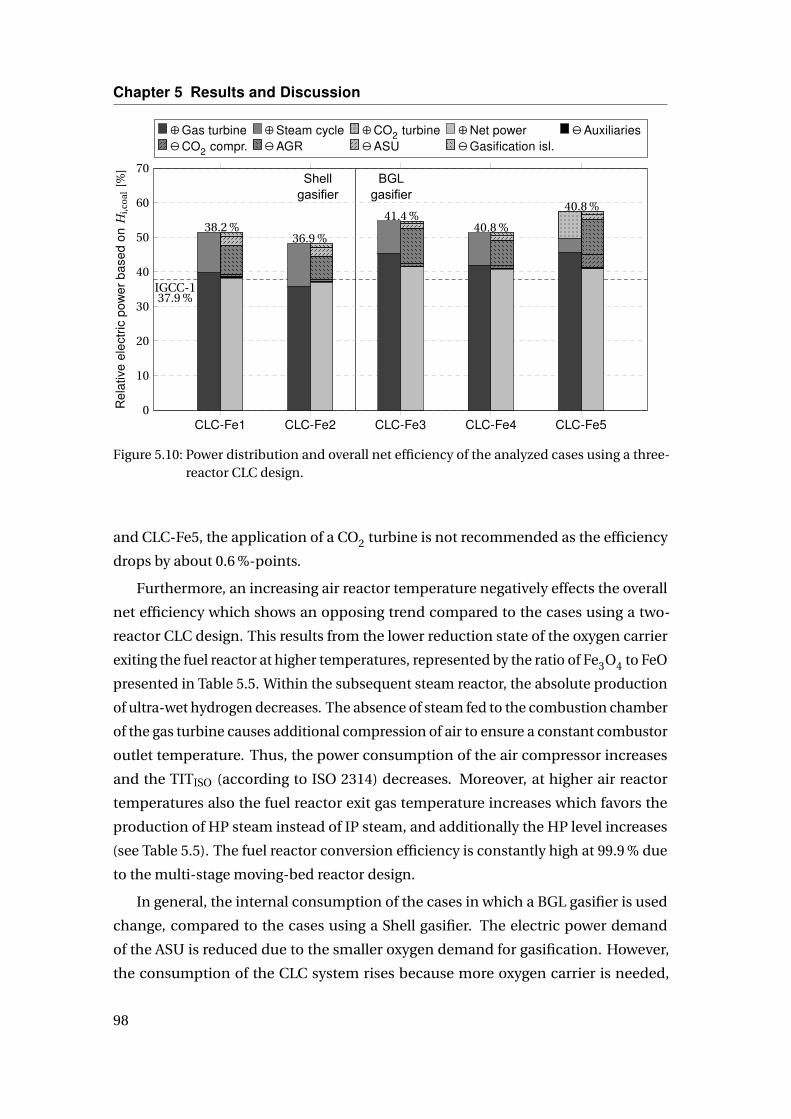
Chapter 5 Results and Discussion
1 100
10
20
30
40
50
60
70Shell
gasifierBGL
gasifier
IGCC-137.9 %
38.2 %36.9 %
41.4 %40.8 %
40.8 %
CLC-Fe1 CLC-Fe2 CLC-Fe3 CLC-Fe4 CLC-Fe50
10
20
30
40
50
60
70
Rel
ativ
eel
ectr
icpo
wer
base
don
Hi,c
oal
[%]
⊕Gas turbine ⊕Steam cycle ⊕CO2 turbine ⊕Net power ªAuxiliariesªCO2 compr. ªAGR ªASU ªGasification isl.
Figure 5.10: Power distribution and overall net efficiency of the analyzed cases using a three-reactor CLC design.
and CLC-Fe5, the application of a CO2 turbine is not recommended as the efficiency
drops by about 0.6 %-points.
Furthermore, an increasing air reactor temperature negatively effects the overall
net efficiency which shows an opposing trend compared to the cases using a two-
reactor CLC design. This results from the lower reduction state of the oxygen carrier
exiting the fuel reactor at higher temperatures, represented by the ratio of Fe3O4 to FeO
presented in Table 5.5. Within the subsequent steam reactor, the absolute production
of ultra-wet hydrogen decreases. The absence of steam fed to the combustion chamber
of the gas turbine causes additional compression of air to ensure a constant combustor
outlet temperature. Thus, the power consumption of the air compressor increases
and the TITISO (according to ISO 2314) decreases. Moreover, at higher air reactor
temperatures also the fuel reactor exit gas temperature increases which favors the
production of HP steam instead of IP steam, and additionally the HP level increases
(see Table 5.5). The fuel reactor conversion efficiency is constantly high at 99.9 % due
to the multi-stage moving-bed reactor design.
In general, the internal consumption of the cases in which a BGL gasifier is used
change, compared to the cases using a Shell gasifier. The electric power demand
of the ASU is reduced due to the smaller oxygen demand for gasification. However,
the consumption of the CLC system rises because more oxygen carrier is needed,
98
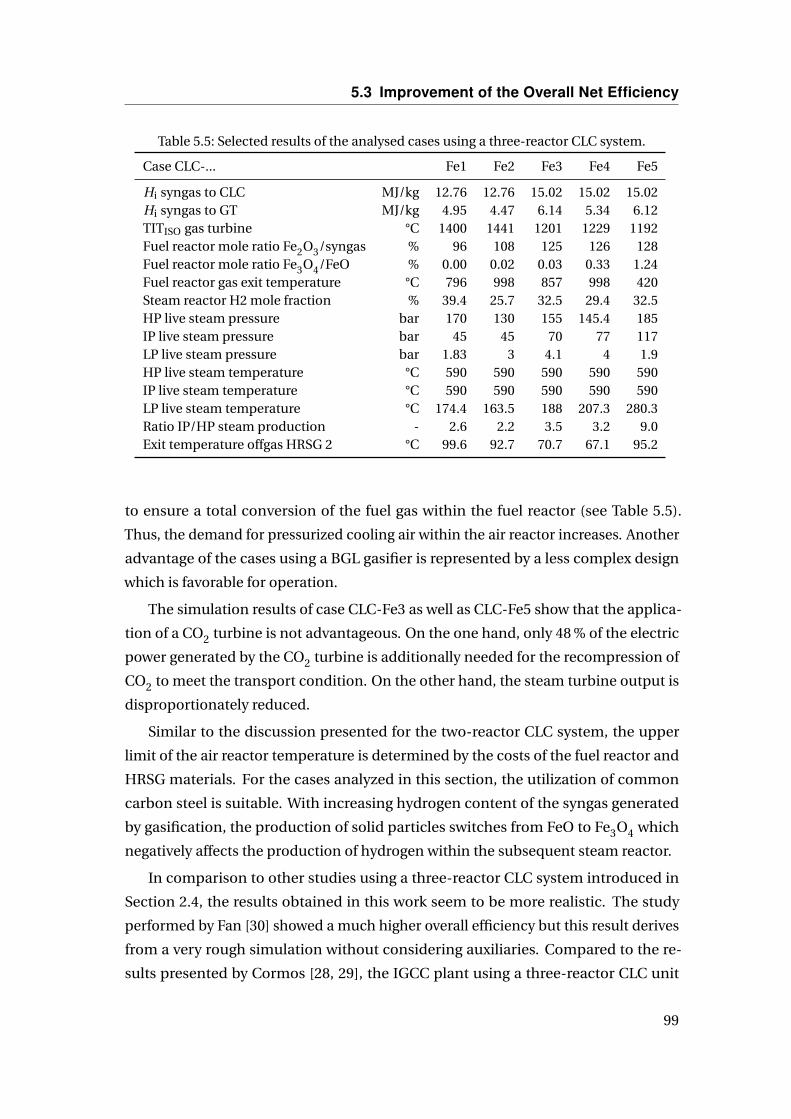
5.3 Improvement of the Overall Net Efficiency
Table 5.5: Selected results of the analysed cases using a three-reactor CLC system.
Case CLC-... Fe1 Fe2 Fe3 Fe4 Fe5
Hi syngas to CLC MJ/kg 12.76 12.76 15.02 15.02 15.02Hi syngas to GT MJ/kg 4.95 4.47 6.14 5.34 6.12TITISO gas turbine °C 1400 1441 1201 1229 1192Fuel reactor mole ratio Fe2O3/syngas % 96 108 125 126 128Fuel reactor mole ratio Fe3O4/FeO % 0.00 0.02 0.03 0.33 1.24Fuel reactor gas exit temperature °C 796 998 857 998 420Steam reactor H2 mole fraction % 39.4 25.7 32.5 29.4 32.5HP live steam pressure bar 170 130 155 145.4 185IP live steam pressure bar 45 45 70 77 117LP live steam pressure bar 1.83 3 4.1 4 1.9HP live steam temperature °C 590 590 590 590 590IP live steam temperature °C 590 590 590 590 590LP live steam temperature °C 174.4 163.5 188 207.3 280.3Ratio IP/HP steam production - 2.6 2.2 3.5 3.2 9.0Exit temperature offgas HRSG 2 °C 99.6 92.7 70.7 67.1 95.2
to ensure a total conversion of the fuel gas within the fuel reactor (see Table 5.5).
Thus, the demand for pressurized cooling air within the air reactor increases. Another
advantage of the cases using a BGL gasifier is represented by a less complex design
which is favorable for operation.
The simulation results of case CLC-Fe3 as well as CLC-Fe5 show that the applica-
tion of a CO2 turbine is not advantageous. On the one hand, only 48 % of the electric
power generated by the CO2 turbine is additionally needed for the recompression of
CO2 to meet the transport condition. On the other hand, the steam turbine output is
disproportionately reduced.
Similar to the discussion presented for the two-reactor CLC system, the upper
limit of the air reactor temperature is determined by the costs of the fuel reactor and
HRSG materials. For the cases analyzed in this section, the utilization of common
carbon steel is suitable. With increasing hydrogen content of the syngas generated
by gasification, the production of solid particles switches from FeO to Fe3O4 which
negatively affects the production of hydrogen within the subsequent steam reactor.
In comparison to other studies using a three-reactor CLC system introduced in
Section 2.4, the results obtained in this work seem to be more realistic. The study
performed by Fan [30] showed a much higher overall efficiency but this result derives
from a very rough simulation without considering auxiliaries. Compared to the re-
sults presented by Cormos [28, 29], the IGCC plant using a three-reactor CLC unit
99

Chapter 5 Results and Discussion
900 1,000 1,100 1,200 1,30034
36
38
40
42
44
46
3 reactor CLC 2 reactor CLC
BGL
Shell
BGL
Shell
BGL, CO2 turbine
Air reactor temperature [°C]
Ove
rall
nete
ffici
ency
base
don
Hi
[%]
Ref. IGCC-1 CLC-Ni1..3 CLC-Ni4..5CLC-Fe1..2 CLC-Fe3..4 CLC-Fe5
Figure 5.11: Overall net efficiencies of the analyzed cases.
outperforms a CLC system featuring only a fuel and a steam reactor. The air reactor
temperature was about 920 °C, which corresponds to the best cases analyzed in this
work. Additionally, only in this work a HGD unit, a state-of-the-art gas turbine, and an
optimization algorithm was used.
5.3.3 Comparison of the Analyzed Cases
The comparison of the analyzed cases is carried out mainly based on the results
obtained from the exergy analysis. The detailed discussion of the base case IGCC-1 is
presented in Section 5.1 and the exergy destruction ratios of the underlying cases are
given in Table 2.3 in the Appendix B. Information about characteristic parameters are
presented above in Section 5.3.1 and 5.3.2.
The collection of the overall net efficiencies is presented in Fig. 5.11 as a function
of the air reactor temperature. The general trend shows higher efficiencies for the
IGCC plant using a BGL gasifier of up to 5.8 %-points when using a two-reactor CLC
system. Considering an advantage of 2.5 %-points in case of using an HGCU [44], the
potential in efficiency results to about 3.3 %-points. In case of practical problems
concerning the operation of the HGCU, the cases using a Shell gasifier show merely
slightly higher overall efficiencies only for air reactor temperatures above 1200 °C.
100
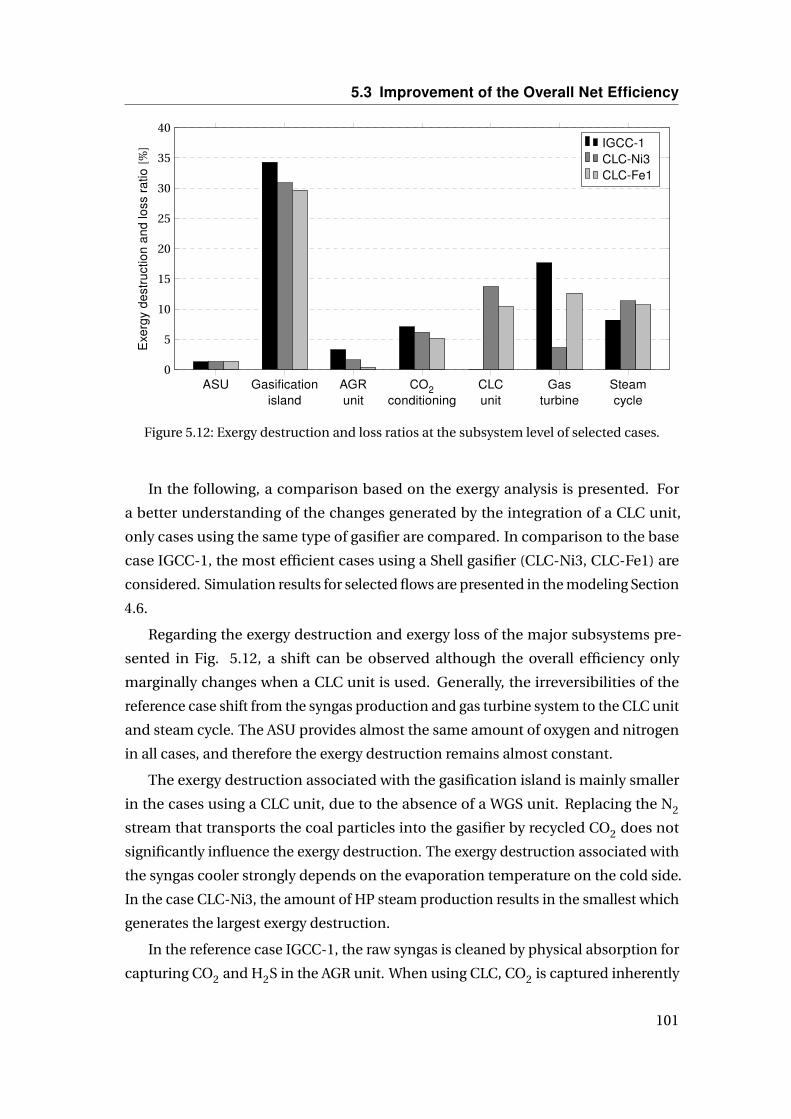
5.3 Improvement of the Overall Net Efficiency
ASU Gasificationisland
AGRunit
CO2conditioning
CLCunit
Gasturbine
Steamcycle
0
5
10
15
20
25
30
35
40E
xerg
yde
stru
ctio
nan
dlo
ssra
tio[%
] IGCC-1CLC-Ni3CLC-Fe1
Figure 5.12: Exergy destruction and loss ratios at the subsystem level of selected cases.
In the following, a comparison based on the exergy analysis is presented. For
a better understanding of the changes generated by the integration of a CLC unit,
only cases using the same type of gasifier are compared. In comparison to the base
case IGCC-1, the most efficient cases using a Shell gasifier (CLC-Ni3, CLC-Fe1) are
considered. Simulation results for selected flows are presented in the modeling Section
4.6.
Regarding the exergy destruction and exergy loss of the major subsystems pre-
sented in Fig. 5.12, a shift can be observed although the overall efficiency only
marginally changes when a CLC unit is used. Generally, the irreversibilities of the
reference case shift from the syngas production and gas turbine system to the CLC unit
and steam cycle. The ASU provides almost the same amount of oxygen and nitrogen
in all cases, and therefore the exergy destruction remains almost constant.
The exergy destruction associated with the gasification island is mainly smaller
in the cases using a CLC unit, due to the absence of a WGS unit. Replacing the N2
stream that transports the coal particles into the gasifier by recycled CO2 does not
significantly influence the exergy destruction. The exergy destruction associated with
the syngas cooler strongly depends on the evaporation temperature on the cold side.
In the case CLC-Ni3, the amount of HP steam production results in the smallest which
generates the largest exergy destruction.
In the reference case IGCC-1, the raw syngas is cleaned by physical absorption for
capturing CO2 and H2S in the AGR unit. When using CLC, CO2 is captured inherently
101

Chapter 5 Results and Discussion
Fuel reactor Air reactor Steamreactor
Aircompressor
Steamreactorcooler
0
2
4
6
8
10
12
Exe
rgy
dest
ruct
ion
ratio
[%]
CLC-Ni3CLC-Fe1
Figure 5.13: Exergy destruction ratios within the CLC unit of case CLC-Ni3 and CLC-Fe1.
and only H2S must be captured separately. This reduces the exergy destruction by
more than 50 % when physical absorption is still applied for H2S removal. Using an
HGCU further reduces the irreversibilities of the H2S capture by about 70 %. The
CO2 conditioning unit includes exergy destruction caused by the compression and
cooling of CO2 to meet the transport conditions as well as the exergy loss associated
with the exiting stream. Here it is advantageous for the cases using CLC unit that the
inlet pressure determined by the gasification process and additional pressure losses is
higher compared to the pressure of the base case. In the base case, the inlet pressure
varies depending on the flash stage of the Selexol® process, respectively.
In case of the CLC unit, the total exergy destruction of case CLC-Ni3 is higher, even
though the reactor temperatures are higher and the system includes less components.
The distribution of the exergy destruction among the components of the CLC unit is
illustrated in Fig. 5.13. In general, the air reactor generates more exergy destruction
because it has a highly exothermic characteristic and the outlet temperature is de-
termined by a large amount of excess air. However, the design of the fuel reactor is
determined by the fuel conversion. In the case CLC-Fe1, the reduced oxygen carriers
are partially oxidized within the steam reactor which leads to a reduction of the exergy
destruction in the air reactor. Moreover, the cooling demand of the air reactor is
reduced because the temperature difference of the oxygen carriers passing the air
reactor is about three times higher compared to the case CLC-Ni3. In the case CLC-Ni3,
the exergy destruction of the steam reactor and the air compressor are calculated to
share almost the same amount.
102
5.3 Improvement of the Overall Net Efficiency
1 2 3 4 5 6 7 8 9 100
2
4
6
8
10
Heat transfer Steam turbine
HP. IP. LP. Eco Condenser HP IP LP Pumps0
0.5
1
1.5
2
2.5
3
3.5
4E
xerg
yde
stru
ctio
nra
tio[%
]IGCC-1CLC-Ni3CLC-Fe1
Figure 5.14: Exergy destruction ratios of the steam cycle (case IGCC-1, CLC-Ni3 and CLC-Fe1).
In comparison of the case CLC-Fe1 to the base case IGCC-1, the exergy destruc-
tion associated with the gas turbine system decreases due to the different fuel gas
composition. In the case CLC-Fe1, pressurized steam enters the combustion chamber
which substitutes excess air to some extend used to dilute the combustion gas. The
depleted air produced by the air reactor also replaces the pressurized air provided by
the air compressor. The difference in composition is marginal but the temperature is
much higher (900 °C instead of 433 °C) which has a positive effect on the joule cylce
efficiency. Moreover, the efficiency of the combustion process increases due to the
higher fuel gas temperature (550 °C instead of 145 °C). Considering the case CLC-Ni3,
the CLC unit completely replaces the GT combustion chamber. On that account, the
exergy destruction of the gas turbine system decreases by far significantly because the
combustion process generates the largest amount of irreversibilities. In comparison
of the CLC unit and the conventional combustion chamber, it is interesting that the
exergy destruction of the CLC unit is slightly higher. However, the gross generation of
electricity by the steam turbine increases significantly because the product stream of
the fuel reactor is further used to generate steam. In the reference case, the mass flow
rate passing through the turbine is larger compared to the mass flow rate of the air
compressor. This relation switches in the case CLC-Ni3 because the pressurized air
gets depleted and the product of the combustion process enters the HRSG 1 directly
without passing the turbine. Both effects decrease the exergy destruction of the GT
turbine.
103
Chapter 5 Results and Discussion
Taking the steam cycle into consideration, the exergy destruction of the cases,
including a CLC unit, increases. A detailed overview is given in Fig. 5.14. The heat
transfer within the HRSGs significantly increases by about 57 % in the case CLC-Ni3
and by 45% in the case CLC-Fe1. However, the enthalpy rate difference associated
with the overall heat transfer only marginally increases due to the absence of a WGS
unit in the cases using CLC.
Another important factor is represented by the average temperature difference
between the hot and cold side. For the cases using CLC, this difference increases
mainly based on IP evaporation. In the case CLC-Fe1, a large demand of IP steam
is required by the steam reactor. In the case CLC-Ni3, the production of IP steam
is preferred over the HP production carried out by mathematical optimization. In
comparison of both cases in which CLC is used, a larger part of the evaporation takes
place outside of the HRSG in the case CLC-Fe1 which decreases the exergy destruction
associated with the IP and HP section within the HRSGs (see Fig. 5.14).
The exergy destruction of the economizer, which preheats the feedwater, is very
small in the base case compared to the others because the large low-temperature
cooling demand by the LT-WGS unit has to be satisfied by the lowest temperatures
within the steam cycle.
With respect to the steam turbine, the different mass flow rates and pressure ratios
cause different exergy destructions. The HP steam turbine was identified to have
no significant impact. In the case CLC-Ni3, the exergy destruction of the IP and LP
steam turbine is larger, due to larger mass flow rates. Moreover, the pressure ratio
is shifted from the IP to the LP steam turbine which additionally raises the exergy
destruction within the LP steam turbine. The exergy destruction associated with the
condenser directly corresponds to the circulating mass flow rate as the inlet steam
quality remains almost constant in the underlying cases.
5.4 Operation with High Electricity Price Volatility
5.4.1 Flexible Operation of the Reference IGCC
In this section, the thermodynamic results of the base case IGCC-2, introduced in
Section 4.5.2, operating under off-design conditions, are discussed. The results of the
steam cycle are identical for both of the off-design cases IGCC-H2 and IGCC-H2i. Only
the electric power of the gas turbine varies. Further results from the economic analysis
are presented below in Section 5.4.2. The application of a syngas storage is not part of
104

5.4 Operation with High Electricity Price Volatility
Table 5.6: Power distribution of the IGCC plant using a GEE gasifier based on Hi,ar in [%].
Subsystem IGCC-2 IGCC-H2i IGCC-H2
Gasification island -1.0 -1.0 -1.0ASU -2.6 -2.6 -2.6AGR unit -1.8 -1.8 -1.8CO2 compressor -3.0 -3.0 -3.0N2 compressor for GT -3.7 0.0 -1.4H2 compressor 0.0 -0.7 -0.5Auxiliaries -0.4 -0.3 -0.3Gas turbine (GT) 30.0 0.0 9.8Steam cycle 14.5 0.6 0.6Net power production 32.1 -8.7 0.0
this work. Compared to the analysis presented in this work, the capital costs further
increase and suitable economic advantages strongly depend on the peak and average
electricity prices. Moreover, the commercial-ready storage options feature a poor H2
density.
The simulation of the HRSG operating under off-design conditions involves several
challenges. A realistic characteristic can be obtained only when the control strategy
is clearly indicated. In this work, the HRSG is bypassed by the gas turbine flue gas in
order to ensure a fast load-change ability. In the case IGCC-H2, the external electrical
power demand of the case IGCC-H2i must be generated internally. In general, the
operation of the gas turbine system also induces the N2 compressor working under
off-design conditions, as well as a smaller H2 compressor used to finally pressurize
the generated H2 stream. Regarding the gas turbine system in the case IGCC-H2, one
option is given by the operation of one of the two gas turbines as well as the steam
cycle under off-design conditions. Assuming a constant distribution of the gross
power production when compared to the design case IGCC-2, the output of the one
gas turbine is almost identical to the output of the steam turbine. On that account, the
gas turbine load drops to about 29 % of the design power which is well below the lower
limit determined by the strongly increasing CO emissions (see Section 4.7). However,
another option is represented by operating one gas turbine only. In this case, the gas
turbine load results in about 65 % which is well above the minimum load. Thus, the
relative efficiency of the gas turbine results in 88.8 % (see Section 4.7). Finally, the
produced H2 stream decreases by about 35 % due to the demand of the gas turbine. In
the case IGCC-H2i, the syngas demand of the steam cycle boiler reduces the final H2
stream by about 3 %. The resulting power distribution of the three analyzed cases is
presented in Table 5.6.
105
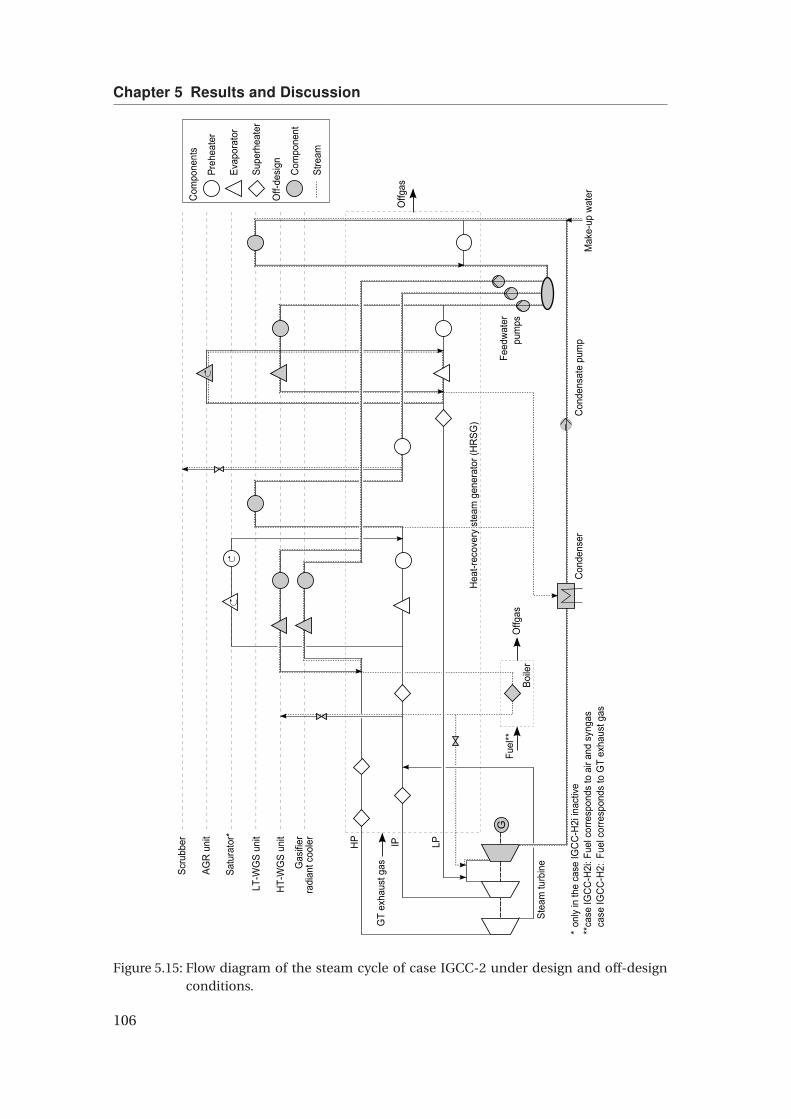
Chapter 5 Results and Discussion
HP IP LP
Preh
eate
r
Evap
orat
or
Supe
rhea
ter
G
Satu
rato
r*
Gas
ifier
ra
dian
t coo
ler
HT-
WG
S un
it
AGR
uni
t
LT-W
GS
unit
Mak
e-up
wat
er
Scru
bber
Hea
t-rec
over
y st
eam
gen
erat
or (H
RSG
)
Feed
wat
er
pum
ps
Con
dens
ate
pum
pC
onde
nser
Stea
m tu
rbin
e
Offg
as
GT
exha
ust g
as
Com
pone
nts
Boile
r
Fuel
**O
ffgas
Com
pone
nt
Stre
am
Off-
desi
gn
**on
ly in
the
case
IGC
C-H
2i in
activ
e**
case
IGC
C-H
2i: F
uel c
orre
spon
ds to
air
and
syng
as**
case
IGC
C-H
2:i F
uel c
orre
spon
ds to
GT
exha
ust g
as
Figure 5.15: Flow diagram of the steam cycle of case IGCC-2 under design and off-designconditions.
106

5.4 Operation with High Electricity Price Volatility
5 6 7 8 9Entropy [kJ/kgK]
Ent
halp
y [k
J/kg
]
160.9 bar46.9 bar
6.7 bar
1.5 bar
0.035 bar
0.90 90 9
0.80 80 8
DesignOff-design3,500
3,250
3,000
2,750
2,500
2,250
2,000
Figure 5.16: T-s diagram of the steam turbine under design and off-design conditions.
Figure 5.16 shows the T-s diagram according to the flow diagram presented in Fig.
5.15 and the state variables given in Table 3.1 in the Appendix C of the steam cycle.
Under design conditions, the heat exchanger network design was found by applying
mathematical optimization. The major optimization restriction is represented by the
fact that steam is not superheated except within the HRSG. Thus, an additional boiler
fired by cleaned syngas is used to superheat the HP saturated steam generated by the
gasifier radiant cooler as well as the HT-WGS unit cooler. The HP and IP steam turbine
are completely bypassed because the mass flow rate is reduced below the lower limit
determined by a positive generation of electric power. Furthermore, the steam quality
within the LP steam turbine decreases significantly after expansion through the HP or
IP steam turbine. Under off-design conditions, the saturated HP steam is superheated
as soon as the IP steam temperature used for the WGS reactors has been reached,
subsequent to an additional throttling process (see flow diagram Fig. 5.15). The rest
is throttled to a pressure lower than the design case pressure because the LP turbine
operates at a lower mass flow rate while the outlet pressure remains constant.
5.4.2 Costs of Hydrogen
In this section, the results of a cost estimation analysis are presented. Assumptions are
presented in Section 3.2 and the modeling of the off-design characteristics is shown in
Section 4.7.
107

Chapter 5 Results and Discussion
Table 5.7: Total capital investment (TCI) of the analyzed cases.
Subsystem/unit Costse2010/kW
Bare erected costs IGCC-2Coal transport 43.3Gasifier 0.0
Gasifier system incl. syngas cooler 267.2ASU and oxidant compression 280.2Other equipment 49.0
Gas cleanup and transportDual-stage Selexol® unit 209.2Claus plant 15.7Mercury removal 3.8WGS unit 23.1Other 4.8
CO2 compression 45.6Gas turbine system
Gas turbine incl. generator 150.5Piping and foundation 12.3
HRSG incl. DeNOx, ductwork, stack, foundations 53.6Steam cycle
Steam turbine and auxiliaries 45.2Condenser and auxiliaries 9.0Piping and foundations 18.3
Cooling water system 54.8Ash and spent handling 58.7Accessors electrics 123.8Instrumentation and control 38.4Improvements on site 28.0Buildings and structure 25.9Sum 1560
TCI case IGCC-2 2060TCI case IGCC-H2i 2112TCI case IGCC-H2 2097
Based on the thermodynamic results obtained from the simulation of the base case
IGCC-2 (see Section 4.5.2), the bare erected costs are calculated. Table 5.7 presents
the cost distributions among the major subsystems as well as the final total capital
investment (TCI) of the analyzed cases required for a full-cost accounting. In the cases
producing H2, the clean syngas from case IGCC-2 must be further purified and the
final exit pressure is 75 atm to meet the pipeline requirements which are assumed for
the competing SMR plant, too. However, the calculated capital costs are 0.88e/kgH2
in the case IGCC-H2i and 1.33e/kgH2in the case IGCC-H2. In the case IGCC-H2, the
108

5.4 Operation with High Electricity Price Volatility
60 70 80 90 100 1100.4
0.6
0.8
1
1.2
1.4
1.6 German industry average in 2014 (>100 GWh)
Intersection for German coal price average in 2014 (72.9 €/tSKE)
Electricity price [e/MWh]
Ope
ratio
nco
sts
H2
prod
uctio
n[e
/kg]
IGCC-H2 - 50 e/tSKE IGCC-H2 - 80 e/tSKE IGCC-H2 - 120 e/tSKE
IGCC-H2i - 50 e/tSKE IGCC-H2i - 80 e/tSKE IGCC-H2i - 120 e/tSKE
SMR
Figure 5.17: Hydrogen operation costs for the analyzed cases.
capital costs are much higher due to the smaller H2 stream. In this work, the results are
mainly based on operation costs because the reference IGCC case is only enhanced by
an additional H2 compression.
The operation costs essentially depend on the coal price. In the case IGCC-H2i, the
price of the required external electric power additionally affects the operation costs.
Figure 5.17 presents the operation costs for the production of H2. While the costs
for the case IGCC-H2 are independent of the electricity price, the costs in the case
IGCC-H2i vary. For a particular coal price, the intersection of both cases curves shows
to the left side an electricity price that favors an import of electricity (case IGCC-H2i)
and to the right side a stand-alone operation (case IGCC-H2). With increasing coal
prices this intersection shifts to higher electricity prices. Thus, importing electric
power is recommended by trend at lower coal prices.
In case of the German market, characteristic values for the year 2014 are presented
in Fig. 5.17. The derivation of the average electricity and coal price is given in Section
3.2. Considering the average coal price, the intersection of both cases is marked by
a cross on the lower left side of the diagram associated with an operation cost of
0.87e/kgH2. Moreover, the intersection is located left to the average electricity price.
Thus, the stand-alone operating case IGCC-H2 is preferred over the import of electric
power for Germany in the year 2014.
109
Chapter 5 Results and Discussion
In Fig. 5.17 the costs for a natural gas-based H2 production via steam methane
reforming (SMR) are given, too, in order to estimate the potential for a hydrogen
market entry. The corresponding operation costs include the process equipment
published by Simbeck and Chang [120], as well as an additional CO2 compression
from 30 atm to 110 bar. The calculated costs are 0.68e/kgH2. With regard to case
IGCC-H2, the equivalent coal price is about 57e/tSKE. On that account, the coal price
must be lower in order to prefer the case IGCC-H2 over the operation of a conventional
SMR plant.
110
Chapter 6
Conclusions and Outlook
In this work, several analyses of conventional and enhanced IGCC plants with carbon
capture using bituminous coal were performed. On the one hand, integrating novel
technologies such as Chemical-Looping Combustion (CLC) or Hot Gas Desulfurization
(HGD) into a conventional IGCC plant can promote higher overall efficiencies for
steady-state operations. However, increasing the flexibility is one of the major future
challenges since the electric power generation by renewable energies will increase the
energy market’s volatility. For both fields, the gas turbine system (GT) has a strong
impact which favors a detailed model for simulation as well as an exhaustive analysis
to improve the understanding of the process.
At first, a conventional and advanced exergy analysis of a commercial high-efficiency
IGCC plant using a Shell gasifier was conducted in order to generate detailed infor-
mations about thermodynamic inefficiencies. The results of the conventional exergy
analysis showed that the gasifier followed by the GT combustion chamber and the
WGS unit cause the highest inefficiencies, primary due to chemical reactions. Sub-
sequently, the gas turbine, syngas cooler, and AGR unit follow. The captured and
conditioned CO2 stream represents the largest exergy loss.
Using the advanced exergy analysis, the exergy destruction is further split into
characteristic parts. The largest avoidable parts were calculated for the gasifier, GT
combustion chamber, GT turbine, as well as the syngas cooler. The absolute potential
of the GT compressor is almost exhausted. Representing the component’s interaction,
the exogenous exergy destruction of all incorporated components is significantly large
which results from the highly integrated system design of the IGCC plant. Thus, the
overall process design significantly affects the overall efficiency. The largest endoge-
nous exergy destruction is generated in the gasifier and the GT combustion chamber
deriving from the highly irreversible chemical reactions. When splitting the exogenous
exergy destruction into further parts, the binary interactions of components can be
111

Chapter 6 Conclusions and Outlook
revealed. Particularly, the gasifier strongly influences the GT combustion chamber as
the GT fuel gas is produced by gasification. Moreover, a large part of the inefficiencies
associated with the gasifier are caused by other components of the gasification island.
Additionally, it was found that about one third of the exogenous exergy destruction
within the gasifier and the GT combustion chamber is produced by other component
interdependencies. In the case of the gasifer, a larger syngas stream is required to
compensate irreversibilities within other components.
Considering the combined splitting of avoidable endogenous exergy destruction,
the gasifier and the GT combustion chamber should be improved first, and posi-
tive effects on other components will likely occur. Furthermore, only technological
modifications of the WGS unit and the AGR unit can enable relevant improvements.
A detailed model for the gas turbine system running on syngas was developed,
based on a state-of-the-art gas turbine running on natural gas. The model was further
enhanced to account for twelve identified characteristic inefficiencies based on an
exergy analysis. In case of using isentropic efficiencies, the effect of mixing at differ-
ent temperatures and pressures as well as expansion cannot be further subdivided.
Thus, this grouping was calculated to the second position directly subsequent to the
stoichiometric combustion. The addition of excess air results to the third position,
followed by mixing at different compositions which is mainly affected by the fuel gas
composition. Subsequently, the compression process then follows. The major cooling
part within the turbine is realized by the film layer and the rest by convective cool-
ing, and therefore the heat transfer was calculated to represent a smaller inefficiency.
Finally, some inefficiencies among the turbine as well as an exergy flow diagram are
presented.
In general, the integration of a CLC unit into an IGCC plant has the potential
to improve the overall efficiency. In this work, the two most promising systems in
combination with the two most suitable gasifier types were analyzed. Based on the
conventional high-efficiency IGCC plant, a two-reactor, as well as a three-reactor CLC
unit was integrated. The plant featuring a two-reactor CLC unit uses NiO as the oxygen
carrier which satisfies the most desired properties when an additional inert support
material is used. This CLC unit replaces the conventional combustion chamber of the
gas turbine whereat two hot, high-pressure streams exit the system instead of only
one. Depleted air exits the air reactor and is recycled to the gas turbine expander. A
mixture of H2O and CO2 exits the fuel reactor and is further used to produce steam
within a HRSG. The CO2 is then captured inherently by simply condensing the major
amount of water.
112

The air reactor temperature was found to be one of the major parameters which
has a significant impact on the overall efficiency. The thermal resistance of materials
limits the air reactor temperature. Based on several simulations, a positive trend for
higher air reactor temperatures was observed for the cases using a two-reactor CLC
system as the higher outlet temperatures promote an efficient steam production. In
general, the design of the heat exchanger network, which combines the cooling and
heating sources, has a significant impact on the overall performance since the steam
turbine performance is directly affected. In the cases using an entrained-flow Shell
gasifier, the air reactor temperature was found to be at least 1200 °C to outperform the
conventional reference case. The general trend showed a preference of the moving
bed BGL gasifier in combination with a HGD unit. However, a satisfying practical
application of a Hot Gas Cleanup Unit (HGCU), especially for removing mercury,
ammonia and COS, has not been demonstrated yet. In the cases when a BGL gasifier
was used, a significant rise in the overall efficiency was observed for an air reactor
temperature of 1100 °C using the two-reactor CLC design. The maximum efficiency
was calculated to be 43.7 %, based on the lower heating value which represents an
increase of 5.8 %-points when compared to the conventional case. Without an HGCU,
the efficiency potential is estimated to be about 3.3 %-points.
The other promising CLC system using three reactors and the oxygen carrier
magnetite (Fe2O3) was found to be less efficient. In comparison to the two-reactor
CLC system, the oxidation of the oxygen carrier occurs within an additional steam
reactor prior to the air reactor. Thus, a third stream consisting of ultra-wet hydrogen
exits the CLC unit and is further combusted within the gas turbine. It was found
that the overall efficiency increases with lower air reactor temperatures which shows
an opposing trend when compared to the two-reactor CLC system. This mainly
results from the reduction state of the oxygen carrier exiting the fuel reactor which
negatively affects the gas turbine performance. The application of an additional CO2
turbine between the CLC unit and the HRSG is not recommended due to a lower
overall efficiency. In summary, the results of this work only show an advantage in the
performance for the integration of CLC into an IGCC plant when using a moving-bed
gasifier in combination with an HGCU. The general trend shows a preference of the
two-reactor CLC system.
Concerning a flexible operation, another conventional IGCC plant which is less
efficient but also less cost-intensive, was simulated. The total capital investment
was determined by a cost estimation. As a new product, the coal-derived syngas is
further prepared to produce almost pure hydrogen. This hydrogen can be sold in
113
Chapter 6 Conclusions and Outlook
periods where the electricity spot price undercuts the operation costs of the IGCC
plant. In this process, the internal electricity demand can be satisfied by either buying
external electric power or by operating the gas turbine under off-design conditions.
In the first case the capital costs were calculated to 0.88e/kgH2and in the second
case to 1.33e/kgH2. In this work, the HRSG as well as the HP and IP steam turbine
are bypassed and the LP steam turbine operates under off-design conditions, too.
Regarding the operation costs for the production of hydrogen, a sensitivity analysis
was performed depending on the price of coal ranging from 50 to 120e/tSKE and the
price of electricity ranging from 60 to 110e/MWh. Apparently, the import of electricity
is only advantageous for low electricity prices. This effect increases with lower coal
prices.
Depending on average prices from the year 2014, it was found that in Germany
internal electricity production should be preferred because the electricity price for
industrial consumers was relatively high. On that account, the operation costs for
producing hydrogen were calculated to 0.87e/kgH2. Based on this scenario, the
operation costs of the competing SMR technology were calculated to only about 77 %,
which represents a disadvantage to access the hydrogen market. The price of coal
should be below 57e/tSKE in order to outperform a SMR plant.
For future work, more experimental investigations on the CLC system regarding
sealing, heat losses, and operation characteristics have to be conducted in order to
calculate the overall system performance more accurately, and to estimate the actual
costs. The economic results can be combined with the exergetic results presented in
this work in the so-called exergoeconomic analysis [168], which rates the cost of the
exergy destructions to further improve the overall system. The actual limitations of a
mathematical opimization applied for the highly non-linear and integrated IGCC plant
have to be overcome by using more powerful solvers and computers to improve the
system. Further analysis on a syngas storage might be useful, especially for markets
involving high average or peak electricity prices.
Generally, in the last years the worldwide price of natural gas has decreased which
promotes investments in gas-fired combined cycle power plants. Considering a future
scenario with higher prices for natural gas, the IGCC technology has the potential to
increase its market share. Additionally, the co-production of hydrogen for markets
involving an electricity pricing with high volatility may present a suitable option.
Furthermore, inventing large-scale technologies that reuse CO2 has a significant
impact on the industrial and public acceptance of efficient power plants with carbon
capture.
114
Bibliography
[1] CO2 emissions from fuel combustion. International Energy Agency, 2014. (Cit.
on p. 1).
[2] Bp statistical review of world energy. BP, 2011. (Cit. on p. 1).
[3] T. Bruckner, I. A. Bashmakov, Y. Mulugetta, H. Chum, A. d. l. Vega Navarro,
J. Edmonds, A. Faaij, B. Fungtammasan, A. Garg, E. Hertwich, D. Honnery, D.
Infield, M. Kainuma, S. Khennas, S. Kim, H. B. Nimir, K. Riahi, N. Strachan,
R. Wiser, and X. Zhang. Climate change 2014: mitigation of climate change.
contribution of working group iii to the fifth assessment report of the intergov-
ernmental panel on climate change. In. J. S. Kirit Parikh, editor. Cambridge
University Press, Cambridge, United Kingdom and New York, NY, USA, 2014.
part Energy Systems, pp. 518–570 (cit. on p. 1).
[4] World energy outlook. Paris: International Energy Agency, 2013. (Cit. on p. 1).
[5] International energy outlook. U.S. Energy Information Administration, 2011.
(Cit. on p. 2).
[6] J. Black. Cost and performance baseline for fossil energy plants volume 1:
bituminous coal and natural gas to electricity. National Energy Technology
Laboratory, DOE/NETL-2010/1397, 2013. (Cit. on pp. 2, 7, 8, 11, 13, 33, 42, 53,
55, 58–60).
[7] T. Fout, A. Zoelle, D. Keairns, M. Turner, M. Woods, N. Kuehn, V. Shah, V. Chou,
and L. Pinkerton. Cost and performance baseline for fossil energy plants vol-
ume 1b: bituminous coal (igcc) to electricity revision 2b - year dollar update.
National Energy Technology Laboratory, DOE/NETL-2015/1727, 2015. (Cit. on
p. 2).
[8] H. Spliethoff. Power generation from solid fuels. Springer-Verlag Berlin Heidel-
berg, 2010 (cit. on pp. 7, 8, 10–12, 14, 15).
[9] J. McJannett. Using physical solvent in multiple applications. Gas - petroleum
technology quarterly:29–37, 2012 (cit. on pp. 8, 13, 14).
115
Bibliography
[10] I. Barnes. Recent operating experience and improvement of commercial igcc.
IEA Clean Coal Centre, 2013. (Cit. on pp. 8, 11, 17, 18).
[11] R. Schlögl. Fossile energieträger werden genutzt, solange es eben geht (in
german). Vdi nachrichten, 38:2, 2014 (cit. on p. 8).
[12] B. Metz, O. Davidson, H. d. Coninck, M. Loos, and L. Meyer. Ipcc special report
on carbon dioxide capture and storage. Cambridge University Press, New York,
2005. (Cit. on pp. 9, 11).
[13] T. Tawfik, G. Tsatsaronis, and D. Price. Exergetic comparison of various igcc
power plant designs. Proceedings of the international conference on energy
systems and ecology, july 5-9, 1993, cracow, poland, 1:585–593, 1993 (cit. on
p. 10).
[14] G. Tsatsaronis, T. Tawfik, and L. Lin. Exergetic comparison of two krw-based
igcc power plants. Journal of engineering for gas turbines and power, 116:291–
299, 1994 (cit. on p. 10).
[15] C. Kunze, K. Riedl, and H. Spliethoff. Structured exergy analysis of an integrated
gasification combined cycle (igcc) plant with carbon capture. Energy, 36:1480–
1487, 2011 (cit. on pp. 10, 11).
[16] N. S. Siefert and S. Litster. Exergy and economic analyses of advanced igcc-ccs
and igfc-ccs power plants. Applied energy, 107:315–328, 2013 (cit. on p. 10).
[17] D. Jones, D. Bhattacharyya, R. Turton, and S. E. Zitney. Optimal design and
integration of an air separation unit (asu) for an integrated gasification com-
bined cycle (igcc) power plant with CO2 capture. Fuel processing technology,
92:1685–1695, 2011 (cit. on p. 11).
[18] M. Liszka and J. Tuka. Parametric study of gt and asu integration in case of igcc
with CO2 removal. Energy, 45:151–159, 2012 (cit. on p. 11).
[19] C.-C. Cormos. Integrated assessment of igcc power generation technology with
carbon capture and storage (ccs). Energy, 42:434–445, 2012 (cit. on p. 11).
[20] E. Martelli, T. Kreutz, and S. Consonni. Comparison of coal igcc with and
without CO2 capture and storage: shell gasification with standard vs. partial
water quench. Energy procedia, 1(1):607–614, 2009 (cit. on pp. 11, 58, 59).
[21] J. Katzer. The future of coal. MIT - Massachusetts Institute of Technology, 2007.
(Cit. on p. 11).
[22] Spallina, M. Romano, P. Chiesa, F. Gallucci, M. v. Sint Annaland, and G. Lozza.
Integration of coal gasification and packed bed clc for high efficiency and
near-zero emission power generation. International journal of greenhouse gas
control, 27:28–41, 2014 (cit. on pp. 11, 23).
116
Bibliography
[23] C. Chen and E. S. Rubin. CO2 control technology effects on igcc plant perfor-
mance and cost. Energy policy, 37:915–924, 2009 (cit. on pp. 11, 12).
[24] V. A. R. Ibarra and M. Schmidt. Exergoeconomic analysis of an igcc power
plant with a texaco gasifier and pre-combustion carbon capture. MA thesis.
Technische Universität Berlin, Germany, 2011 (cit. on p. 11).
[25] C.-C. Cormos. Evaluation of energy integration aspects for igcc-based hydro-
gen and elextricity co-production with carbon capture and storage. Interna-
tional journal of hydrogen energy, 35:7485–7497, 2010 (cit. on p. 11).
[26] J. M. Klara. Cost and performance baseline for fossil energy plants - volume
1: bituminous coal and natural gas to electricity. National Energy Technology
Laboratory, DOE/NETL-2007/1281, 2007. (Cit. on p. 11).
[27] S. Rezvani, Y. Huang, D. McIlveen-Wright, N. Hewitt, and J. D. Mondol. Com-
parative assessment of coal fired igcc systems with CO2 capture using physical
absorption, membrane reactors and chemical looping. Fuel, 88:2463–2472,
2009 (cit. on pp. 11, 12, 23, 24, 97).
[28] C.-C. Cormos. Evaluation of syngas-based chemical looping applications for
hydrogen and power co-generation with ccs. International journal of hydrogen
energy, 37:13371–13386, 2012 (cit. on pp. 11, 23, 24, 97, 99).
[29] C.-C. Cormos. Evaluation of iron based chemical looping for hydrogen and
electricity co-production by gasification process with carbon capture and
storage. International journal of hydrogen energy, 35:2278–2289, 2010 (cit. on
pp. 11, 23, 24, 99).
[30] L.-S. Fan. Chemical looping systems for fossil energy conversions. John Wiley &
Sons, Inc., Hoboken, New Jersey, 2010 (cit. on pp. 11, 22, 24, 99).
[31] M. Bracht, P. T. Alderliesten, R. Kloster, R. Pruschek, G. Haupt, E. Xue, J. R. H.
Ross, M. K. Koukou, and N. Papayannakos. Water gas shift membrane reactor
for CO2 control in igcc systems: techno-economic feasibility study. Energy
conversion and management, 38(1):5159–5164, 1997 (cit. on pp. 11, 12).
[32] C. Kunze. Simulation und bewertung zuünftiger igcc-kraftwerkskonzepte mit
CO2-abtrennung (in german). PhD thesis. Technische Universität München,
2012 (cit. on pp. 11, 12).
[33] G. Krishnan, D. Steele, K. O′Brien, R. Callahan, K. Berchtold, and J. Figueroa.
Simulation of a process to capture CO2 from igcc syngas using a high temper-
ature pbi membrane. Energy procedia, 1(1):4079–4088, 2009 (cit. on pp. 11,
12).
117
Bibliography
[34] E. Grol and J. Wimer. Systems analysis of an integrated gasification fuel cell
combined cycle. National Energy Technology Laboratory (NETL), DOE/NETL-
40/080609, 2009. (Cit. on pp. 11, 12).
[35] A. Lanzini, T. Kreutz, E. Martelli, and M. Santarelli. Energy and economic
performance of novel integrated gasifier fuel cell (igfc) cycles with carbon
capture. International journal of greenhouse gas control, 26:169–184, 2014 (cit.
on pp. 11, 12).
[36] J. J. Marano and J. P. Ciferino. Integration of gas separation membranes with
igcc identifying the right membrane for the right job. Energy procedia, 1(1):361–
368, 2009 (cit. on p. 12).
[37] Korea plans 360 mw fuel cell power facility with posco, doosan. Fuel cells
bulletin, 10:4, 2014 (cit. on p. 12).
[38] R. Doctor, J. Molburg, and P. Thimmapuram. Krw oxygen-blown gasification
combined cycle: carbon dioxide recovery, transport, and disposal. Energy
Systems Division, Argonne National Laboratory, 1996. (Cit. on pp. 13, 14, 58).
[39] J. B. Tennant. Gasification technologies program - overview. National Energy
Technology Laboratory (NETL), 2011. (Cit. on pp. 13, 14).
[40] B. Burr and L. Lyddon. A comparison of physical solvents for acid gas removal.
Bryan research & engineering, inc., 2008 (cit. on p. 14).
[41] S. AG. Neue verdichter für den ccs-markt (in german). Bwk, das energie-fachmagazin,
9:49–50, 2015 (cit. on p. 14).
[42] G. R. Schoofs. Sulfur condensation in claus catalyst. Hydrocarbon processings,
1985 (cit. on pp. 14, 58).
[43] G. Hochgesand. Rectisol and purisol. Industrial engineering chemistry, 62(7):37–
43, 1970 (cit. on p. 14).
[44] A. Giuffrida, M. C. Romano, and G. Lozza. Efficiency enhancement in igcc
power plants with air-blown gasification and hot gas clean-up. Energy, 53:221–
229, 2013 (cit. on pp. 15, 100).
[45] D. Vamvuka, C. Arvanitidis, and D. Zachariadis. Flue gas desulfurization at
high temperatures: a review. Environmental engineering science, 21(4):525–547,
2004 (cit. on p. 15).
[46] A. T. Atimtay. Cleaner energy production with integrated gasification combined
cycle systems and use of metal oxide sorbents for H2S cleanup from coal gas.
Clean products and processes, 2:197–208, 2001 (cit. on p. 15).
[47] Warm-syngas cleanup technology. URL: http://www.rti.org (cit. on
p. 15).
118
Bibliography
[48] R. Gupta, B. Turk, and M. Lesemann. Rti/eastman warm syngas clean-up
technology: integration with carbon capture. In Gasification technologies con-
ference. Colorado, USA, 2009 (cit. on p. 15).
[49] N. Korens, D. R. Simbeck, and D. J. Wilhelm. Process screening analysis of
alternative gas treating and sulfur removal for gasification. SFA Pacific, Inc.,
2002. (Cit. on p. 15).
[50] O. Turna. Sasol-lurgi fixed bed dry bottom gasification for fuels and chemicals.
In 2nd international freiberg conference on igcc & xtl technologies. Freiberg,
Germany, 2007 (cit. on p. 16).
[51] C. Higman and M. v. d. Burgt. Gasification. Gulf Professional Publishing, Ams-
terdam, 2007 (cit. on pp. 16, 57, 68, 71).
[52] T. Blumberg, M. Sorgenfrei, and G. Tsatsaronis. Modelling and evaluation of an
igcc concept with carbon capture for the co-production of sng and electricity.
In 28th international conference on efficiency, costs, optimization, simulation
and environmental impact of energy systems - ecos. Pau, France, 2015 (cit. on
p. 17).
[53] T. Blumberg, M. Sorgenfrei, and G. Tsatsaronis. Modelling and evaluation of an
igcc concept with carbon capture for the co-production of sng and electricity.
Sustainablility, 7:16213–16225, 2015 (cit. on p. 17).
[54] From solid fuels to substitute natural gas (sng) using tremp. Denmark: Haldor
Topsøe, 2009. (Cit. on p. 17).
[55] World gasification database. URL: http://www.gasification.org/
what-is-gasification/world-database/ (cit. on pp. 17, 18).
[56] Gasification plant databases. U.S. Department of Energy (DOE). URL: http:
/ / www . netl . doe . gov / research / coal / energy - systems /
gasification/gasification-plant-databases (cit. on p. 17).
[57] The sgt5-8000h - proven in commercial operation. Siemens AG - Energy Sector,
2012. (Cit. on pp. 18, 52, 53).
[58] R. Taud, J. Karg, and D. O‘Leary. Gas turbine based power plants: technology
and market status. Energy issues, 20:1–8, 1999 (cit. on p. 18).
[59] Energy technology perspectives - scenarios & strategies to 2050. IEA, 2006.
(Cit. on p. 18).
[60] W. Renzenbrink and M. Scholz. H2 gas turbine - a stepping stone to ccs. In 18th
world hydrogen energy conference (whec) 2010. Essen, Germany, 2010 (cit. on
p. 18).
119

Bibliography
[61] I. S. Ertesvag, H. M. Kvamsdal, and O. Bolland. Exergy analysis of a gas-turbine
combined-cycle power plant with precombustion CO2 capture. Energy, 30:5–
39, 2005. DOI: doi:10.1016/j.energy.2004.05.029 (cit. on p. 19).
[62] G. Cassetti, M. Rocco, and E. Colombo. Exergy based methods for economic
and risk design optimization of energy systems - application to a gas turbine.
Energy, 74:269–279, 2014. DOI: doi:10.1016/j.energy.2014.07.043
(cit. on p. 19).
[63] E. Acikkalp, H. Aras, and A. Hepbasli. Advanced exergy analysis of an electricity-
generating facility using natural gas. Energy conversion and management,
82:146–153, 2014. DOI: doi:10.1016/j.enconman.2014.03.006
(cit. on p. 19).
[64] S. Soltani, M. Yari, S. Mahmoudi, and M. R. T. Morosuk. Advanced exergy
analysis applied to an externally-fired combined-cycle power plant integrated
with a biomass gasification unit. Energy, 59:775–780, 2013. DOI: http://dx.
doi.org/10.1016/j.energy.2013.07.038 (cit. on p. 19).
[65] P. Ahmadi, I. Dincer, and M. A. Rosen. Exergy, exergoeconomic and environ-
mental analyses and evolutionary algorithm based multi-objective optimiza-
tion of combined cycle power plants. Energy, 36:5886–5898, 2011. DOI: doi:
10.1016/j.energy.2011.08.034 (cit. on p. 19).
[66] Iso 2314:2009(e). Gas turbines - Acceptance tests (cit. on p. 19).
[67] M. A. EI-Masri. Exergy analysis of combined cycles: part 1 - air-cooled brayton-
cycle gas turbines. Journal of engineering for gas turbines and power, 109:228–
236, 1987 (cit. on pp. 19, 94).
[68] E. A. Khodak and G. A. Romakhova. Thermodynamic analysis of air - cooled gas
turbine plants. Journal of engineering for gas turbines and power, 123:265–270,
2001. DOI: DOI:10.1115/1.1341204 (cit. on p. 19).
[69] S. Staudacher and P. W. Zeller. Exergy analysis for the performance evaluation
of different setups of the secondary air system of aircraft gas turbines. In Asme
turbo expo: power for land, sea and air. Montreal, Canada, 2007 (cit. on pp. 19,
94).
[70] K. F. Knoche and H. Richter. Verbesserung der reversibilität von verbren-
nungsprozessen (in german). Brennstoff-wärme-kraft (bwk), 20(5):205–210,
1968 (cit. on p. 19).
[71] S. Hurst. Production of hydrogen by the steam-iron method. Journal of the
american oil chemists’ society, 16:29–36, 1939 (cit. on p. 20).
120

Bibliography
[72] E. R. G. Warren K. Lewis. Production of pure carbon dioxide. (US000002665971A).
1954 (cit. on p. 20).
[73] M. Ishida, D. Zheng, and T. Akehata. Evaluation of a chemical-looping-combustion
power-generation system by graphic exergy analysis. Energy, 12(2):147–154,
1987 (cit. on p. 20).
[74] P. Markewitz, W. Kuckshinrichs, W. Leitner, J. Linssen, P. Zapp, R. Bongartz, A.
Schreiber, and T. E. Müller. Worldwide innovations in the development of car-
bon capture technologies and the utilization of CO2. Energy and environmental
science, 5:7281–7305, 2012 (cit. on p. 20).
[75] J. Adanez, A. Abad, F. Garcia-Labiano, P. Gayan, and L. F. d. Diego. Progress in
chemical-looping combustion and reforming technologies. Progress in energy
and combustion science, 38:215–282, 2012 (cit. on p. 20).
[76] A. Lyngfelt. Chemical-looping combustion of solid fuels - status of develop-
ment. Applied energy, 113:1869–1873, 2014 (cit. on p. 20).
[77] V. Kempkes and A. Kather. Chemical looping combustion: comparative anal-
ysis of two different overall process configurations for removing unburnt
gaseous components. In 2nd international conference on chemical looping,
26-28 september 2012. Darmstadt, Germany, 2012 (cit. on pp. 21, 64).
[78] C. F. Blazek, N. R. Baker, and R. R. Tison. High-btu coal gasification processes.
Institute of Gas Technology, 1979. (Cit. on p. 21).
[79] P. Gupta, L. G. Velazquez-Vargas, and L.-S. Fan. Syngas redox (sgr) process to
produce hydrogen from coal derived syngas. Energy & fuels, 21:2900–2908,
2007 (cit. on pp. 21, 72).
[80] N. A. Lange. Lange’s handbook of chemistry. J. A. Dean, editor. McGraw-Hill,
Inc., 1999 (cit. on p. 22).
[81] T. Mattisson, F. Garcia-Labiano, B. Kronberger, A. Lyngfelt, J. Adanez, and H.
Hofbauer. Chemical-looping combustion using syngas as fuel. International
journal of greenhouse gas control, 1:158–169, 2007 (cit. on p. 22).
[82] D. Jing, T. Mattisson, M. Ryden, P. Hallberg, A. Hedayati, J. V. Noyen, F. Snijk-
ers, and A. Lyngfelt. Innovative oxygen carrier materials for chemical-looping
combustion. Energy prodecia, 37:645–653, 2013 (cit. on p. 22).
[83] S. Bhavsar, B. Tackett, and G. Veser. Evaluation of iron- and manganese-based
mono- and mixed-metallic oxygen carriers for chemical looping combustion.
Fuel, 136:268–279, 2014 (cit. on p. 22).
121
Bibliography
[84] L.-G. Velazquez-Vargas, P. P. T. Thomas, and L.-S. Fan. Hydrogen production
via redox reaction of syngas with metal oxide composite particles. In Aiche
annual meeting. Austin, Texas, USA, 2004 (cit. on p. 22).
[85] R.-H. Perry and D.-W. Green. Perrys chemical engineers handbook. Vol. 8th
edition. McGraw-Hill, Columbus, 2008 (cit. on p. 22).
[86] E. Johansson, T. Mattisson, A. Lyngfelt, and H. Thuman. Combustion of syngas
and natural gas in a 300w chemical-looping combustor. Chemcial engineering
research and design, 84:819–827, 2006 (cit. on p. 22).
[87] M. Anheden and G. Svedberg. Chemical looping combustion in combination
with integrated coal gasification. In 31st intersociety energy conversion engi-
neering conference (iecec 96). Washington DC, USA, 1996 (cit. on p. 23).
[88] M. Anheden and G. Svedber. Exergy analysis of chemical-looping combustion
systems. Energy conversion and management, 39(16):1967–1998, 1998 (cit. on
p. 23).
[89] M. Schmidt, B. Erlach, and G. Tsatsaronis. Comparison of an igcc with pre-
combustion carbon capture and an igcc design with chemical-looping com-
bustion. In 22nd international conference on efficiency, costs, optimization,
simulation and environmental impact of energy systems - ecos. Foz do Iguacu,
Parana, Brazil, 2009 (cit. on pp. 23, 63).
[90] B. Erlach, M. Schmidt, and G. Tsatsaronis. Comparison of carbon capture igcc
with pre-combustion decarbonisation and with chemical-looping combustion.
Energy, 36(6):3804–3815, 2011. DOI: doi:10.1016/j.energy.2010.08.
038 (cit. on pp. 23, 63).
[91] H. C. Mantripragada and E. S. Rubin. Chemical looping for pre-combustion
CO2 capture performance and cost analysis. Energy procedia, 37:618–625, 2013
(cit. on p. 23).
[92] K. Svoboda, G. Slowinski, J. Rogut, and D. Baxter. Thermodynamic possibilities
and constraints for pure hydrogen production by iron based chemical looping
process at lower temperatures. Energy conversion and management, 48:3063–
3073, 2007 (cit. on p. 24).
[93] W. Xiang, S. Chen, Z. Xue, and X. Sun. Investigation of coal gasification hydro-
gen and electricity co-production plant with three-reactors chemical looping
process. International journal of hydrogen energy, 35:8580–8591, 2010 (cit. on
p. 24).
122
Bibliography
[94] S. Chen, Z. Xue, D. Wang, and W. Xiang. Hydrogen and electricity co-production
plant integrating steam-iron process and chemical looping combustion. Inter-
national journal of hydrogen energy, 37:8204–8216, 2012 (cit. on p. 24).
[95] P. Chiesa, G. Lozza, A. Malandrino, M. Romano, and V. Piccolo. Three-reactors
chemical looping process for hydrogen production. International journal of
hydrogen energy, 33:2233–2245, 2008 (cit. on p. 24).
[96] J. Wolf and J. Yan. Parametric study of chemical looping combustion for tri-
generation of hydrogen, heat, and electrical power with CO2 capture. Interna-
tional journal of energy research, 29:739–753, 2005 (cit. on p. 25).
[97] N. Gnanapragasam, B. Reddy, and M. Rosen. Hydrogen production from coal
using coal direct chemical looping and syngas chemical looping combustion
systems: assessment of system operation and resource requirements. Interna-
tional journal of hydrogen energy, 34:2606–2615, 2009 (cit. on p. 25).
[98] M. Sorgenfrei and G. Tsatsaronis. Exergetic assessment of a syngas-redox (sgr)-
based igcc plant for generating electricity. In Asme 2012 international mechan-
ical engineering congress and exposition. Houston, Texas, USA, 2012 (cit. on
pp. 25, 63).
[99] M. Sorgenfrei and G. Tsatsaronis. Exergetic assessment of a syngas-redox-based
igcc plant for generating electricity. Journal of engineering for gas turbines and
power, 136(3), 2013. DOI: 10.1115/1.4025885 (cit. on pp. 25, 63).
[100] M. Sorgenfrei and G. Tsatsaronis. Design and evaluation of an igcc power
plant using iron-based syngas chemical looping (scl) combustion. In 2nd
international conference on chemical looping. Darmstadt, Germany, 2012 (cit.
on pp. 25, 63).
[101] M. Sorgenfrei and G. Tsatsaronis. Design and evaluation of an igcc power plant
using iron-based syngas chemical looping (scl) combustion. Applied energy,
113:1958–1964, 2014 (cit. on pp. 25, 63).
[102] T. Herdan, G.-D. Krieger, and M. Zelinger. Fähigkeiten von stromerzeugungsan-
lagen im energiemix (in german). VDMA Power Systems, 2013. (Cit. on p. 25).
[103] U. Tomschi. Aufgaben thermischer kraftwerke im zuge der energiewende (in
german). Siemens AG, 2014. (Cit. on p. 25).
[104] D. Cocco, F. Serra, and V. Tola. Assessment of energy and economic benefits
arising from syngas storage in igcc power plants. Energy, 58:635–643, 2013
(cit. on p. 25).
123
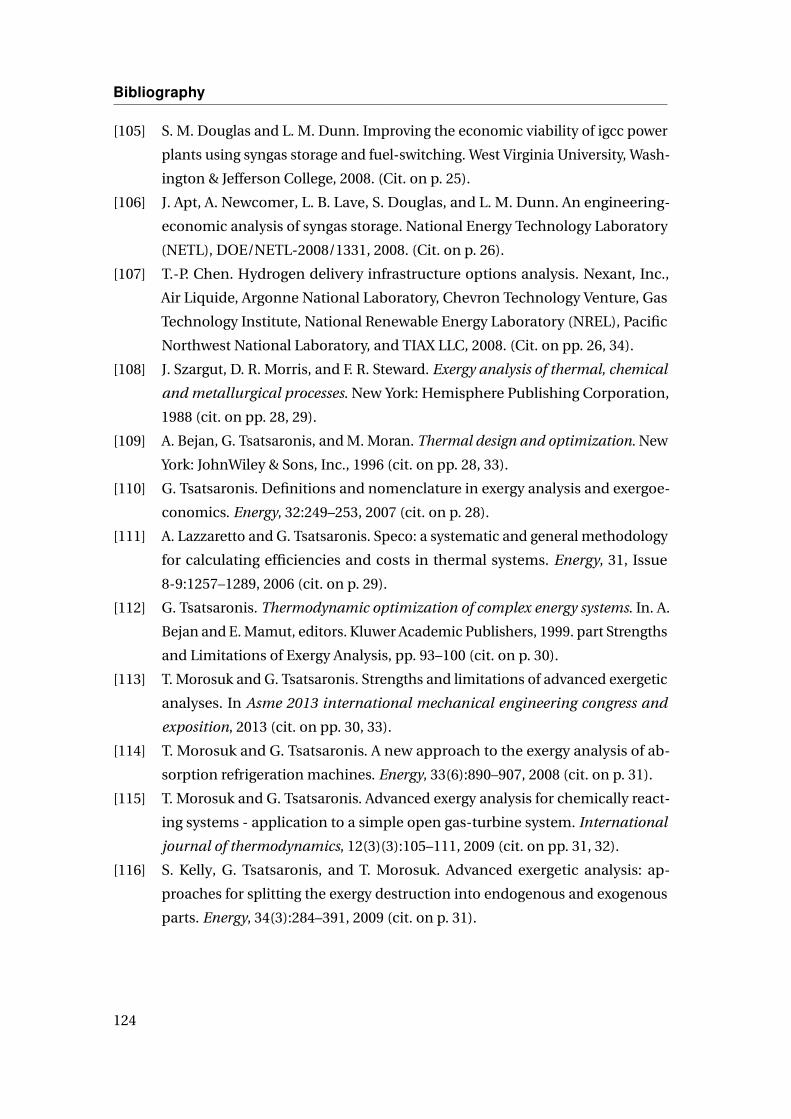
Bibliography
[105] S. M. Douglas and L. M. Dunn. Improving the economic viability of igcc power
plants using syngas storage and fuel-switching. West Virginia University, Wash-
ington & Jefferson College, 2008. (Cit. on p. 25).
[106] J. Apt, A. Newcomer, L. B. Lave, S. Douglas, and L. M. Dunn. An engineering-
economic analysis of syngas storage. National Energy Technology Laboratory
(NETL), DOE/NETL-2008/1331, 2008. (Cit. on p. 26).
[107] T.-P. Chen. Hydrogen delivery infrastructure options analysis. Nexant, Inc.,
Air Liquide, Argonne National Laboratory, Chevron Technology Venture, Gas
Technology Institute, National Renewable Energy Laboratory (NREL), Pacific
Northwest National Laboratory, and TIAX LLC, 2008. (Cit. on pp. 26, 34).
[108] J. Szargut, D. R. Morris, and F. R. Steward. Exergy analysis of thermal, chemical
and metallurgical processes. New York: Hemisphere Publishing Corporation,
1988 (cit. on pp. 28, 29).
[109] A. Bejan, G. Tsatsaronis, and M. Moran. Thermal design and optimization. New
York: JohnWiley & Sons, Inc., 1996 (cit. on pp. 28, 33).
[110] G. Tsatsaronis. Definitions and nomenclature in exergy analysis and exergoe-
conomics. Energy, 32:249–253, 2007 (cit. on p. 28).
[111] A. Lazzaretto and G. Tsatsaronis. Speco: a systematic and general methodology
for calculating efficiencies and costs in thermal systems. Energy, 31, Issue
8-9:1257–1289, 2006 (cit. on p. 29).
[112] G. Tsatsaronis. Thermodynamic optimization of complex energy systems. In. A.
Bejan and E. Mamut, editors. Kluwer Academic Publishers, 1999. part Strengths
and Limitations of Exergy Analysis, pp. 93–100 (cit. on p. 30).
[113] T. Morosuk and G. Tsatsaronis. Strengths and limitations of advanced exergetic
analyses. In Asme 2013 international mechanical engineering congress and
exposition, 2013 (cit. on pp. 30, 33).
[114] T. Morosuk and G. Tsatsaronis. A new approach to the exergy analysis of ab-
sorption refrigeration machines. Energy, 33(6):890–907, 2008 (cit. on p. 31).
[115] T. Morosuk and G. Tsatsaronis. Advanced exergy analysis for chemically react-
ing systems - application to a simple open gas-turbine system. International
journal of thermodynamics, 12(3)(3):105–111, 2009 (cit. on pp. 31, 32).
[116] S. Kelly, G. Tsatsaronis, and T. Morosuk. Advanced exergetic analysis: ap-
proaches for splitting the exergy destruction into endogenous and exogenous
parts. Energy, 34(3):284–391, 2009 (cit. on p. 31).
124

Bibliography
[117] M. Penkuhn and G. Tsatsaronis. Calculation of thermodynamic system com-
ponent interactions for advanced exergy analysis, status: manuscript in prepa-
ration, 2015 (cit. on p. 31).
[118] J. M. Douglas. Conceptual design of chemical processes. McGraw Hill, 1988
(cit. on p. 31).
[119] G. Tsatsaronis and M. Park. On avoidable and unavoidable exergy destructions
and investment costs in thermal systems. Energy conversion and management,
43:1259–1270, 2002 (cit. on p. 31).
[120] D. Simbeck and E. Chang. Hydrogen supply: cost estimate for hydrogen path-
ways - scoping analysis. National Renewable Energy Laboratory (NREL), 2002.
(Cit. on pp. 33, 34, 110).
[121] Chemical engineering plant cost index. URL:http://www.chemengonline.
com (cit. on p. 34).
[122] Average exchange rate euro-dollar. URL: http://www.x-rates.com (cit.
on p. 34).
[123] Price of bituminous coal. 2015. URL: http://www.bafa.de/bafa/de/
energie/steinkohle/drittlandskohlepreis/ (cit. on p. 33).
[124] Industriestrompreise (in german). BDEW Bundesverband der Energie- und
Wasserwirtschaft e.V., 2014. (Cit. on p. 34).
[125] Aspen plus®. URL: http://www.aspentech.com (cit. on p. 34).
[126] Engineering equation solver - professional version. URL: http://www.
fchart.com/ees/ (cit. on p. 34).
[127] Matlab®. URL: http://www.mathworks.com/products/matlab/
(cit. on p. 35).
[128] I. Rumyantseva and S. Watanasiri. Acid gas cleaning using depg physical sol-
vent: validation with experimental and plant data. Aspen Technology, Inc.,
2014. (Cit. on p. 35).
[129] I. Barin. Thermochemical data of pure substances. VCH, Weinheim, 1989 (cit. on
p. 35).
[130] M.-W. Chase. Nist-janaf thermochemical tables. 4. Edition, editor. American
Chemical Society, Washington DC, USA, 1998 (cit. on p. 35).
[131] O. Knacke, O. Kubaschewski, and K. Hesselmann. Thermochemical properties
of inorganic substances (2nd edition). Springer, New York (NY), 1991 (cit. on
p. 35).
[132] National institute of standards and technology (nist). URL: http://www.
nist.gov/ (cit. on p. 35).
125
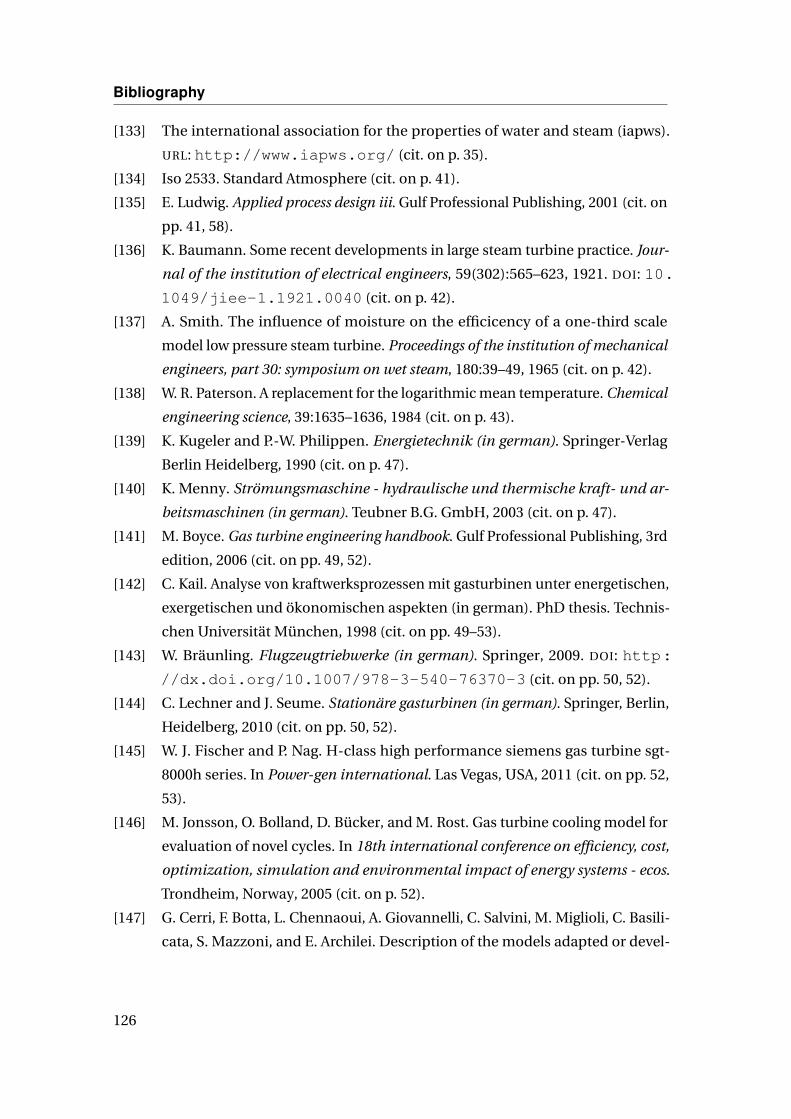
Bibliography
[133] The international association for the properties of water and steam (iapws).
URL: http://www.iapws.org/ (cit. on p. 35).
[134] Iso 2533. Standard Atmosphere (cit. on p. 41).
[135] E. Ludwig. Applied process design iii. Gulf Professional Publishing, 2001 (cit. on
pp. 41, 58).
[136] K. Baumann. Some recent developments in large steam turbine practice. Jour-
nal of the institution of electrical engineers, 59(302):565–623, 1921. DOI: 10.
1049/jiee-1.1921.0040 (cit. on p. 42).
[137] A. Smith. The influence of moisture on the efficicency of a one-third scale
model low pressure steam turbine. Proceedings of the institution of mechanical
engineers, part 30: symposium on wet steam, 180:39–49, 1965 (cit. on p. 42).
[138] W. R. Paterson. A replacement for the logarithmic mean temperature. Chemical
engineering science, 39:1635–1636, 1984 (cit. on p. 43).
[139] K. Kugeler and P.-W. Philippen. Energietechnik (in german). Springer-Verlag
Berlin Heidelberg, 1990 (cit. on p. 47).
[140] K. Menny. Strömungsmaschine - hydraulische und thermische kraft- und ar-
beitsmaschinen (in german). Teubner B.G. GmbH, 2003 (cit. on p. 47).
[141] M. Boyce. Gas turbine engineering handbook. Gulf Professional Publishing, 3rd
edition, 2006 (cit. on pp. 49, 52).
[142] C. Kail. Analyse von kraftwerksprozessen mit gasturbinen unter energetischen,
exergetischen und ökonomischen aspekten (in german). PhD thesis. Technis-
chen Universität München, 1998 (cit. on pp. 49–53).
[143] W. Bräunling. Flugzeugtriebwerke (in german). Springer, 2009. DOI: http:
//dx.doi.org/10.1007/978-3-540-76370-3 (cit. on pp. 50, 52).
[144] C. Lechner and J. Seume. Stationäre gasturbinen (in german). Springer, Berlin,
Heidelberg, 2010 (cit. on pp. 50, 52).
[145] W. J. Fischer and P. Nag. H-class high performance siemens gas turbine sgt-
8000h series. In Power-gen international. Las Vegas, USA, 2011 (cit. on pp. 52,
53).
[146] M. Jonsson, O. Bolland, D. Bücker, and M. Rost. Gas turbine cooling model for
evaluation of novel cycles. In 18th international conference on efficiency, cost,
optimization, simulation and environmental impact of energy systems - ecos.
Trondheim, Norway, 2005 (cit. on p. 52).
[147] G. Cerri, F. Botta, L. Chennaoui, A. Giovannelli, C. Salvini, M. Miglioli, C. Basili-
cata, S. Mazzoni, and E. Archilei. Description of the models adapted or devel-
126

Bibliography
oped ad hoc for the igcc&ccs plants. Low Emission Gas Turbine Technology for
Hydrogen-rich Syngas (H2-IGCC), 2011. (Cit. on p. 52).
[148] R. Dennis. The gas tubrine handbook. National Energy Technology Laboratory
(NETL), U.S. Department of Energy (DOE), 2006 (cit. on p. 52).
[149] Technologien der feststoffvergasung im hause uhde (in german). In Dvv-fach-
ausschuss grundlagen und anwendungen. Uhde (ThyssenKrupp Technologies).
Oberhausen, Germany, 2007 (cit. on pp. 57, 58, 82).
[150] L. Zheng and E. Furinsky. Comparison of shell, texaco bgl and krwgasifiers as
part of igcc plant computer simulations. Energy conversion and management,
46:1767–1779, 2005 (cit. on pp. 58, 60).
[151] F. Ullmann. Ullmann‘s encyclopedia of industrial chemistry. Wiley-VCH, Wein-
heim , Germany, 1998 (cit. on pp. 58, 59).
[152] E. Grol. Evaluation of alternate water gas shift configurations for igcc systems.
National Energy Technology Laboratory (NETL), DOE/NETL-401/080509, 2009.
(Cit. on p. 59).
[153] Gas-turbine sgt5-4000f. Siemens AG, 06.2015. URL: http://www.energy.
siemens.com/hq/en/fossil-power-generation/gas-turbines/
sgt5-4000f.htm#content=Technical%20data (cit. on pp. 60, 62).
[154] A. Giuffrida, M. C. Romano, and G. G. Lozza. Thermodynamic assessment of
igcc power plants with hot fuel gas desulfurization. Applied energy, 87:3374–
3383, 2010 (cit. on p. 71).
[155] S. Göke, S. Terhaar, S. Schimek, K. Göckeler, and C. O. Paschereit. Combustion
of natural gas, hydrogen and bio-fuels at ultra-wet conditions. In Asme turbo
expo 2011: power for land, sea and air. Vancouver, Canada, 2011 (cit. on p. 72).
[156] E. Deuker, M. H. König, M. Möller, J. Slad, and H. Streb. Sgt5-4000f gas turbine
and combined cycle power plant evolution reflecting the changing market
requirements. Siemens AG - Energy Sector, 2013. (Cit. on p. 78).
[157] M. Jansen, T. Schulenberg, and D. Waldinger. Shop test result of the v64.3 gas
turbine. Journal of engineering for gas turbines and power, 114:676–581, 1992
(cit. on pp. 78, 79).
[158] A. Stodola. Dampf- und gastubrinen (in german). Springer, Berlin, 1924 (cit. on
p. 78).
[159] A. Ray. Dynamic modelling of power plant turbines for controller design. Ap-
plied mathematical modelling, 4:109–112, 1980 (cit. on p. 78).
[160] F. P. Incropera and D. P. DeWitt. Fundamentals of heat and mass transfer. John
Wiley & Sons, Inc., 4th edition, 1996 (cit. on p. 79).
127

Bibliography
[161] H. Blasius. Das ähnlichkeitsgesetz bei reibungsvorgängen in flüssigkeiten (in
german). Forschungsarbeiten des vdi, 131, 1913 (cit. on p. 79).
[162] K. Ogriseck. Untersuchung von igcc-kraftwerkskonzepten mit polygeneration
(in german). PhD thesis. VDI - Reihe 6, Freiberg, 2006 (cit. on p. 82).
[163] M. Sorgenfrei, M. Penkuhn, and G. Tsatsaronis. Understanding the inefficien-
cies of an igcc concept with carbon capture based on an advanced exergy
analysis. In 28th international conference on efficiency, costs, optimization,
simulation and environmental impact of energy systems - ecos. Pau, France,
2015 (cit. on p. 85).
[164] M. Sorgenfrei and G. Tsatsaronis. Detailed exergetic evaluation of heavy-duty
gas turbine systems running on natural gas and syngas. In 27th international
conference on efficiency, costs, optimization, simulation and environmental
impact of energy systems - ecos. Turku, Finland, 2014 (cit. on p. 91).
[165] M. Sorgenfrei and G. Tsatsaronis. Detailed exergetic evaluation of heavy-duty
gas turbine systems running on natural gas and syngas. Energy conversion and
management, 107:43–51, 2016 (cit. on p. 91).
[166] G. Tsatsaronis, T. Morosuk, D. Koch, and M. Sorgenfrei. Understanding the
thermodynamic inefficiencies in combustion processes. In 3rd international
conference on contemporary problems of thermal engineering (cpote). Gliwice,
Poland, 2012 (cit. on p. 94).
[167] G. Tsatsaronis, T. Morosuk, D. Koch, and M. Sorgenfrei. Understanding the
thermodynamic inefficiencies in combustion processes. Energy, 62:3–11, 2013.
DOI: 10.1016/j.energy.2013.04.075 (cit. on p. 94).
[168] G. Tsatsaronis and F. Cziesla. Thermoeconomics. In. Vol. 16. Academic Press, 3rd
adition, 2002. part Encyclopedia of Physical Science and Technology, pp. 659–
680 (cit. on p. 114).
128
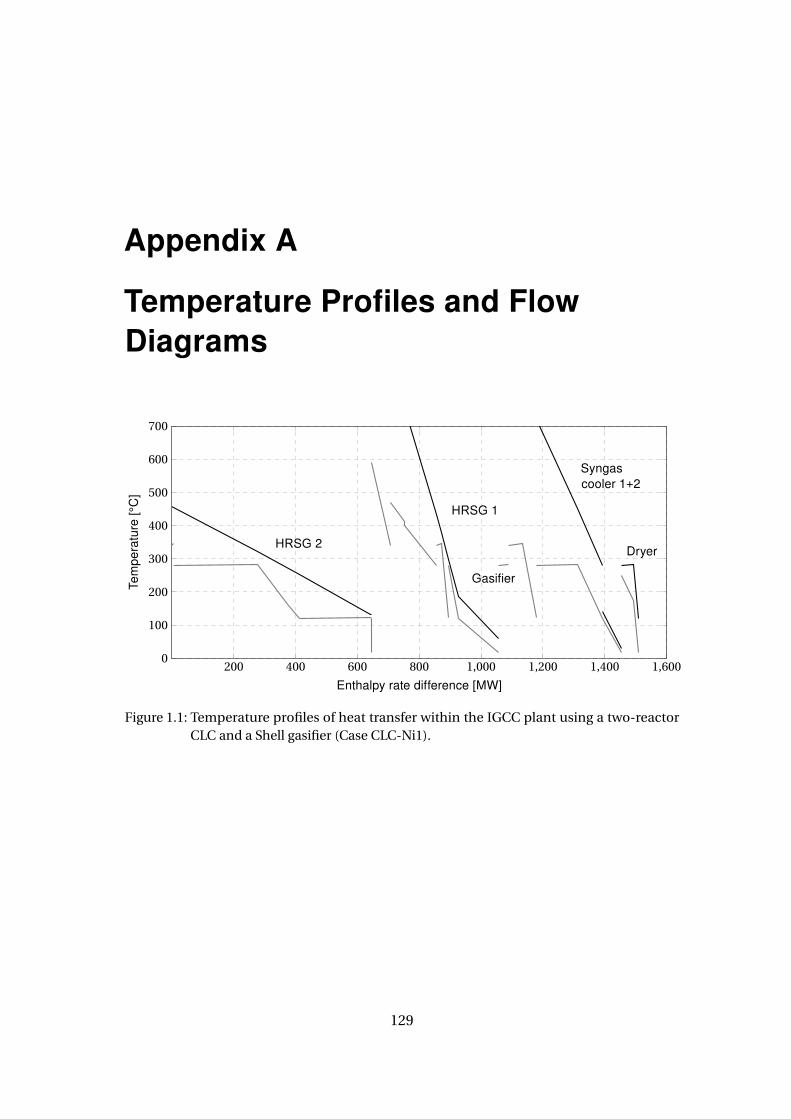
Appendix A
Temperature Profiles and FlowDiagrams
200 400 600 800 1,000 1,200 1,400 1,6000
100
200
300
400
500
600
700
HRSG 2
HRSG 1
Gasifier
Syngascooler 1+2
Dryer
Enthalpy rate difference [MW]
Tem
pera
ture
[°C
]
Figure 1.1: Temperature profiles of heat transfer within the IGCC plant using a two-reactorCLC and a Shell gasifier (Case CLC-Ni1).
129
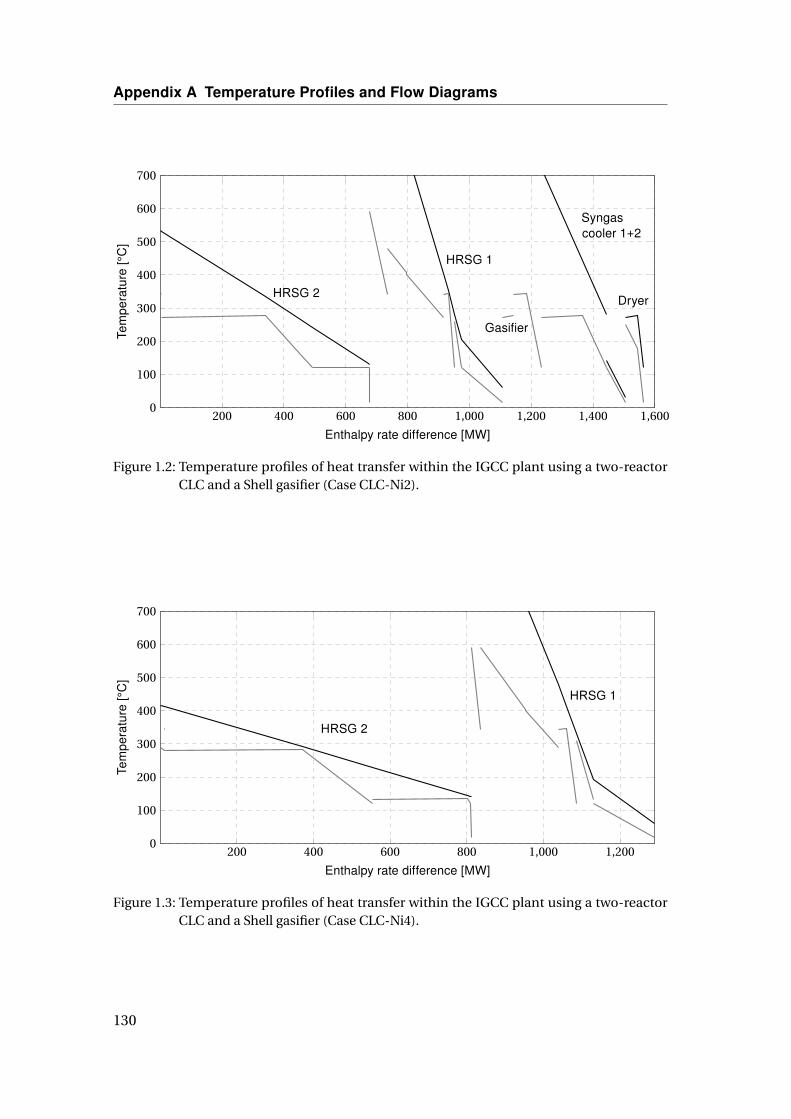
Appendix A Temperature Profiles and Flow Diagrams
200 400 600 800 1,000 1,200 1,400 1,6000
100
200
300
400
500
600
700
HRSG 2
HRSG 1
Gasifier
Syngascooler 1+2
Dryer
Enthalpy rate difference [MW]
Tem
pera
ture
[°C
]
Figure 1.2: Temperature profiles of heat transfer within the IGCC plant using a two-reactorCLC and a Shell gasifier (Case CLC-Ni2).
200 400 600 800 1,000 1,2000
100
200
300
400
500
600
700
HRSG 2
HRSG 1
Enthalpy rate difference [MW]
Tem
pera
ture
[°C
]
Figure 1.3: Temperature profiles of heat transfer within the IGCC plant using a two-reactorCLC and a Shell gasifier (Case CLC-Ni4).
130
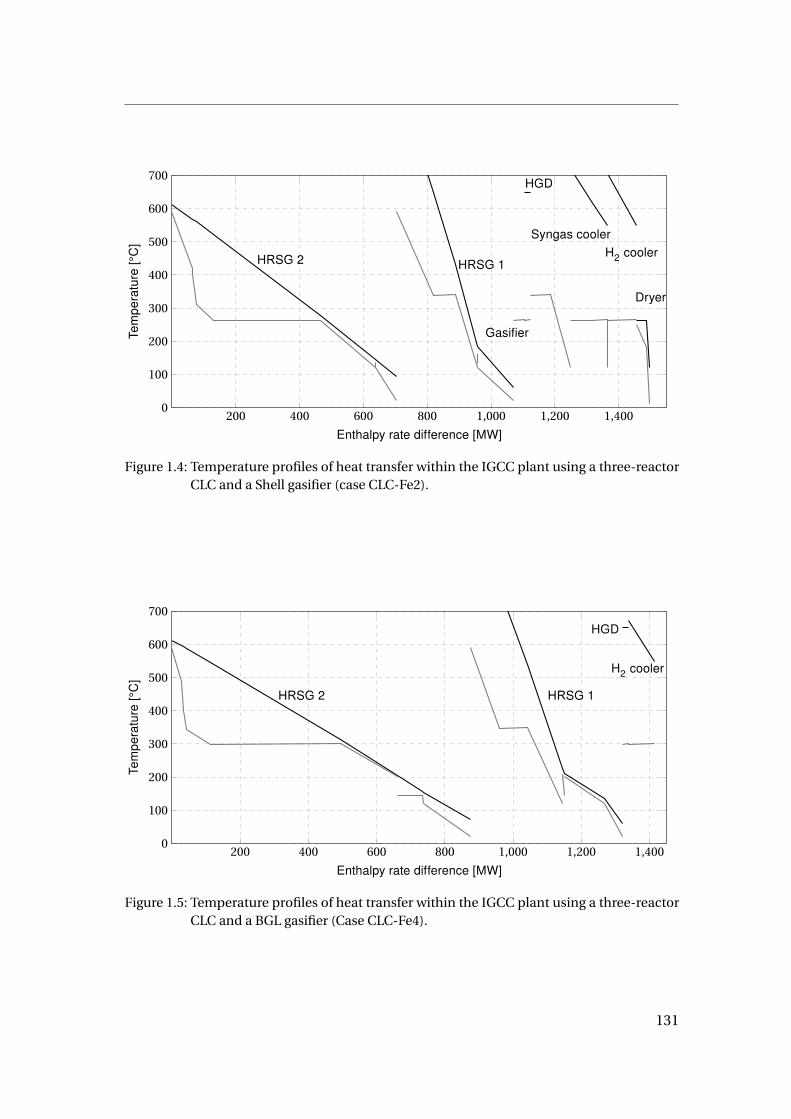
200 400 600 800 1,000 1,200 1,4000
100
200
300
400
500
600
700
HRSG 2 HRSG 1
Gasifier
HGD
Syngas cooler
H2 cooler
Dryer
Enthalpy rate difference [MW]
Tem
pera
ture
[°C
]
Figure 1.4: Temperature profiles of heat transfer within the IGCC plant using a three-reactorCLC and a Shell gasifier (case CLC-Fe2).
200 400 600 800 1,000 1,200 1,4000
100
200
300
400
500
600
700
HRSG 2 HRSG 1
HGD
H2 cooler
Enthalpy rate difference [MW]
Tem
pera
ture
[°C
]
Figure 1.5: Temperature profiles of heat transfer within the IGCC plant using a three-reactorCLC and a BGL gasifier (Case CLC-Fe4).
131
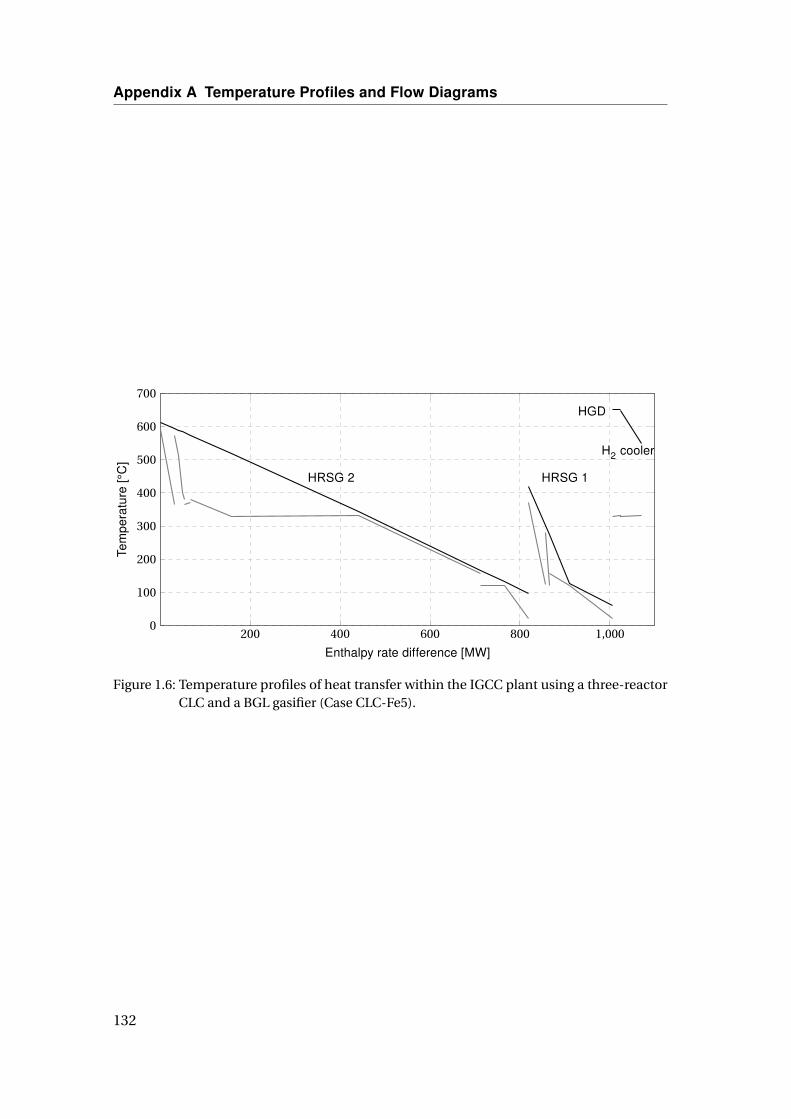
Appendix A Temperature Profiles and Flow Diagrams
200 400 600 800 1,0000
100
200
300
400
500
600
700
HRSG 2 HRSG 1
HGD
H2 cooler
Enthalpy rate difference [MW]
Tem
pera
ture
[°C
]
Figure 1.6: Temperature profiles of heat transfer within the IGCC plant using a three-reactorCLC and a BGL gasifier (Case CLC-Fe5).
132
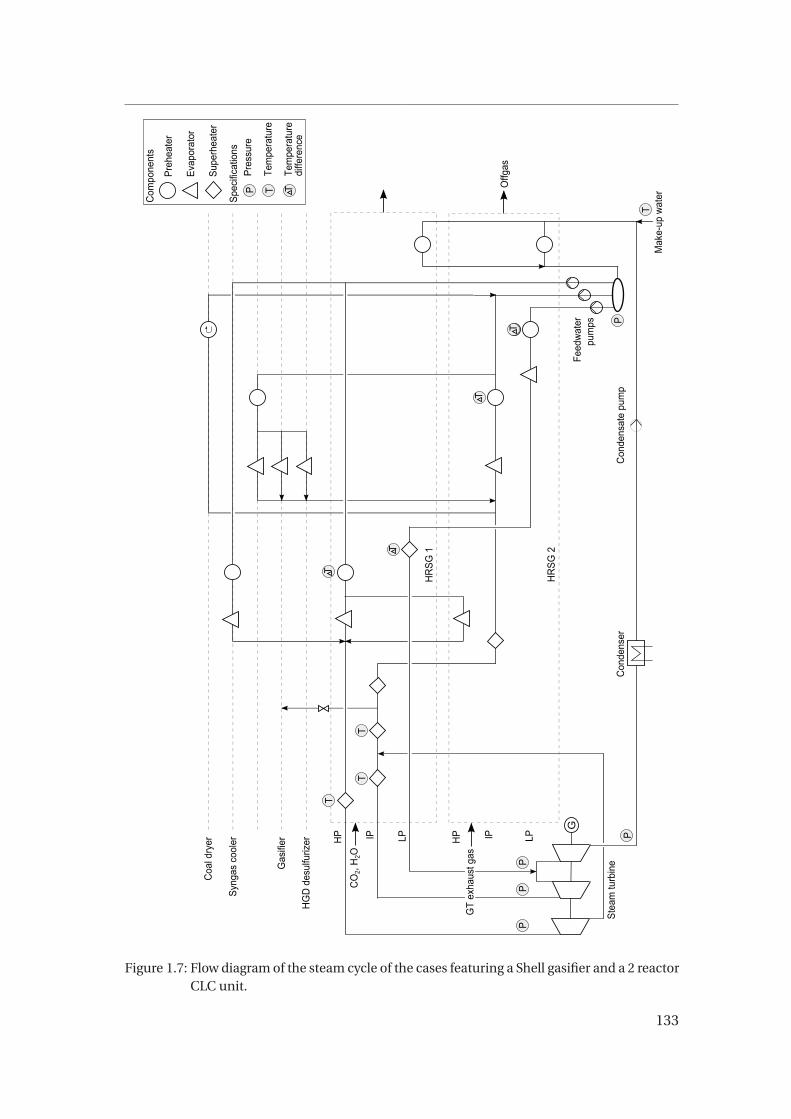
HP IP LP
Preh
eate
r
Evap
orat
or
Supe
rhea
ter
G
Syng
as c
oole
r
HG
D d
esul
furiz
er
Mak
e-up
wat
er
Coa
l dry
er
HR
SG 2
Feed
wat
er
pum
ps
Con
dens
ate
pum
pC
onde
nser
Stea
m tu
rbin
e
Offg
as
GT
exha
ust g
as PP
P
PP
P T T
Com
pone
nts
Spec
ifica
tions
Pres
sure
Tem
pera
ture
Tem
pera
ture
diffe
renc
e
T
Gas
ifier LP
T
TT
T
T
T
T
CO
2, H
2O
HR
SG 1
IP HP
Figure 1.7: Flow diagram of the steam cycle of the cases featuring a Shell gasifier and a 2 reactorCLC unit.
133
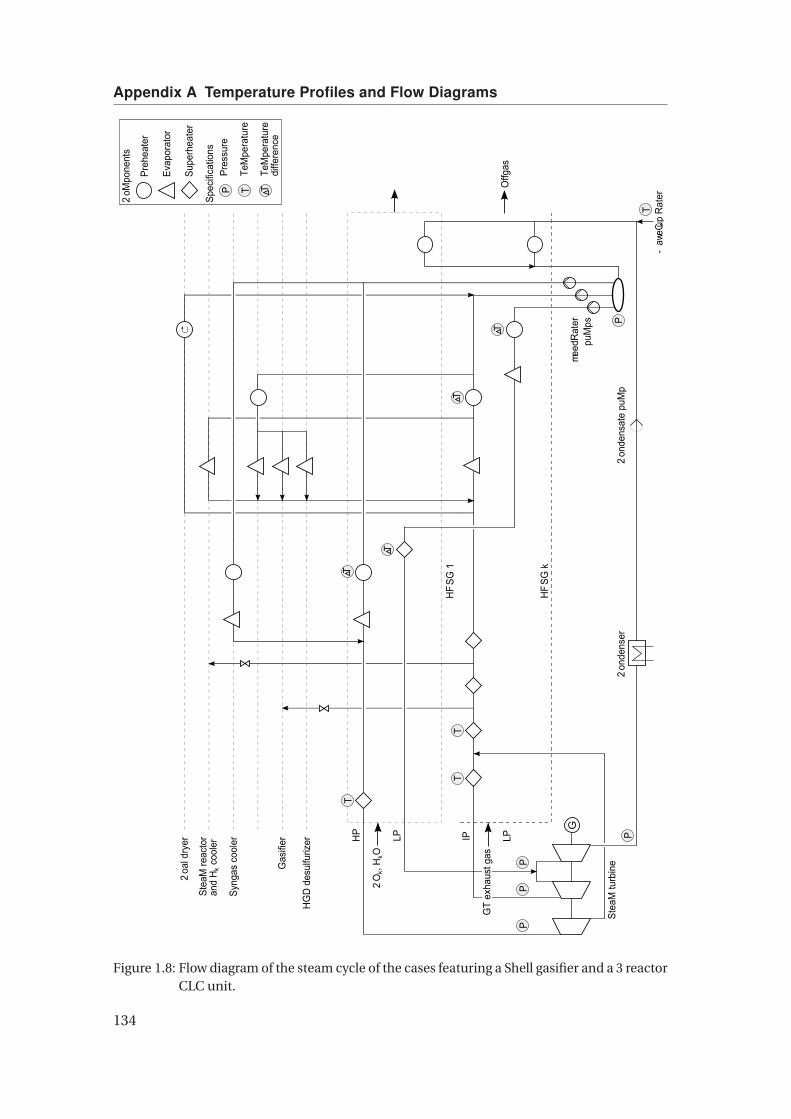
Appendix A Temperature Profiles and Flow Diagrams
HP IP LP
Preh
eate
r
Evap
orat
or
Supe
rhea
ter
G
Syng
as c
oole
r
HG
D d
esul
furiz
er
Stea
M re
acto
ran
d H
k coo
ler
-aw
eCu p
Rat
er
2oa
l dry
er
HF
SG k
meed
Rat
er
puM
ps
2on
dens
ate
puM
p2
onde
nser
Stea
M tu
rbin
e
Offg
as
GT
exha
ust g
as PP
P
PP
P T T
2oM
pone
nts
Spec
ifica
tions
Pres
sure
TeM
pera
ture
TeM
pera
ture
diffe
renc
e
T
Gas
ifier LP
T
TT
T
T
T
T
2O
k, H
kO
HF
SG 1
Figure 1.8: Flow diagram of the steam cycle of the cases featuring a Shell gasifier and a 3 reactorCLC unit.
134
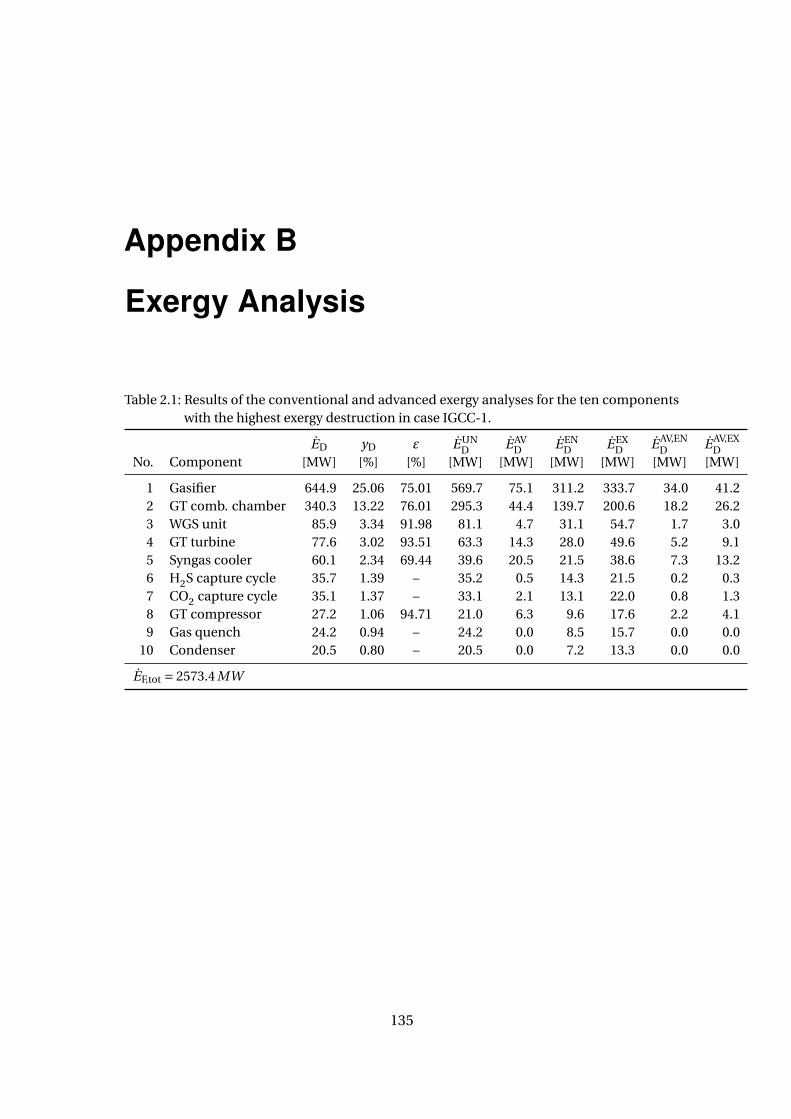
Appendix B
Exergy Analysis
Table 2.1: Results of the conventional and advanced exergy analyses for the ten componentswith the highest exergy destruction in case IGCC-1.
ED yD ε E UND E AV
D E END E EX
D E AV,END E AV,EX
DNo. Component [MW] [%] [%] [MW] [MW] [MW] [MW] [MW] [MW]
1 Gasifier 644.9 25.06 75.01 569.7 75.1 311.2 333.7 34.0 41.22 GT comb. chamber 340.3 13.22 76.01 295.3 44.4 139.7 200.6 18.2 26.23 WGS unit 85.9 3.34 91.98 81.1 4.7 31.1 54.7 1.7 3.04 GT turbine 77.6 3.02 93.51 63.3 14.3 28.0 49.6 5.2 9.15 Syngas cooler 60.1 2.34 69.44 39.6 20.5 21.5 38.6 7.3 13.26 H2S capture cycle 35.7 1.39 – 35.2 0.5 14.3 21.5 0.2 0.37 CO2 capture cycle 35.1 1.37 – 33.1 2.1 13.1 22.0 0.8 1.38 GT compressor 27.2 1.06 94.71 21.0 6.3 9.6 17.6 2.2 4.19 Gas quench 24.2 0.94 – 24.2 0.0 8.5 15.7 0.0 0.0
10 Condenser 20.5 0.80 – 20.5 0.0 7.2 13.3 0.0 0.0
EF,tot = 2573.4 MW
135
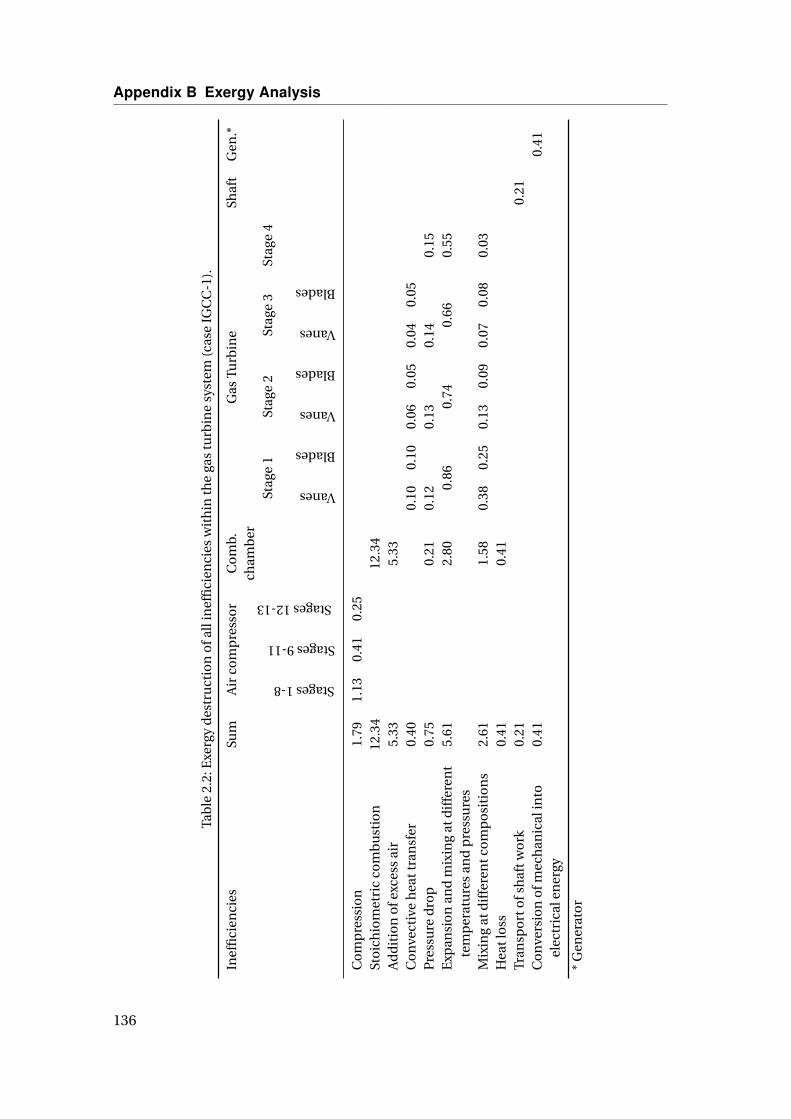
Appendix B Exergy Analysis
Tab
le2.
2:E
xerg
yd
estr
uct
ion
ofa
llin
effi
cien
cies
wit
hin
the
gas
turb
ine
syst
em(c
ase
IGC
C-1
).
Inef
fici
enci
esSu
mA
irco
mp
ress
or
Co
mb.
Gas
Turb
ine
Shaf
tG
en.*
cham
ber
Stages1-8
Stages9-11
Stages12-13
Stag
e1
Stag
e2
Stag
e3
Stag
e4
Vanes
Blades
Vanes
Blades
Vanes
Blades
Co
mp
ress
ion
1.79
1.13
0.41
0.25
Sto
ich
iom
etri
cco
mb
ust
ion
12.3
412
.34
Ad
dit
ion
ofe
xces
sai
r5.
335.
33C
on
vect
ive
hea
ttra
nsf
er0.
400.
100.
100.
060.
050.
040.
05P
ress
ure
dro
p0.
750.
210.
120.
130.
140.
15E
xpan
sio
nan
dm
ixin
gat
dif
fere
nt
5.61
2.80
0.86
0.74
0.66
0.55
tem
per
atu
res
and
pre
ssu
res
Mix
ing
atd
iffe
ren
tco
mp
osi
tio
ns
2.61
1.58
0.38
0.25
0.13
0.09
0.07
0.08
0.03
Hea
tlo
ss0.
410.
41Tr
ansp
ort
ofs
haf
two
rk0.
210.
21C
on
vers
ion
ofm
ech
anic
alin
to0.
410.
41el
ectr
ical
ener
gy
*G
ener
ato
r
136

Table 2.3: Results of the conventional exergy analyses for characteristic cases - part 1.
Component IGCC-1 CLC-Ni3 CLC-Fe1
Gasification Island 34.29 30.89 29.70O2 compressor 0.13 0.13 0.13N2 compressor 0.04 - -Coal preparation 0.66 1.00 0.77Gasifier 24.85 25.01 25.44Gas quench 0.94 0.95 0.58Syngas cooler 1 2.34 2.40 1.99Syngas cooler 2 - 0.18 -Quench gas blower 0.02 0.02 0.05Cyclone+filter 0.02 0.02 0.07Scrubber 0.20 0.19 -Hydrolizer - 0.002 -2-stage WGS unit 3.34 - -Saturator 0.43 - -Claus plant 0.08 0.06 -Recycle compressor CO2 - 0.001 0.001Exergy loss 1.25 0.94 0.68
ASU 1.32 1.34 1.38Air compressor 0.52 0.52 0.55Heat exchanger 0.16 0.17 0.16HP and LP column 0.43 0.40 0.43Air turbine 0.01 0.01 0.02O2 turbine 0.00 0.03 0.01Heater nitrogen 0.00 0.00 0.00Heater mixture 0.08 0.08 0.08Throttling 0.09 0.09 0.09Exergy loss 0.02 0.03 0.03
AGR/HGD 3.31 1.61 0.42Heat exchanger 0.001 0.005 -H2S capture cycle 1.39 0.62 -CO2 capture cycle 1.37 - -Refrigeration machine 0.20 0.33 -Exergy loss 0.36 0.65 -HGD - desulfurizer - - 0.05HGD - regenerator - - 0.34HGD - compressor - - 0.03
CO2 conditioning 7.10 6.18 5.21CO2 compressor 0.75 0.32 0.31Exergy loss CO2 6.36 5.87 4.90
CLC unit - 13.73 10.44Fuel reactor - 3.89 2.70Steam reactor - - 1.17Air reactor - 9.84 4.62Air compressor - - 1.33Steam reactor cooler - - 0.62
137
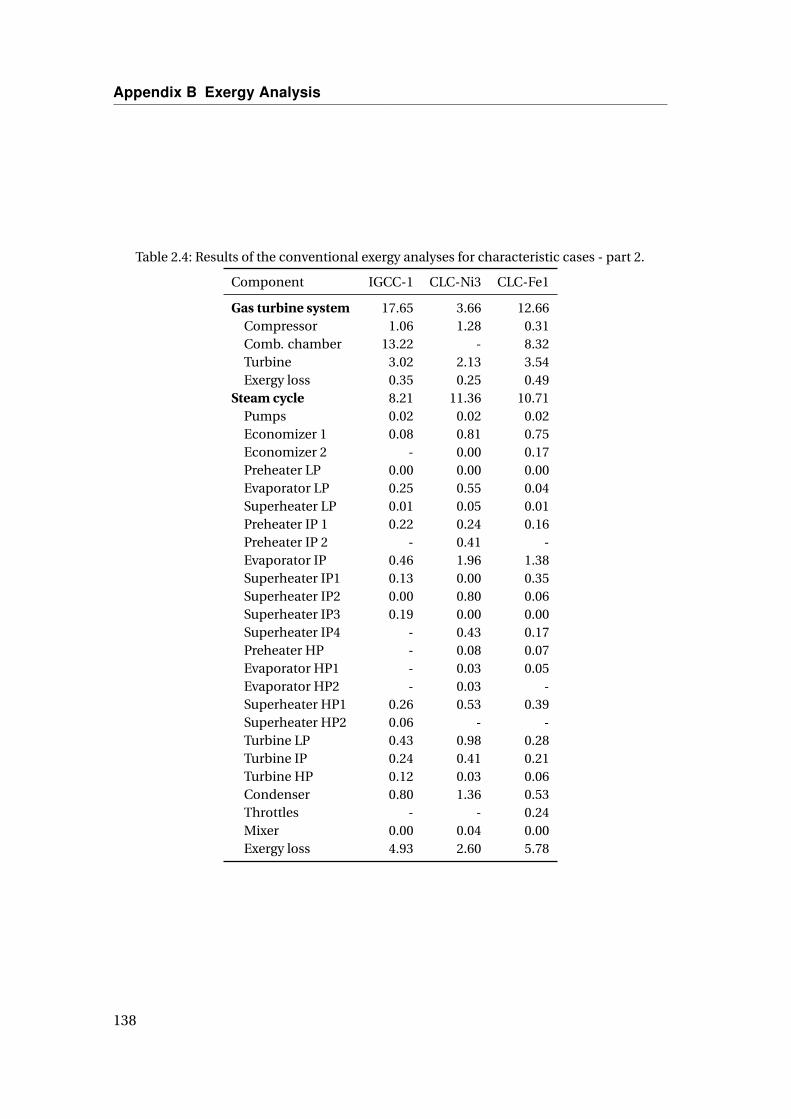
Appendix B Exergy Analysis
Table 2.4: Results of the conventional exergy analyses for characteristic cases - part 2.
Component IGCC-1 CLC-Ni3 CLC-Fe1
Gas turbine system 17.65 3.66 12.66Compressor 1.06 1.28 0.31Comb. chamber 13.22 - 8.32Turbine 3.02 2.13 3.54Exergy loss 0.35 0.25 0.49
Steam cycle 8.21 11.36 10.71Pumps 0.02 0.02 0.02Economizer 1 0.08 0.81 0.75Economizer 2 - 0.00 0.17Preheater LP 0.00 0.00 0.00Evaporator LP 0.25 0.55 0.04Superheater LP 0.01 0.05 0.01Preheater IP 1 0.22 0.24 0.16Preheater IP 2 - 0.41 -Evaporator IP 0.46 1.96 1.38Superheater IP1 0.13 0.00 0.35Superheater IP2 0.00 0.80 0.06Superheater IP3 0.19 0.00 0.00Superheater IP4 - 0.43 0.17Preheater HP - 0.08 0.07Evaporator HP1 - 0.03 0.05Evaporator HP2 - 0.03 -Superheater HP1 0.26 0.53 0.39Superheater HP2 0.06 - -Turbine LP 0.43 0.98 0.28Turbine IP 0.24 0.41 0.21Turbine HP 0.12 0.03 0.06Condenser 0.80 1.36 0.53Throttles - - 0.24Mixer 0.00 0.04 0.00Exergy loss 4.93 2.60 5.78
138

Definitions for the Exergetic Efficiency
Gasifier
EP = Esyngas,raw − E PHcoal,dryed − E PH
N2− E PH
O2− E PH
H2O +∆EIP steam (2.1)
EF = E CHcoal,dryed + E CH
N2+ E CH
O2+ E CH
H2O − Ecarbon (2.2)
GT combustion chamber
EP = E PHcombustion gas − E PH
syngas − E PHair,in (2.3)
EF =−E CHcombustion gas + E CH
syngas + E CHair,in (2.4)
WGS unit
EP = eCHH2
·(mH2,in −mH2,out
)+∆EH2O,saturator +∆EHP steam +∆EH2O,Eco (2.5)
EF =(Esyngas,raw − Eshift gas −eCH
H2·(mH2,out −mH2,in
))+ Esteam −∑ Econdensate
(2.6)
GT turbine
EP = |Wel| (2.7)
EF = Ecombustion gas +∑
E coolingair,in +∑ E sealing
air,in −∑ Eflue gas (2.8)
Syngas cooler
EP =∆EHP steam +∆EIP steam (2.9)
EF =∆Esyngas,raw (2.10)
GT compressor
EP =∑ E coolingair,out +∑ E sealing
air,out +∑ E combustion chamberair,out − Eair,in (2.11)
EF = Wel (2.12)
139
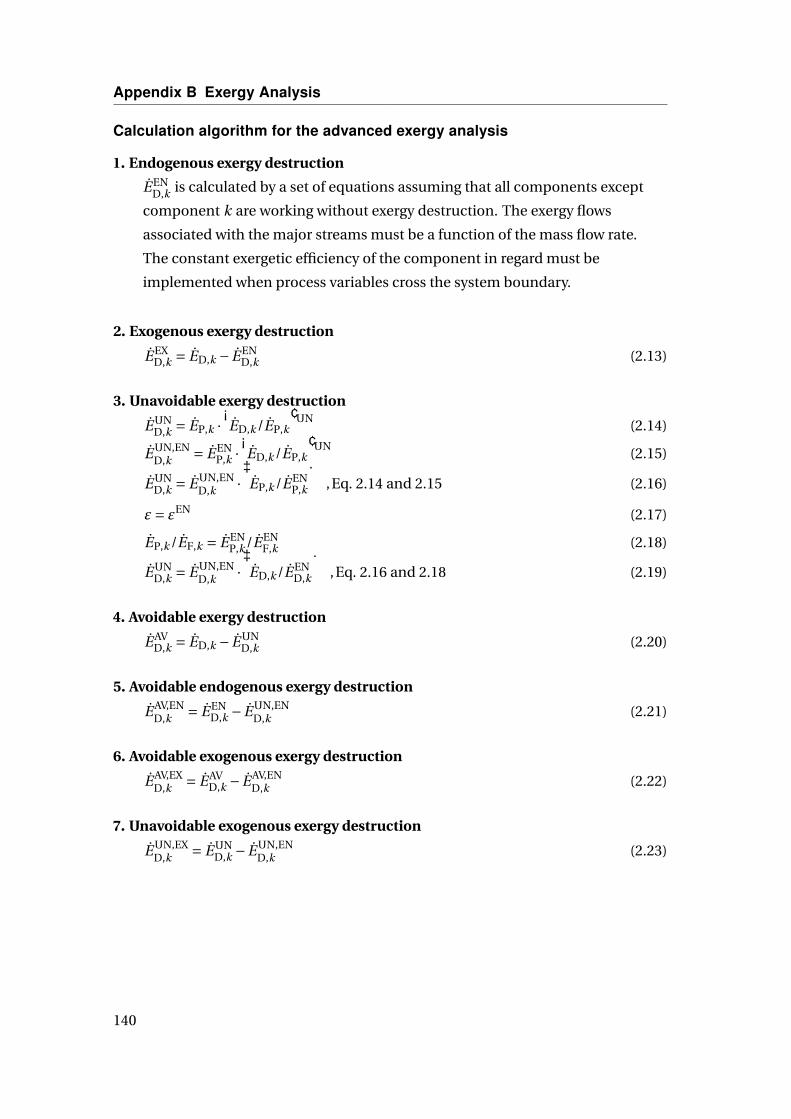
Appendix B Exergy Analysis
Calculation algorithm for the advanced exergy analysis
1. Endogenous exergy destruction
E END,k is calculated by a set of equations assuming that all components except
component k are working without exergy destruction. The exergy flows
associated with the major streams must be a function of the mass flow rate.
The constant exergetic efficiency of the component in regard must be
implemented when process variables cross the system boundary.
2. Exogenous exergy destruction
E EXD,k = ED,k − E EN
D,k (2.13)
3. Unavoidable exergy destruction
E UND,k = EP,k ·
(ED,k /EP,k
)UN(2.14)
E UN,END,k = E EN
P,k ·(ED,k /EP,k
)UN(2.15)
E UND,k = E UN,EN
D,k ·(EP,k /E EN
P,k
),Eq. 2.14 and 2.15 (2.16)
ε= εEN (2.17)
EP,k /EF,k = E ENP,k /E EN
F,k (2.18)
E UND,k = E UN,EN
D,k ·(ED,k /E EN
D,k
),Eq. 2.16 and 2.18 (2.19)
4. Avoidable exergy destruction
E AVD,k = ED,k − E UN
D,k (2.20)
5. Avoidable endogenous exergy destruction
E AV,END,k = E EN
D,k − E UN,END,k (2.21)
6. Avoidable exogenous exergy destruction
E AV,EXD,k = E AV
D,k − E AV,END,k (2.22)
7. Unavoidable exogenous exergy destruction
E UN,EXD,k = E UN
D,k − E UN,END,k (2.23)
140

Appendix C
Off-Design
Table 3.1: State variables of the steam cycle under design (case IGCC-2) and off-design condi-tions (case IGCC-H2/IGCC-H2i) - part 1.
System component Design Off-designm p T m p T
[kg/s] [bar] [°C] [kg/s] [bar] [°C]
HRSGHP superheater 1 in 69.15 170.6 352.6 - - -
out 69.15 164.0 494.2 - - -HP superheater 2 in 69.15 164.0 494.2 - - -
out 69.15 160.3 567.0 - - -IP preheater 1 in 142.20 54.1 160.2 - - -
out 142.20 54.0 160.3 - - -IP preheater 2 in 97.72 53.1 238.4 - - -
out 97.72 52.9 267.4 - - -IP evaporator in 97.72 52.9 267.4 - - -
out 97.72 50.2 264.2 - - -IP superheater in 83.73 50.2 264.2 - - -
out 83.73 49.8 292.4 - - -IP reheater in 106.90 49.8 345.7 - - -
out 106.90 46.5 551.4 - - -LP preheater in 28.57 7.2 159.4 - - -
out 28.57 7.2 166.1 - - -LP evaporator in 34.65 7.2 166.1 - - -
out 34.65 6.8 164.0 - - -LP superheater in 41.83 6.8 164.0 - - -
out 41.83 6.7 236.6 - - -Economizer in 24.91 6.3 22.0 - - -
out 24.91 6.1 159.4 - - -
141
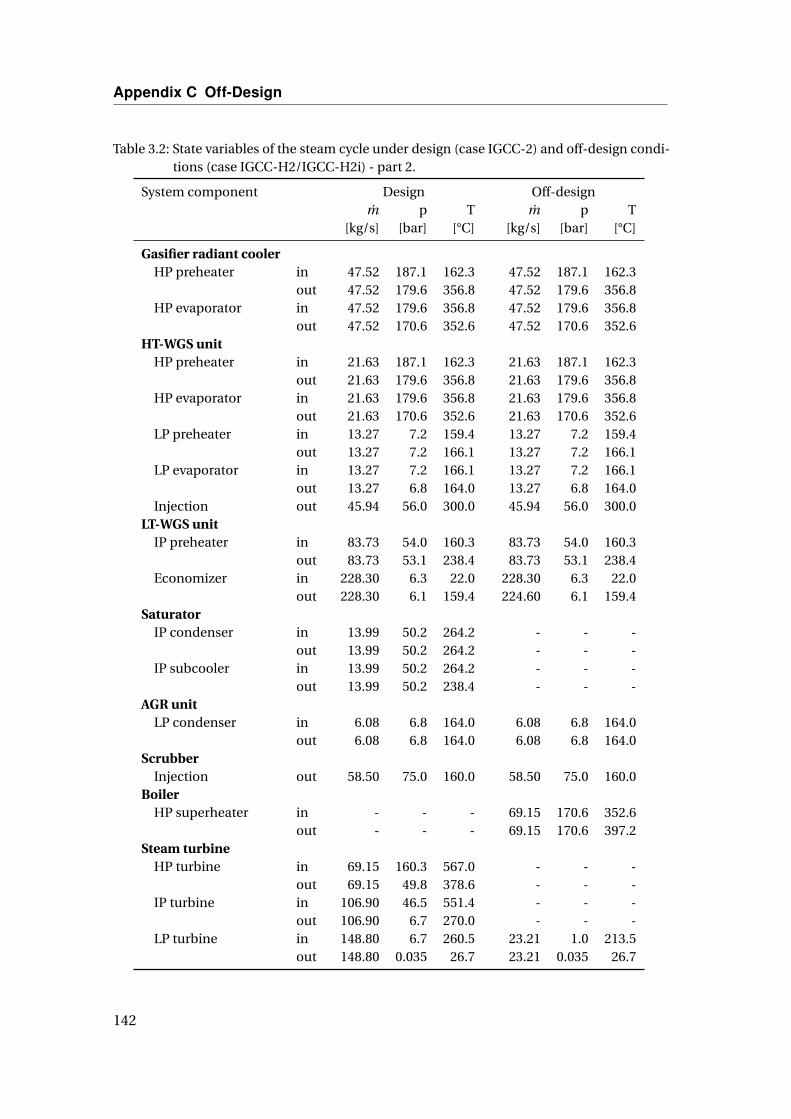
Appendix C Off-Design
Table 3.2: State variables of the steam cycle under design (case IGCC-2) and off-design condi-tions (case IGCC-H2/IGCC-H2i) - part 2.
System component Design Off-designm p T m p T
[kg/s] [bar] [°C] [kg/s] [bar] [°C]
Gasifier radiant coolerHP preheater in 47.52 187.1 162.3 47.52 187.1 162.3
out 47.52 179.6 356.8 47.52 179.6 356.8HP evaporator in 47.52 179.6 356.8 47.52 179.6 356.8
out 47.52 170.6 352.6 47.52 170.6 352.6HT-WGS unit
HP preheater in 21.63 187.1 162.3 21.63 187.1 162.3out 21.63 179.6 356.8 21.63 179.6 356.8
HP evaporator in 21.63 179.6 356.8 21.63 179.6 356.8out 21.63 170.6 352.6 21.63 170.6 352.6
LP preheater in 13.27 7.2 159.4 13.27 7.2 159.4out 13.27 7.2 166.1 13.27 7.2 166.1
LP evaporator in 13.27 7.2 166.1 13.27 7.2 166.1out 13.27 6.8 164.0 13.27 6.8 164.0
Injection out 45.94 56.0 300.0 45.94 56.0 300.0LT-WGS unit
IP preheater in 83.73 54.0 160.3 83.73 54.0 160.3out 83.73 53.1 238.4 83.73 53.1 238.4
Economizer in 228.30 6.3 22.0 228.30 6.3 22.0out 228.30 6.1 159.4 224.60 6.1 159.4
SaturatorIP condenser in 13.99 50.2 264.2 - - -
out 13.99 50.2 264.2 - - -IP subcooler in 13.99 50.2 264.2 - - -
out 13.99 50.2 238.4 - - -AGR unit
LP condenser in 6.08 6.8 164.0 6.08 6.8 164.0out 6.08 6.8 164.0 6.08 6.8 164.0
ScrubberInjection out 58.50 75.0 160.0 58.50 75.0 160.0
BoilerHP superheater in - - - 69.15 170.6 352.6
out - - - 69.15 170.6 397.2Steam turbine
HP turbine in 69.15 160.3 567.0 - - -out 69.15 49.8 378.6 - - -
IP turbine in 106.90 46.5 551.4 - - -out 106.90 6.7 270.0 - - -
LP turbine in 148.80 6.7 260.5 23.21 1.0 213.5out 148.80 0.035 26.7 23.21 0.035 26.7
142
Recommended