Analysis of 2009 Statewide Assessment Results
Vincent CaputoAssistant Superintendent
November 17, 2009

Overview of Statewide Assessments• New Jersey Assessment of Skills and
Knowledge (NJASK 3 to 8)– Language Arts, Mathematics, and Science
(Science in grades 4 and 8 only)
• High School Proficiency Assessment – (HSPA - grade 11) – LAL and Math
• End-of-Course (EOC) Biology Test• Biology Performance Assessment• End-of-Course (EOC) Algebra Test

Other Assessments
• DIBELS (Dynamic Indicators of Basic Early Literacy Skills) – primary grades
• InView section of the Terra Nova - grade 2
• NJPASS 9 and 10 – LAL and Math
• Future End-of-Course Tests to replace HSPA

New Proficiency Levels: Higher Standards for NJASK 3, 4
• Completely redesigned tests to provide better information on mastery of NJCCCS
• “Raised the bar”
• More students statewide in the “partially proficient” category
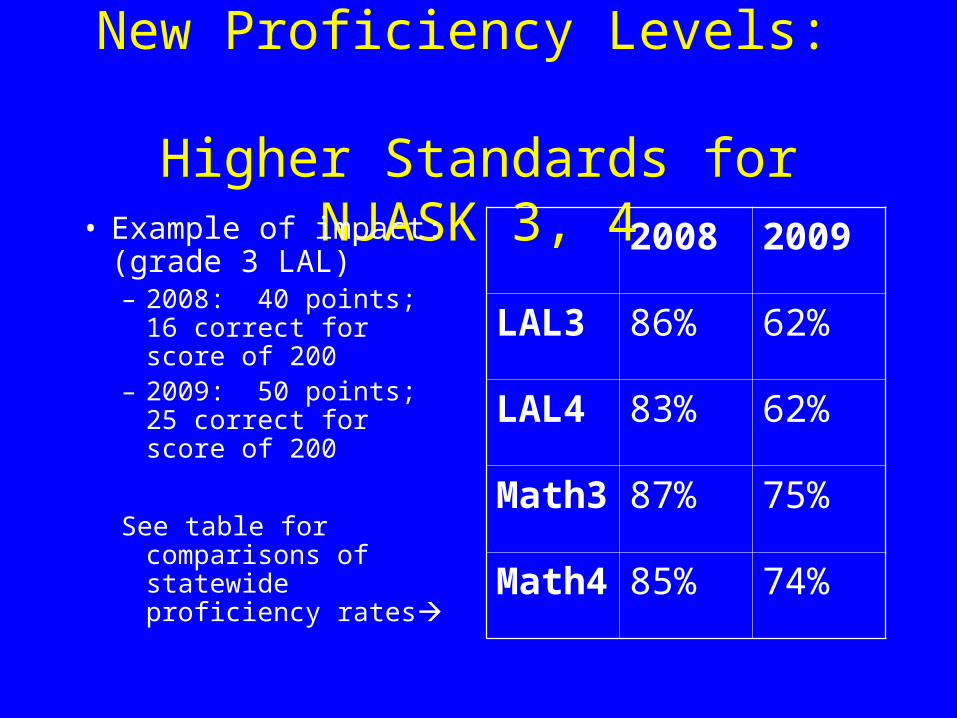
New Proficiency Levels: Higher Standards for NJASK 3, 4
• Example of impact: (grade 3 LAL)– 2008: 40 points; 16
correct for score of 200– 2009: 50 points; 25
correct for score of 200
See table for comparisons of statewide proficiency rates
2008 2009
LAL3 86% 62%
LAL4 83% 62%
Math3 87% 75%
Math4 85% 74%

NJASK 3 Language Arts Literacy
• Mean score = 210.3
• Total Proficiency = 73.2%– Advanced Proficient (Scale score 250+) = 4.2%– Proficient (Scale score 200-249)= 69.0%
Note: Percentages are rounded and may not total to 100%

NJASK 3 Mathematics
• Mean score = 227.1
• Total Proficiency = 79.2%– Advanced Proficient (Scale score 250+) =
30.4%– Proficient (Scale score 200-249)= 48.8%

NJASK 3 LAL and Math:Comparison to DFG and State
0102030405060708090
100
LAL Math
ClarkDFG-FGState

NJASK 4 Language Arts Literacy
• Mean score = 211.8
• Total Proficiency = 71.4%– Advanced Proficient (Scale score 250+) = 6.2%– Proficient (Scale score 200-249)= 65.2%

NJASK 4 Mathematics
• Mean score = 225.6
• Total Proficiency = 78.3%– Advanced Proficient (Scale score 250+) =
24.8%– Proficient (Scale score 200-249)= 53.4%

NJASK 4 Science
• Mean score = 247.9
• Total Proficiency = 98.1%– Advanced Proficient (Scale score 250+) =
55.3%– Proficient (Scale score 200-249)= 42.9%

NJASK 4 LAL, Math and Science:Comparison to DFG and State
50556065707580859095
100
LAL Math Science
ClarkDFG-FGState

NJASK 5 Language Arts Literacy
• Mean score = 212.5
• Total Proficiency = 74.7%– Advanced Proficient (Scale score 250+) = 6.9%– Proficient (Scale score 200-249)= 67.8%
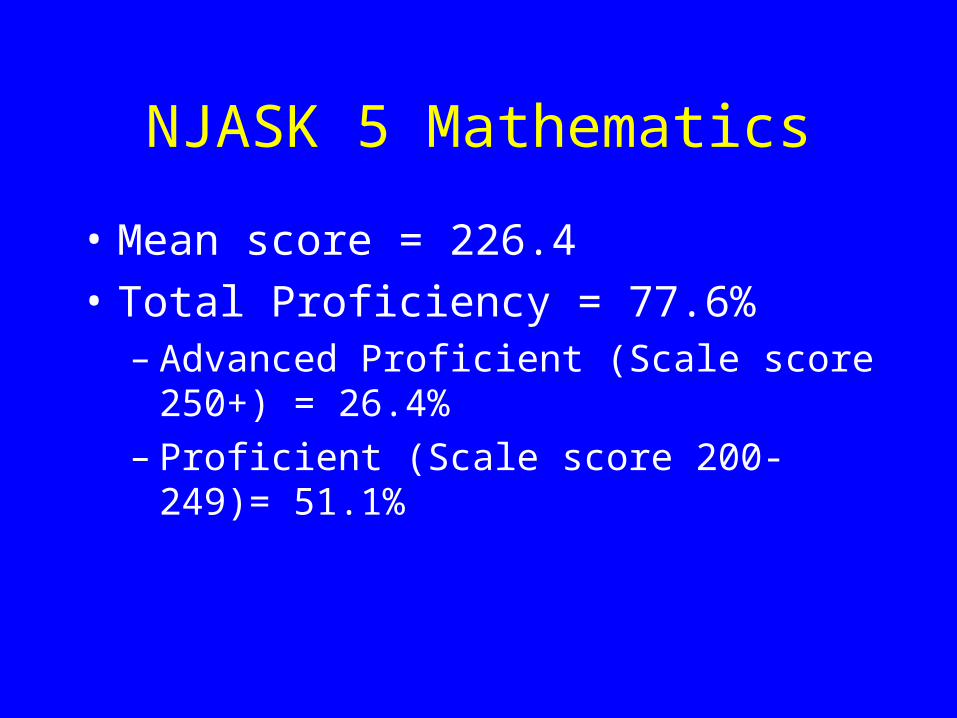
NJASK 5 Mathematics
• Mean score = 226.4
• Total Proficiency = 77.6%– Advanced Proficient (Scale score 250+) =
26.4%– Proficient (Scale score 200-249)= 51.1%

NJASK 5 LAL and Math:Comparison to DFG and State
0
10
20
30
40
50
60
70
80
90
LAL Math
ClarkDFG-FGState

NJASK 6 Language Arts Literacy
• Mean score = 222.1
• Total Proficiency = 89.0%– Advanced Proficient (Scale score 250+) =
10.4%– Proficient (Scale score 200-249)= 78.6%

NJASK 6 Mathematics
• Mean score = 227.1
• Total Proficiency = 79.9%– Advanced Proficient (Scale score 250+) =
25.3%– Proficient (Scale score 200-249)= 54.6%

NJASK 6 LAL and Math:Comparison to DFG and State
25
35
45
55
65
75
85
95
LAL Math
ClarkDFG-FGState

NJASK 7 Language Arts Literacy
• Mean score = 227.2
• Total Proficiency = 88.1%– Advanced Proficient (Scale score 250+) =
24.3%– Proficient (Scale score 200-249)= 63.8%

NJASK 7 Mathematics
• Mean score = 221.9
• Total Proficiency = 74.6%– Advanced Proficient (Scale score 250+) =
28.2%– Proficient (Scale score 200-249)= 46.3%

NJASK 7 LAL and Math:Comparison to DFG and State
50
55
60
65
70
75
80
85
90
LAL Math
ClarkDFG-FGState

NJASK 8 Language Arts Literacy
• Mean score = 231.0
• Total Proficiency = 97.0%– Advanced Proficient (Scale score 250+) =
14.9%– Proficient (Scale score 200-249)= 82.1%

NJASK 8 Mathematics
• Mean score = 229.7
• Total Proficiency = 86.5%– Advanced Proficient (Scale score 250+) =
32.5%– Proficient (Scale score 200-249)= 54%

NJASK 8 Science
• Mean score = 245.5
• Total Proficiency = 96.5%– Advanced Proficient (Scale score 250+) =
42.3%– Proficient (Scale score 200-249)= 54.2%

NJASK 8 LAL, Math, Science:Comparison to DFG and State
50556065707580859095
100
LAL Math Science
ClarkDFG-FGState
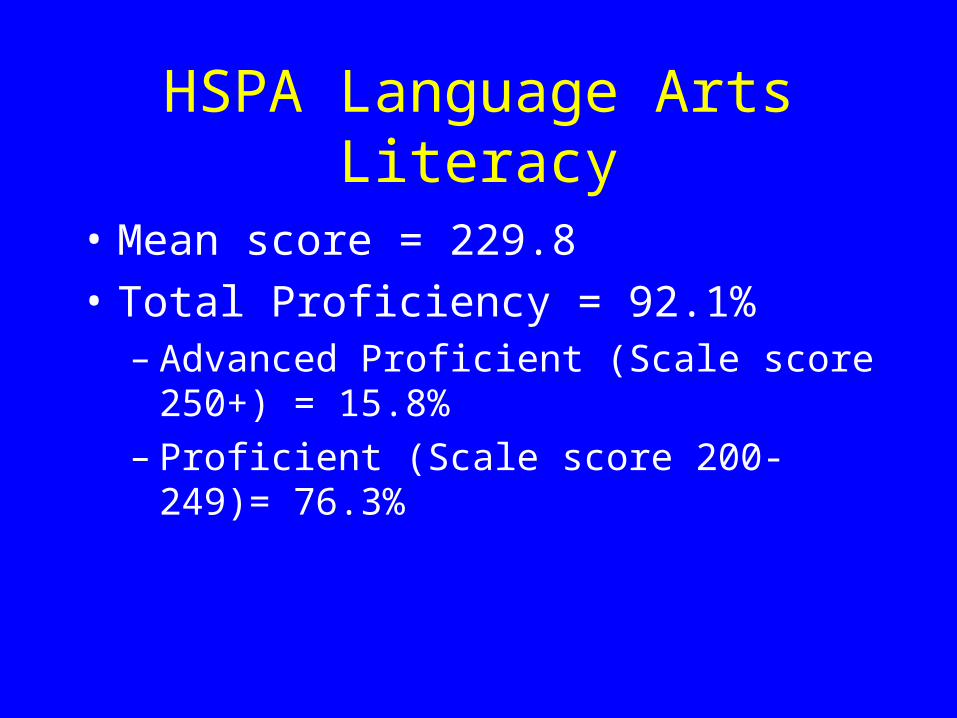
HSPA Language Arts Literacy
• Mean score = 229.8
• Total Proficiency = 92.1%– Advanced Proficient (Scale score 250+) =
15.8%– Proficient (Scale score 200-249)= 76.3%

HSPA Mathematics
• Mean score = 224.4
• Total Proficiency = 81.4%– Advanced Proficient (Scale score 250+) =
17.7%– Proficient (Scale score 200-249)= 63.7%

HSPA LAL and Math:Comparison to DFG and State
50
55
60
65
70
75
80
85
90
95
LAL Math
ClarkDFG-FGState

EOC Biology (raw scores):Comparison to DFG and State
29.5
30
30.5
31
31.5
32
32.5
33
EOC Biology
ClarkDFG-FGState

What are we doing to ensure student success?
• Differentiated instruction: “one size does not fit all”
• Standards-based curriculum planning
• Flexible scheduling with basic skills
• Better use of data to inform instruction
• Focused professional development for teachers and administrators

Summary:Comparison to previous performance
Areas of improvementNJASK 5,6,7,8 LAL: mean scores
NJASK 5,6,7 LAL: %Adv Prof
NJASK 4 Sci: mean and %AdvProf
NJASK 5,6,7 Math: %AdvProf
NJASK 8 Math: mean and %AdvPr
NJASK 8 Science: mean
HSPA LAL: mean
Areas of concernNJASK 3 Math
NJASK 5 Math
NJASK 4 LAL
NJASK 7 Math
HSPA Math

Summary:Comparison to DFG-FG
Above DFG-FG averages•NJASK 3 LAL
•NJASK 4 LAL
•NJASK 4 Math
•NJASK 4 Science
•NJASK 5 LAL
•NJASK 6 LAL
•NJASK 6 Math
•NJASK 7 LAL
•NJASK 7 Math
•NJASK 8 LAL
•NJASK 8 Math
•NJASK 8 Science
•HSPA LAL
•HSPA Math
•EOC Biology
Below DFG-FG averages•NJASK 3 Math
•NJASK 5 Math

Summary:Comparison to statewide results
Above statewide average
Clark was above the state average for every
assessment
Below statewide average
None

Thanks!
• Renae LaPrete, Interim Superintendent
• District Administrators
• Teachers
• Education Services Personnel
• Parents
Recommended